
Abstract
This study compared the effects of an official rugby match and a fatigue test on the salivary cortisol responses of 13 rugby players. We also examined the relationship between this cortisol response and session ratings of perceived exertion (session-RPE). We collected saliva before and after the match and fatigue test and assessed physical effort intensity via session-RPE using a CR-10 scale. We measured cortisol concentration by enzyme-linked immunosorbent assays. Results were greater session-RPE and cortisol concentrations for the rugby match, compared with the fatigue test. There was a significant difference between cortisol concentrations obtained pre- and postmatch (p < .022) and significant correlations between cortisol response and session-RPE sampling in both the rugby match (r = .81; p < .001) and fatigue test (r = .91; p < .001). This study provides evidence of greater perceived effort and higher cortisol concentrations in actual competition versus a fatigue test. Our data further support session-RPE as a relatively inexpensive close correlate of a stress biomarker (cortisol response). Thus, session-RPE can be used by coaches as a valid indication of training loads and adequate recovery time after exertion.
Keywords
Introduction
The impact of exercise- and sports-related stress on hormonal responses has been extensively studied by salivary biomarkers (Moreira et al., 2013; Papacosta & Nassis, 2011). Many salivary compounds can be derived from plasma by passive diffusion or active transport, making salivary assessment increasingly important in the fields of endocrinology, immunology, physiology, psychology, and sports medicine (Chiappin, Antonelli, Gatti, & De Palo, 2007; Chicharro, Lucía, Pérez, Vaquero, & Ureña, 1998; Humphrey & Williamson, 2001).
Saliva sampling has such distinct advantages over blood sampling as a lower risk of contamination and an easy, self-conducted, noninvasive collection procedure (Bonne & Wong, 2012; Caetano Júnior, Strixino, & Raniero, 2015). In addition, since salivary composition during exercise is influenced by the autonomic nervous system and the hypothalamic–pituitary–adrenal axis, and cortisol concentrations reflect plasma-free cortisol levels that are not altered by variations in flow rate (Stupnicki & Obminski, 1992; Vining McGinley, Maksujtis, & Ho, 1983), salivary cortisol concentrations are a good indication of the adrenocortical response to exercise.
During training programs, athletes are submitted to a wide range of stressors (physiological and psychological), and cortisol levels change with different forms of exercise. The daily training load has been considered the main physiological stress source, but official competitions emerge as potent psychological stressors as well, because competition is associated with novelty, ego involvement, anxiety, lack of control, and unpredictability (Buchanan, al’Absi, & Lovallo, 1999; Moreira et al., 2013; Rushall, 1990).
Physiological stress experienced by athletes has been investigated more often in individual sports than in team sports. Some studies showed that immediate postgame cortisol concentrations had significantly increased (Cunniffe et al., 2010; Elloumi, Maso, Michaux, Robert & Lac, 2013; Lindsay, Lewis, Scarrott, Draper & Gieseg, 2015). However, there is a particular lack of information about the physiological stress experience of rugby players in both the actual match environment and during training sessions. Yet, this knowledge is important for planning training and recovery time between successive games.
Despite the need for studies showing the salivary cortisol response in different types of physical effort, these laboratory tests are relatively expensive and laborious, making these data impossible for teams with limited financial support to access (Caetano Júnior, Lemes, Carvalho Aguiar, Strixino, & Raniero, 2016). Thus, many researchers have proposed an alternative, simpler method of assessing exercise intensity through subjective session ratings of perceived exertion (session-RPE; Foster, 1998; Foster et al., 2001). To the best of our knowledge, no studies have compared salivary cortisol responses and session-RPE from rugby players after fatigue test and official matches. Thus, this study aimed to assess the effects of an official rugby match and fatigue test on the salivary cortisol response and physical effort intensity measured by session-RPE in rugby players. In addition, we sought to examine the relationship between cortisol response and session-RPE to determine whether session-RPE might be a valid measurement tool for stress-related exercise intensity in these different types of physical effort.
Method
Participants
Thirteen rugby players participated voluntarily in this study (age: 19 ± 1 years; height: 174 ± 6 cm; body mass: 77.2 ± 12.2 kg). The rugby players trained twice a day (90–120 minutes per session), during five days per week (depending on the number of matches per week). All participants were informed of the benefits and risks of the study and provided written informed consent before participation. The study was approved by the Ethics Research Committee of the University of Vale of Paraiba, Brazil.
Procedure
The rugby players were evaluated over two weeks, during the competitive rugby season. All participants were instructed to maintain their normal dietary intake during the two weeks of testing. The rugby match studied in this experiment was composed of two 40 minute playing periods, separated by 10 minutes. The match was preceded by a 30 minute warm-up of stretching, running, and rugby drills. Players were encouraged to drink water ad libitum during break periods to maintain hydration levels. All players provided saliva samples 30 minutes before (∼14:30 h) and after (∼16:30 h) the official rugby match.
Three days after the match, the same players submitted to a fatigue test, performed on a treadmill (Movement LX 150). The players performed a warm-up for five minutes at a speed of seven km/h. The test protocol was performed as follows: the players were required to run at nine km/h for five minutes, followed by one km/h speed increments every two minutes until they achieved fatigue (Quammen et al., 2012), when they were instructed to signal with their arm at which point the speed was slowed to a walk. The saliva samples were collected pre (7:00 hours) and post-fatigue (∼7:30 hours) test.
Session Rating of Perceived Exertion
The physical effort intensity was assessed by session-RPE using a CR-10 scale as previously described by Foster (1998). This method is used as an indicator of exercise intensity for monitoring training and competition load. The data were collected 30 min after fatigue test and rugby match, when players answered a simple question—“How was your workout?.” For this, a chart was shown that outlined the full session-RPE (CR-10 scale) with the appropriate explanations.
Saliva Collection
The subjects provided saliva samples at 7:00 hours pre- and postfatigue test. The saliva collection was performed 30 minutes before the match warm-up (∼14:30 hours) and after match, where samples were collected within 10 minutes of the completion of the match (∼16:30 h). All subjects were informed in advance to abstain from food and caffeine products for at least two hours prior to the saliva collection. In addition, the players were instructed to rinse out their mouths with distilled water and remain seated with eyes open, head tilted slightly forward, and avoid orofacial movements (Chiappin et al., 2007; Moreira et al., 2013). Unstimulated saliva samples were collected in sterilized tubes (two ml) and immediately frozen and stored at −80℃ until assayed for cortisol concentration. The salivary cortisol concentrations were measured one week after the last collection of saliva.
Assays
The cortisol concentration was measured in duplicate using enzyme-linked immunosorbent assays (ELISA; Cortisol saliva; DIAsource ImmunoAssays SA, Louvain-Ia-Neuve, Belgium). Saliva samples were thawed and centrifuged at 1,630 grams for 20 minutes. After this process, 50 µl of each calibrator, control, and supernatant saliva samples were added to labeled wells (Rabbit anti-cortisol antibody coated microwell plate-break apart wells). The conjugate working solution (100 µl) was pipetted into each well and incubated for 45 minutes in a plate shaker (∼200 rpm), at room temperature (25℃). The plate was washed three times with 300 µl of diluted wash buffer per well. Then, 150 µl of tetramethylbenzidine substrate solution was added and again incubated on the plate shaker for 20 minutes, at room temperature (25℃). Finally, 50 µl of stooping solution was pipetted in each well, where a yellow color was obtained. The absorbance was read using a multimode microplate reader at 450 nm (Synergy HT, BioTek® Instruments, Inc. USA), within 20 minutes after the addition of the stopping solution. The cortisol concentration (ng/ml) of each sample was done from a calibration curve (absorbance vs. cortisol concentration of the calibrators).
Statistical Analyses
Data are reported as means and standard deviation (SD). Data distribution was assessed using the Kolmogorov–Smirnov test for normal distributions. A one-way analysis of variance with a post hoc test (Tukey) was used to compare the salivary cortisol concentrations and session-RPE. The level of significance was set at p < .05. The relationships between the cortisol concentrations and session-RPE were analyzed using Pearson's correlation coefficient.
Results
The mean scores obtained on session-RPE were 8.0 ± 1.8 and 7.6 ± 1.7 for the rugby match and fatigue test, respectively (Figure 1(a)). Statistical analyses showed no significant difference for session-RPE results in rugby match and fatigue test, F(1,46) = 0.315, p = .579. The perceived intensities of the rugby match for the sample (n = 13) was hard (three players), very hard (six players), and maximal (four players). The session-RPE’s of the same players regarding fatigue test intensity were hard (four players), very hard (eight players), and maximal (one player; Figure 1(b)). The achieved maximum time (minutes) at point of fatigue on the fatigue test was 14.7 ± 2.5 (mean ± SD).
Session-RPE (mean ± SD) recorded after official rugby match and fatigue test (a). Session-RPE recorded after official rugby match and fatigue test per player (b).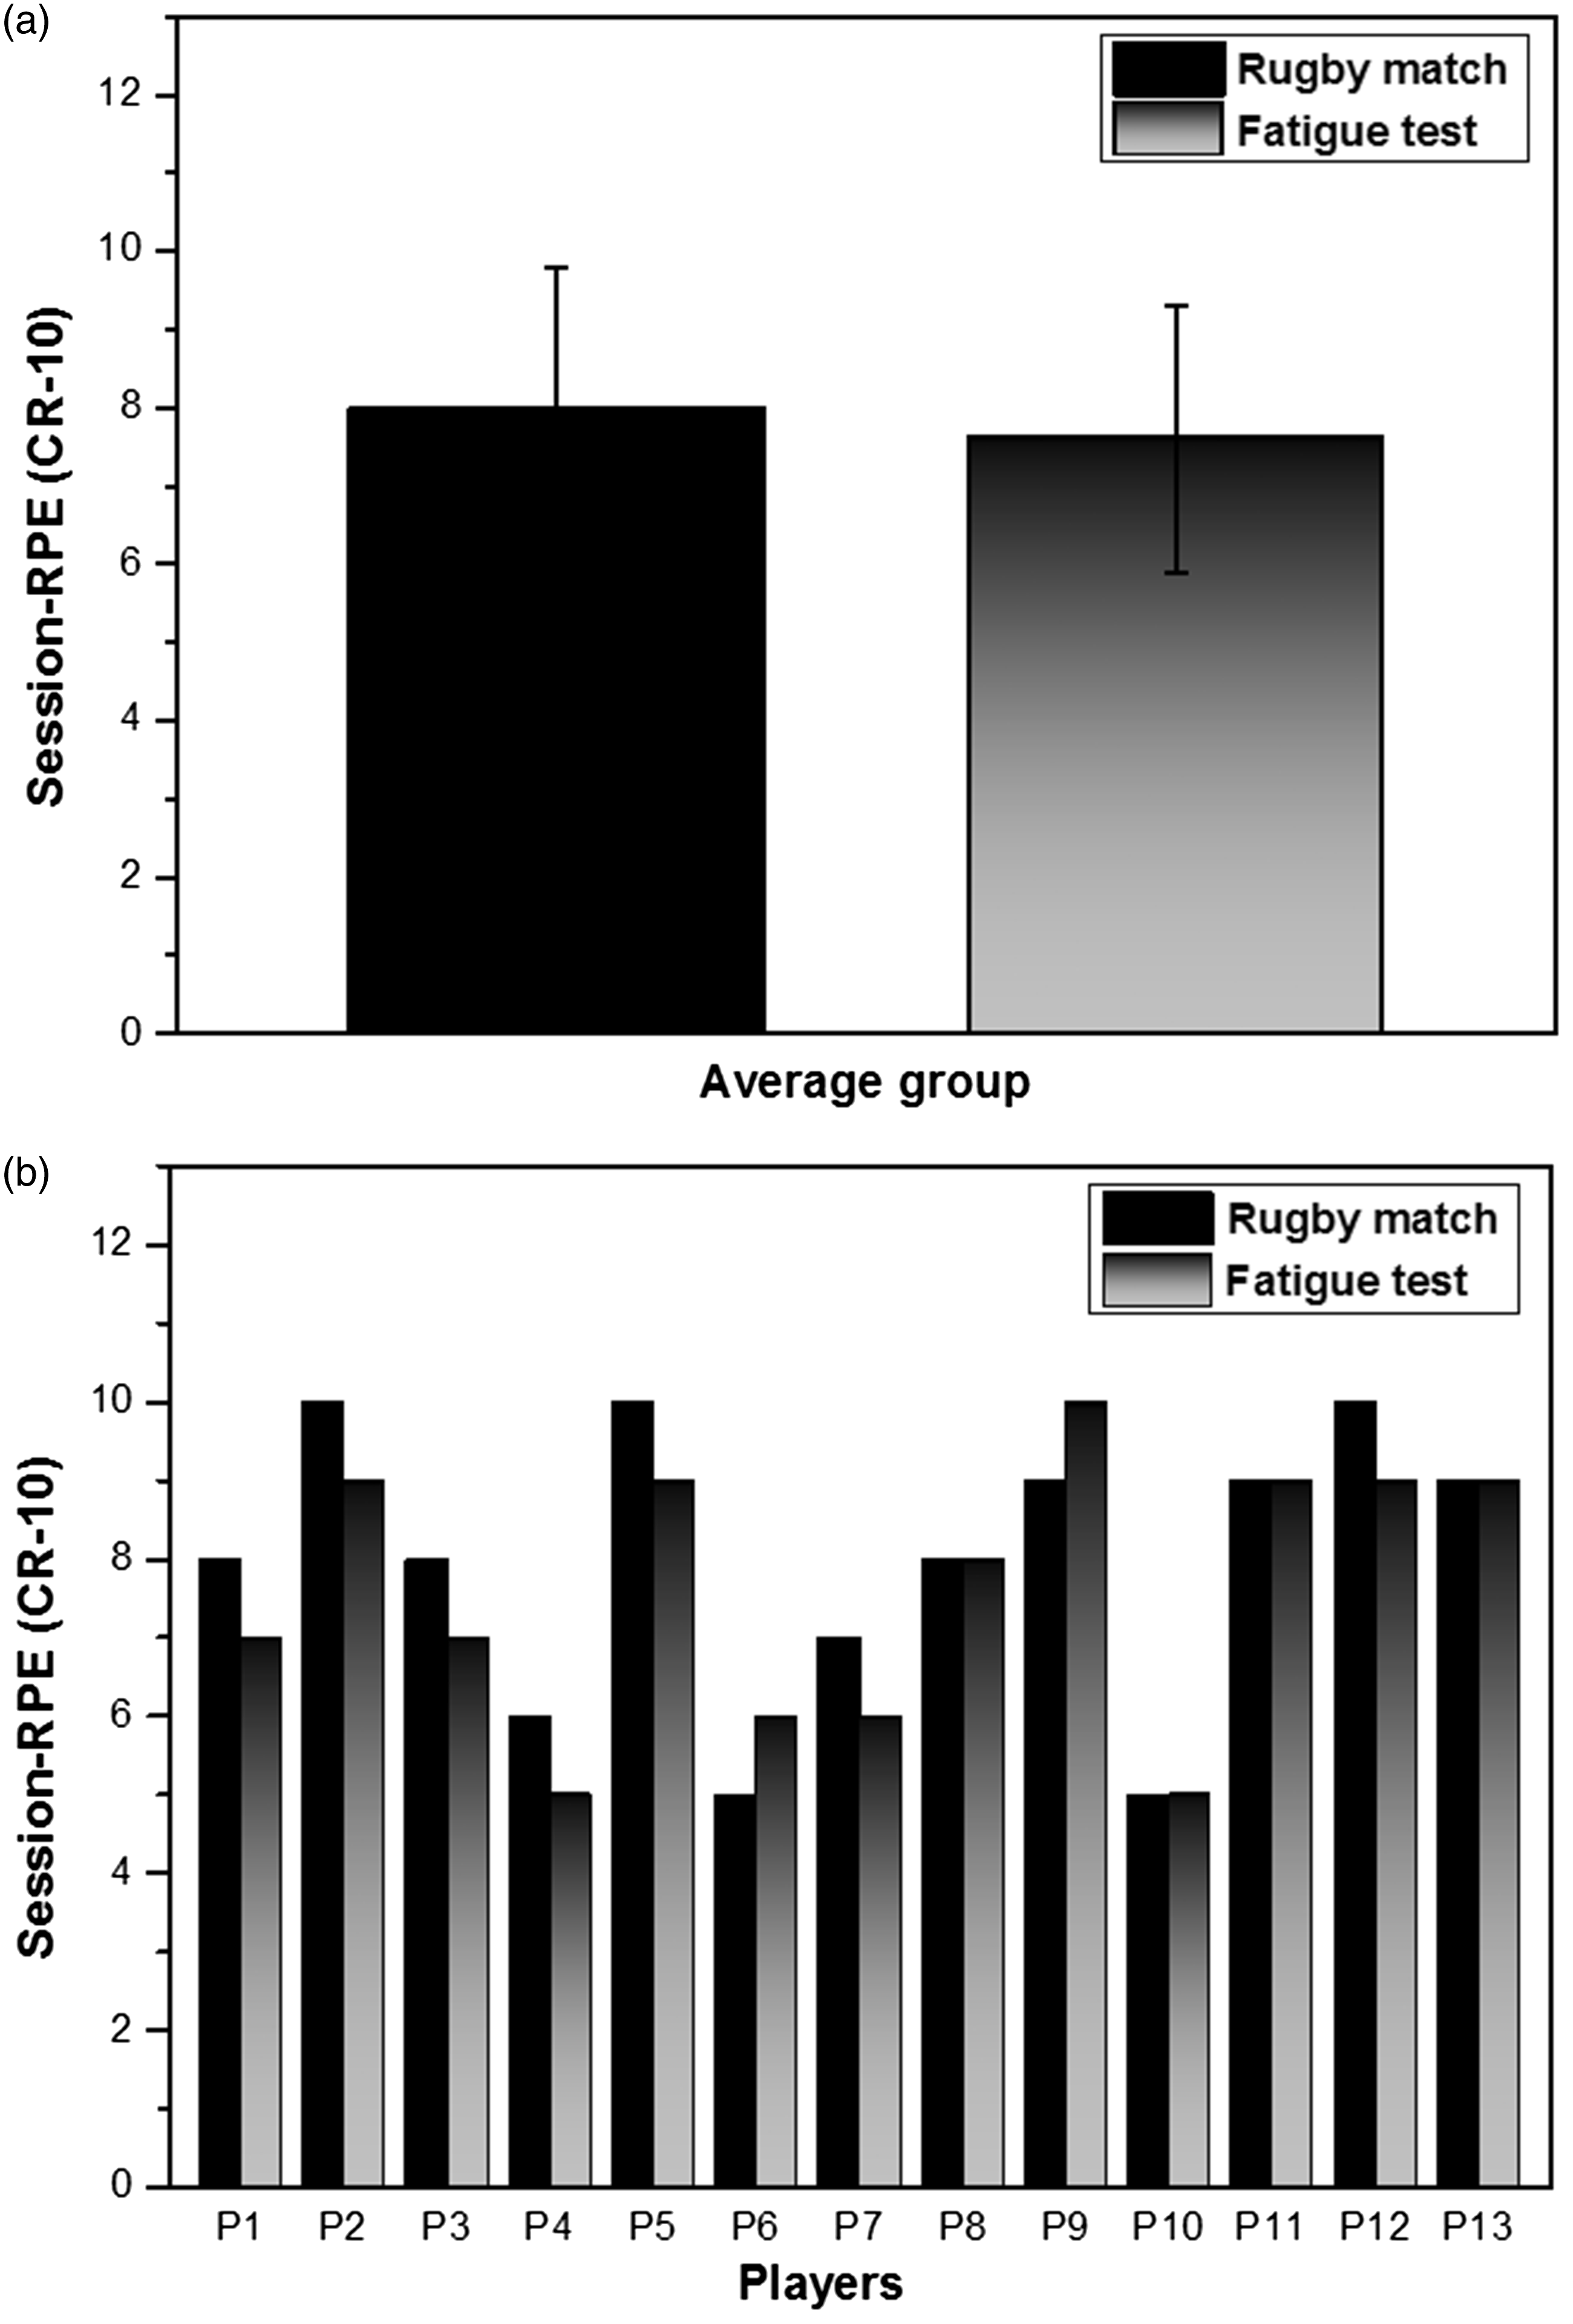
Statistical analysis showed significant differences between salivary cortisol concentrations obtained before (26.0 ± 13.1) and after (41.5 ± 18.7) rugby match, F(1,46) = 5.913, p < .022, while for cortisol concentrations obtained pre- (31.2 ± 16.9) and postfatigue test (39.3 ± 18.3), no significant differences, F(1,46) = 2.614, p = .118, were found (Figure 2).
Salivary cortisol concentrations (Mean ± SD) for rugby players in official rugby match and fatigue test (n = 13). *Significant difference between cortisol concentration collected pre- and postmatch (p < .05).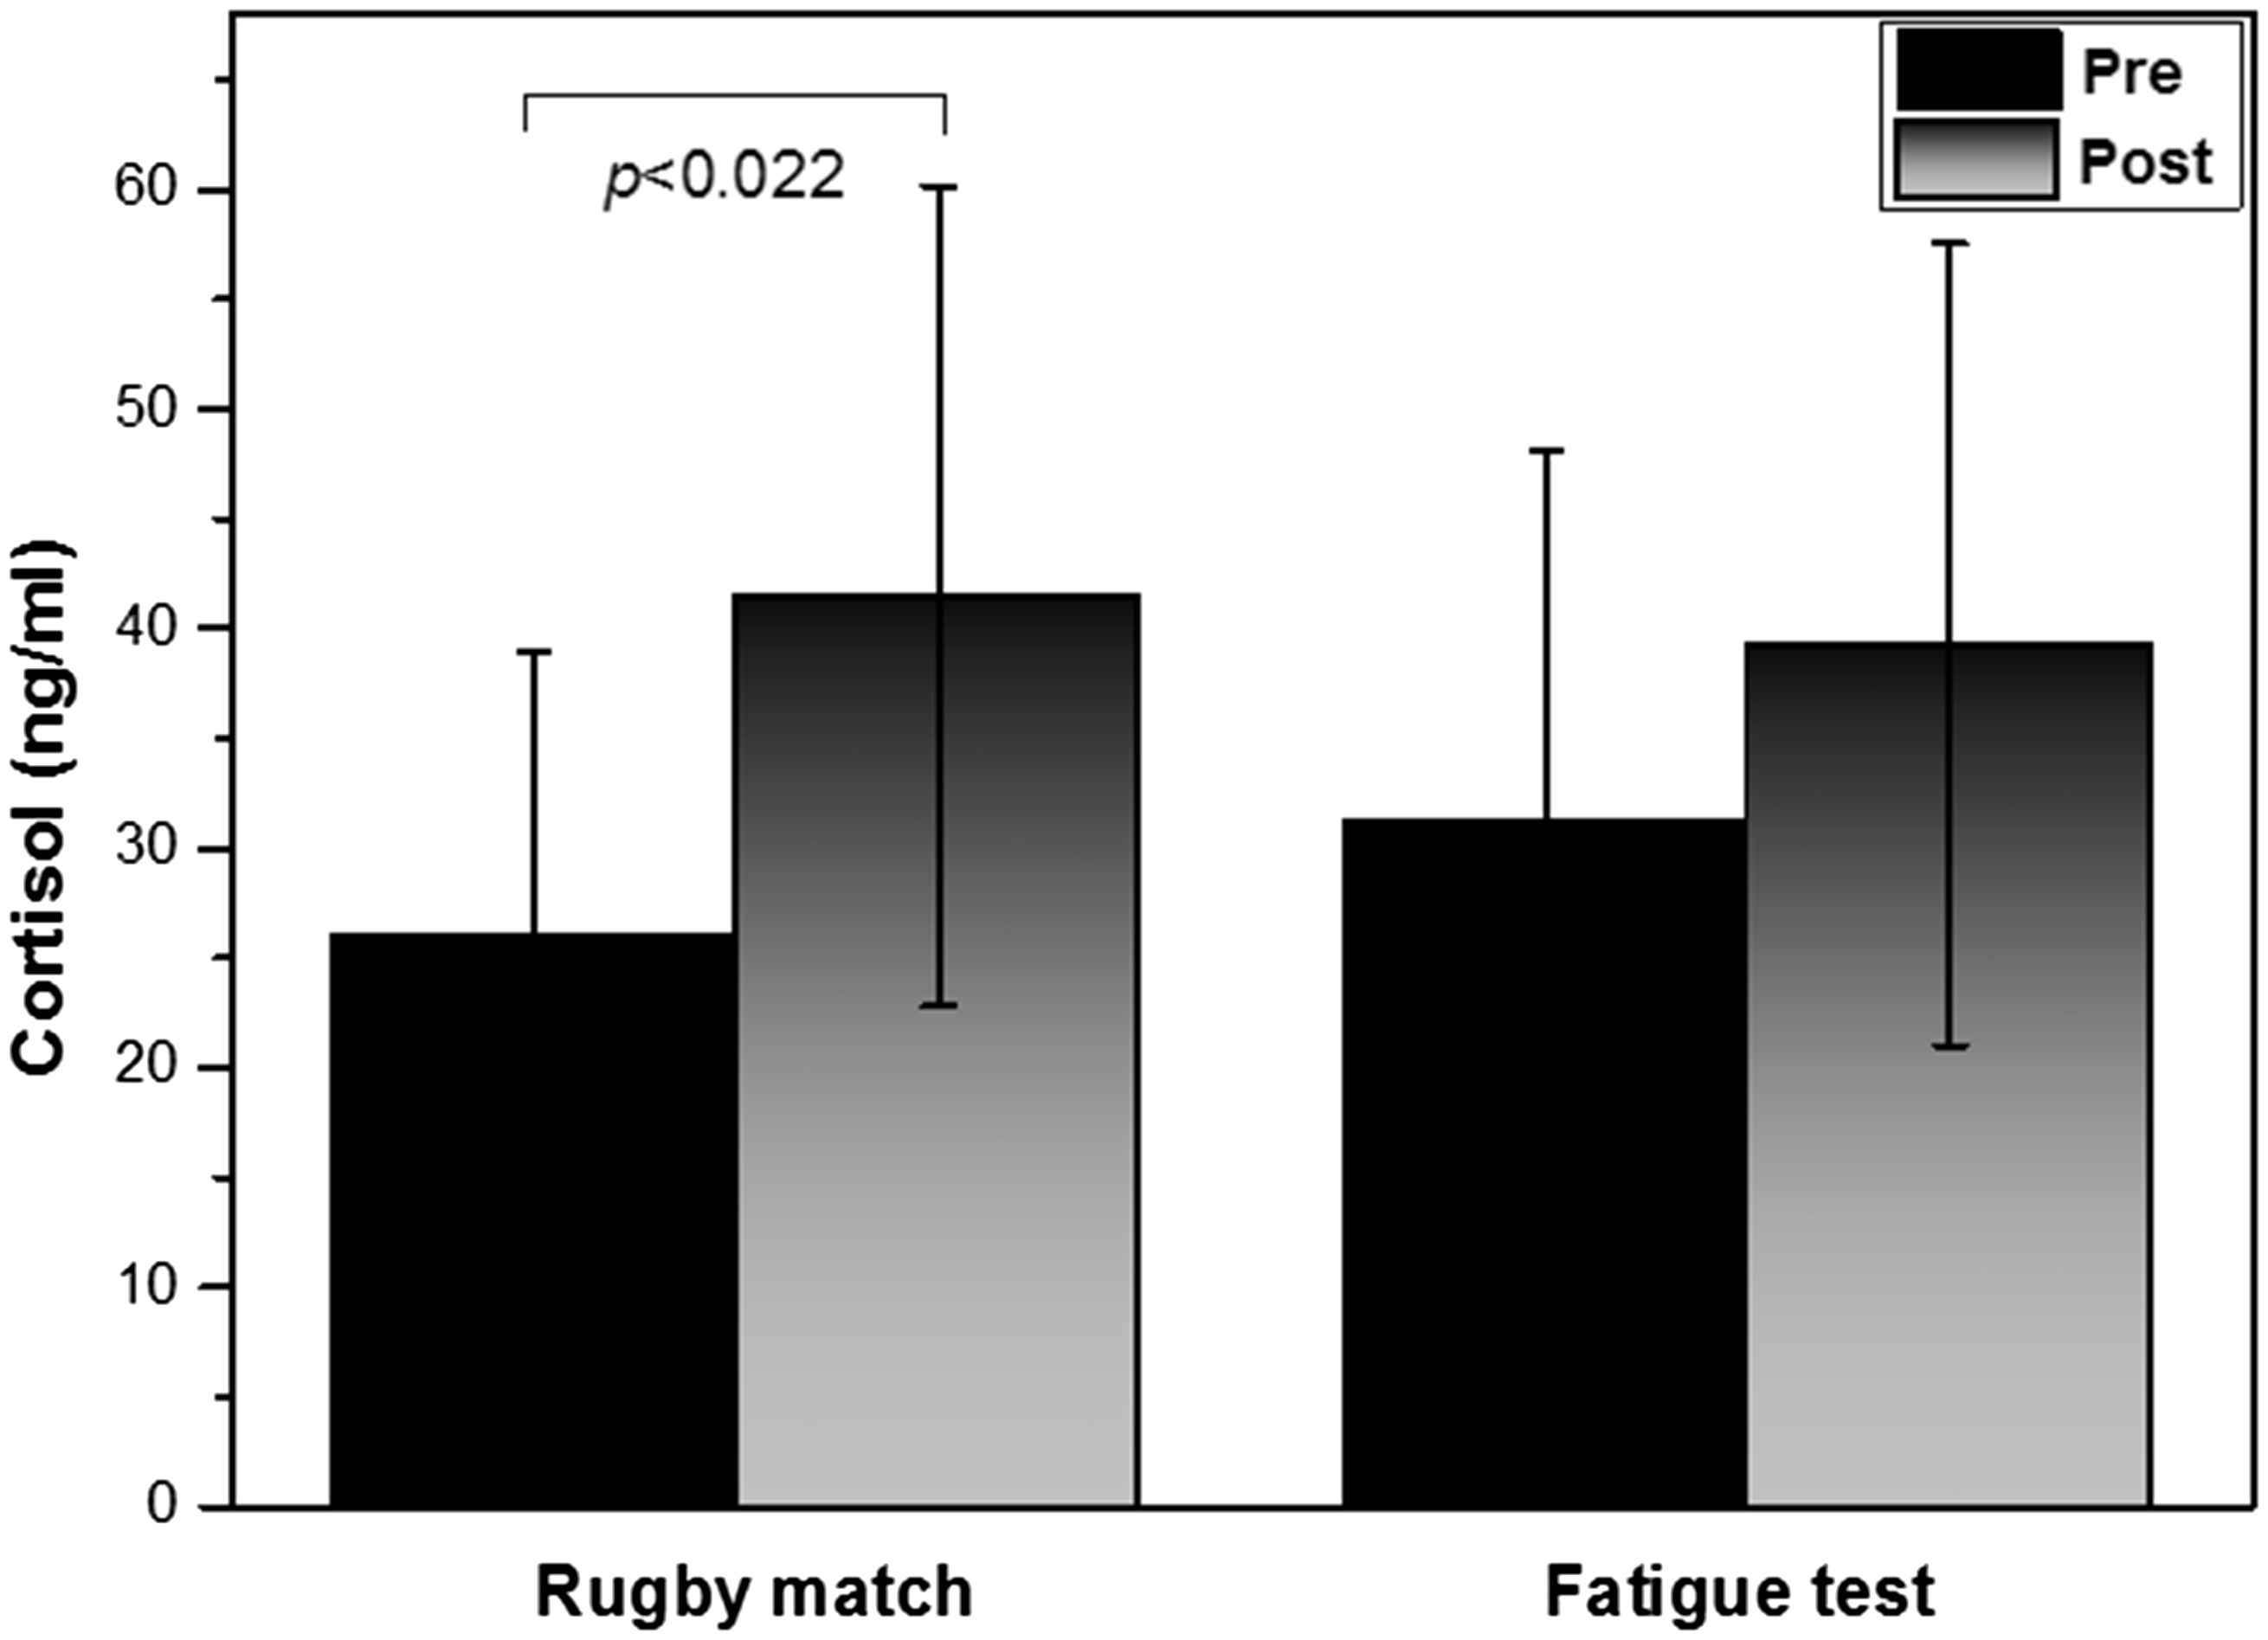
Variations of cortisol concentrations before and after the match per player are shown in Figure 3. Only two players (P6 and P10) showed a decrease in cortisol after physical effort, noted by negative values of variation in the rugby match and fatigue test. The variation of cortisol collected before and after the rugby match was higher compared with the treadmill fatigue test, except for Player 9. In rugby match, seven players (P2, P5, P8, P9, P11, P12, and P13) showed a variation of cortisol above 50%, while in the fatigue test only six players (P2, P5, P9, P11, P12, and P13) showed variation above 50%.
Variation of salivary cortisol concentrations per player (P) before and after rugby match and fatigue test.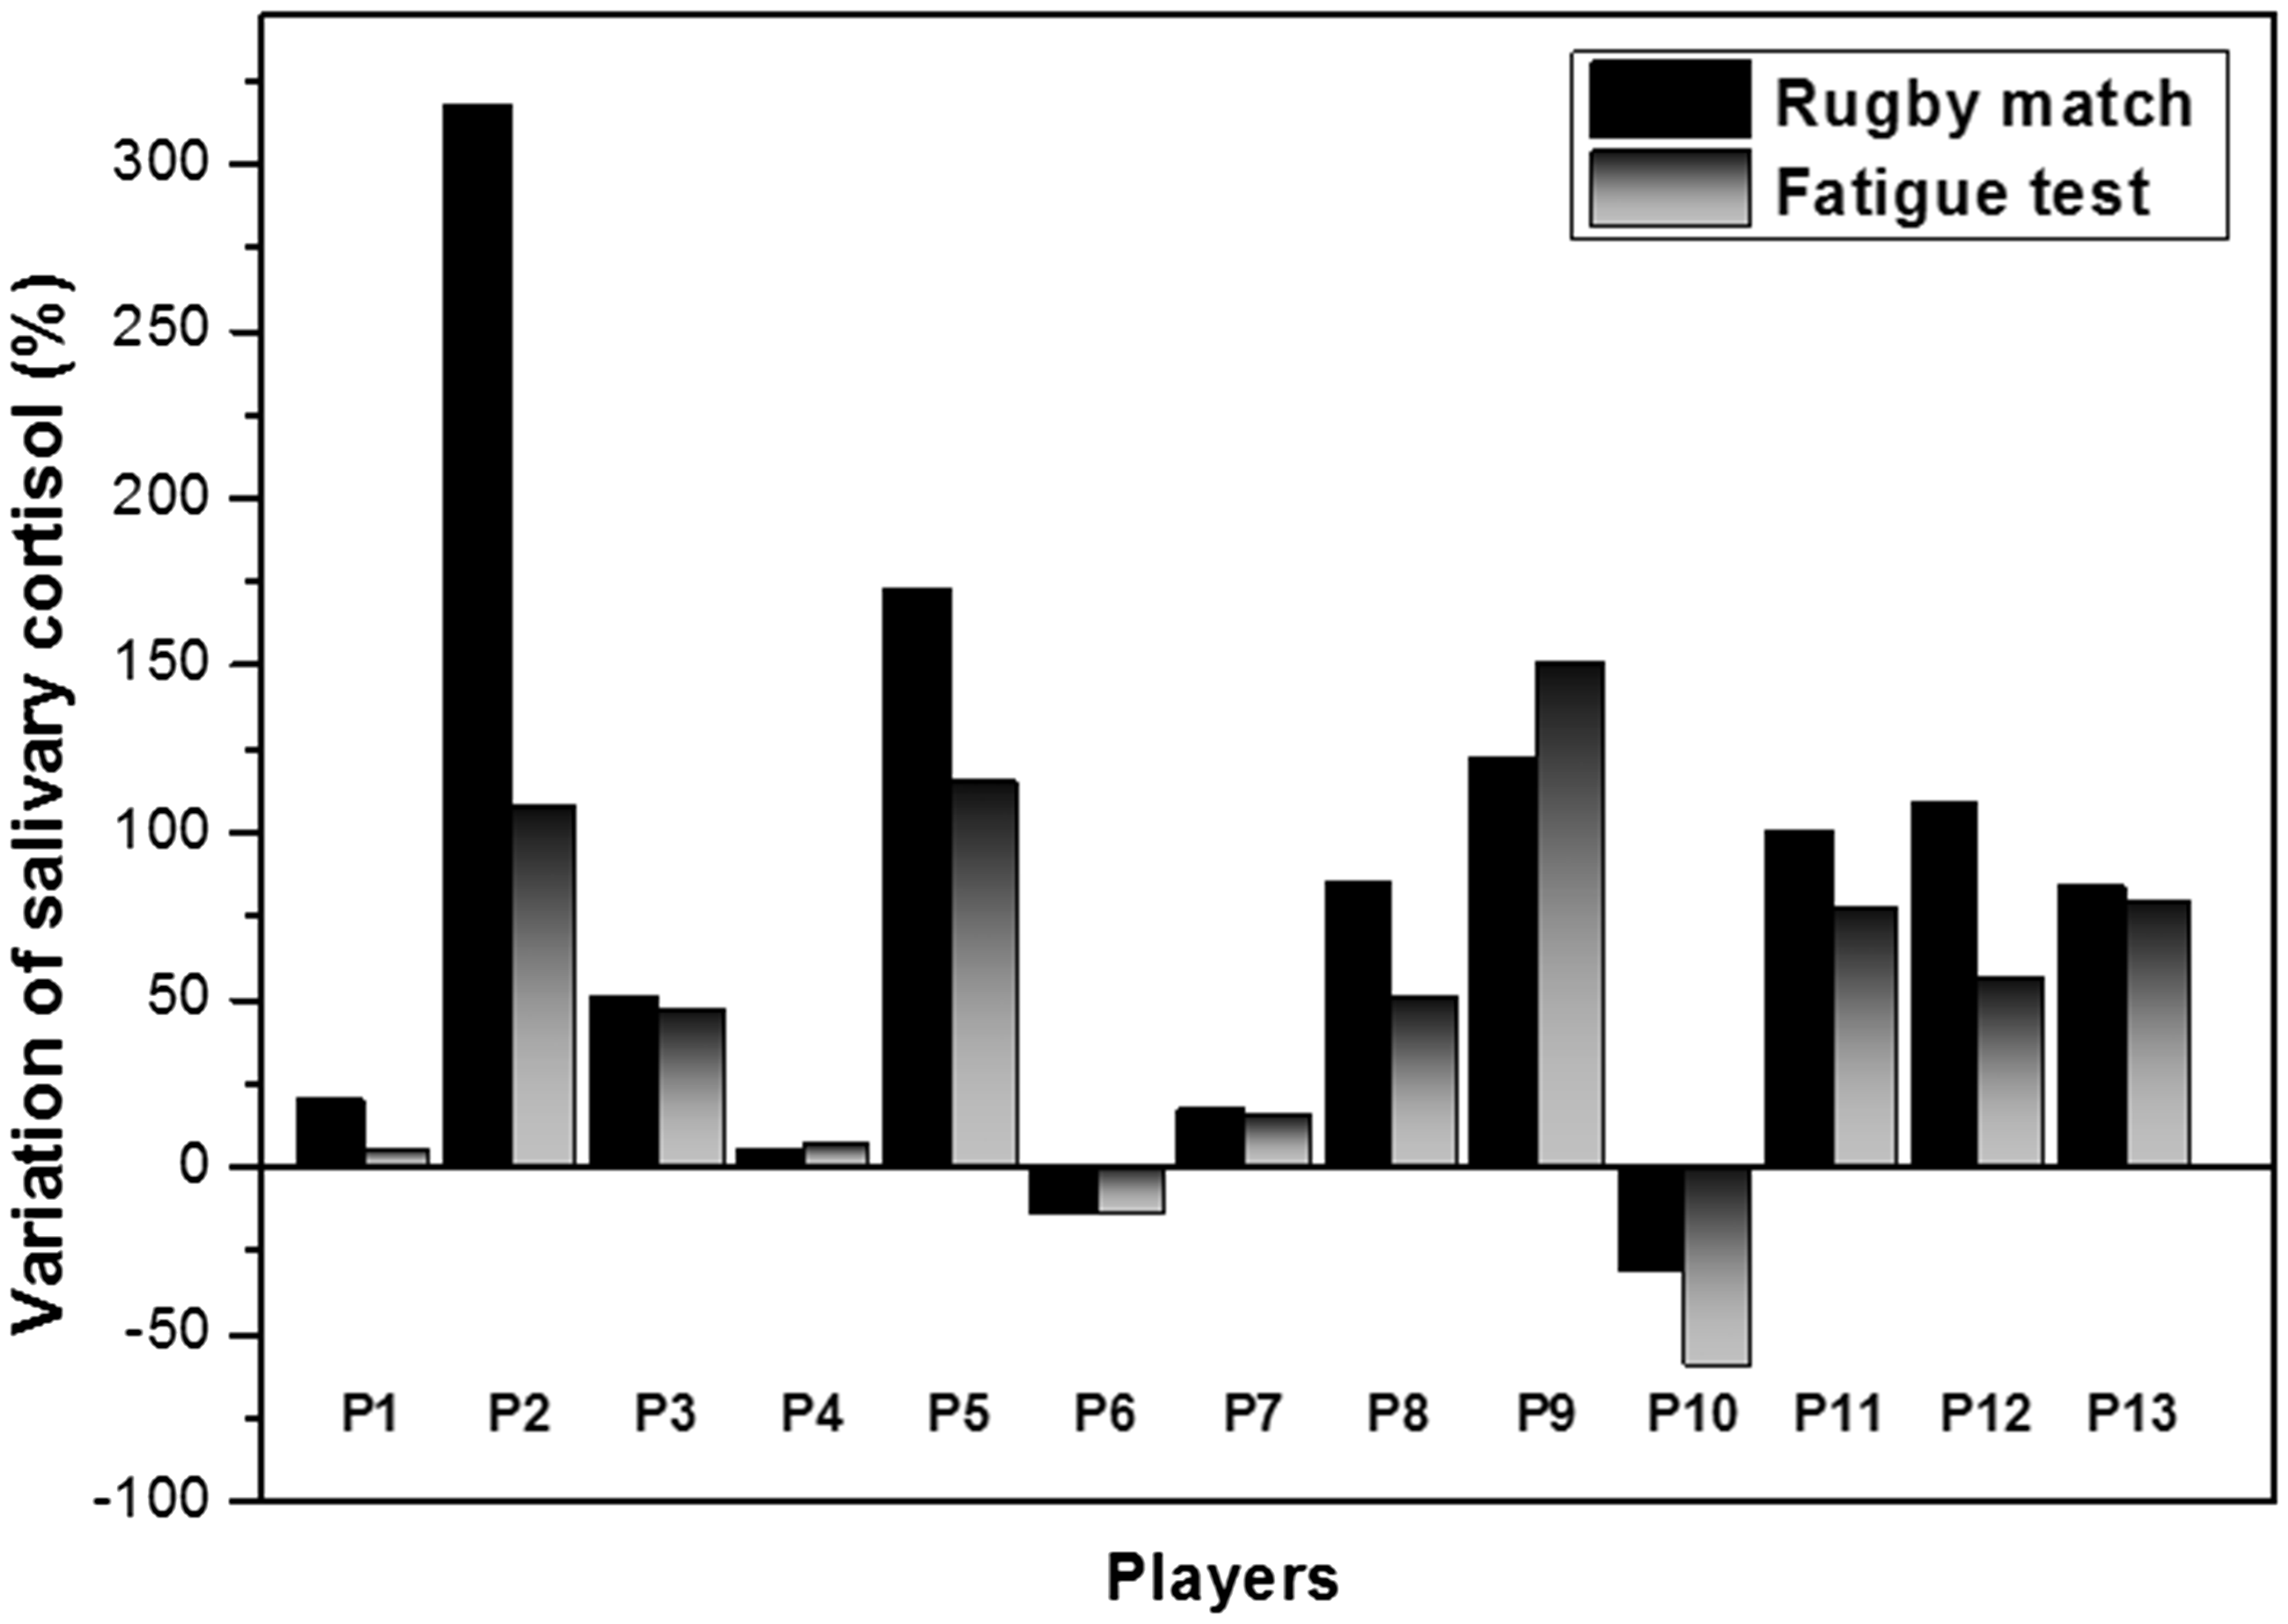
Figure 4(a) and (b) shows the relationship between session-RPE and variations of cortisol concentration (pre and post) for the official rugby match and fatigue test, respectively. Significant correlations were observed between salivary cortical response and session-RPE in both the rugby match (r = .81; p < .001) and the fatigue test (r = .91; p < .001).
Pearson’s correlation coefficient between the session-RPE and variation of salivary cortisol for rugby match (a) and fatigue test (b).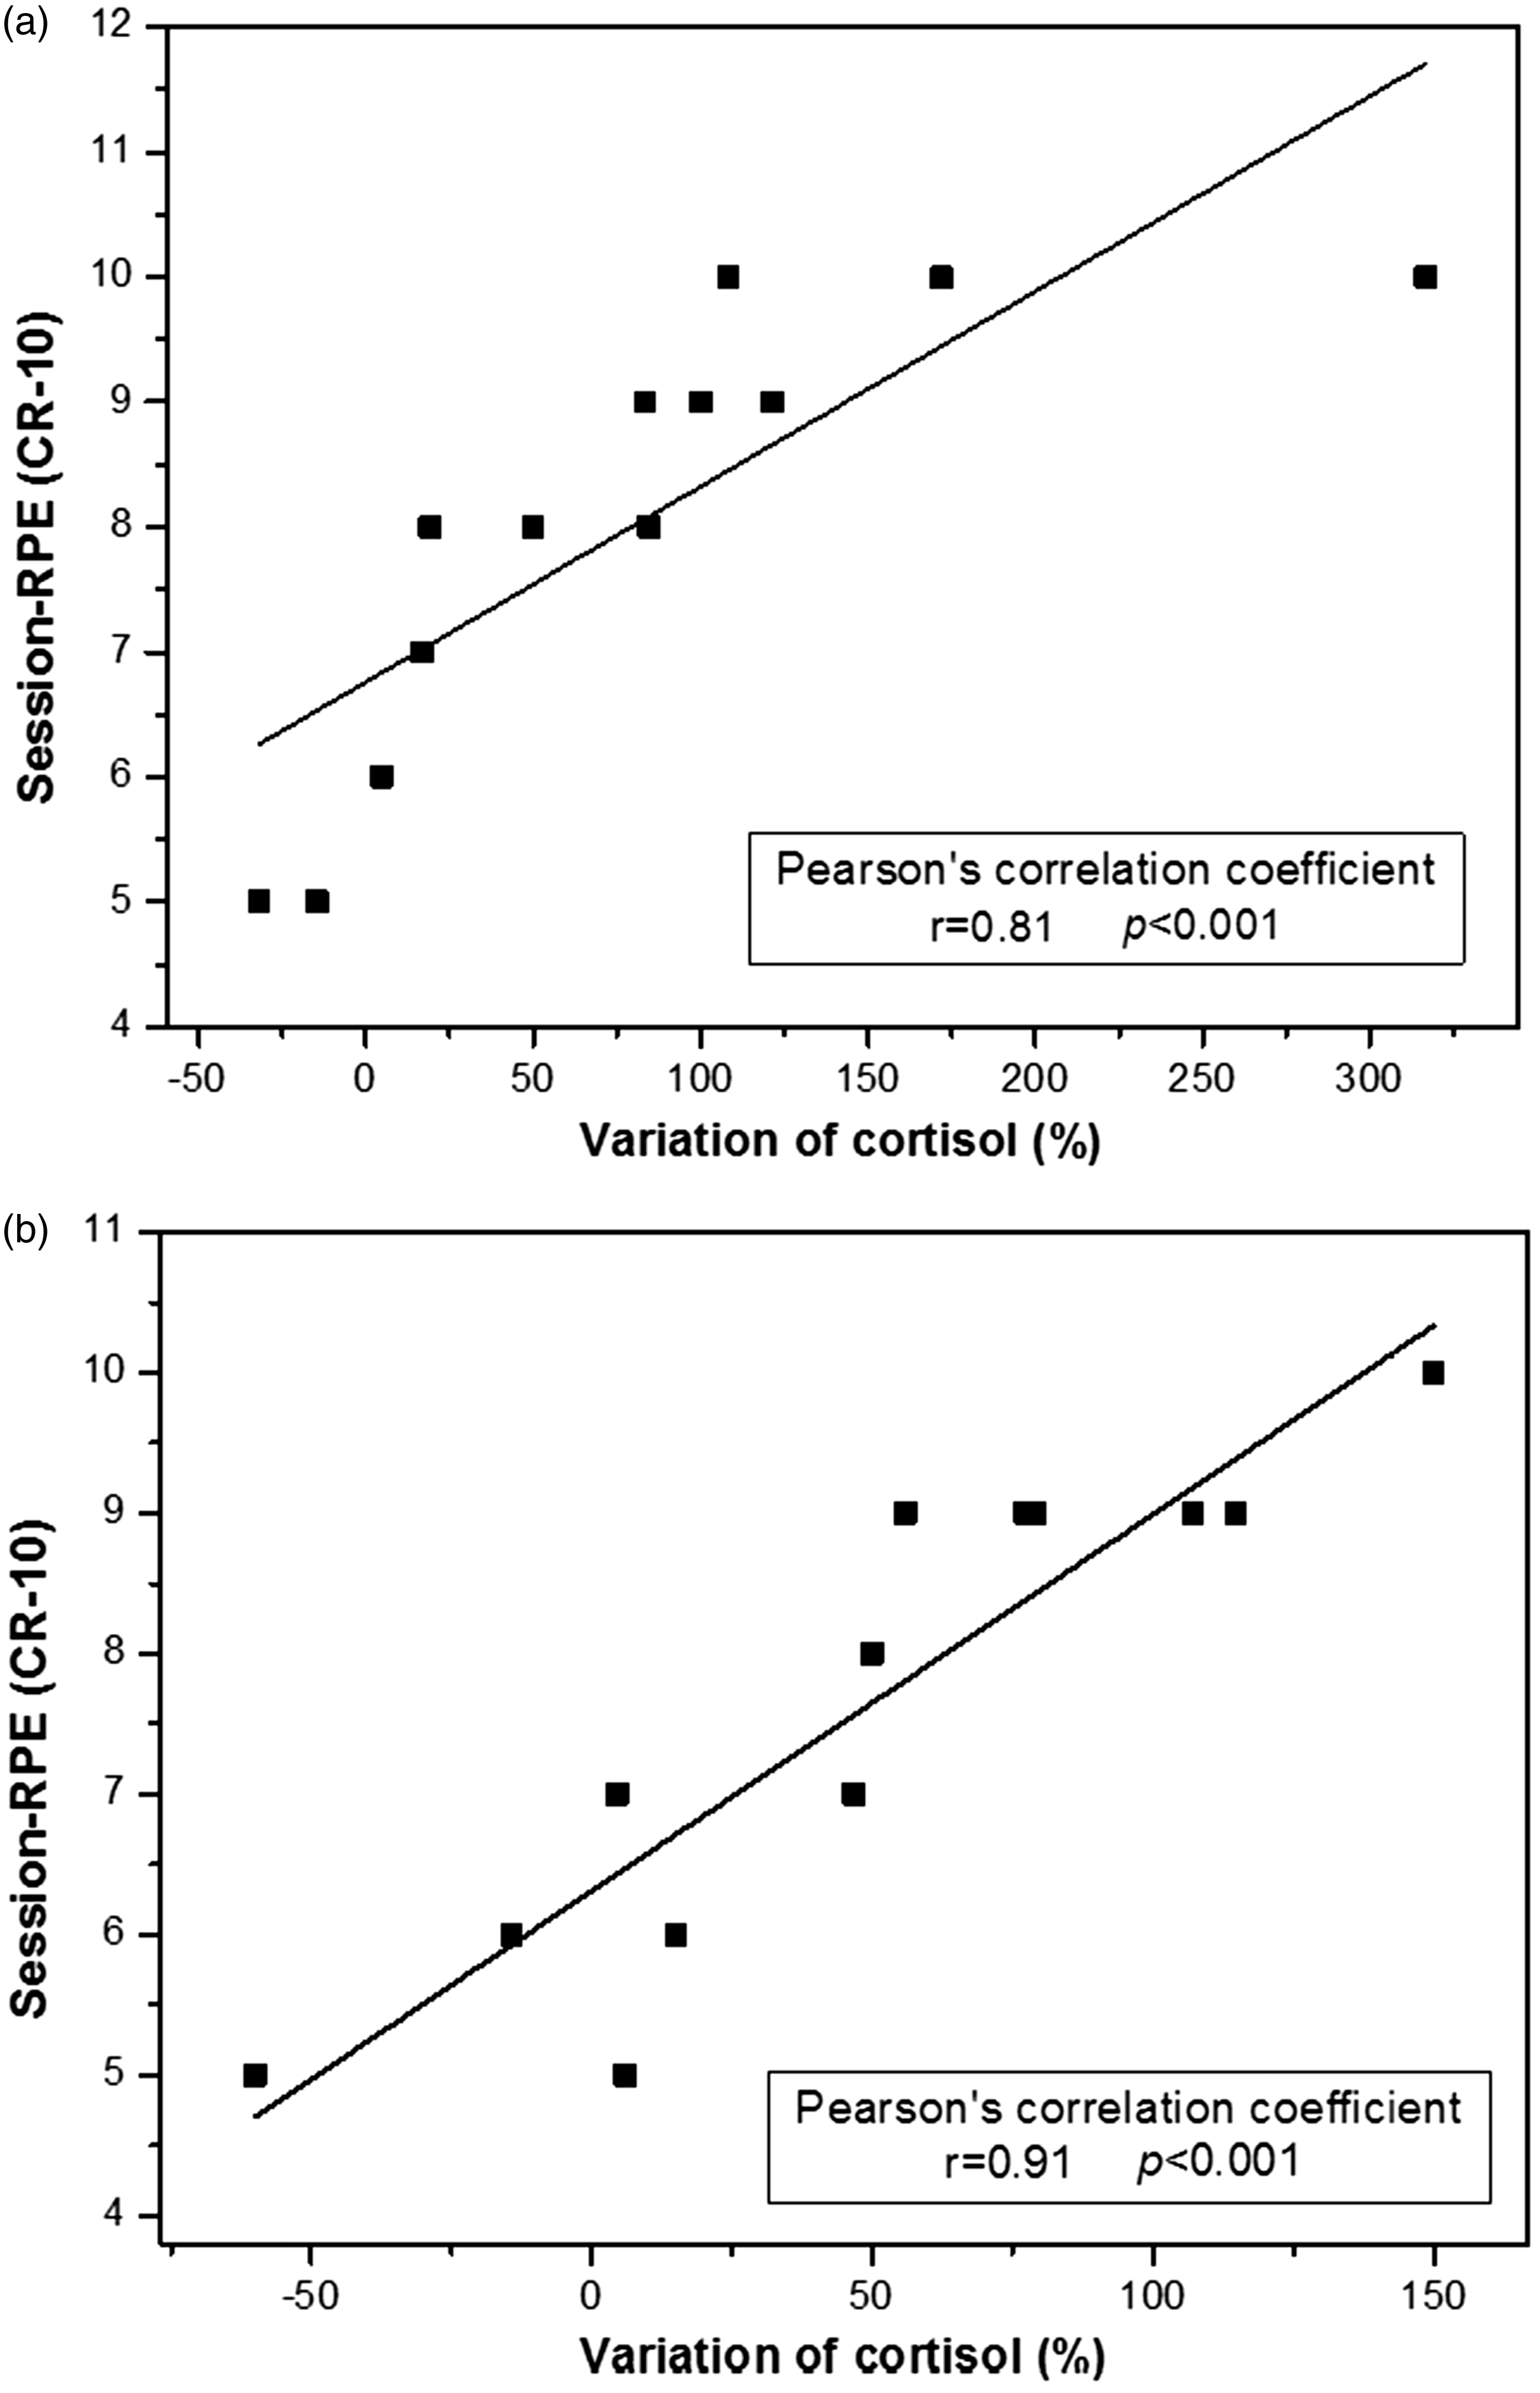
Discussion
The cortisol response is considered a sensitive biomarker of “stress” that can scientifically identify a player’s physiological response to a rugby game (Hellhammer, Wüst, & Kudielka, 2009; Moreira et al., 2013). Thus, the aim this study was to assess the effect of an official rugby match on salivary cortisol response and on physical effort intensity as measured by session-RPE. These two variables were correlated to show that session-RPE is a valid marker of exercise intensity under a variety of conditions and situations.
According to the session-RPE data, the rugby match and fatigue test were both of high-intensity effort; however, the session-RPE for the match was higher than for the fatigue test. These findings may be explained by rugby match characteristics, involving common high-intensity running and impacts over long periods performed in the game, compared with the time in the fatigue test. In addition, several studies have shown that sessions scores increase as competition progresses to increasingly more challenging games and more prepared opponents (Impellizzeri, Rampinini, Coutts, Sassi, & Marcora, 2004; Moreira et al., 2012; Moreira et al., 2013).
The session-RPE is a response derived from various factors such as signals from peripheral working muscles and joints, central cardiovascular and respiratory functions, and the central nervous system (Borg, 1982). In real sports competitions, the psychological experience is an additional factor, leading to stress increases that combine with physical demands (Cunniffe et al., 2010; Cunniffe, Morgan, Baker, Cardinale, & Davies, 2015; Lindsay et al., 2015; Moreira et al., 2013). This psychological factor is influenced by pressure in official competition and further contributes to the higher session-RPE scores obtained in the rugby match, compared with the fatigue test.
As noted, selected biochemical markers of “stress” can provide data regarding a player’s physiological response over time, in intermittent sport and continuous exercise (Khaustova, Shkurnikov, Tonevitsky, Artyushenko, & Tonevitsky, 2010; Lindsay et al., 2015; Moreira et al., 2013). Some studies have shown significant changes in markers of muscle damage, inflammation, psychophysiological stress, and immune system function in players (Cunniffe et al., 2010; Khaustova et al., 2010; Smart, Gill, Beaven, Cook, & Blazevich, 2008; Takarada, 2003). In this study, salivary cortisol was used as a biomarker to verify physiological responses. When comparing cortisol levels before and after a rugby match and fatigue test, we found a significant increase in cortisol after the rugby game.
These results are similar to data reported in other studies showing greater cortisol concentrations to official basketball matches and to a final championship volleyball match compared with simulated training matches and regular season play, respectively. Prior authors explained these results high psychological stress in official matches including pressure to achieve optimal outcomes, an unpredictable environment, and ego involvement in the importance of the match (Moreira et al., 2012; Moreira et al., 2013).
Salivary composition during exercise is influenced by the autonomic nervous system and the hypothalamic–pituitary–adrenal axis, where glucocorticoids are released from the adrenal cortex, mainly cortisol, in response to stress (Passelergue & Lac, 1999). However, this response depends on factors such as exercise intensity and duration, rest intervals, exercise selection and sequence, repetition velocity, frequency (Gatti & De Palo, 2011; Kraemer & Ratamess, 2005), psychological factors (Moreira et al., 2013), physiological adaptations (Marin, Bolin, Campoio, Guerra, & Otton, 2013), individual variability, and time of day (Dickerson & Kemeny, 2004).
Individual variations of cortisol concentrations show the stress level per player, and this level of biochemical analysis provides an increased understanding of the unique effect of stress on each player, useful for monitoring each player's acute and chronic experience (Lindsay et al., 2015). These acutely high variations were recorded for seven rugby players with higher values observed in the match from six players and from the fatigue test in one. Though match intensity was not assessed through a heart rate monitor or Global Positioning System, the outcomes show that these players probably performed the most strenuous actions (high-intensity running, ruck, maul, tackle, hit-up, and scrum) during the game (Cunniffe et al., 2010; Lindsay et al., 2015). Additionally, psychological factors and time in the match may have increased their cortisol concentrations, as previously discussed.
Consistent with previous studies, these findings show that individual variability and acute changes of cortisol levels make cortisol response a sensitive biomarker for assessing acute psychophysiological stress (Elloumi et al., 2013; Lindsay et al., 2015). In this study, cortisol analyses showed a difference in the response of this hormone among a group of players subjected to different stress conditions. The high correlations of cortisol response to the session-RPE method of measuring physical stress in both game conditions and the fatigue test showed that the session-RPE can be used to monitor training and competition to avoid excess “stress.” These results are important because successful training must avoid the combination of excessive overload and inadequate recovery. When athletes do not sufficiently respect the balance between training and recovery, nonfunctional overreaching and overtraining syndrome can occur, decreasing athletic performance (Meeusen et al., 2013) and creating serious health risks.