
Abstract
Usual gait speed has been shown to have very good reliability and convincing predictive validity for evaluating older adults’ gait skills, but its criterion validity is unknown. We examined the criterion validity of the 8-feet (i.e., 2.44 meters) test in a laboratory environment to assess usual gait speed by comparing its results with the Intelligent Device for Energy Expenditure and Activity (IDEEA) monitor. Participants were 200 well-functioning community-dwelling adults aged 65 and older (113 women; 87 men; mean [M] age = 71.8, standard deviation [SD] = 5.6 years). Participants wore the IDEEA monitor for 48 consecutive hours, and we used the participants’ average usual gait speed for the analysis. The Spearman correlation of usual gait speed using both the 8-feet test and IDEEA monitor was moderate and statistically significant (ρ = .364, p < .001). The mean difference between both methods was 0.20 (SD = 0.27) meters/second, and the corresponding limits of agreement were 0.73 and −0.33 meters/second. There was a small systematic bias when the difference between the two methods was correlated with usual gait speed as measured by the IDEEA (ρ = −.20, p = .011). The perfect agreement (weighted kappa) of both instruments for classifying usual gait speed into tertiles, quartiles, and quintiles was 48.3% (k = 0.17), 30.9% (k = 0.23), and 25.4% (k = 0.29), respectively. Our results indicate that the 8-feet test showed moderate criterion-related validity for evaluating and assessing usual gait speed test in older adults.
Introduction
Mobility, critical for independent living, requires energy, movement control, and support, and it places demands on multiple organ systems (Studenski et al., 2011). During the aging process, people begin losing the ability to walk efficiently, as clearly reflected in their gait speed. Usual gait speed is often assessed by field- and laboratory-based testing in which participants must walk a short distance (2.44–10 meters); this test has been a powerful predictor of adverse health outcomes, such as multimorbidity, disability, and death (Kutner, Zhang, Huang, & Painter, 2015; Studenski et al., 2011), making it popular for clinical assessments and a means of identifying some geriatric syndromes related to adverse health outcomes (Brach, Studenski, Perera, VanSwearingen, & Newman, 2007; Cesari et al., 2008; Fried et al., 2001; Gómez, Curcio, Alvarado, Zunzunegui, & Guralnik, 2013; Guralnik et al., 1994, 2000; Penninx et al., 2000; Perera et al., 2016; Studenski et al., 2003; Theou et al., 2015; Viccaro, Perera, & Studenski, 2011; Volpato et al., 2011). For example, frailty in the older adults, resulting from age-associated declines in reserve and function across several physiologic systems, includes “slowness” as one of the five phenotypic criteria (Fried et al., 2001). Accordingly, usual gait speed is one of the components of the Short Physical Performance Battery (SPPB; Guralnik et al., 1994), a well-researched tool for assessing lower extremity physical performance in older adults (Guralnik et al., 2000).
Usual gait speed tests have shown very good reliability (Guralnik et al., 1994; Mendoza et al., 2010; Ostchega et al., 2000) and, as noted, convincing predictive validity; but the concurrent criterion validity (i.e., the extent to which a measurement is representative of the object of measurement) of usual gait speed testing remains uncertain. Recent technology developments have led to such tools as the Intelligent Device for Energy Expenditure and Activity (IDEEA) monitor that can accurately and directly measure usual gait speed in natural conditions, as compared with the indirect measures in clinical settings that have traditionally been used to measure usual gait speed (Zhang, Werner, Sun, Pi-Sunyer, & Boozer, 2003). Accordingly, this study examined (a) the concurrent criterion validity of the 8-feet (i.e., 2.44 meters) test to assess usual gait speed by comparing its results with the IDEEA monitor (Zhang et al., 2003) and (b) the agreement of both instruments to identify usual gait speed. We hypothesized that the concurrent criterion validity between the 8-feet test and the IDEEA monitor would be strong, based on previous scientific literature (Mendelsohn, Connelly, Overend, & Petrella, 2007; Tveter, Dagfinrud, Moseng, & Holm, 2014) .We selected the 8-feet test because of its wide research use (Fried et al., 2001; Mendoza et al., 2010) and ease of administration in small and busy clinical settings.
Method
Participants
Our participants were enrolled within the IMPACT65+, a cross-sectional research study to examine the relationship between objectively measured physical activity and frailty, quality of life, and other health indicators in seemingly well-functioning community-dwelling individuals aged 65 and older. Participants were recruited from wellness and senior centers in the Madrid, Spain region. All participants gave informed written consent, and the study was approved by the Ethics Research Committee of the Autonomous University of Madrid, Spain.
For this study, we selected the first 200 participants (87 men and 113 women) enrolled within the IMPACT65+, using data collected during the first year of the study (April 2015 to April 2016). During a 1-hour evaluation of each participant, we collected sociodemographic information and asked participants to perform the 8-feet test for measuring usual gait speed. Before finishing the evaluation, the IDEEA monitor was placed on the participants for data collection over the ensuing 48 hours.
8-Feet Test
To assess usual gait speed, we used the 8-feet test with the standardized protocol from the SPPB (Guralnik et al., 1994). Participants were instructed to “walk to the other end of the course at their usual speed, just as if they were walking down the street to going to the store.” The course was tape-marked on the ground. Participants began in a standing position, with both feet touching the starting line; next, they walked all the way past the other end of the tape, into to a 2-feet deceleration zone after the end line (Guralnik et al., 1994). The test finished when one of the participant’s feet completely crossed the end line. We used a stopwatch to measure time elapsed, as this method has been shown to be as valid as automatic timers in gait speed testing (Peters, Fritz, & Krotish, 2013). Participants were allowed to use assistive devices if needed.
IDEEA Monitor
We also used the IDEEA monitor (Zhang et al., 2003) to measure usual gait speed in daily living. It consists of five sensors (each 16 × 14 × 4 mm, 2 g), with one attached over the sternum, two attached to the front side of each thigh, and the other two attached under each foot. Sternum and thing sensors are connected via solid cable to a small 32-bit microprocessor (70 × 44 × 18 mm, 59 g) and foot sensors are wired or wireless. The sensors register information about angles of body segments and acceleration in two orthogonal directions, which is sent to the microprocessor. The IDEEA monitor allows for identification of 40 types of activities, time, and intensity of each of these activities. Also, this monitor estimates gait speed during walking and running based on single- and double-limb support time, swing phase duration, cycle duration, and cadence data (Zhang et al., 2003).
Several studies have shown that this monitor accurately measures gait speed during usual walking (Arvidsson, Fitch, Hudes, & Fleming, 2011; Gorelick, Bizzini, Maffiuletti, Munzinger, & Munzinger, 2009; Zhang et al., 2003). In one of these studies (Arvidsson et al., 2011), participants completed a circuit at different speeds; the walking protocol started at two km/hour on a treadmill, and speed was increased every four minutes (i.e., to 4, 5, and 6 km/hour). During walking, steps were counted manually for two minutes of each different speed. Compared with manual count, the IDEEA monitor accurately measured steps at speeds >two km/hour, with ≤ 2% underestimation at lower speeds. In another study, subjects walked on a 60-meter track at slow, normal, and fast speeds, and the average absolute agreement accuracy of the IDEEA for speed estimation was 100.0 % (standard deviation [SD] = 3.6), with an excellent correlation for average gait speed (r = .986, p < .001). After a total of 15,676 steps evaluated during the protocol, the overall average error was 0.004 meters/hour (SD = 0.324; absolute error = 0.223, SD = 0.236 mph; Zhang et al., 2003). Last, the IDEEA has also shown high reliability in measuring gait speed (intraclass correlation coefficient=0.87; Gorelick et al., 2009).
For this study, participants wore the IDEEA monitor for 48 consecutive hours and we used the average usual gait speed during walking and time spent walking for data analysis. Attachment of sensors and calibration were performed according to the manufacturer’s instructions, and we analyzed data output with ActViewTM software.
Other Participant Variables
Participants self-reported their education level in five categories: nonformal education; primary school, middle school, high school, or professional studies; and university. We measured body height and weight with participants barefooted and wearing light underclothes, according to standardized procedures. Body mass index (BMI) was calculated as weight in kilograms divided by squared height in meters. Participants also reported smoking and alcohol consumption patterns. The following nine chronic conditions diagnosed by a physician and reported by the study participants were recorded: diabetes, coronary heart disease, stroke, asthma, osteoarthrosis, cancer, hip fracture, Parkinson’s disease, Alzheimer’s, or other dementia.
Statistical Analysis
Of the 200 participants we selected, only those with complete data on both the 8-feet test (all participants) and at least 44 hours of IDEEA monitor recording (149 participants; 86 women, 63 men) were included in data analyses. We presented their descriptive statistics as M's, SDs, or percentages. Gender differences between sexes were tested by one-way analysis of variance (ANOVA) for continuous variables and chi-square test for categorical variables. Estimates of usual gait speed (meters/second) from both methods are presented for the whole sample and by sex (men, women), age (equal-above or below sex-specific median), education (primary studies or lower, middle school, or higher), smoking (never, former/currently), alcohol drinking (never, former/currently), height (equal-above or below sex-specific median), BMI (<30 kg/m2, ≥30 kg/m2), chronic conditions (0 chronic conditions, ≥1 chronic conditions), and total walking time (equal-above or below age- and sex-specific median).
The Spearman correlation coefficient (ρ) was calculated to compare usual gait speed assessed by the 8-feet test and the IDEEA monitor. Strength of correlations were described according to the Cohen’s (1992) criteria: >0.5 large, 0.5 to 0.3 moderate, <0.3 to 0.1 small, and <0.1 insubstantial. Mean differences in gait speed between both testing methods (8-feet test and IDEEA) were assessed with the Wilcoxon signed rank test. Absolute agreement between gait speed estimates from the 8-feet test and the IDEEA monitor was summarized by the Bland Altman method using the IDEEA monitor as the gold standard (Krouwer, 2008). Results were expressed as mean differences between methods (i.e., bias) with 95% limits of agreement. Finally, the percentage of agreement and Cohen’s weighted kappa coefficient were used to evaluate agreement between methods in classifying usual gait speed into tertiles, quartiles, and quintiles. For percentage of agreement, we calculated the classification difference between analogous groups of the 8-feet test and the IDEEA monitor; a difference equal to 0 was defined as perfect agreement (classification in the same groups), whereas a difference of ± 1 was defined as perfect-acceptable agreement. We included weighted kappa because it quantifies different degrees of disagreement between response categories, while simple kappa does not (Cohen, 1968). The k statistic was interpreted according to standard convention: poor (0.00–0.20), fair (0.21–0.40), moderate (0.41–0.60), substantial (0.61–0.80), or almost perfect agreement (0.81–1; Landis & Koch, 1977). Data analyses were performed using the SPPS v. 21 software, and the level of significance was set at p < .05 for all analyses.
Results
Descriptive Characteristics of Study Sample.
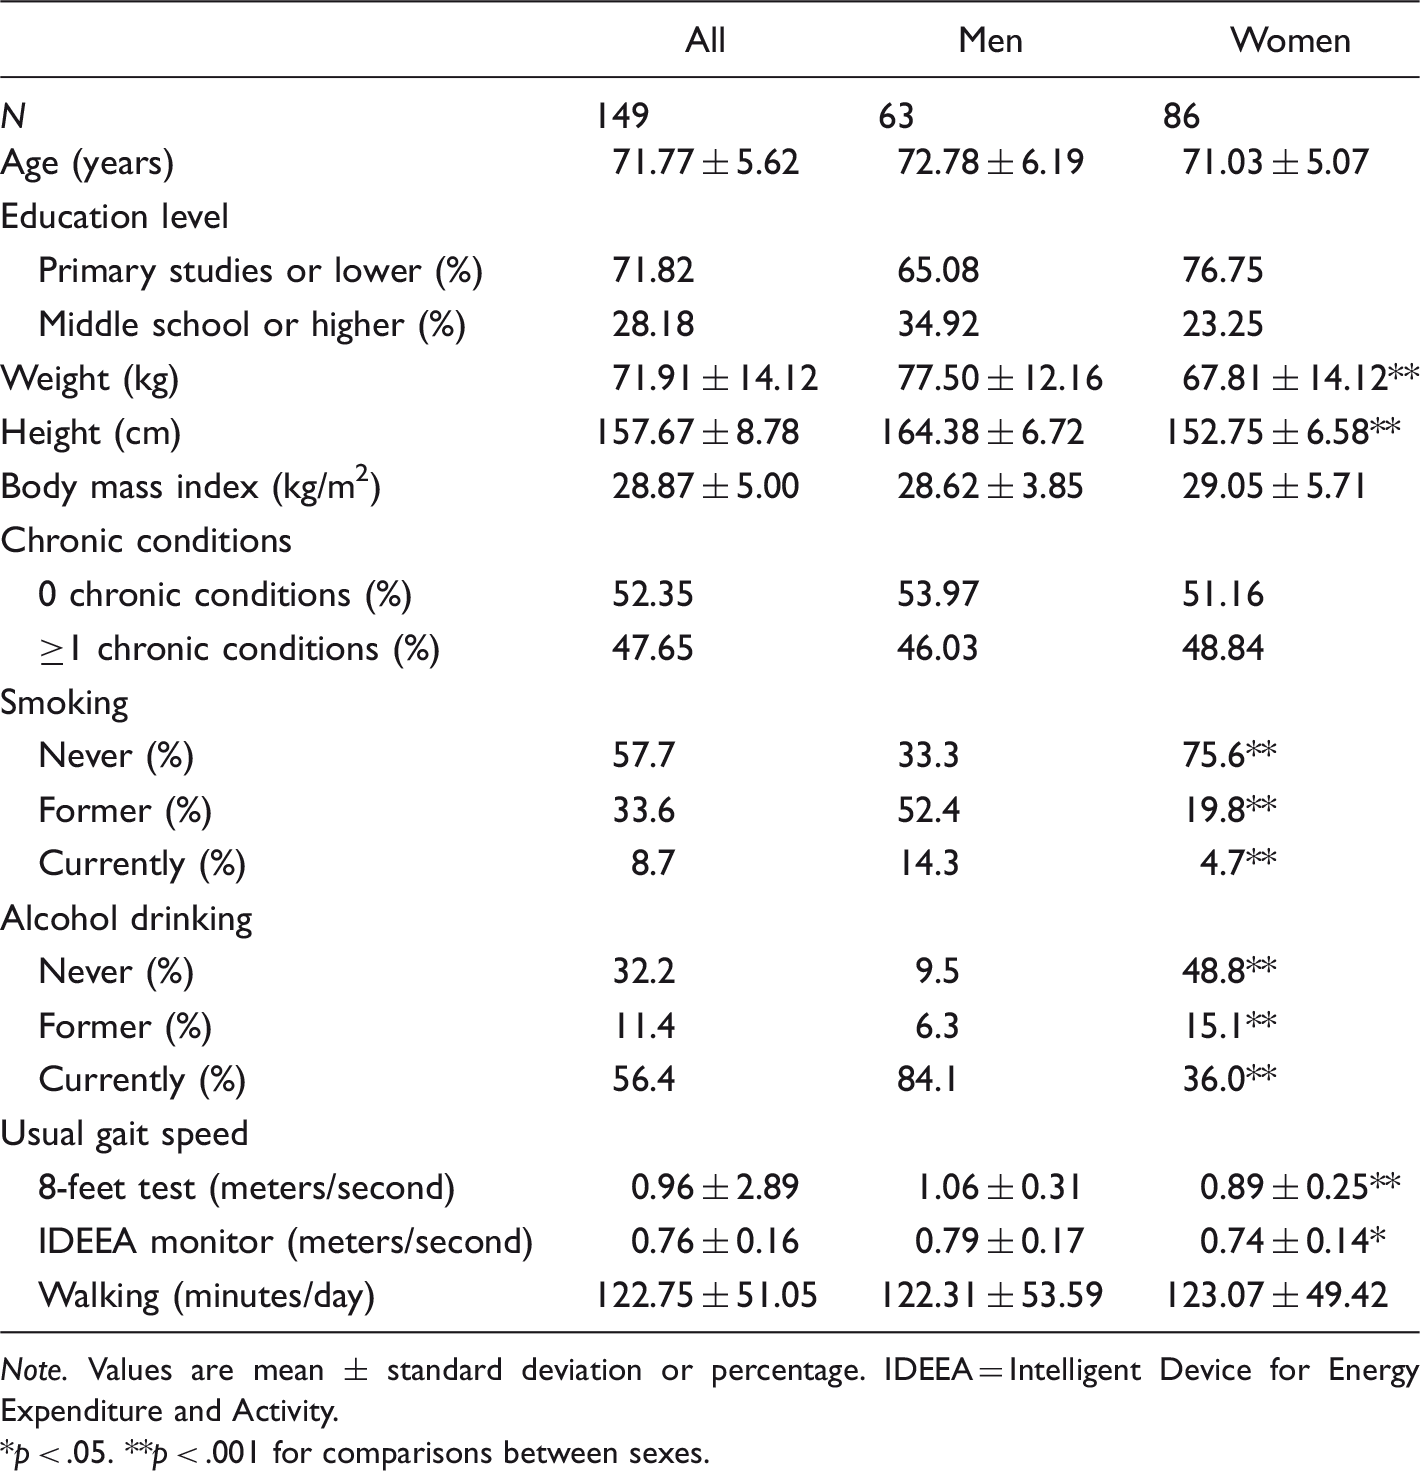
Note. Values are mean ± standard deviation or percentage. IDEEA = Intelligent Device for Energy Expenditure and Activity.
*p < .05. **p < .001 for comparisons between sexes.
Gait Speed (Meters/Second) and Spearman Correlations From 8-Feet Test and the IDEEA Monitor in Older Adults.
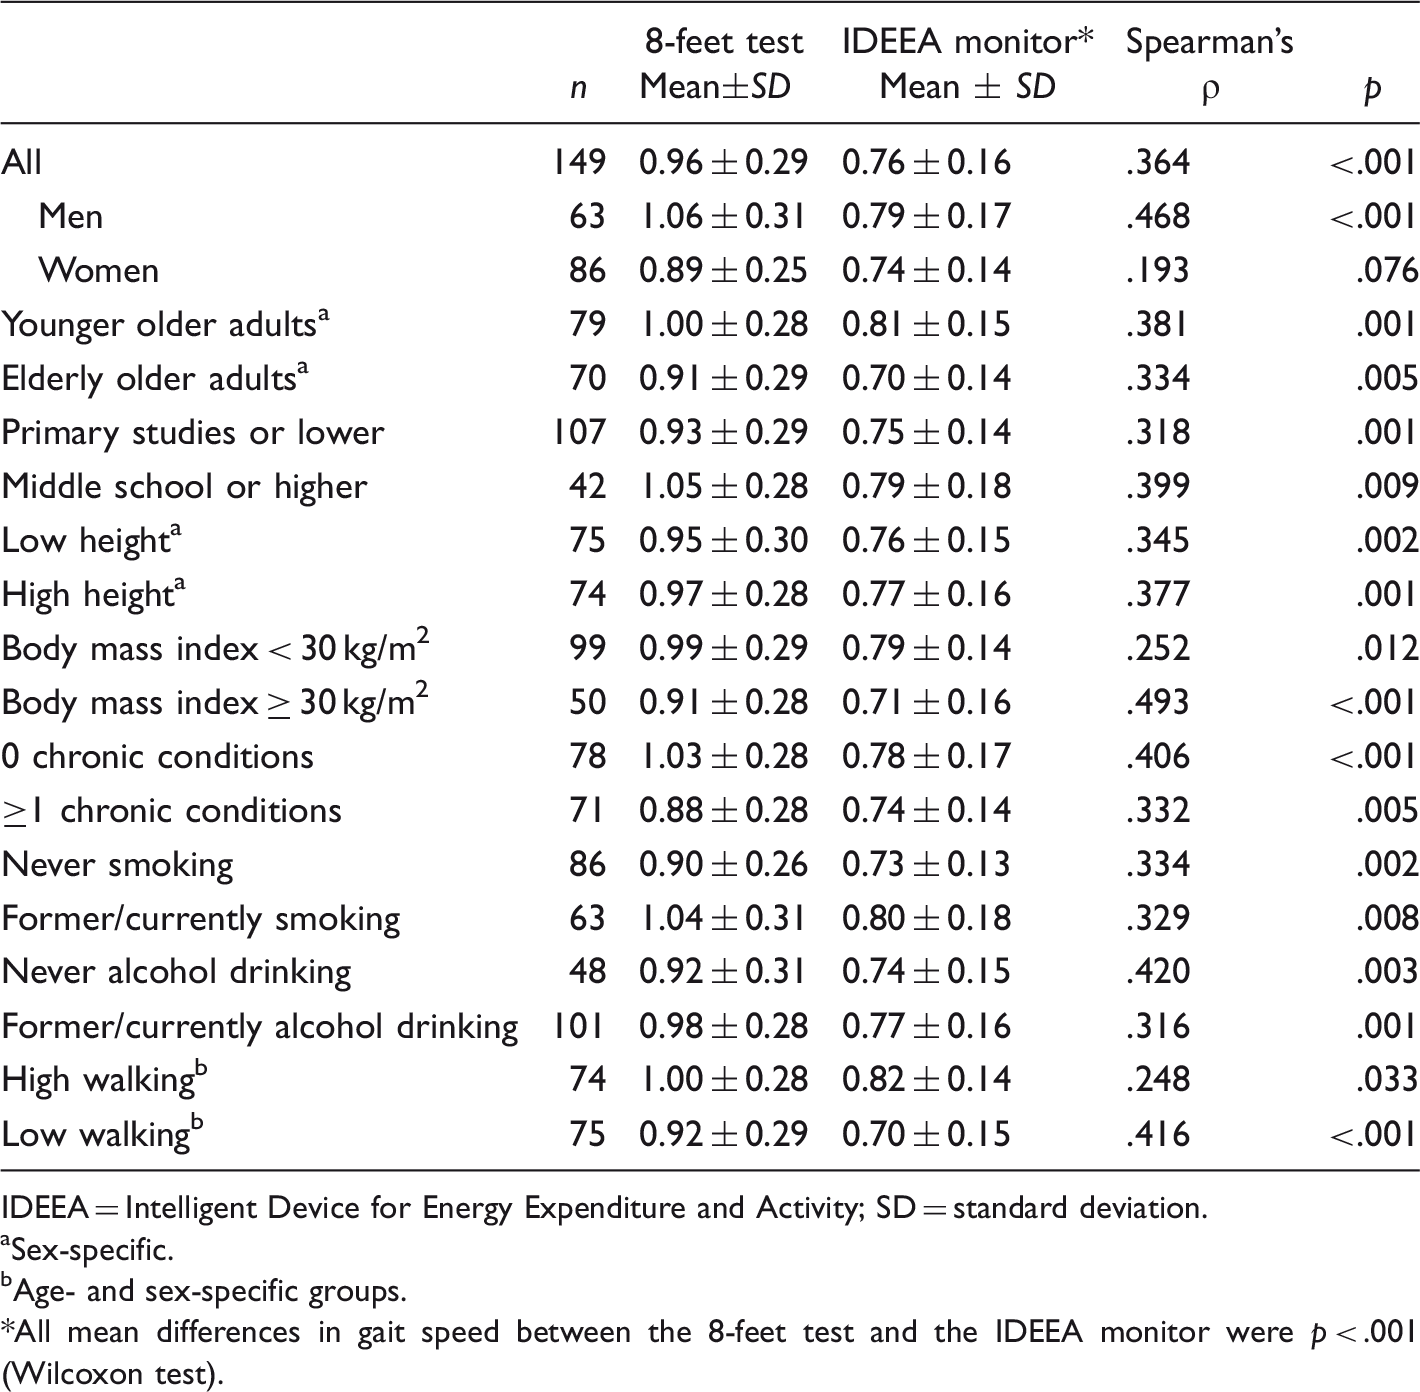
IDEEA = Intelligent Device for Energy Expenditure and Activity; SD = standard deviation.
aSex-specific.
bAge- and sex-specific groups.
*All mean differences in gait speed between the 8-feet test and the IDEEA monitor were p < .001 (Wilcoxon test).
Mean usual gait speeds on the 8-feet test and IDEEA monitor were 0.96 (SD = 0.29) meters/second and 0.76 (SD = 0.16) meters/second, respectively (p < .001 for 8-feet vs. IDEEA; Table 2). The mean difference between both methods was 0.20 (SD = 0.27) meters/second, and the corresponding limits of agreement were 0.73 and −0.33 meters/second (Figure 1). We found a small systematic bias when the difference in the two methods was correlated with usual gait speed as measured by the IDEEA (ρ = −.20, p = .011); the plot in Figure 1 shows that the 8-feet test tended to underestimate gait speed in older adults who walked slower, but overestimate gait speed among faster participants.
Bland–Altman plot for usual gait speed assessed by the 8-feet test and the IDEEA monitor in older adults (n = 149). Mean error scores (solid horizontal lines) and 95% limits of agreement (dashed horizontal lines) are shown. The difference in the two methods was correlated with usual gait speed by the IDEEA (ρ = −.20, p = .011). IDEEA = Intelligent Device for Energy Expenditure and Activity; SD = standard deviation.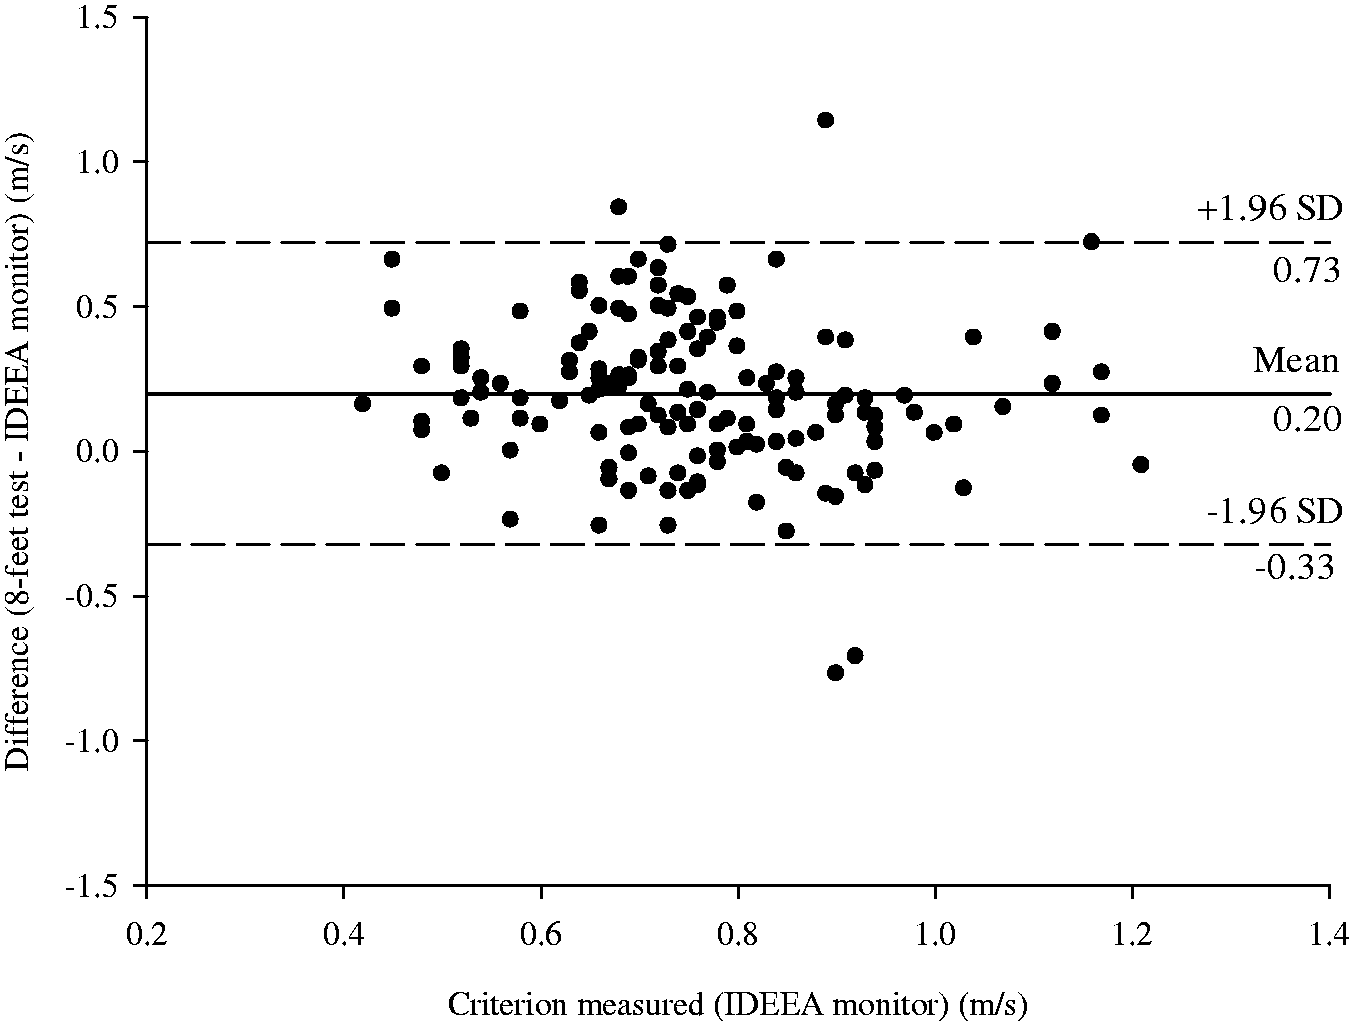
Validity was also assessed by examining classification agreement for tertiles, quartiles, and quintiles (Figure 2). The perfect agreement for both instruments was 48.3% for tertiles, 30.9% for quartiles, and 25.4% for quintiles. The perfect-acceptable agreement increased to 85.3%, 73.2%, and 63.7%, respectively (Figure 2). The weighted kappa analysis for each classification was fair (k = 0.17, 0.23, and 0.29 for tertiles, quartiles, and quintiles, respectively).
Percentage of agreement to classify usual gait speed in tertiles, quartiles, and quintiles between the 8-feet test and the IDEEA monitor in older adults (n = 149).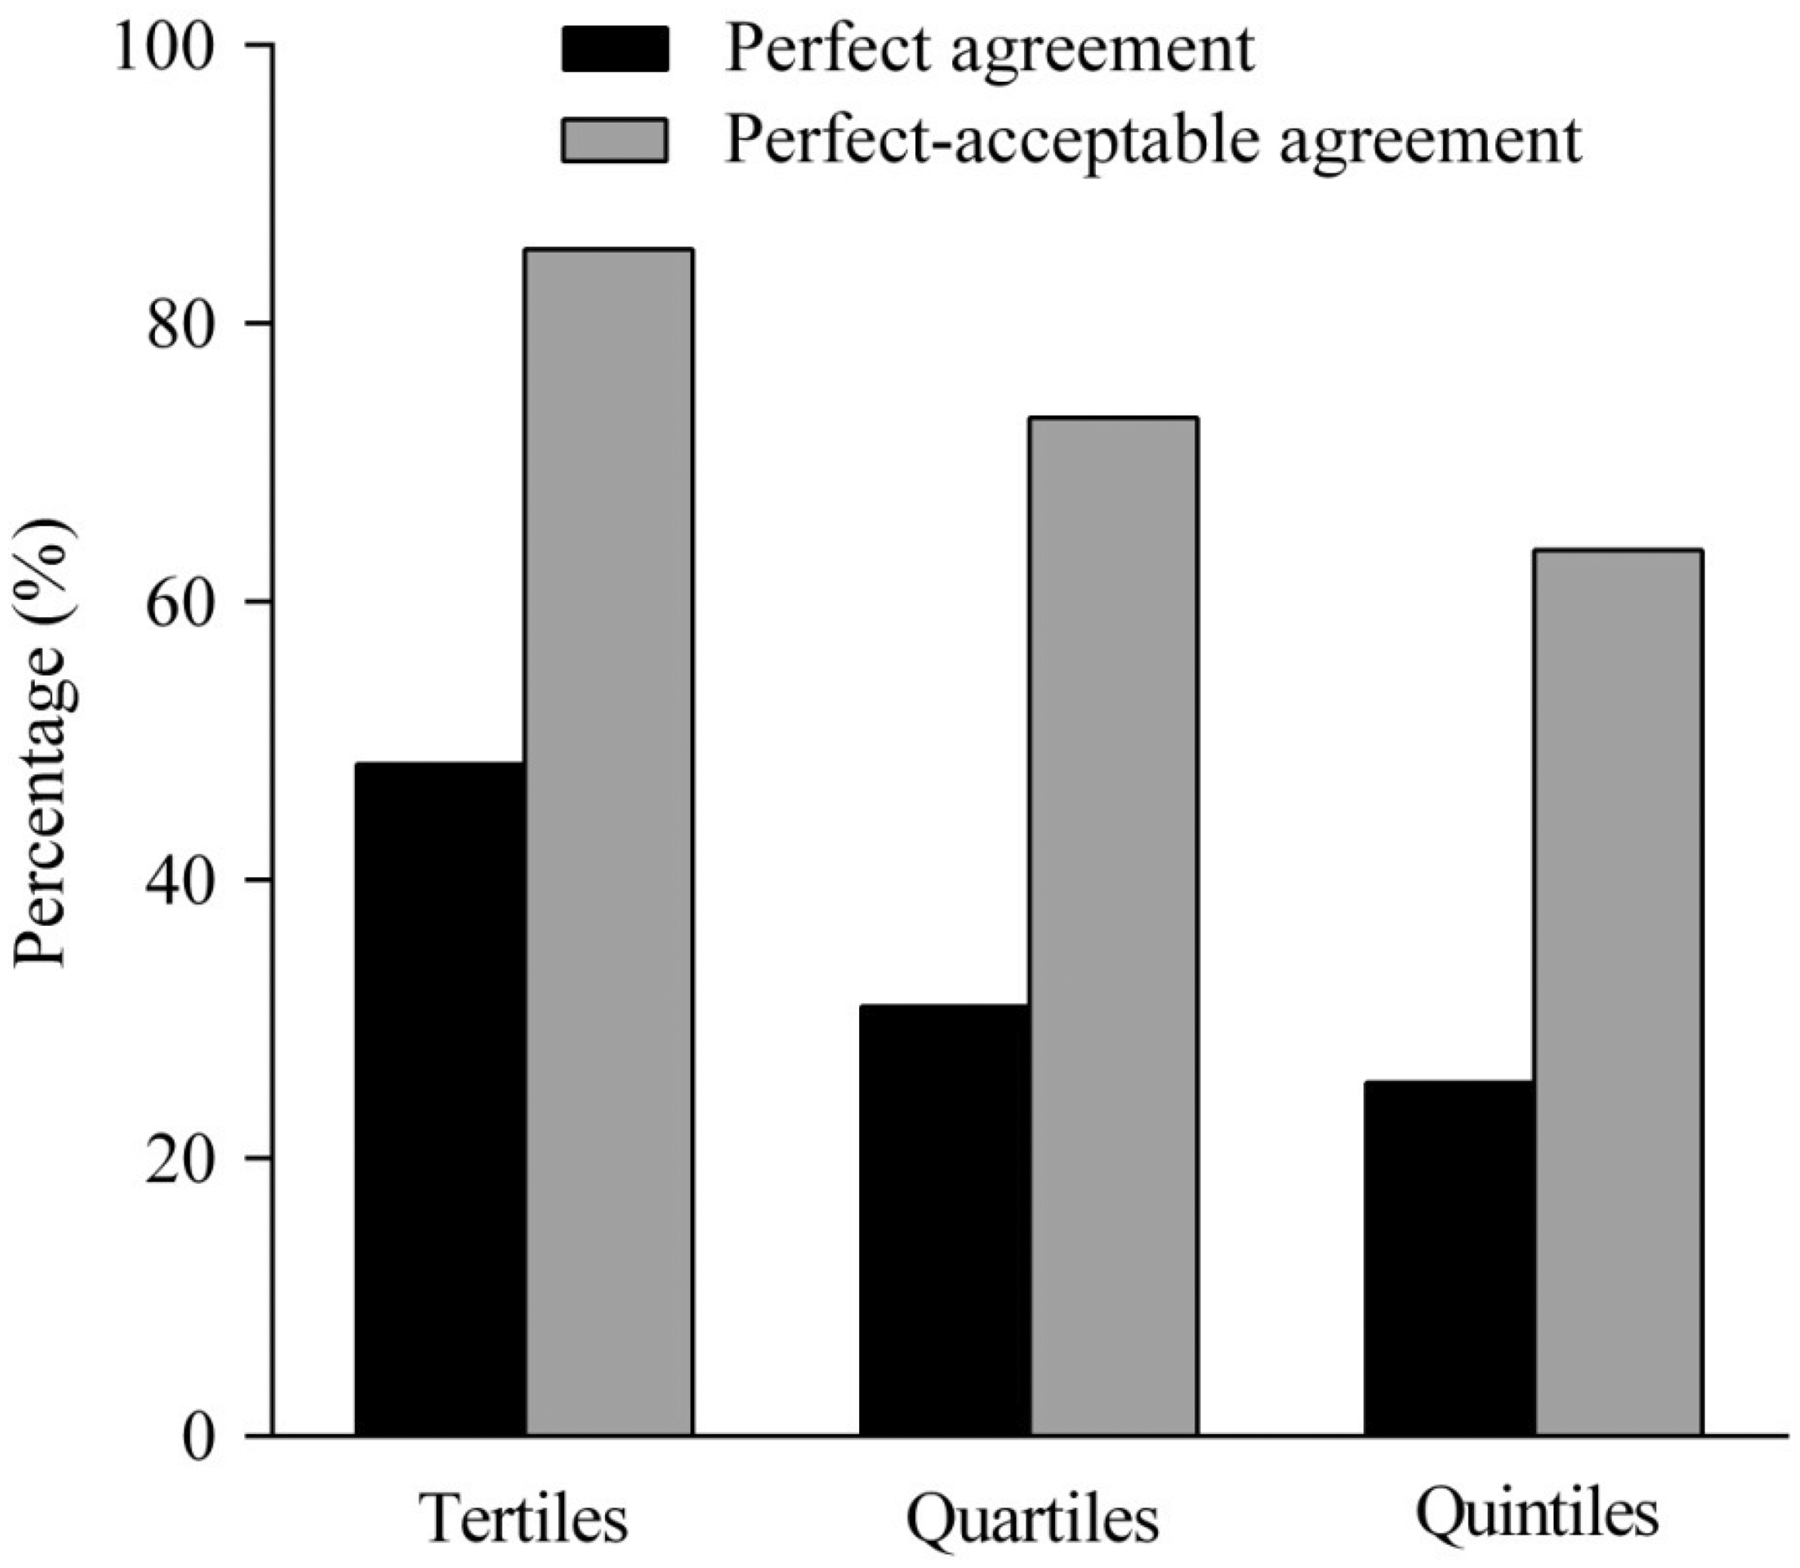
Discussion
Our main results showed that usual gait speed as assessed by the 8-feet test in laboratory conditions was moderately correlated with gait speed measured by the IDEEA monitor in usual daily living. The 8-feet test tended to overestimate gait speed as compared with the IDEEA monitor, but classification agreement between both methods was fair. To date, the 8-feet test has shown high reliability (intraclass correlation coefficient > 0.7) in previous reports (Mendoza et al., 2010). Most validity research of the 8-feet test have focused on predictive validity (Brach et al., 2007; Cesari et al., 2008; Gómez et al., 2013; Guralnik et al., 1994, 2000; Penninx et al., 2000; Perera et al., 2016; Studenski et al., 2003; Volpato et al., 2011) by examining its association with health outcomes such as basic activities of daily living (Guralnik et al., 2000; Perera et al., 2016), mobility disability (Brach et al., 2007; Studenski et al., 2003), and mortality (Cesari et al., 2008; Gómez et al., 2013; Guralnik et al., 1994; Studenski et al., 2011; Volpato et al., 2011). Hence, both reliability and predictive validity of this test have been examined, while our findings are the first to examine and find acceptable concurrent criterion validity of usual gait speed by the 8-feet test, an important demonstration, given references in the scientific literature to a need for a high validity comparisons of field- and laboratory-based physical performance test measures (Mendelsohn et al., 2007; Mijnarends et al., 2013; Peel, Kuys, & Klein, 2013; Roberts et al., 2011; Tveter et al., 2014).
Our finding of modest concurrent criterion validity when comparing the 8-feet test and the IDEEA monitor for assessing usual gait speed may be because of several factors. First, the Guralnik et al. (1994) protocol used in performing the 8-feet test and related longer tests of usual gait speed requires the following instruction: “Walk at your usual speed.” Other standardized protocols instruct the participant to select a “comfortable,” “habitual,” “normal,” or “preferred” pace to perform these tests (Peel et al., 2013). With either instructions, participants must first recall and cognitively adjust their pace, possibly differentially affecting the participant’s self-selected gait speed (Beauchet, Allali, Launay, Herrmann, & Annweiler, 2013; Deshpande, Metter, Bandinelli, Guralnik, & Ferrucci, 2009). Of note is that these usual gait speed assessments do not evaluate optimal physical performance, for which there are other available fast gait speed tests (Peel et al., 2013).
Second, physical and functional status may also affect the validity of the 8-feet test (Fritz & Lusardi, 2009). For example, the highest correlation between the 8-feet test and the IDEEA monitor was obtained among participants in the obese group (ρ = .49) and may be because of mobility limitations of these individuals (Davison, Ford, Cogswell, & Dietz, 2002). That is, while participants who are obese are able to walk at the same speed as other participants, they may be less comfortable and less inclined to do so in field than in laboratory settings. Therefore, their range of self-selected speed is more limited, and they choose a slower speed for their usual gait in daily living. Third, overestimation of usual gait speed with the 8-feet test could be related to the length of the test. Older adults may perform this test at a faster pace, knowing that the short distance will enable a faster speed. Thus, comparing shorter and longer tests (e.g., 4, 5, 6, and 10 meters) against a criterion-related measure would allow an evaluation of whether longer tests show greater (agreement) validity than the shorter alternatives. In a recent study, both a 4-meter and 10-meter walk test showed excellent test–retest reliability, with the mean difference in gait speed between them small; however, the authors indicated that the 4-meter and 10-meter walk tests were not interchangeable and the longer test should be used to obtain the most valid clinical assessment (Peters et al., 2013).
When examining the absolute agreement with the Bland–Altman method, we found a weak but significant systematic bias in that the 8-feet test overestimated usual gait speed in slower participants and, in contrast, underestimated usual gait speed among faster participants ρ = −.20, p = .011). Again, this may be because of the short duration of the 8-feet test, enabling slower participants to briefly show a higher speed they are not likely to sustain in daily living and faster participants to self-select a lower gait speed than they might typically use. This issue is especially important when classifying slowest and fastest participants according to the 8-feet test results (see Figure 2). Another interesting finding has been that the correlation between the 8-feet test and the IDEEA monitor was lowest in women (ρ = .19, p = .076). Some sex-specific features might be affecting this low validity, such as differences in anthropometric characteristics (e.g., height), cognitive processing (e.g., self-perception), or biomechanical factors (e.g., gait patterns), but unfortunately, we cannot clarify this issue in this study. It must be noted that some studies have also obtained lower predictive validity in older women than older men, when they have been correlated the tests with health outcomes such as risk of falls, disability, and death (Cooper, Kuh, & Hardy, 2010; Fujita et al., 1995; Liu et al., 2016; Shimada, Makizako, Doi, Tsutsumimoto, & Suzuki, 2015; Studenski et al., 2011); these authors speculated that this may be because there are fewer adverse health events, disability, and overall mortality rates among women compared with men. Taken together, more specific research on the concurrent and predictive validity of gait speed test in women is needed.
Among our study’s limitations is that our participants comprised a convenience sample, including mainly high-functioning older adults. Although we performed stratified data analyses to examine validity in different subgroups of older adults and thereby improve generalizability inferences, further research is needed among older adults with cognitive impairment, age-related disabilities (e.g., pain, agility, mobility, instrumental activities of daily living, and basic activities of daily living), those with specific chronic conditions, or the influence of factors such as institutionalization or the size of the participant’s home. Also, we used a single standardized protocol for the 8-feet test (Guralnik et al., 1994), while different protocols with this test (e.g., acceleration and deceleration zones, verbal instructions, or timing methods) may influence the results (Graham, Ostir, Fisher, & Ottenbacher, 2008; Graham, Ostir, Kuo, Fisher, & Ottenbacher, 2008; Peters et al., 2013; Sustakoski, Perera, VanSwearingen, Studenski, & Brach, 2015). It would be interesting, for example, to examine this tests’ validity when using a preacceleration zone prior to the end line, or a longer deceleration zone (Graham, Ostir, Kuo, et al., 2008; Sustakoski et al., 2015). Finally, in considering the comparability of the 8-feet test and related measures of longer distances for usual gait speed testing to the IDEEA monitor, researchers and clinicians must consider the additional data provided by the IDEEA (e.g., amount of walking activity during daily living). Knowing not just how fast but whether or not and for what percentage of time older adults actually engage in walking in their natural environments is critically important additional information for understanding the degree to which qualitative aspects of walking (e.g., flexibility and comfort while walking) influence independence and mobility. The IDEEA monitor was an appropriate gold standard in this study, not only because of its accuracy in measuring gait speed but also because it is a more complete assessment of walking, and it is designed for the natural versus laboratory environment.
Footnotes
Authors' Note
F. Rodríguez-Artalejo and D. Martinez-Gomez are also affiliated to IMDEA Food Institute, CEI UAM + CSIC, Madrid, Spain.