






Abstract
This study evaluated the relationships between trait stress, Hoffman reflex, and performance among 36 healthy amateur male athletes. We first obtained a trait stress questionnaire from participants and then assigned them to high- and low-stress groups. We next recorded Hoffman reflex data from the soleus and lateral gastrocnemius muscles and then examined their athletic performance on testing protocols separated by a 72-hour washout period. Performance testing utilized vertical jump height, 20 -m sprint time, and standing stork tests. There were significant correlations between (a) the standing stork test, vertical jump height, and trait stress and (b) Hmax/Mmax ratios, threshold intensity (Hth), the intensity of the Hmax, and the intensity of the Hlast. Hth, the intensity of Hmax, and the intensity of Hlast were significantly higher among the low-stress compared with the high-stress participant groups (p < .05), despite participants’ similar training history. We suggest that self-perceived psychological stress affects performance through neural adaptation.
Introduction
Sport injury is among the most traumatic reasons an athlete might restrict his or her sport participation for a long time (Lavallee & Flint, 1996). Many factors can contribute to athletic injury, including environment, equipment, and the athlete’s physical condition (Andersen & Williams, 1988). Psychological factors such as stress and anxiety play an important role in frequency and extent of injury (Andersen & Williams, 1988; Lavallee & Flint, 1996; Williams & Andersen, 1998), coping behavior, and athletic success (Krohne & Hindel, 1988). Andersen and Williams (1988) proposed a model of stress and athletic injury to interpret all possible intervening factors, noting that low stress and anxiety help to diffuse negative attentional and physiological responses and vice versa (Andersen & Williams, 1988). Stress/anxiety can be divided into both state and trait forms (Andersen & Williams, 1988; Spielberger, Sarason, & Defares, 1985). Trait anxiety can be defined as a relatively stable intraindividual personality characteristic, while state anxiety represents transient feelings of insecurity that vary intraindividually in intensity in response to external or internal sources of threat (Krohne & Hindel, 1988; Meijer, 2001; Spielberger et al., 1985). Trait stress can be determined using a variety of questionnaires, including the perceived stress scale (PSS; Cohen, Kamarck, & Mermelstein, 1983). One of the most common perceived stress scales, the PSS, was introduced by Cohen et al. (1983) and Spielberger et al. (1985) for measuring the current levels of experienced stress (Cohen et al., 1983; Khalili, Sirati Nir, Ebadi, Tavallai, & Habibi, 2017). Items within the PSS ask the respondent to indicate feelings and thoughts during the last month (Khalili et al., 2017); this instrument has three scoring levels, including low (0–13), moderate (14–26), and high (27–40; Cohen, Kamarck, & Mermelstein, 1994). As detailed later, the PSS-10 has been reported to have high validity and reliability for evaluating stress in sports and nonsports settings (Chiu et al., 2017; Cohen et al., 1983).
Trait stress and coping strategy were proposed as predictors of athletic performance in sports-specific activities (Krohne & Hindel, 1988). Stress may impact athletic performance through changes in muscle tension levels. Although this negative effect has been considered in some studies (Andersen & Williams, 1988; Williams & Andersen, 1998), underlying neural mechanisms for it are still debated. From a motor control prospective, previous studies focused on cortical brain functioning, with little known about how spinal mechanisms operate under psychological pressure (Tanaka, 2015). Neuronal excitability has also been examined by recording Hoffman reflex (H-reflex) muscle data, elicited by stimulation of the peripheral nerves. Most of these studies focused on state stress with little known about any effect of trait stress on motor neuron (MN) excitability. For example, researchers reported that H-reflex was facilitated by a noxious painful stimulus (Willer, 1980; Willer & Albe-Fessard, 1980; Willer & Ernst, 1986), consumption of caffeine (Behrens et al., 2015; Eke-Okoro, 1982), and viewing pictures that differed in their positive and negative connotations (Moulder, Bradley, Requin, & Lang, 1995). Others have reported that the H-reflex was not influenced by state anxiety or the release of endogenous opioids (Avela, Kyrolainen, Komi, & Rama, 1999; Bulbulian, 2002; Motl, O’Connor, Boyd, & Dishman, 2002; Motl, O’Connor, & Dishman, 2004; Raglin, Koceja, Stager, & Harms, 1996). Other researchers showed that psychological pressure during a balance task reduced peak to peak amplitude of the H-reflex (Kawaishi & Domen, 2016; Rahimi, 2013; Tanaka, 2015) but did not affect maximum M-wave amplitude (Tanaka, 2015).
The H-reflex has been used to measure the effectiveness of synaptic transmission between the Ia afferents and alpha MN. The H-reflex loop can be influenced from both postsynaptic and presynaptic inputs from the higher central nervous system (Henneman, Clamann, Gillies, & Skinner, 1974; Henneman, Somjen, & Carpenter, 1965). The magnitude of the H-reflex is known to be modulated by many central factors such as psychological state and by peripheral factors such as cutaneous and other receptors (Bonnet, Decety, Jeannerod, & Requin, 1997; Tucker, Tuncer, & Türker, 2005). It is well understood that an individual’s maximal Hmax/Mmax ratio changes significantly with variations in psychological pressure and postural conditions (Abadi, Rahimi, Naiemi, & Delavar, 2012; Chalmers & Knutzen, 2002; Tucker et al., 2005; Rahimi, 2013). To study alpha MN excitability, although time consuming, it is very helpful to record the H-reflex recruitment curve from a muscle as described by Riann M. Palmieri, Ingersoll, and Hoffman (2004). The recruitment curve is obtained by gradually increasing stimulation intensity to the nerve from zero to a higher intensity until the maximum amplitude of the direct motor response (M-response) is reached (Bagheri et al., 2017; Palmieri et al., 2004). The H-reflex recruitment curve obtained from a muscle has some important parameters such as threshold, intensity required to record both the maximum H-reflex (Hmax) and the final H-reflex (Hlast), and the ascending and descending slope of the recruitment curve (Bagheri et al., 2017; Bagheri, Sarmadi, & Torkaman, 2013). It can provide essential information about fast and slow MN behavior (Palmieri, Hoffman, & Ingersoll, 2002; Palmieri et al., 2004; Tucker et al., 2005). Previous studies demonstrated that most of these variables have high reliability and the sensitivity to evaluate MN excitability (Bagheri et al., 2013; Kipp, Johnson, & Hoffman, 2011; Palmieri et al., 2002, 2004; Tucker et al., 2005).
Performance analysis is firmly positioned as an integral part of the coaching process (Mackenzie & Cushion, 2015). Among the most widely performed movements that may be used to assess athletic performance are the vertical jump, 20 -m sprint time, and standing stork test (Asadi, 2016; Dobbs, Gill, Smart, & McGuigan, 2015; Hughes & Bartlett, 2002; Mackenzie & Cushion, 2015). Analysis with these tests can help establish whether there is a causal relationship between performance on these tasks and competition-based sport performance to predict match outcomes (Mackenzie & Cushion, 2015). Similarly, according to the model of stress and athletic injury (Andersen & Williams, 1988; Williams & Andersen, 1998), these performance measures may be used to evaluate whether performance and injury risk vary as a function of high-stress physiological response. To date, research has not established a clear relationship between specific performance test variables, trait stress, and a spinal mechanism associated with physiological stress. To the best of the authors’ knowledge, no published study has yet evaluated the specific relationship between (a) athletes’ trait stress, (b) dynamic balance ability and vertical jump and sprint performances, and (c) underlying spinal mechanism reflections of physiological changes through H-reflex recruitment curve parameters. Thus, this experiment was designed to reveal whether H-reflex recruitment curve parameters and performance differ among athletes with different levels of trait stress. Study questions were as follows:
Is there a correlation between H-reflex recruitment curve parameters and athletes’ performance? Is there a correlation between H-reflex recruitment curve parameters and athletes’ trait stress? Is there a difference in H-reflex recruitment curve parameters and performance in groups of athletes with high versus low trait stress?
Method
Participants
We undertook a correlational study approved by the medical ethics committee of Tarbiat Modares university (ethical approval number: 5299424). We conducted the study in our electrophysiology laboratory in the school of medical sciences. Through advertisements on bulletin boards and verbal requests at the university, we recruited a convenience sample of 40 healthy, male, amateur soccer players, controlling for potentially confounding variables of age, gender, and body mass index (BMI) through limiting inclusion criteria as follows: (a) good physical health, (b) age between 22 and 35 years, (c) men only (MN excitability can be influenced during the luteal phase of the menstrual cycle in women; Casey et al., 2016; Murata et al., 2014), (d) BMI of 18.5 to 24.9, (e) engagement in regular exercise three days per week for the past two years (Gruber et al., 2007; Taube et al., 2007; Trimble & Koceja, 1994), and (f) low- and high-stress scores (defined as below 13 and above 27, respectively, according to Cohen et al.,1983; Cohen et al., 1994; Khalili et al., 2017). Exclusion criteria included (a) having back pain and musculoskeletal pain during the past two years, (b) sedative use in the last six months, (c) addiction to alcohol and cigarettes (Gruber et al., 2007; Taube et al., 2007; Trimble & Koceja, 1994), (d) fractures of the lower limbs, (e) consumption of any drugs for stress and anxiety in the past six months (Gruber et al., 2007; Taube et al., 2007; Trimble & Koceja, 1994), (f) having moderate PSS stress scores (between 13 and 27, according to Cohen et al., 1983), and (g) any regular drug or caffeine consumption (Behrens et al., 2015; Eke-Okoro, 1982; Motl & Dishman, 2004). Study enrollment took place between March and December 2016. We calculated the needed participant sample size for sufficient statistical power using the formula from Kraemer and Blasey (2015). To achieve 80% statistical power and a confidence level of 95% with an alpha level of p ≤ .05 as significant and an expected correlation coefficient (r) of .6, we determined that 40 participants were required to compare H-reflex recruitment curve parameters and performance tests between high- and low-stress groups. Group sample size calculations suggested a need for 15 participants per group (Kraemer & Blasey, 2015). However, to allow for participant attrition and increased precision, we recruited 20 participants in each group; a total of 36 participants in high-stress (n = 19) and low-stress (n = 17) groups completed the study. We explained to participants the purpose of the study and the examination procedures involved in this project, and we obtained informed written consent from all participants.
Procedure
Assessment of stress
We gave participants a trait stress questionnaire to complete, and a clinical psychologist with a master’s degree and more than 10 years of clinical experience evaluated the completed questionnaires. We utilized the PSS (Cohen et al., 1983) with 10 items graded on a 5-point scale (never = 0, low = 1, medium = 2, high = 3, and very high = 4). The PSS has three scoring levels of low (0–13), moderate (14–26), and high (27–40; Cohen et al., 1994), intended to measure self-perceived trait stress over the past month. Minimum and maximum participant scores ranged from 0 to 40. Cohen et al. (1983) obtained internal consistency reliability coefficients on the PSS between .84 and .86. PSS has been correlated meaningfully with life events, depression diagnosis, social anxiety, and low life satisfaction (Cohen et al., 1983, 1994). Ghorbani et al. (2002) reported Cronbach’s alpha of .86 and .81 for American and Iranian samples, respectively. Chiu et al. (2017) evaluated the validity of PSS-10 in athletes compared with nonathletes and reported that PSS-10 is a useful tool for assessing perceived stress in either sports or nonsports settings. After collecting and analyzing the questionnaires, we included participants who had low and high trait stress on the PSS and excluded those with moderate stress scores.
H-reflex recruitment curve assessment
Participants were instructed to refrain from performing any strenuous exercise in the 72 hours prior to taking measurements (Rochcongar, Dassonville, & Le Bars, 1979; Tanaka, 2015; Taube et al., 2007). A PhD candidate in physiotherapy, blinded from the participants’ initial stress assessment results, collected H-reflex recruitment curve data from each participant. Participants were in the prone position, and the ankle was placed outside the edge of the bed with a pillow placed under the leg to flex the knee 15–20°. The ankle was also placed at 10° plantar flexion, and the subject’s hands were placed over each other, with the forehead over the hands (see Figure 1).
Subject position during H-reflex recording.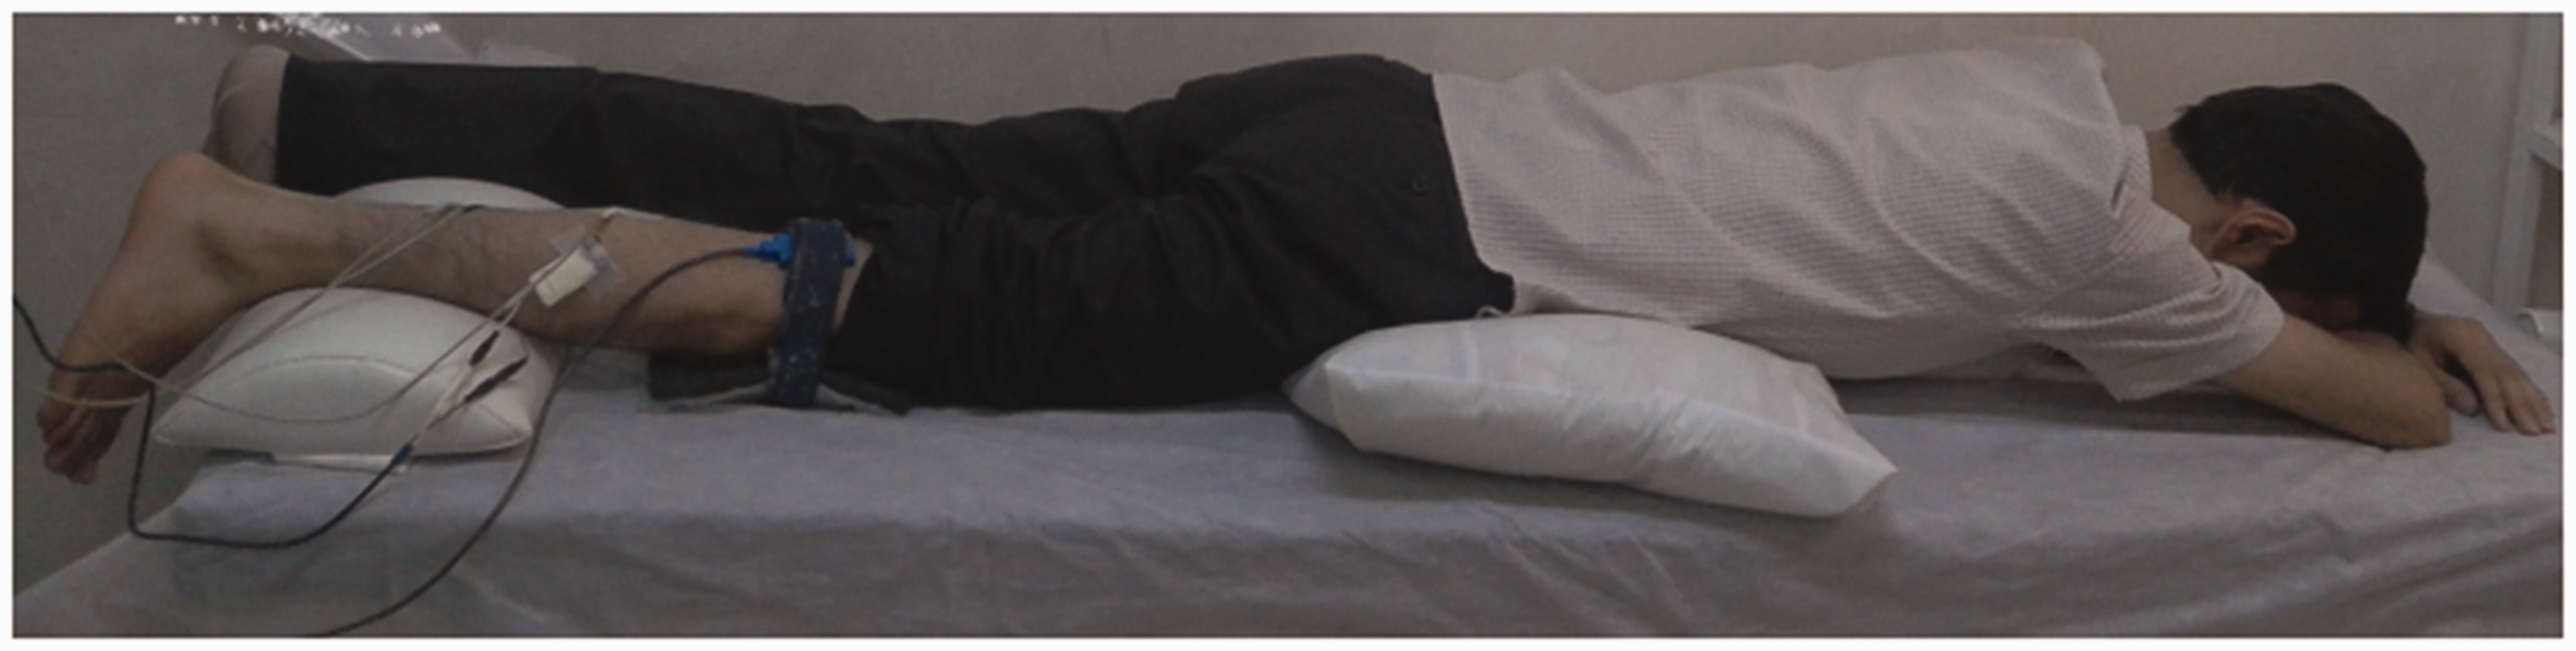
Calf muscle excitability was evaluated by simultaneously evoking the H-reflex of the soleus and lateral gastrocnemius muscles (Bagheri et al., 2017). To record the H-reflexes, we used a computer-controlled stimulator with an isolator (Nihon Kohden ss-104j, Japan) and a Neuro-MEP system (Neurosoft, Russia). Electromyographic (EMG) activity was amplified, band-pass filtered at 5 Hz to 10 kHz and sampled at 4 kHz. After careful preparation of the skin (shaving, abrading, and cleaning with alcohol) in order to obtain low impedance (<10 kΩ), we placed a bipolar surface electromyography recording electrode (Duo-Trode® silver/silver chloride with a 12.5-mm active surface and 20-mm interelectrode distance) along the mid-dorsal line of the leg, on the belly of the soleus, about 4 cm below the gastrocnemii–Achilles tendon junction (Sarmadi, Firoozabadi, Torkaman, & Fathollahi, 2004; Tucker et al., 2005). We recorded lateral gastrocnemius eletromyography with another bipolar recording electrode (Duo-Trode® silver/silver chloride, with a 12.5-mm active surface and 20-mm interelectrode distance). To obtain an accurate placement of the recording electrode over the lateral gastrocnemius, we mapped an imaginary line from the mid-popliteal fossa connecting to the central point of the medial malleolus. In the aforementioned imaginary line, from a quarter below the popliteal crease, we located the recording electrode about 4–6 cm lateral to the midline of the leg at an angle of 45° and parallel to the lateral gastrocnemius fibers (Sarmadi et al., 2004). We placed the ground electrode over the head of the fibula (Alrowayeh, Sabbahi, & Etnyre, 2005). To ensure accurate stimulation, we utilized a bipolar configuration electrode to find the position of the tibial nerve in the popliteal fossa. After establishing this position by evoking a response in the calf muscles, we fixed the stimulating electrode with a strap over the tibial nerve. The stimulus artifacts were removed using a custom-made artifact-suppressing amplifier.
Initially, each experimental session created the soleus and lateral gastrocnemius H-reflex recruitment profiles for every participant. These profiles determined the pulse intensity necessary for eliciting three H-reflex amplitudes: (a) the final H-reflex when the maximum M-response was achieved (last intensity), (b) the maximum H-reflex amplitude (intensity of Hmax), and (c) the H-reflex equal to 5% of the maximum H-reflex (threshold or Hth). These intensities were used throughout the latter part of the experiment to obtain the H-reflex recruitment curves. Crucially, we used a stimulating protocol (steady increments of 0–2 mA) to obtain at least 16 and 14 real data points for driving the soleus and lateral gastrocnemius recruitment curves, respectively. Every 10 seconds, a 1-millisecond rectangular square wave pulse was delivered from a computer through the isolator and was then applied percutaneously to the tibial nerve. Electrical stimuli progressively increased from below the threshold level until the maximum motor responses (Mmax) were achieved and plateaued in both soleus and gastrocnemius.
Furthermore, to map the H-reflex recruitment curve, at least 48 stimuli in the 16 intensity levels (three stimulations for each intensity level), which included the three target intensity levels of both soleus and lateral gastrocnemius, were delivered to the nerve. A minimum of 24 H-reflexes for the upsloping portion and 24 H-reflexes for the descending portion were obtained for the soleus recruitment curve. As the lateral gastrocnemius has a higher threshold and lower last intensity compared with the soleus, its recruitment curve is drawn within the soleus MN recruitment curve. To obtain 42 H-reflexes from the lateral gastrocnemius, 21 stimuli for the upsloping portion and 21 stimuli for the descending portion were imported. Eventually, the soleus and lateral gastrocnemius H-reflex recruitment curves (H amplitudes and related intensity levels) were obtained using 16 and 14 points, respectively. The intensity stimulation was recorded and stored simultaneously with the EMG data. Moreover, the EMG data were converted from an analog to a digital signal and stored for further analysis by CED Signal software. Room temperature was maintained between 25°C and 27°C throughout the experimental conditions.
Performance assessment
The athletes were familiarized with the testing protocols by a certificated strength and conditioning coach. Each subject was instructed and verbally encouraged to give maximal effort during all tests. Participants performed a standardized warm-up, consisting of jogging, dynamic stretching, and a series of increasing intensity sprints for 10 minutes before testing. No static stretching exercises were allowed before any test. Following a 2-minute rest interval between warm-up and performance testing, participants performed all tests three times each in a randomized order over three days 72 hours apart to decrease any fatigue effect (Asadi, 2016). Previous studies demonstrated high intraclass correlation coefficient (ICC) values for these performance tests (ICC for vertical jump: .95, 20 -m sprint: .97, and standing stork test: .99; Asadi, 2016; Latorre Roman et al., 2015).
Vertical jump
We measured vertical jump with a standing Vertec measuring device. Participants were asked to stand below the device and extend one arm over the head, attempting to reach his dominant hand as high as possible. Then, we obtained participants’ standing reach height. Participants were asked to jump as high as possible three times, and we recorded the best of their jump heights. Vertical jump height was calculated by subtracting the standing reach height from the jump height (Asadi, 2016; Dobbs et al., 2015).
Twenty-meter sprint
The sprint test was performed on an indoor track. We recorded time with a stopwatch. The sprint-running test consisted of two maximal sprints of 20 m, with a 120-second rest period between each sprint. In 20 -m sprint, the starting position was standardized to a still, split standing position with the toe of the preferred foot forward and behind the starting line. Sprint start and timing were triggered by a random sound. On “GO” command, the athletes ran the 20 -m track with maximal effort, as fast as possible (Asadi, 2016).
Standing stork test
Initially, participants performed 10 minutes of warm-up activity and were then asked to stand comfortably on both feet with their hands on their hips. After the “GO” command, they lifted the left leg and placed the sole of the left foot against the side of the right kneecap. The participants were asked to hold this position for as long as possible. The test was stopped when the participants’ left heel touched the ground or the left foot moved away from the right kneecap. Three tests were performed for this test, and the longest time was recorded (Asadi, 2016).
Data Analyses
The H-reflex recruitment parameters such as peak-to-peak H-reflex amplitude and related intensity level were imported into the custom LabView software (National Instruments Corporation, Austin, TX, USA). Each recruitment curve was mapped using 16 and 14 data points from the soleus and lateral gastrocnemius, respectively. The upsloping portion of the recruitment curve was fixed to the seven points for the lateral gastrocnemius and eight points for the soleus from the first H-reflex, which appeared in EMG trace through the maximum H-reflex. The descending portion was fixed to the seven points for the lateral gastrocnemius and eight points for the soleus from the maximum H-amplitude through the last H-reflex amplitude. The 14th and 16th data points represented the stimulus intensity that elicited Mmax of lateral gastrocnemius and soleus, respectively. Furthermore, the peak-to-peak amplitudes of the Hmax and the Mmax were extracted from each recruitment curve data, and the Hmax/Mmax ratio was calculated from each test condition. Moreover, Hth, ascending (Hslp) and descending slopes of the H-reflex, and the first (first Hslp) and last three points (last Hslp) fixed to the ascending slope of the H-reflex recruitment curve were extracted from the recruitment curve data. Hth was defined as the value where the recruitment curve exceeded 5% of the peak normalized reflex response (i.e., Hmax/Mmax). Three components of recruitment curves consist of Hth, ascending slope of H-reflex, and Hmax/Mmax ratio (functional component principal) had excellent intersession reliability in previous research (Bagheri et al., 2013; Kipp et al., 2011). Other recruitment curve parameters had shown good intersession reliability (Bagheri et al., 2013).
Data analyses were performed by SPSS version 20 (SPSS Inc., Chicago, IL, USA). The critical level for statistical significance was set at p < .05. H-reflex recruitment parameters, performance tests, and stress scores were analyzed using the Kolmogorov–Smirnov z test for normal distribution. Correlation between the H-reflex recruitment curves and the stress scores and performance tests were analyzed using the Pearson correlation coefficient of variation. Stress scores were analyzed so that participants could be categorized into low and high trait stress groups as defined by these scores and explained in the literature (Cohen et al., 1983; Ghorbani, Bing, Watson, Davison, & Mack, 2002; Khalili et al., 2017). Scores of 27 or higher were considered high stress, while scores of 13 or lower were considered low stress (Cohen et al., 1983; Ghorbani et al., 2002; Khalili et al., 2017). We used one-way analysis of variance to analyze the H-reflex recruitment curve parameters and performance tests between high- and low-stress groups.
Results
Demographic Characteristics of Participants.
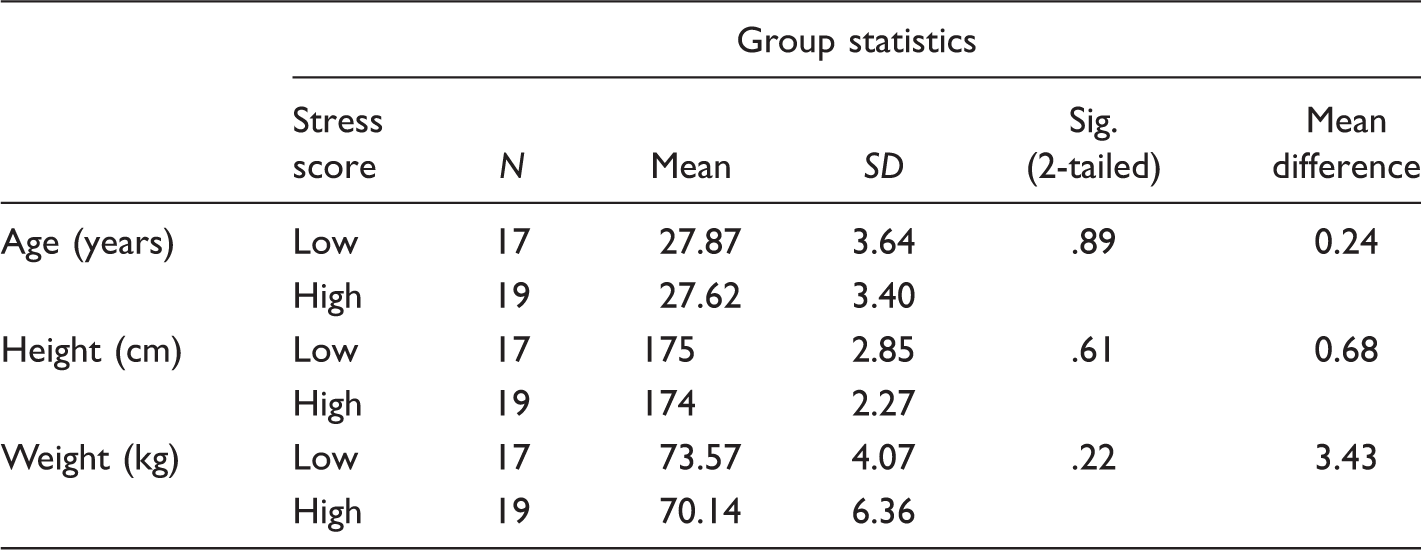
Sig. = significance; SD = standard deviation.
Correlation of H-Reflex Recruitment Curve Parameters With Stress Scores and Performance Tests
Trait stress was significantly and positively correlated with H/M of both soleus (r = .57, p = .04) and lateral gastrocnemius (r = .84, p < .001) muscles. In addition, there was a negative correlation between trait stress level and Hth, the intensity of the Hmax, and the intensity of the Hlast (soleus; r = −.72, r = −.66, r = −.65 and p < .05 respectively, lateral gastrocnemius; r = −.72, r = −.66, r = −.65 and p < .05, respectively). Vertical jump height was significantly negatively correlated with the gastrosoleus H/M ratios (soleus; r = −.65, p = .01; lateral gastrocnemius; r = −.82, p = .001), the ascending and descending Hslp of gastrosoleus. Also, this parameter was negatively correlated with Hth, the intensity of the Hmax and Hlast of the soleus, and Hth of the lateral gastrocnemius. The 20-meter sprint test did not correlate significantly with H-reflex recruitment curve parameters. The standing stork test was significantly negatively correlated with the H/M ratios of the soleus and the lateral gastrocnemius (r = −.84, p = .00; r = −.63, p = .01, respectively), and significantly positively correlated with Hth, the intensity of the Hmax and intensity of the Hlast for both soleus and lateral gastrocnemius.
Comparison of Trait Stress Scores and Performance Tests for Participants in High- and Low-Stress Groups
Comparison of the Stress and Performance Between Groups.
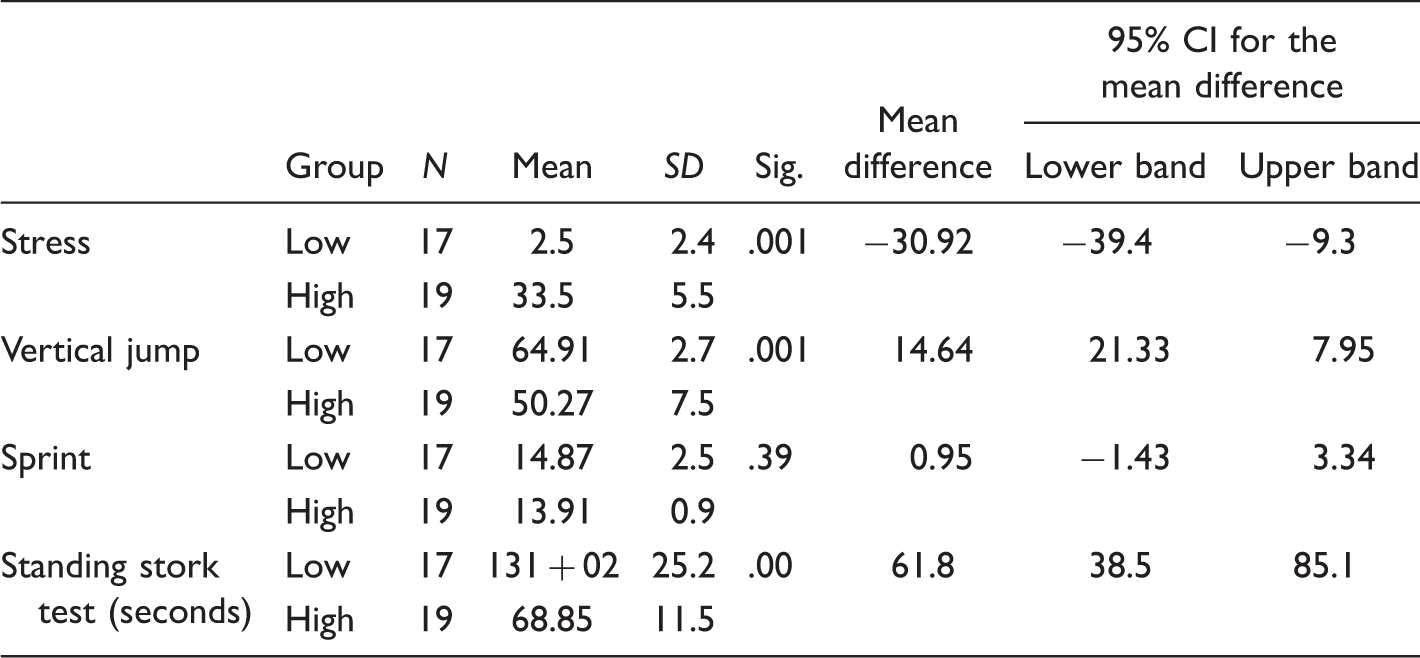
CI = confidence interval; SD = standard deviation.
Comparison of the Soleus and Lateral Gastrocnemius H-Reflex Recruitment Curve Between Groups
High-stress participants were found to have a higher Hmax/Mmax ratio (high-stress mean M = 62.24, SD = 17.00; low-stress M = 30.90, SD = 12.52; p = .003). Significant differences were also found for Hth (high-stress M = 6.58, SD = 1.34; low-stress M = 10.12, SD = 1.75; p = .001), required intensity to obtain of Hmax (high-stress M = 8.38, SD = 1.98; low-stress M = 13.28, SD = 1.75; p < .001) and the Hlast (high-stress M = 12.48, SD = 4.08; low-stress M = 20.68, SD = 4.65; p = .004) of the soleus. Moreover, high-stress participants were found to have a higher Hmax/Mmax ratio (high-stress M = 69.73, SD = 29.60; low-stress M = 31.39, SD = 17.16, p = .018). Significant differences were also found for Hth (high-stress M = 6.77, SD = 1.48; low-stress M = 10.15, SD = 1.72; p = .002), required intensity to obtain of Hmax (high-stress M = 8.08, SD = 1.50; low-stress M = 12.74, SD = 2.50; p = .001) and the Hlast (high-stress M = 9.54, SD = 1.47; low-stress M = 19.08, SD = 4.92, p = .000) of the lateral gastrocnemius. However, the overall ascending and descending slope, the initial and final 3 points fitted to the ascending H slope of the H-reflex recruitment curve of the soleus and lateral gastrocnemius were not significantly different between high- and low-stress participants.
Figure 2 illustrates the superimposed soleus H-reflex recruitment curves elicited from participants with high and low stress. The peak-to-peak amplitude of the H-reflex in the high-stress participants was greater, relative to the low-stress participants. The recruitment curve in high-stress participants was placed at the left, compared with the low-stress participants, meaning there was higher MN excitability among high-stress participants.
The superimposed H-reflex recruitment curves of the soleus in high- and low-stress subjects. Blank squares represent the data points of soleus recruitment curve in high-stress participants and filled circles represent the data points of soleus recruitment curve in low-stress participants.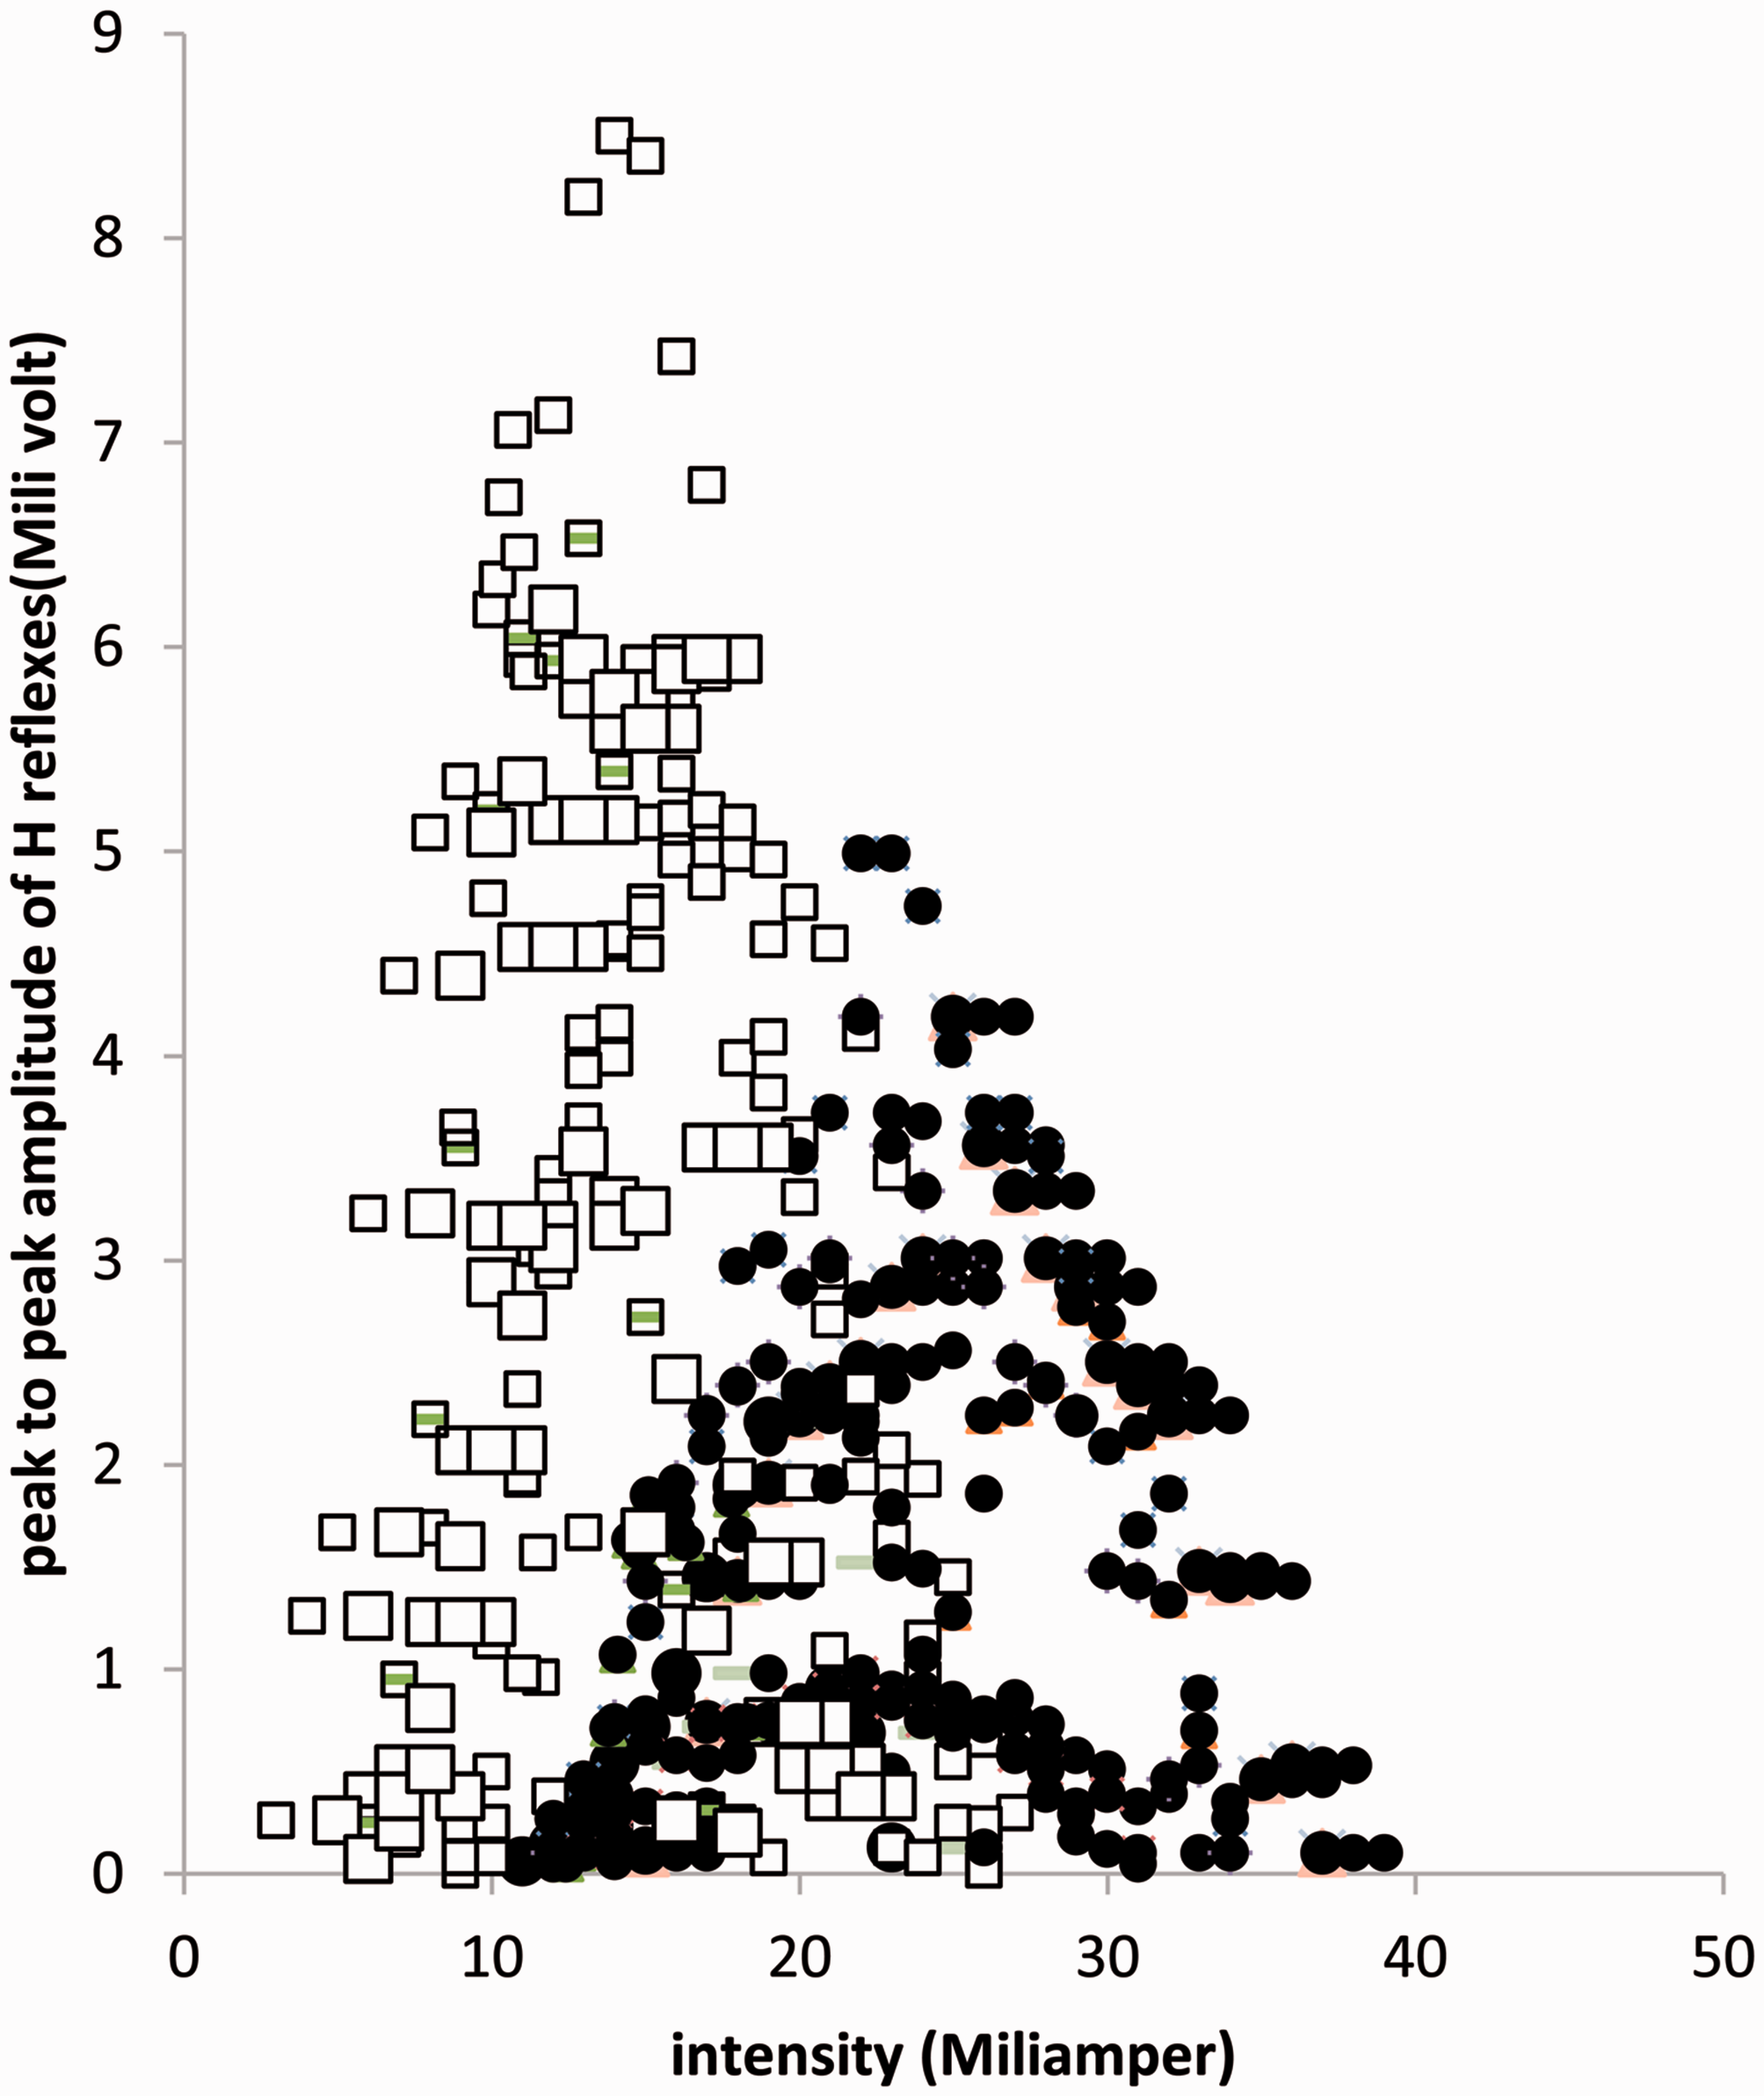
Discussion
Trait stress has been related to athletic performance and MN pool excitability, but past research regarding relations between stress, performance, and H-reflex has been very limited, and results of this limited research have been inconsistent and controversial. The most interesting finding of this study was that H-reflex excitability negatively correlated with vertical jump height and standing stork test results among these participants. The current study was the first to investigate the correlation between trait stress and H-reflex recruitment curve parameters. We revealed that Hth, the intensity required to record Hmax and Hlast, was negatively correlated with trait stress scores. However, the Hmax/Mmax ratio positively correlated with stress scores. Hth, the intensity of Hmax, and the intensity of Hlast were significantly lower among athletes with high trait stress compared with those with low trait stress. Hth has also been used to estimate the excitability of lowest threshold motoneurons (Kipp et al., 2011), and Hlast intensity is an indicator of the highest threshold motoneuron excitability in response to Ia-afferent activation (Bagheri et al., 2017). In this study, we compared the MN pool excitability in two athlete groups of high and low stress but found the Hmax/Mmax ratio higher in high trait stress than in low trait stress athletes. The ratio between the H-reflex and M-wave represents the percentage of depolarized motoneurons in response to Ia-afferent activation (Kipp et al., 2011). Accordingly, in our study, high-stress participants revealed a higher number of recruited motoneurons relative to low-stress participants. Previous studies revealed that patients with psychoses exhibited abnormally higher MN excitability relative to control participants (Crayton, Meltzer, & Goode, 1977; Metz, Goode, & Meltzer, 1980). John Metz et al. (1980) revealed that the MN pool is facilitated among unmedicated patients with psychoses, using the H-reflex recovery curve to measure MN excitability. A recent study demonstrated that state stress decreased the H-reflex amplitude during a balance task among healthy participants (Tanaka, 2015). They suggested that the H-reflex inhibition contributes to optimal postural control under stressful conditions. In other studies, postural threat, noxious painful stimulus (Willer, 1980; Willer & Albe-Fessard, 1980; Willer & Ernst, 1986), or caffeine experimentally induced H-reflex (Eke-Okoro, 1982), and viewing pictures that differed in their positive and negative valence (Moulder et al., 1995) also facilitated H-reflex excitability. The H-reflex facilitation seen in these studies may be a consequence of modulation from the higher central nervous system (CNS; Kukulka, 1994; Tucker et al., 2005). We approached these issues differently by comparing athletes of different levels of trait stress with respect to H-reflex modulation. Low-stress athletes had lower MN excitability, probably dependent on presynaptic inhibition as a modulating higher CNS mechanism. Although the type of stress evaluated in this study was different from previous studies, our results were similar. In addition, we demonstrated the effect of trait stress on MN excitability among athletes participating in the same sport activity.
We also found that the vertical jump and standing stork test performance of these athletes correlated strongly with their H-reflex recruitment curve parameters. Moreover, when comparing high and low trait stress groups, low-stress athletes showed better vertical jump height and standing stork time performances. Trait stress and anxiety have been correlated with coping well during athletic competition (Krohne & Hindel, 1988; Williams & Andersen, 1998). According to Spielberger, Sarason and Defares, 1985, trait anxiety is relatively stable intraindividually but varies interindividually. According to the stress–injury model, characteristics of an athlete’s personality, such as trait stress, can interact with other variables to contribute to stress response and injury risk during competition (Krohne & Hindel, 1988). While it has been hypothesized that increased muscle tension caused by trait stress increases an athlete’s injury risk and that increased muscle tension during competition and in relation to a stressful situation interferes with an athlete’s performance, evidence supporting this hypothesis has been previously limited to questionnaire-based self-reported stress (Krohne & Hindel, 1988; Meijer, 2001).
A large number of studies have evaluated the effects of different exercise regimens and sport activities on H-reflex excitability (Chalmers & Knutzen, 2002; Goode & Van Hoven, 1982; Gruber et al., 2007; Llewellyn, Yang, & Prochazka, 1990; Mynark & Koceja, 2002; Nielsen, Crone, & Hultborn, 1993; Nielsen & Kagamihara, 1993; Rochcongar et al., 1979; Taube et al., 2007; Trimble & Koceja, 1994, 2001). These studies have suggested that the type and level of activity in different exercise regimens and sport activities might have influenced the excitability of MNs in simple spinal pathways. However, the effects of trait stress on the H-reflex recruitment curve and the resulting variation in performance we observed on such parameters as vertical jump, sprint, and balance ability have not been evaluated in prior studies. Thus, our findings in this group of nonelite male same sport athletes with very similar training histories that included daily exercise in the forms of jogging and aerobic sprinting (Fry & Kraemer, 1991) represent novel contributions to this literature. These athletes’ negative correlations between MN excitability and performance on jumping and balance tasks is probably a consequence of training adaptation in both high and low participant groups (Nielsen et al., 1993; Rochcongar et al., 1979). While we expected that their similar training histories would result in similar neural adaptation and possibly similar H-reflex excitability, their different psychological conditions (i.e., high and low trait stress) might have affected their neural adaptation process in the CNS (Tanaka, 2015). Accordingly, the reduced H-reflex excitability among low-stress (vs. high-stress) athletes may represent adaptive neural changes that aid task performance. According to our results, increased trait stress and anxiety might lead to a long-standing facilitation of spinal MNs (Raglin et al., 1996; Sibley, Carpenter, Perry, & Frank, 2007; Tanaka, 2015). This high stress level has some negative performance effects on vertical jump and balance, suggesting that increased presynaptic inhibition in low-stress athletes may be beneficial to performance (Tanaka, 2015). This study has some important practical implications for coaches, trainers, and practitioners for rehabilitation after injury. First, a high trait stress might lead to decreased athletic performance. Therefore, psychological rehabilitation can be useful as an adjunct program to enhance athletic performance of some athletes. Second, according to neural mechanisms suggested in this study, vertical jump and balance tasks are examples of performance activities affected by trait stress. Therefore, practitioners should consider these tasks in the rehabilitation and testing of high-stressed athletes.
This study showed certain limitations, particularly including our exclusive reliance on male participants. We did not include women because of variability in H-reflex parameters in association with menstrual cycles, but our restricted participant sample limits generalizability of these findings to female athletes. Similarly, it will be important for future research to determine whether the findings of this study are equally applicable to professional athletes and to both amateur and professional athletes of varied sports. Finally, we have not investigated the benefits of any specific training programs for athletes of different trait stress levels, though these data suggest a need for that research.
Conclusion
This study is the first to provide evidence that lower stress athletes who participated in an aerobic sport like soccer have lower H-reflex responses and better performance on tests of postural ability and vertical jump height. This performance difference may be related to the low-stress athletes’ improved ability for more fully activating motoneuron output. Hth, the intensity required to record of Hmax and Hlast, and the maximum H/M ratios of soleus and lateral gastrocnemius are highly correlated with athletic performance and trait stress. This finding suggests that a standard H-reflex recruitment curve may help predict an athlete’s trait stress and determine its relationship to performance, making the H-reflex recruitment curve useful to trainers and coaches who wish to identify and manage their players’ trait stress in order to enhance performance.