
Abstract
The aim of this study was to analyze the psychometric properties of the original version of the Passion Scale (14 items, two factors). We tested it within a sample of mixed gender Portuguese athletes from different sports, including adapted sports. In addition to demonstrating reliability, validity, and confirmatory factor analyses of the Passion Scale, we sought to analyze the invariance of this measure between males and females and across six types of sports (soccer, futsal, swimming, surf, bodyboard, and adapted sports). We recruited 1,316 athletes to test this scale from both genders (1,109 males; 207 females), aged 14–59 years (M = 21.83; SD = 8.67). Our main results revealed weaknesses in the factor model for the original instrument (14 items and two factors) leading us to reject the model. However, after adapting the model (to eight items and two factors), the psychometric properties of the Passion Scale improved substantially and then exhibited (a) good fit to the data and (b) invariance between gender and across sports. Our new proposed version of the Passion Scale can be used with confidence to analyze the passion athletes feel when practicing their sport.
Introduction
According to Vallerand et al. (2003), the word “passion” comes from the Latin “passio” (suffer), highlighting a passion-holding perspective that can be anchored in loss of rationality and lack of emotional control. In other words, passion is a strong emotion that tends to control the individual’s thinking and behavior. However, in a less controlling perspective, we associate positive feelings with the concept of passion and view it as more rational. In sports, Vallerand and Miquelon (2007) define passion as a strong connection between the individual’s affinity for a sport, and the amount of time and energy devoted toward it. In this positive perspective, passion can be conceptualized as the energy source that sustains an athlete’s commitment and persistence to any particular sport. Put it in other words, passion is the energy that fuels motivation. In this perspective, the Dualistic Model of Passion (DMP; Vallerand et al., 2003) distinguishes two types of passion: harmonious passion (HP) and obsessive passion (OP), based on how they are internalized (integrated into the individual’s identity), with differentiating implications for individual behavior.
Descriptive Analysis of the PSp—Initial Model.
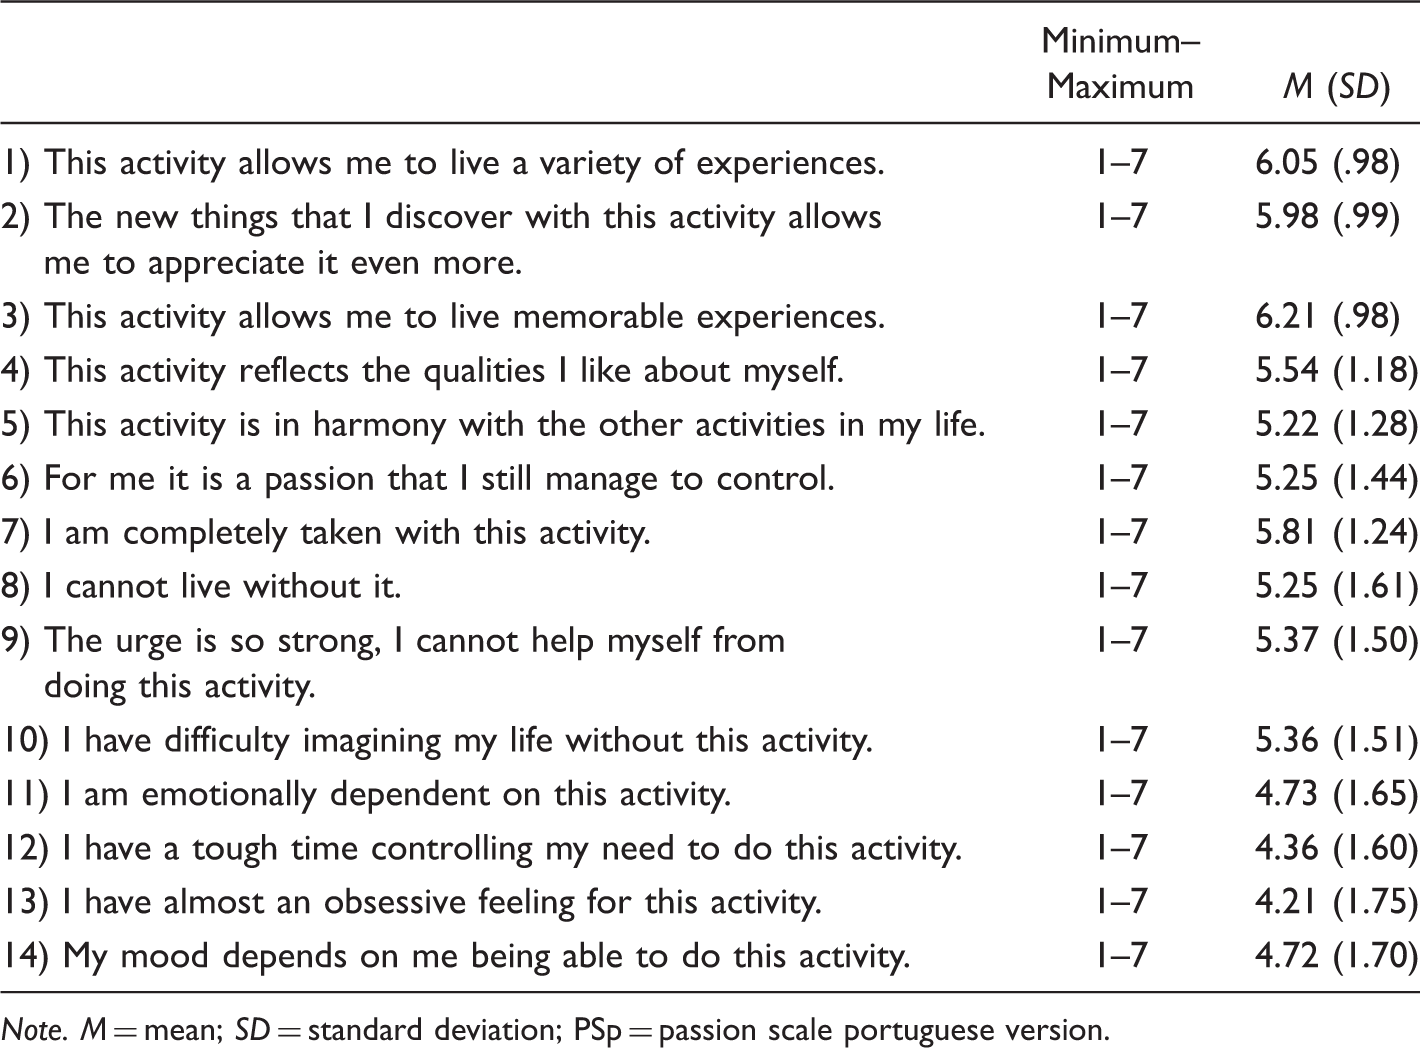
Note. M = mean; SD = standard deviation; PSp = passion scale portuguese version.
OP is associated with controlled internalization, in which the individual forces him or herself to engage in sports practice in a search for social acceptance or increased self-esteem, experiencing internalized pressure to do so. Unlike HP, an athlete experiencing OP cannot live without this sport practice and becomes emotionally dependent on it in order to achieve social acceptance and support a personal identity. Therefore, OP athletes have problems managing time spent on sports practice while still performing other activities (Vallerand, 2012; Vallerand et al., 2003). In sports, we can affirm that an athlete has an OP when he or she says, thinks, or feels, “The urge is so strong, I can’t help myself from doing this activity” (see Item 9 of the PS in Table 1).
Although DMP was developed over a decade ago, there has been rapidly growing recent research interest in its applicability, particularly in work activities (e.g., Egan, Turner, & Blachman, 2017), the music industry (e.g., Bonneville-Roussy, Lavigne, & Vallerand, 2010; Bonneville-Roussy & Vallerand, 2018; Lalande et al., 2015), video gaming (e.g., Bertran & Chamarro, 2016) and the sports and exercise context (e.g., Lefreniére, Bélanger, Sedikides, & Vallerand, 2011; Paradis, Cooke, Martin, & Hall, 2013; Philippe, Vallerand, Andrianarisoa, & Brunel, 2009; Vallerand et al., 2003, 2006; Vallerand, Mageau, et al., 2008; Verner-Filion, Vallerand, Amiot, & Mocanu, 2017). However, only recently have there been published studies based on the DMP in the Portuguese sport context (Cid, Ferreira, Sousa, & Moutão, 2014; Cid & Louro, 2010; Cid, Silva, Monteiro, Louro, & Moutão, 2016; Cid, Vitorino, Silva, Ferreira, & Moutão, 2014; Teixeira & Cid, 2011). A factor that has slowed DMP’s applicability to the Portuguese sport context has been the difficulty assuming that DMP measurement tools are valid and reliable with Portuguese respondents. While the PS, developed by Vallerand et al. (2003), is the most frequently used measurement for studying passion based on DMP theory, there have been concerns regarding the number of PS items for each factor and, consequently, the psychometric properties of the scale. The PS was originally developed in French and later translated into English, with 14 items (seven per each of two factors) selected from an initial pool of 34 items based on factor weight from exploratory factor analysis. This two-factor (14 items) instrument was later submitted to a confirmatory factor analysis that required an adjustment to fit the data. Thus, the authors (Vallerand et al., 2006) asserted that some items had “result components” that might have interference-enhancing elements, and they removed these items. Several other studies found similar concerns, since different versions of the scale had been used in separate research applications, including a 6-item version (three items per factor) by Vallerand et al. (2006) and another 8-item version (four items per factor) by Vallerand, Salvy, et al. (2008). These concerns led Vallerand (2010) to revise his own scale, proposing a new 12-item version (six items per factor) whose psychometric qualities, when analyzed by Marsh et al. (2013), showed measurement invariance between French and English and between genders. Teixeira and Cid (2011) were the first to translate and validate the original PS (Vallerand et al., 2003) for Portuguese athletes. Through exploratory factor analysis, they identified weaknesses in two items (one item per factor), including low factorial weight and cross-loadings that led these authors to consider eliminating those items. The psychometric properties of this revised Portuguese version of the PS were later reviewed by Cid, Silva, Baptista, Moutão, & Monteiro (2014) with results that were not entirely conclusive, leading to a rejection of the original measurement model of 14 items and two factors. After eliminating two items in each factor, these authors confirmed substantial improvement that demonstrated adequate psychometric proprieties. Given these inconsistencies in the past literature regarding the PS measurement model and its application to Portuguese respondents, we reexamined the psychometric properties of the original PS (Vallerand et al., 2003), in a population of Portuguese athletes coming from six types of sports, including adapted sports, and we also analyzed the instrument’s gender and sport invariance.
Method
Participants
A total of 1,316 Portuguese amateur athletes (soccer, futsal, swimming, surf, bodyboard, and adapted sports), from both genders, aged 14–59 years (M = 21.83; SD = 8.67) participated in this study. Participants’ time of practice in their chosen sports varied from 1–37 years (M = 8.16; SD = 5.92) and the number of training sessions per week ranged from 1–12 (M = 3.77; SD = 2.13). Of these participants, 1,109 were males (age range: 14–59 years, M = 21.85; SD = 8.70; years of practice range: 1–37, M = 8.43, SD = 6.04; and number of training sessions per week range: 1–12, M = 3.74, SD = 2.19); 207 were females (age range: 14–53 years, M = 21.72, SD = 8.56; years of practice range: 1–28, M = 6.63, SD = 4.87; and weekly training sessions range: 1–11, M = 4.28, SD = 2.65). For cross-validation (i.e., invariance between calibration and validation samples), we randomly split data into two samples, each composed of approximately 50% of the participants, following suggestions by Byrne (2010).
Subsamples Characteristics.
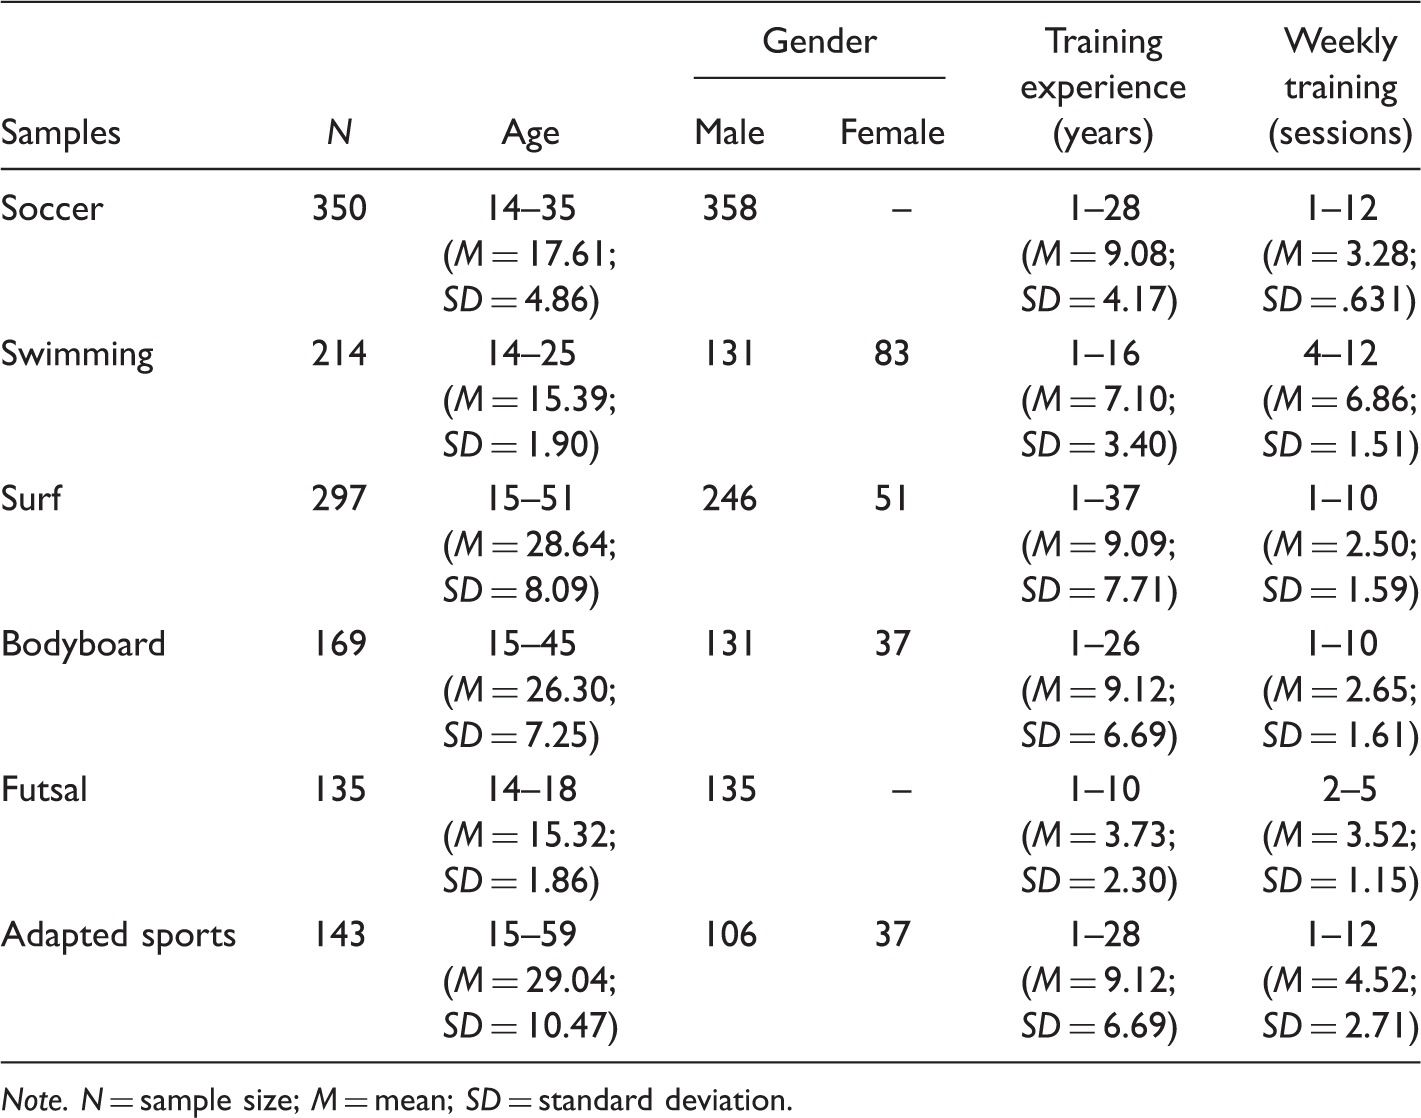
Note. N = sample size; M = mean; SD = standard deviation.
Instruments
We used the Portuguese version of the PS (Teixeira & Cid, 2011), consisting of 14 items on which participants responded on a 7-point Likert-type scale ranging from 1 (Totally disagree) to 7 (Totally agree). Items are grouped into two factors, representing HP (e.g., “I am completely taken with this activity”—Item 7 of the PS) and OP (e.g., “I have difficulty imagining my life without this activity”—Item 10 of the PS), underlying DMP.
Data Collection
Potential participants were individually contacted at their training place or specific location of competition and were questioned as to their willingness to participate voluntarily in this study. We presented participants with a questionnaire alongside a written description of the study’s purpose, the names of the authors, collaborators, and partnership identifications, and in which participants were assured of personal confidentiality. To avoid any influence on their sports performance, data were collected one hour prior to competition. We obtained the participants’ informed consent through their signature on the title page. Time taken to complete the questionnaire was approximately 5–10 minutes. Before data collection, we obtained approval from the University for this Research Protocol. Whenever possible, athletes completed the questionnaire independently. However, some adapted sports participants completed the questionnaire with help from coaches, family members, friends, or researchers, and, in these circumstances, we reinforced the imperative of confidentiality and the need to not bias interpretations. Of note, we used several social media (e.g., Facebook) to contact adapted sport athletes when they were engaged in international competitions, or, for athletes with hearing impairments, we used Portuguese Sign Language to assist communications.
Data Analysis
Confirmatory factor analysis
For confirmatory factor analysis, we followed suggestions made by several authors (Hair, Black, Babin, & Anderson, 2014; Kline, 2011) and used a ratio of 5:1 for the number of participants for each parameter to be estimated. However, the Mardia’s (1970) coefficient indicated a non-normal multivariate data distribution in all samples under analysis: calibration sample (45.04), validation sample (32.99), male sample (42.32), female sample (30.34), soccer (53.56), futsal (18.65), swimming (8.66), surf (45.77), bodyboard (34.84), and adapted sports (20.92). Therefore, we used bootstrap bollen-stine of 2,000 samples, as suggested by Nevitt and Hancock (2001).
Data analysis was performed according to several authors (Byrne, 2010; Hair et al., 2014; Kline, 2011), such that we used the recommended Maximum Likelihood method, chi-square test (χ2), the respective degrees of freedom (df), and significance level (p). In addition, we used the following adjustment indexes: standardized root mean square residual (SRMR), comparative fit index (CFI), non-normed fit index (NNFI), root mean square error of approximation (RMSEA), and its respective interval of confidence (IC: 90%). We adopted cut-off values (Hair et al., 2014; Marsh, Hau, & Wen, 2004) for CFI and NNFI ≥ .90, and for SRMR and RMSEA ≤ .08. Lastly, we calculated convergent validity (i.e., to test items that converged with the factors) through average variance extracted (AVE), considering values AVE ≥ .50 as acceptable. In addition, we reached discriminant validity (i.e., analyze if the factors are sufficiently distinct) by having squared correlation (r) of each factor below AVE. To examine internal consistency, we adopted composite reliability (CR) scores, using ≥.70 as cut-off values (Hair et al., 2014). The analyses were undertaken using AMOS 23.0
Invariance analysis
Multigroup analysis aims to assess whether the structure of the measurement model is equivalent (invariant) between different participant groups with different characteristics (e.g., male and female). We established the following criteria for models of invariance (Byrne, 2010; Cheung & Rensvold, 2002; Marsh, 1993): (a) individual model analysis (data must fit each group) and (b) there must be invariance of the following parameters: configural, metric, scalar, and residual. In line with Cheung and Rensvold (2002), configural invariance was met if ΔCFI was below .01. For metric invariance, ΔSRMR had to be less than .030 and ΔRMSEA less than .015 to support model fit; for scalar, ΔSRMR had to be less than .010 and ΔRMSEA less than .015 to indicate measurement invariance (Chen, 2007). According to Marsh (1993), metric invariance is considered to be the minimum criteria for measurement invariance, and the differences between unconstrained model and others (fixed parameters) must be less than ≤ .01 (Cheung & Rensvold, 2002). Residual invariance is not indicative of not achieving model invariance, and some authors consider this criterion to be optional since it is too restrictive (Byrne, 2010). Of note, several researchers (e.g., Byrne, 2010) have claimed that analyzing invariance models based on chi-square differences is too restrictive. Therefore, it seems more reasonable to analyze and discuss results based on CFI differences.
Results
Preliminary and Descriptive Analyses
As our preliminary data analysis revealed that missing values were less than 0.1%, missing values were imputed using the full information maximum likelihood estimation (Cham, Reshetnyak, Rosenfeld, & Breitbard, 2017). In addition, we found no outliers (univariate and multivariate). As seen earlier, Table 1 shows a descriptive analysis of participants’ responses to all test items. Participants used all levels of response available to them for each of the items, and the mean value per item varied from 4.21 (SD = 1.75) to 6.21 (SD = 0.98), in the calibration sample.
Construct Validity Analysis
Goodness-of-Fit Indexes of the PSp Measurement Model in All Samples.
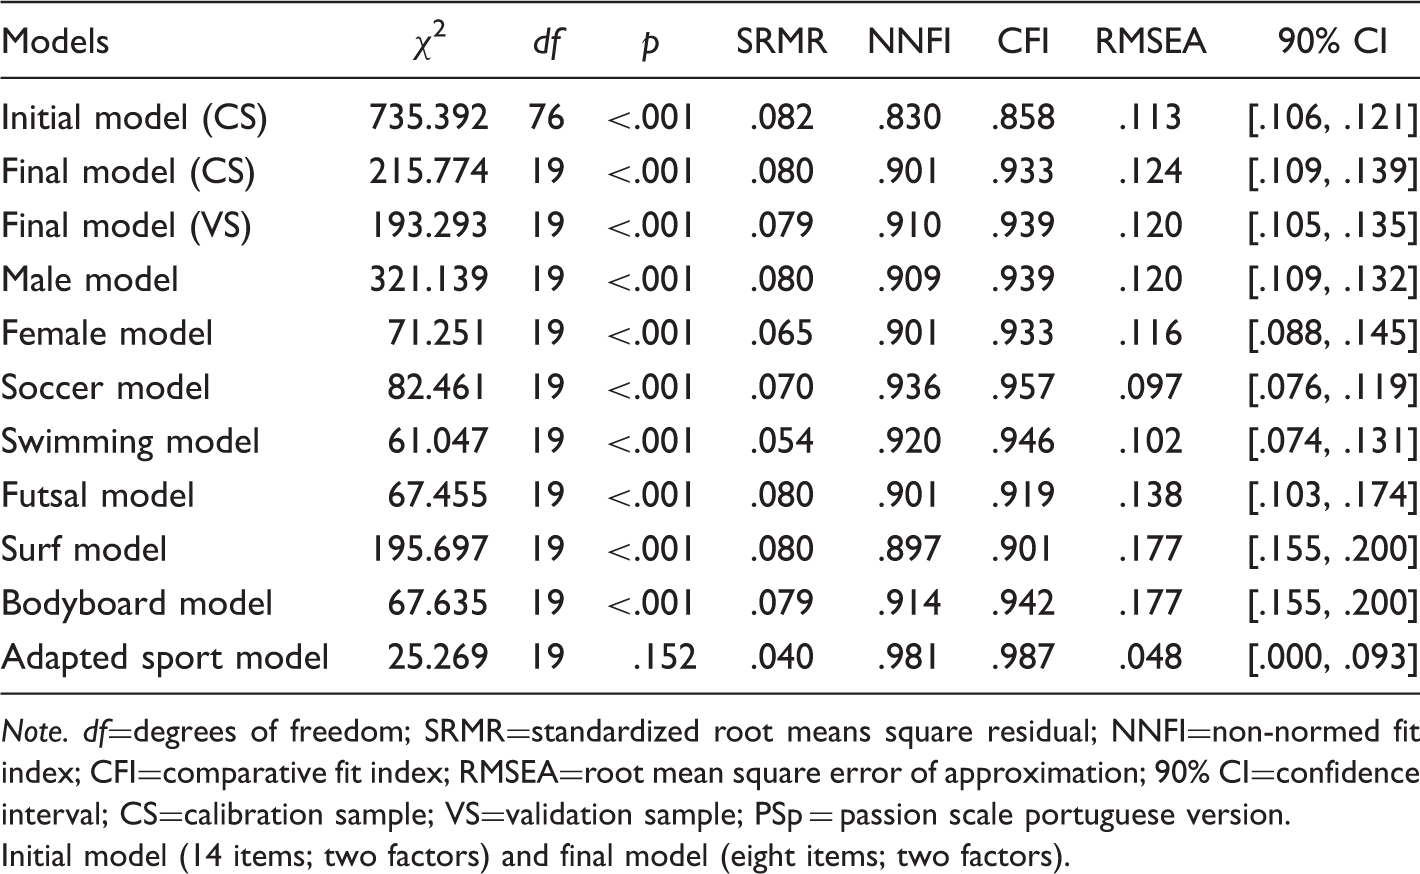
Note. df=degrees of freedom; SRMR=standardized root means square residual; NNFI=non-normed fit index; CFI=comparative fit index; RMSEA=root mean square error of approximation; 90% CI=confidence interval; CS=calibration sample; VS=validation sample; PSp = passion scale portuguese version.
Initial model (14 items; two factors) and final model (eight items; two factors).
Internal Consistency, Convergent, and Discriminant Validity.
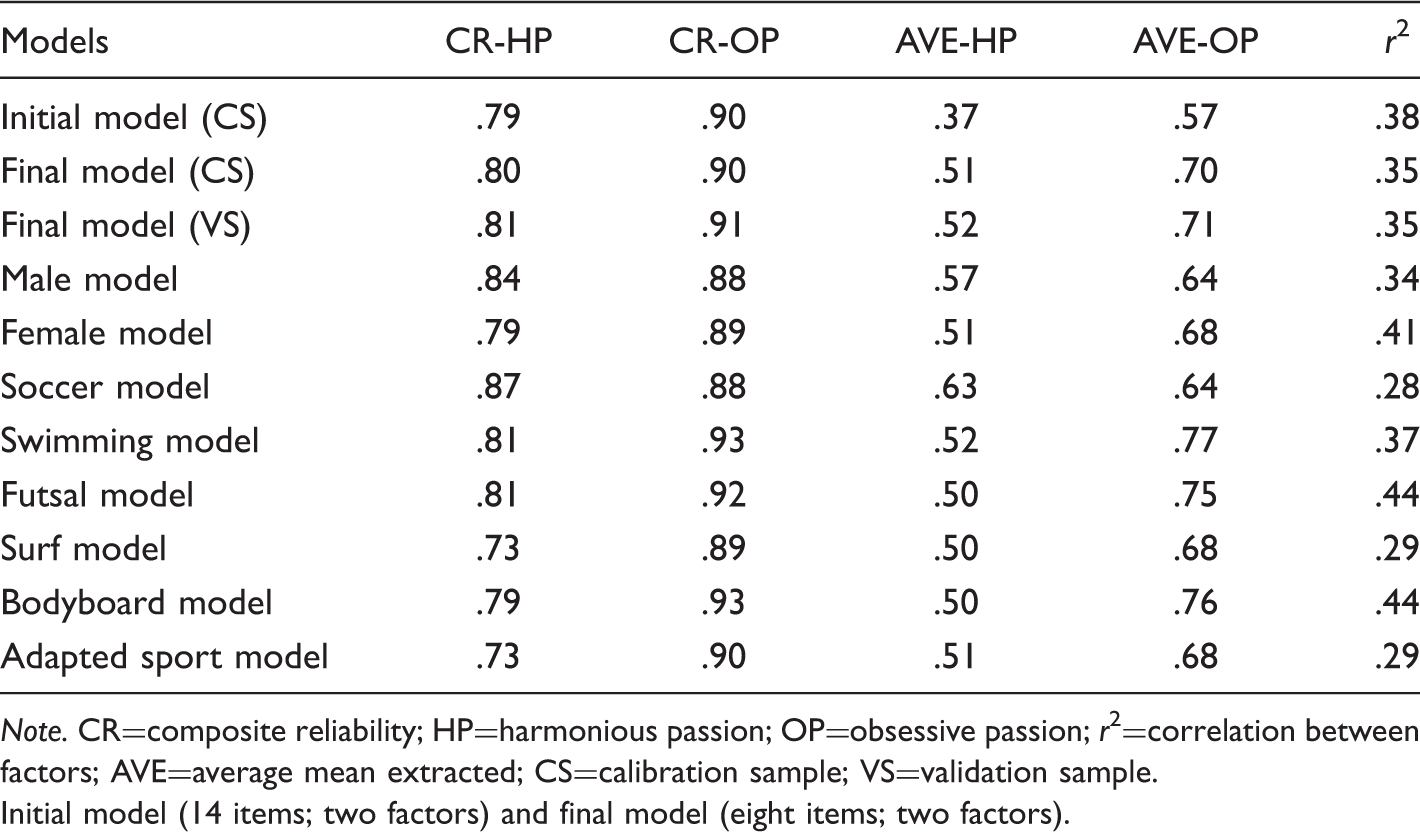
Note. CR=composite reliability; HP=harmonious passion; OP=obsessive passion; r2=correlation between factors; AVE=average mean extracted; CS=calibration sample; VS=validation sample.
Initial model (14 items; two factors) and final model (eight items; two factors).
Measurement Invariance of the Portuguese PS Between Samples, Gender, and Adapted Sports.
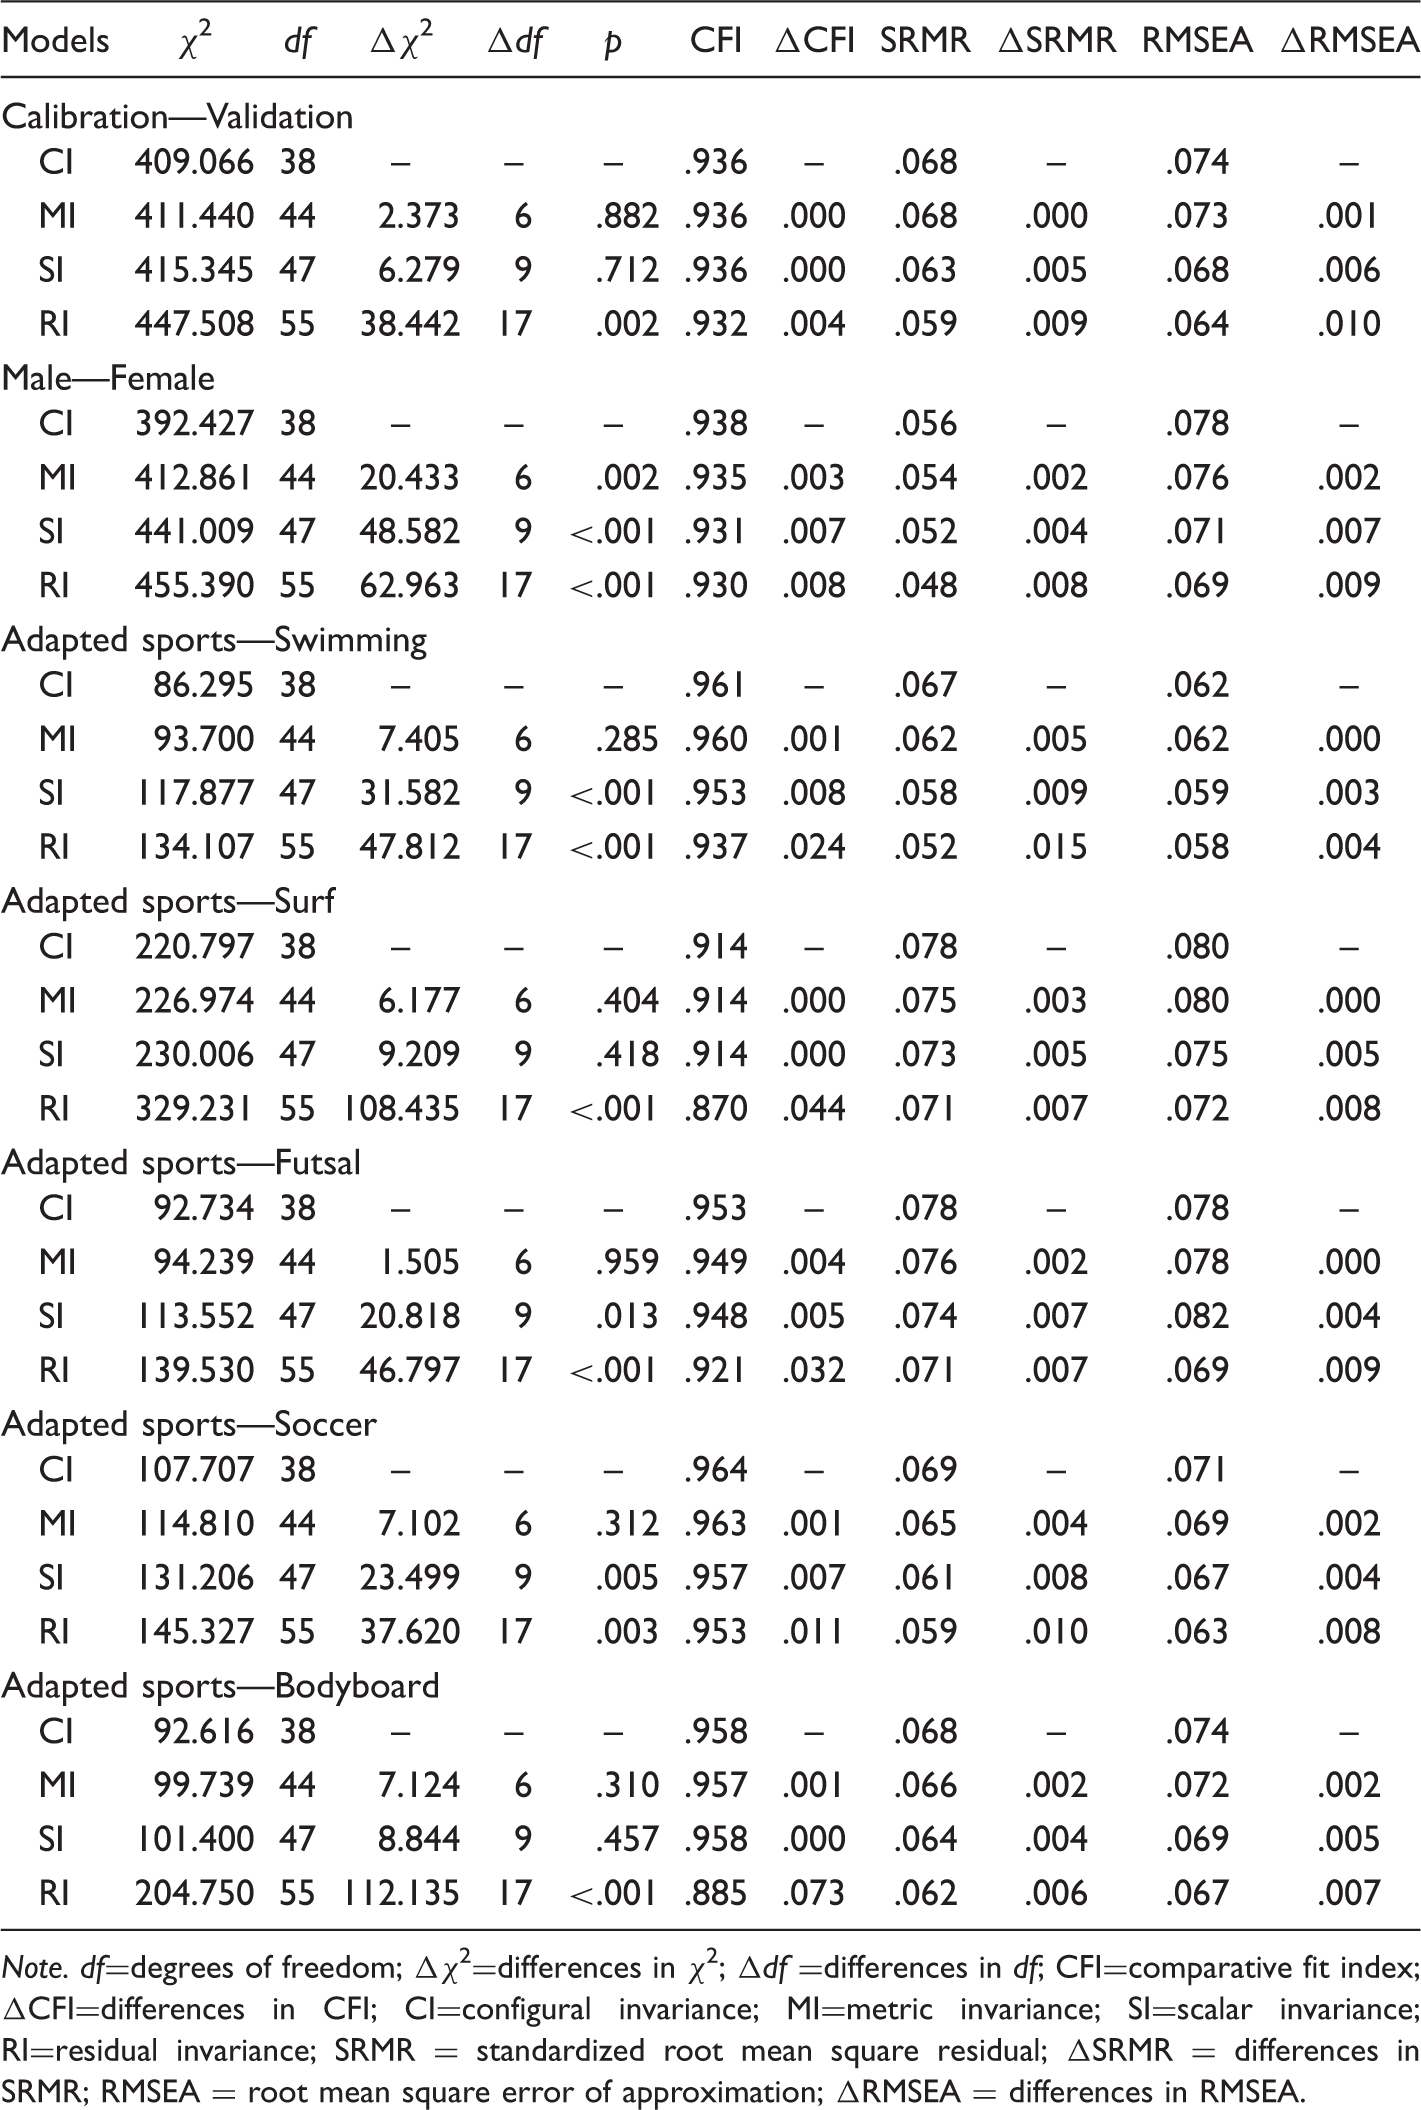
Note. df=degrees of freedom; Δχ2=differences in χ2; Δdf =differences in df; CFI=comparative fit index; ΔCFI=differences in CFI; CI=configural invariance; MI=metric invariance; SI=scalar invariance; RI=residual invariance; SRMR = standardized root mean square residual; ΔSRMR = differences in SRMR; RMSEA = root mean square error of approximation; ΔRMSEA = differences in RMSEA.
Measurement Invariance of the Portuguese PS Across Different Sports.
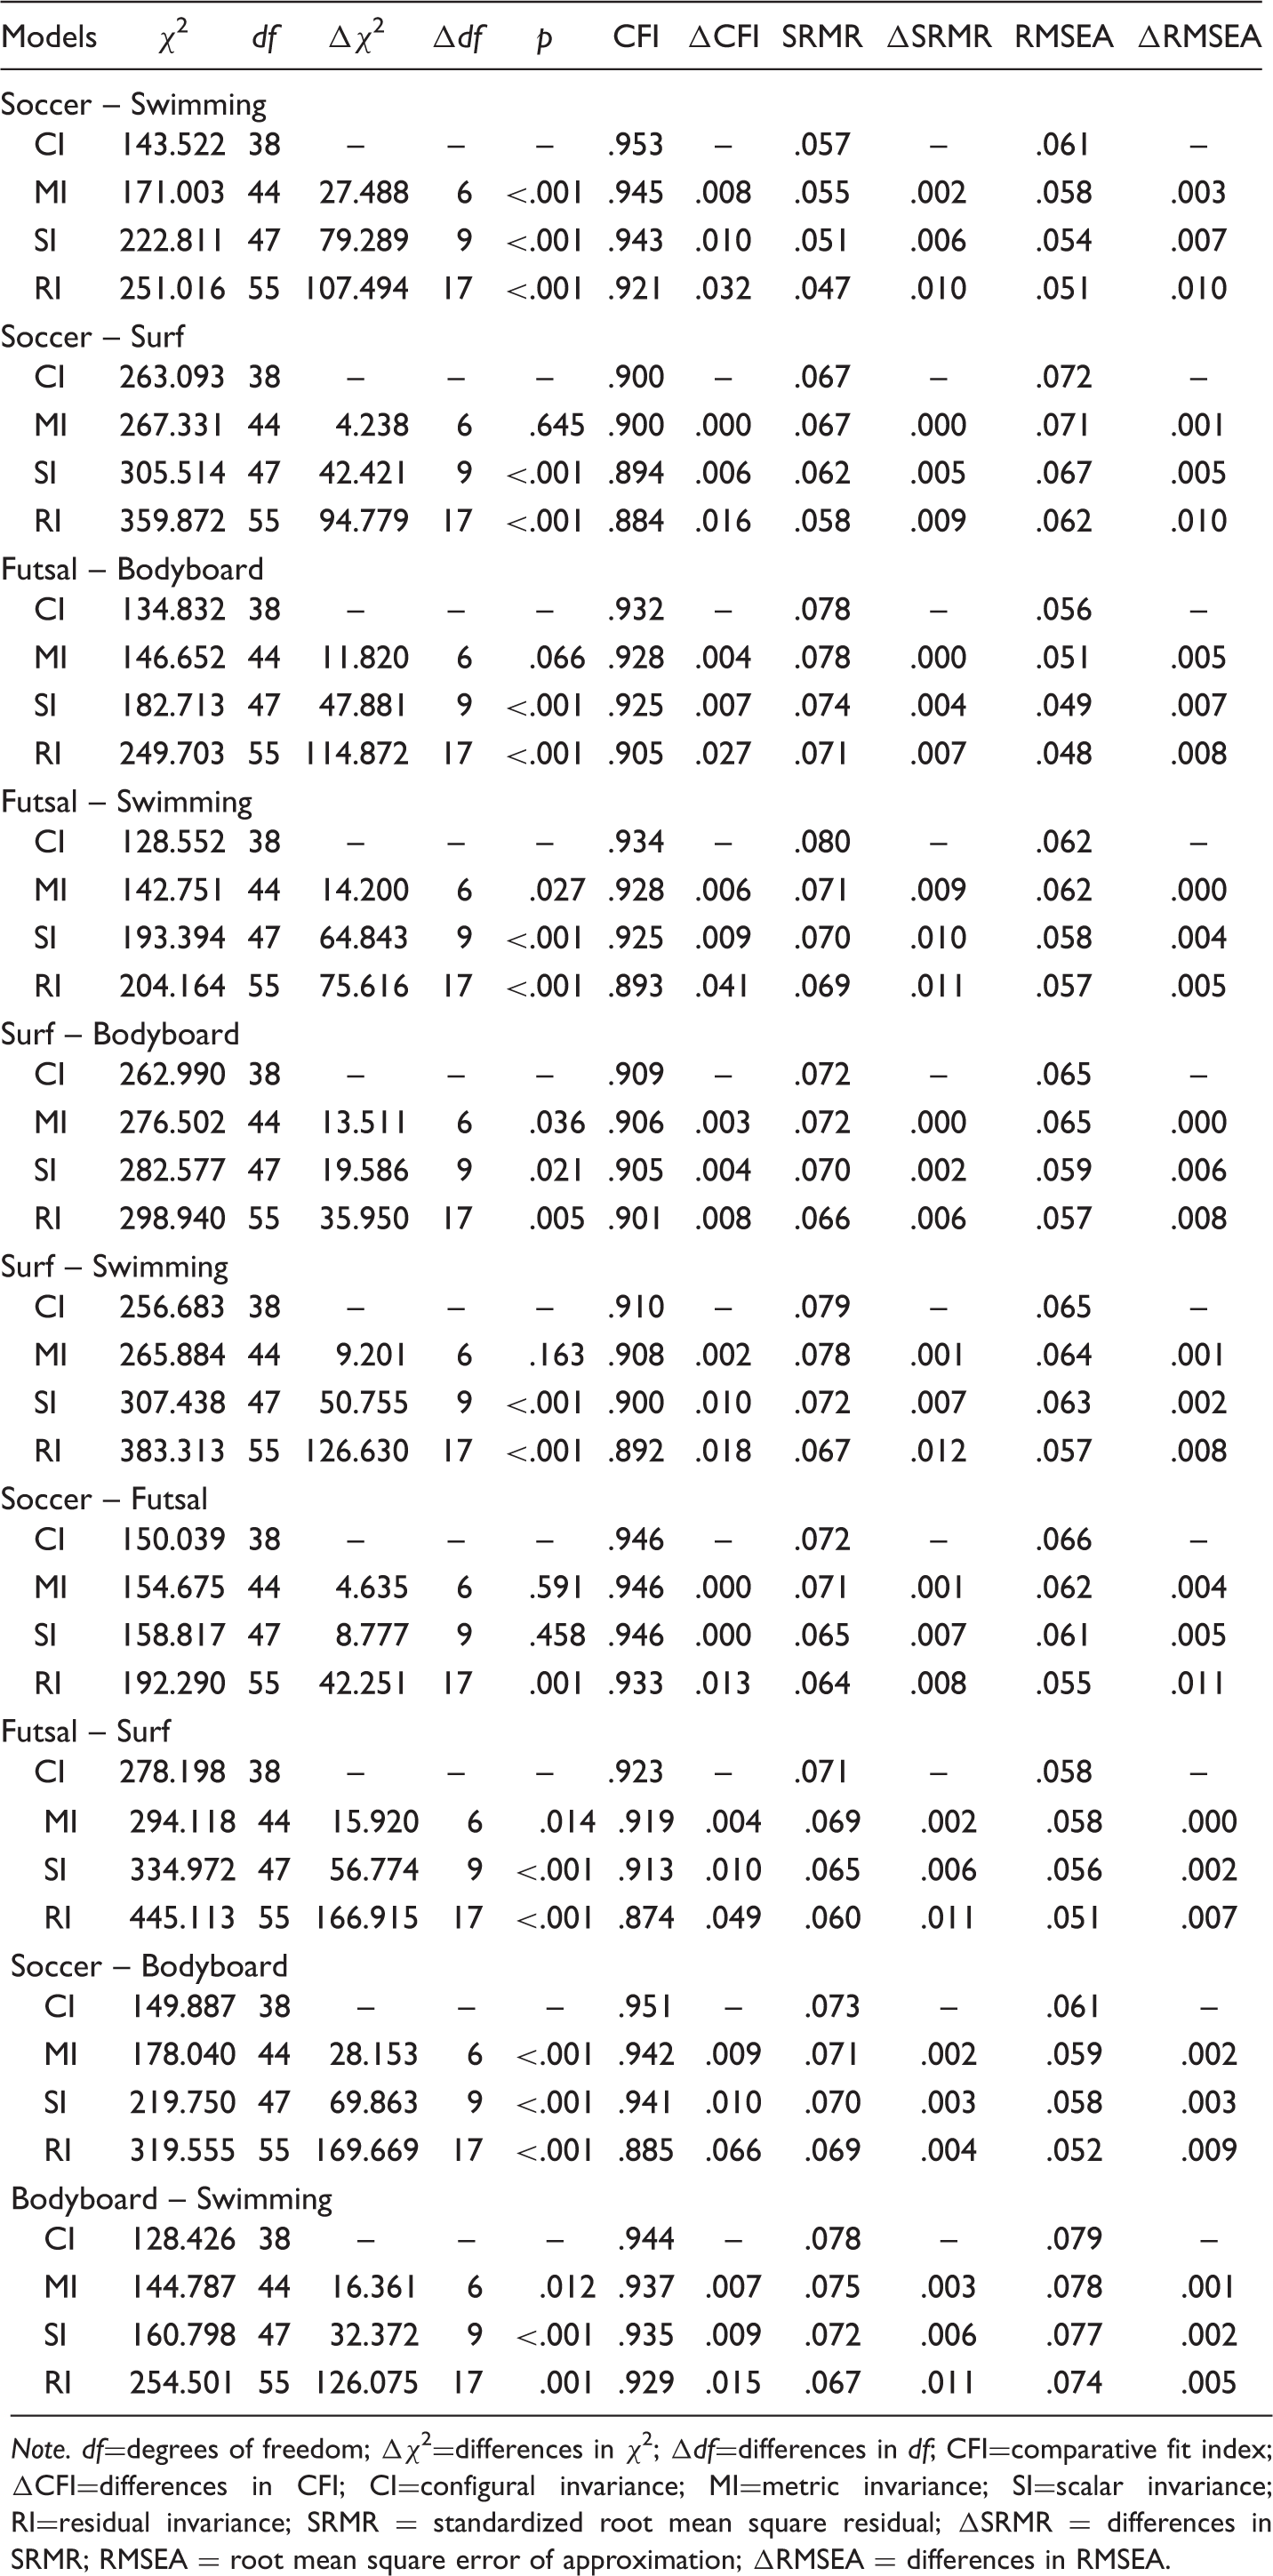
Note. df=degrees of freedom; Δχ2=differences in χ2; Δdf=differences in df; CFI=comparative fit index; ΔCFI=differences in CFI; CI=configural invariance; MI=metric invariance; SI=scalar invariance; RI=residual invariance; SRMR = standardized root mean square residual; ΔSRMR = differences in SRMR; RMSEA = root mean square error of approximation; ΔRMSEA = differences in RMSEA.
In terms of local indices, standardized factorial weights ranged from (a) HP of .54 to .79 in the calibration sample, and .77 to .87 in the validation sample and (b) OP of .76 to .86 in the calibration sample, and .77 to .87 in the validation sample. In addition, there was a positive correlation between the two factors of .59 in both samples (see Figure 1).
Standardized parameter (covariance’s between factors, factor weights, and error of measurement) from calibration (left) and validation (right), all statistically significant in its respective factor (eight items and two factors).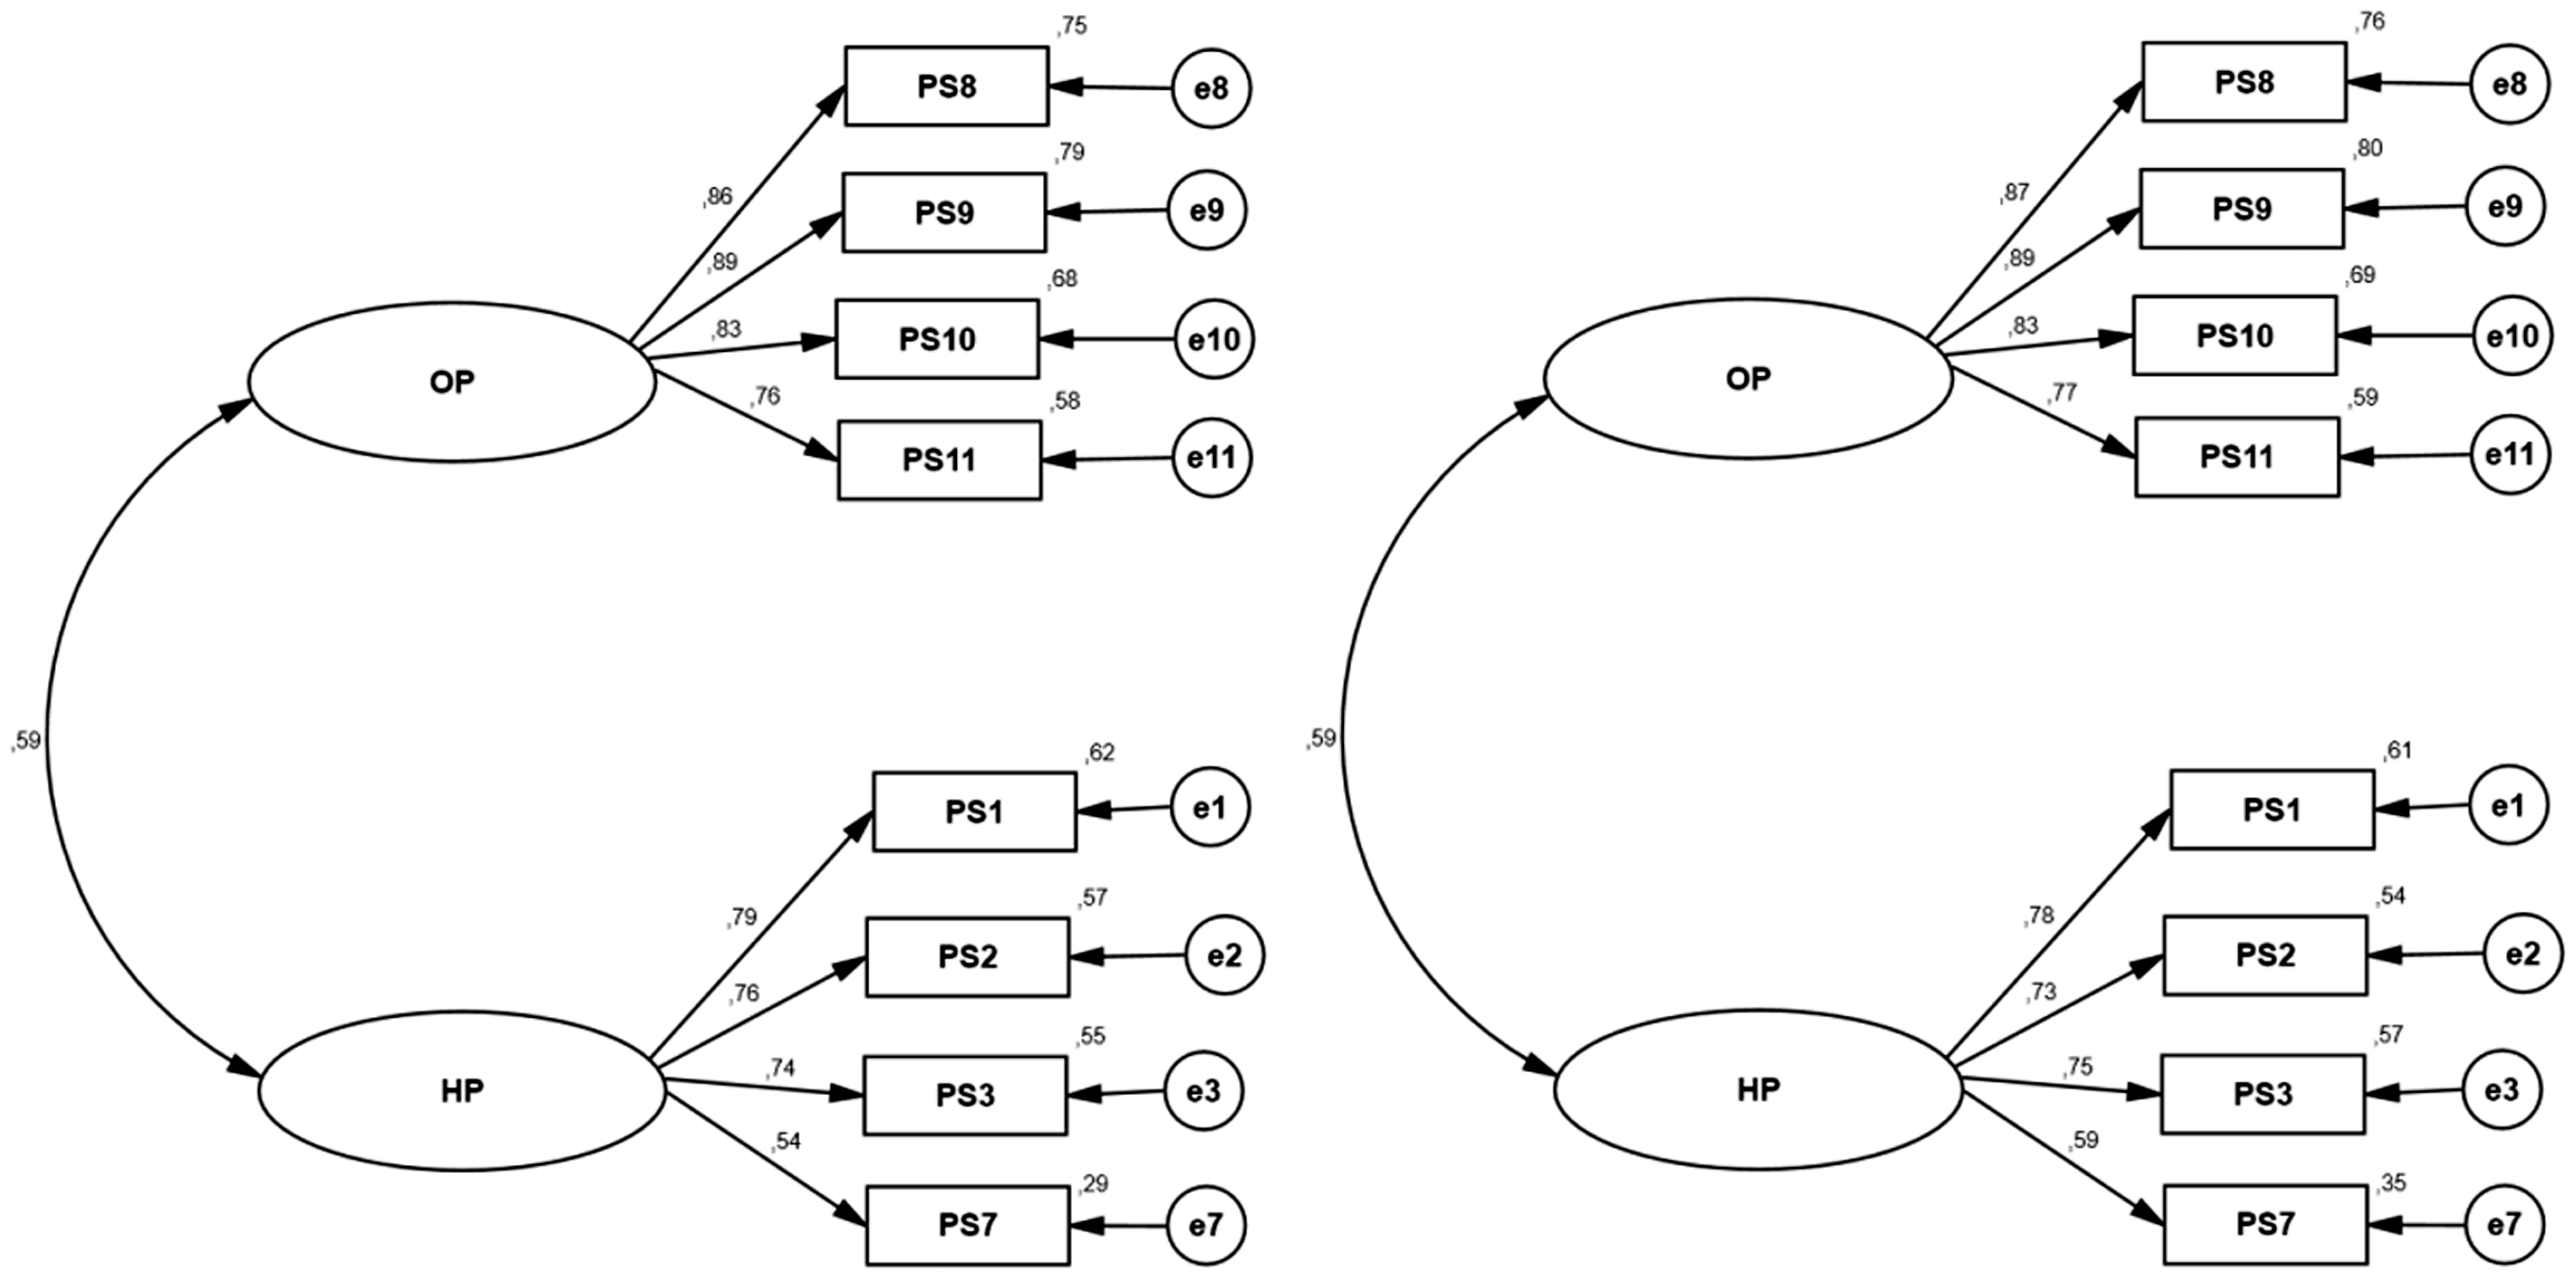
Discussion
This study aimed to analyze the psychometric properties of the adapted Portuguese PS (Teixeira & Cid, 2011). In addition, we tested measurement invariance between genders and the six types of sports (including adapted sports), since previous studies, especially among Portuguese and Spanish participants (e.g., Pedrosa, García-Cueto, Torrado, & Arce, 2017; Teixeira & Cid, 2011), have shown inconsistencies. Data from this study demonstrated that the initial model (two factors of seven items each) did not fit the data. After removing three items from each factor, the data exhibited an acceptable fit to the model, leading to an instrument with eight items (four in each of the two factors). In addition, the final model was also found to be invariant between gender samples and across six different sports types.
Construct Validity Analysis
Past analyses of the PS have led researchers to recommend shorter versions of the scale. For example, Vallerand et al. (2006) suggested a test with only six items, Vallerand, Salvy, et al. (2008) formed a scale with eight items, and Cid, Silva, et al. (2014) recommended a test for Portuguese athletes with eight items. Later, Vallerand (2010) proposed a new version of the PS that employed 12 items in two factors with some slight modifications that were later analyzed (in French and English versions) by Marsh et al. (2013), and a later validated to Spanish by Chamarro et al. (2015). However, these versions of the PS only showed an acceptable data fit after correlating measurement errors between two items in the HP factor and two items in the OP factor. This could mean that the shorter versions are a better option for analyzing these factors.
Interestingly, these results revealed that individuals from several different countries value both types of passion, a fact that seems to be demonstrated by the moderate and high means of all of the items (e.g., Vallerand et al., 2006; Vallerand, Salvy, et al., 2008). This may be due, in part, to the positive correlation between both types of passion, not only in this study (r = .59) but also in all studies validating this scale (Chamarro et al., 2015; Cid, Silva, et al., 2014; Marsh et al., 2013; Pedrosa et al., 2017; Vallerand et al., 2003).
Regarding the psychometric properties of the initial model in this study (i.e., the scale with 14 items in two factors), our data did not show an acceptable fit to the model, corroborating weaknesses in the full version. Therefore, it was necessary to analyze a shorter version, considering that it is not necessary to have so many items (observations) for each factor (latent construct). For example, Hair et al. (2014) recommended the use of only four items. This practice is common in scale validation when the models are complex and show construct validity problems associated with larger numbers of items (Cid, Moutão, Leitão, & Alves, 2012; Monteiro et al., 2018). This strategy has been used successfully by the PS author himself in several studies (Vallerand & Miquelon, 2007; Vallerand et al., 2006; Vallerand, Salvy, et al., 2008). These studies indicated that the shorter versions might be a better alternative than the full version, and our results support this conclusion.
Item elimination should be guided by the assurance of maintaining the integrity of the theoretical model (Henson & Roberts, 2006). Therefore, after analyzing the local adjustment indices and the modification indices, we eliminated three items from each factor (Items 12, 13, and 14 of the OP factor and Items 4, 5, and 6 of the HP factor), following two main principles: (a) We retained only factor weights >.50 and (b) we retained only items that did not correlate significantly with other items from the same factor (no cross-loadings). Thus, we ensured that no doubts were raised from a semantic point of view and no eliminated items would bias interpretation.
Following Hair et al. (2014) recommendations, our results support the use of the shorter and final version (two factors with eight items each), as items then better reflect the latent construct that the scale is meant to measure. In addition, this shorter version exhibited good fit in accordance with such other important components as: (a) cross-validation (i.e., there were no differences between the calibration and validation samples), (b) convergent validity (i.e., all factors had scores above cut-off values), and (c) discriminant validity (i.e., both factors were distinct and measured different types of passion). CR values were acceptable (≥.70), meaning that the scale measures both factors consistently and reproducibly (Hair et al., 2014) just as did the original scale (Vallerand et al., 2003).
Measurement Invariance
Our measurement invariance analyses supported the use of this revised scale for participants of both genders and all six types of sports examined (i.e., soccer, futsal, swimming, surf, bodyboard, and adapted sports) according to Marsh et al. (2013). The theoretical constructs underlying DMP were conceptualized in the same way in among all of these participant subsamples. Following several authors’ recommendations regarding invariance analysis (Byrne, 2010; Chen, 2007; Cheung & Rensvold, 2002), we can confirm that (a) the proposed theoretical structure is equivalent in all samples examined, (b) factor weights corresponded in all samples, and (c) test users can compare results between males and females and between athletes engaged in different types of sports. In addition, there is a linguistic equivalence and applicability of this revised PS (Vallerand et al., 2003) across other countries in the sport context.
Study Limitations
Our results support the applicability of the Portuguese version of the PS for sport athletes, but there are some limitations to this research. First, the present scale was applied among Portuguese athletes, and generalization to other countries remains speculative until further research supports its findings in other populations. Second, this study was cross-sectional in its design, meaning that it is not clear how the instrument’s psychometric properties might change through athletes’ development until longitudinal research has been conducted. Thus, this research was based on a strong theoretical model, and future interventions can help in assessing HP and OP in athletes and test for time invariance. Third, although we found solid evidence of a difference between Passion constructs of HP and OP, future studies should associate scores on this instrument with other motivational or emotional variables. For example, Zhao, St-Louis, and Vallerand (2015) in a study with Chinese participants demonstrated that HP was significantly positively associated with positive emotions and significantly negatively associated with negative emotions, while OP was significantly positively associated with both positive and negative emotions. Finally, this analysis exhibited an adjusted fit for measurement invariance between samples involving gender and six different types of sports, and forthcoming studies should examine invariance between other group characteristics (e.g., countries, collectivism and individualism sports, amateur, and professional athletes).
Conclusion
The results of this study showed that is it not advisable to use all 14 items split between two factors as in the original version of the PS in Portuguese athletes, as this model exhibited construct validity problems. However, this research proposed an alternative shorter version of the PS with eight items in two factors in examining athlete’s passion across gender and across different types of sports, including adapted sports. This shorter version exhibited an acceptable fit to the data and invariance between these subsamples. However, we agree with Barrett (2007) that more studies are needed, involving tests of invariance not only across other types of sports but also across another groups (e.g., age) and for transcultural validation (e.g., Portugal, Spain, and others Latino American countries). Importantly, future studies should also further explore the PS model proposed by Vallerand (2010) to better understand its broader meaning.