
Abstract
Past research examining National Hockey League (professional ice hockey; NHL) data from the 4-on-4 overtime era (seasons between 2005-06 and 2013-14) revealed an inconsistent home team (dis)advantage pattern such that home teams that were superior to their visiting counterparts had slightly greater odds of winning during regulation play compared to overtime (demonstrating home crowd advantages for team performance during regulation); in contrast, home teams experienced lower odds of winning in the shootout period than in overtime regardless of team quality (thereby demonstrating risks for individual choking from home crowd pressures). In this study, we explored the NHL home (dis)advantage pattern during four more recent seasons (2015-16 through 2018-19) in which the league instituted 3-on-3 play during overtime (perhaps increasing individual pressure for athletes competing in the 3-on-3 overtime period). We used archival data from the regular season (N=5,002 games) to compare home teams’ odds of winning in regulation (with 5-on-5 skaters per team) to overtime (with 3-on-3) and in the shootout, adjusting for the quality of home and visiting teams. We conducted fixed-effects and multi-level logistic regression modeling. Evenly matched home teams were 1.66 times more likely to win than inferior home teams when games concluded in regulation versus overtime. Superior home teams were 4.24 times more likely to win than inferior home teams when games concluded in regulation rather than overtime. Thus, it is apparently more difficult for superior and evenly matched home teams to win in overtime than during regulation, suggesting that such home teams may be susceptible to choking in overtime. In contrast to the earlier 4-on-4 overtime era, home teams did not have lower odds of winning in the shootout compared to overtime. These results may have implications for NHL coaches’ and players’ tactical decision-making.
The home team advantage is characterized by “the consistent finding that home teams in sport competitions win over 50% of the games played under a balanced home and away schedule” (Courneya & Carron, 1992, p. 13). Meta-analytic findings have demonstrated that teams across several sports at elite levels win approximately 60% of their home games (Jamieson, 2010), though athletes competing at home in individual sports (with the exception of those in subjectively evaluated sports such as figure skating) generally do not benefit to the same degree (Jones, 2013). Given its intuitive appeal, the home advantage phenomenon has been of interest to academics, sport scientists, athletes, and coaches.
Much of the home advantage literature is grounded in the conceptual framework for home advantage research advanced by Carron and colleagues (Carron et al., 2005; Courneya & Carron, 1992). In this feed-forward model the home advantage has been attributed to specific game location factors that include crowd effects, learning, travel, and rule factors. These game location factors are thought to trigger changes in athletes’ and coaches’ psychological, physiological, and behavioral states that, in turn, lead to home teams’ favorable performance outcomes. Some research has also shown the home advantage to be partly attributable to biased officiating (Moskowitz & Wertheim, 2012). Despite a wealth of supporting evidence for a home advantage in sport (Jamieson, 2010), researchers who have focused on athletes’ psychological and behavioral states have reported instances of a home disadvantage in certain phases of or in specific situations within National Hockey League (NHL) games (Hoffmann et al., 2017; McEwan, 2019; McEwan et al., 2012). These researchers drew upon previous studies from sport (Baumeister & Steinhilber, 1984) and non-sport (Butler & Baumeister, 1998) contexts demonstrating that individuals seemed to “choke” in the presence of supportive (home) audiences in certain critical/high-pressure situations. Briefly, choking under pressure is thought to occur because the conscious mind interferes with, and hence impairs, automatic skill execution (e.g., Allen & Jones, 2014; Baumeister, 1984; Beilock & Gray, 2007). McEwan et al. (2012) examined NHL shootout data from the 2006–07 through 2010–11 seasons and found that home teams benefitted in shootout situations where scoring would prevent a loss, but had a home disadvantage in shootout opportunities where scoring would trigger a win. McEwan (2019) examined 100 years of NHL overtime playoff data and found that visiting teams won significantly more overtime games than home teams in games where the visiting team had an imminent opportunity to win a series; there was no such advantage for home teams who had imminent opportunities to win a series.
While McEwan et al. examined the home (dis)advantage in specific situations within specific periods of NHL games (e.g., the shootout), Hoffmann et al.(2017) considered the entirety of NHL games by comparing home teams’ odds of winning in regulation, overtime, and the shootout in 10,534 regular season games that occurred from the 2005–06 through 2013–14 seasons. The regular season game format during these nine seasons consisted of three 20-min periods of 5-on-5 (skaters per team) hockey (i.e., regulation time), followed by a 4-on-4 “sudden death” overtime period if needed, followed by a shootout if needed. 1 Hoffmann et al. reported that 76.5% of games ended in regulation, 10.1% of games concluded in overtime, and 13.4% of games were prolonged into the shootout. Descriptively, home teams won 56.6% of the games ending in regulation, 54.2% of games ending in overtime, and 47.6% of games that extended into the shootout. Follow-up analyses accounted for varying relative quality of home versus visiting teams, revealing a more nuanced pattern of results. Home teams that were superior in quality to visitor teams had 1.03 times greater odds of winning in regulation than in overtime—a fractionally small but statistically significant difference. Regardless of relative team quality, home teams’ odds of winning were 1.23 times greater in overtime versus the shootout. Based on the contention that supportive audiences can induce detrimental psychological pressure on athletes (Wallace et al., 2005) that interferes with individual skill execution and subsequent performance (Butler & Baumeister, 1998), Hoffmann et al. reasoned that players competing at home underperformed in the shootout relative to overtime due to the heightened pressure associated with performing an individual task (i.e., shootout) in front of a home crowd.
Beginning in the 2015–16 season the NHL modified the overtime format to consist of 5-minutes of 3-on-3 hockey (rather than the earlier format of 4-on-4), still followed by a shootout if needed. 2 This change raises a question as to whether Hoffmann et al.’s (2017) earlier findings regarding NHL home (dis)advantage patterns from the 4-on-4 overtime era still apply, since 3-on-3 overtime play may place a greater emphasis on individual versus team performance. In the current study, we sought to replicate Hoffmann et al.’s analyses using NHL regular season game data for the four seasons since the implementation of 3-on-3 overtime. Therefore, we compared the home (dis)advantage patterns as games progressed from regulation, to overtime, to the shootout in regular season games from the 2015–16 through 2018–19 NHL seasons, adjusting, as before, for the relative quality of home and visiting teams. We expected that home teams, as before, would experience significantly lower odds of winning in the shootout relative to overtime, because the change from 4-on-4 to 3-on-3 overtime play would likely make no difference in home team performance, when compared against individual shootout performance. However, we suspected that the overtime rule change would result in a more pronounced increase in home teams’ odds of winning in regulation compared to overtime, since the new overtime conditions may place greater emphasis on individual play. Anecdotally, players and coaches have reported that the novel 3-on-3 overtime format is more mentally taxing than the old 4-on-4 format, given the increase in open space on the ice, the opportunity to exercise extreme patience and engage in overcautious behavior, and a greater chance that any error could prove disastrous (Matisz, 2018). This greater pressure might fall more heavily on the individual performance of home team members, increasing a propensity to choke, particularly among very talented teams, given the enhanced audience expectations of success for home team players. That is, the 3-on-3 format may enhance home players’ self-awareness, because audience attention is focused on three rather than four skaters, mirroring some of the pressure experienced by home players (including the goaltender) in the shootout.
Method
Sample
We used archival data for every NHL regular season game played from the 2015–16 through 2018–19 seasons (i.e., four seasons), extracted from an online statistical NHL database (Hockey-reference, 2019). Each of the 30 NHL teams during the 2015–16 and 2016–17 seasons competed in 82 regular season games per season (n = 2,460 games), and each of the 31 NHL teams during the 2017–18 and 2018–19 seasons competed in 82 regular season games per season (n = 2,542 games), 3 so as to comprise our total sample of 5,002 NHL regular season games.
Data Analysis
For our main analyses, we performed binary logistic regression, using RStudio version 1.2.5001. Based on previous home advantage studies that used similarly structured game-level data (each game appears only once in the dataset; e.g., Doyle & Leard, 2012; Hoffmann et al., 2017; Leard & Doyle, 2011), our initial analysis treated the data as independent observations, following what has been considered to be a reasonable approach (Doyle & Leard, 2012; Leard & Doyle, 2011). The dependent variable in our analysis was home team outcome (i.e., win vs. loss). The first independent variable was “game ending type,” which consisted of three categories (i.e., regulation, overtime, and the shootout). The second independent variable was home relative to visitor team quality, which also consisted of three categories (i.e., superior home team, evenly matched home team, inferior home team). We analyzed the contributions of the independent variables in three steps (cf. Hoffmann et al., 2017). In Block 1, we assessed the individual effect of game ending type on home team outcome. This step explored a home team’s odds of winning a game in regulation time or a shootout compared to overtime (overtime served as the reference category). In Block 2, we adjusted for the relative quality of home versus visiting teams. Thus, this step repeated Block 1 while controlling for whether a home team was superior, inferior, or evenly matched in relation to a visiting team (inferior home team served as the reference category). Finally, in Block 3, we included game ending type, team quality, as well as the interaction between game ending type and team quality as predictors of game outcome.
While some researchers have deemed the treatment of game-level data as individual observations to be appropriate (Doyle & Leard, 2012; Leard & Doyle, 2011), others have made a compelling argument for using multi-level modeling because the games are nested within teams (Nevill et al., 2013; Wang et al., 2011). Therefore, we repeated our analyses using multi-level logistic regression, in which the 31 home teams accounted for level 2 (between-team) variation and their “repeated” games over the four NHL seasons accounted for level 1 (within-team) variation. For ease of interpretation for both the individual- and multi-level analyses, we reported only the Block 3 findings in the Results section.
Our approach to calculating team quality was partly based on the method adopted by Hoffmann et al. (2017). First, we assigned each home team in each game a team quality score, operationalized as each team’s end of season points percentage score (representing the number of points a team earned at season’s end divided by the number of possible points at season’s end). Points percentage is a common statistic reported on the NHL’s official website (National Hockey League, 2019). Similarly, we assigned each visiting team in each game a team quality score, again using the visiting team’s end of season points percentage. Third, we subtracted visiting team quality from home team quality, resulting in a differential or relative home team quality score for each game. A positive differential score indicated that the home team was of superior quality, whereas a negative score indicated that the visiting team was stronger. To enhance interpretation of the team quality variable in this study, we split the differential score (range: ± 42.7) into three groups based on cut-offs used by Bray et al. (2003). Superior quality home teams were those whose differential score was greater than one standard deviation above the sample mean. Evenly matched home teams were those whose differential score fell within one standard deviation of the sample mean. Inferior quality home teams were those whose differential score was lower than one standard deviation below the sample mean. Thus, team quality scores were relative, not absolute.
Results
Descriptive Statistics
The majority of NHL games concluded in regulation time (77.4%), followed by overtime (14.7%), and the shootout (7.9%). Of the 3,871 games decided in regulation, home teams won 2,153 (55.6%). Of the 735 games that concluded in overtime, home teams won 362 (49.3%). Home teams won 222 of the 396 games that entered the shootout (56.1%). Home team winning percentage stratified by game ending type and team quality is reported in Table 1. Among games decided in regulation, the home team winning percentage ranged from 33.1% (inferior home teams) to 77.4% (superior home teams). Among games that concluded in overtime, the home team winning percentage ranged from 40.9% (inferior home teams) to 53.0% (superior home teams). Among games that extended into the shootout, the home team winning percentage ranged from 52.4% (inferior home teams) to 59.3% (superior home teams). These findings suggest that there is substantial variation in the likelihood of winning at home during regulation, but that this variation becomes increasingly smaller as the game progresses toward the shootout. In fact, once in the shootout, home teams win a greater proportion of games than they lose regardless of the relative quality of their opponent.
Home Team Winning Percentage Stratified by Game Ending Type and Team Quality.
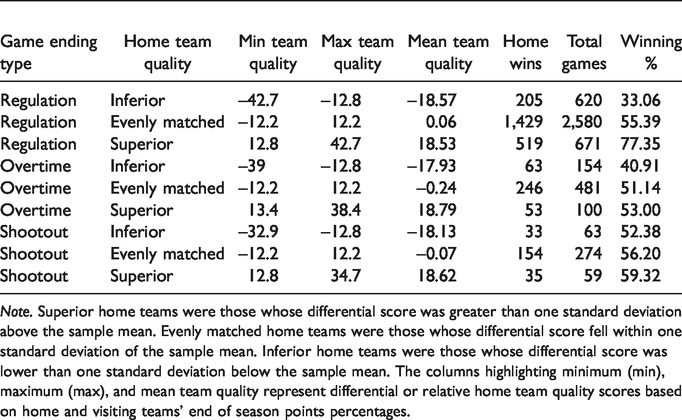
Note. Superior home teams were those whose differential score was greater than one standard deviation above the sample mean. Evenly matched home teams were those whose differential score fell within one standard deviation of the sample mean. Inferior home teams were those whose differential score was lower than one standard deviation below the sample mean. The columns highlighting minimum (min), maximum (max), and mean team quality represent differential or relative home team quality scores based on home and visiting teams’ end of season points percentages.
Main Analysis
Regulation Compared to Overtime (Fixed-Effects Model)
We explored whether home team wins/losses were related to whether games ended in regulation versus overtime (see Table 2). The results concerning game ending type in Block 3 indicated that, on average, there was no significant difference in home teams’ odds of winning in regulation compared to overtime (OR = .71, 95% CI [.50, 1.03]). When team quality was considered, evenly matched home teams had significantly increased odds of winning relative to inferior home teams (OR = 1.51, 95% CI [1.05, 2.19]), while the change in the odds of winning between superior and inferior quality home teams just failed to reach a conventional statistical significance level of p < .05 (OR = 1.63, 95% CI [.98, 2.71]). Finally, there were significant interactions between team quality and game ending type. Evenly matched home teams were found to have 1.66 times (95% CI [1.10, 2.50]) greater odds of winning than inferior home teams when games concluded in regulation rather than overtime. Superior home teams were found to have 4.24 (95% CI [2.41, 7.45]) times greater odds of winning than inferior home teams when games concluded in regulation rather than overtime. Thus, following regulation play, the home advantage appears to drop in overtime for evenly matched and superior home teams; this decline is particularly sharp for home teams that are clearly superior to their visiting counterparts.
Home Teams’ Odds of Winning Across Game Ending Types (Fixed-Effects Model).
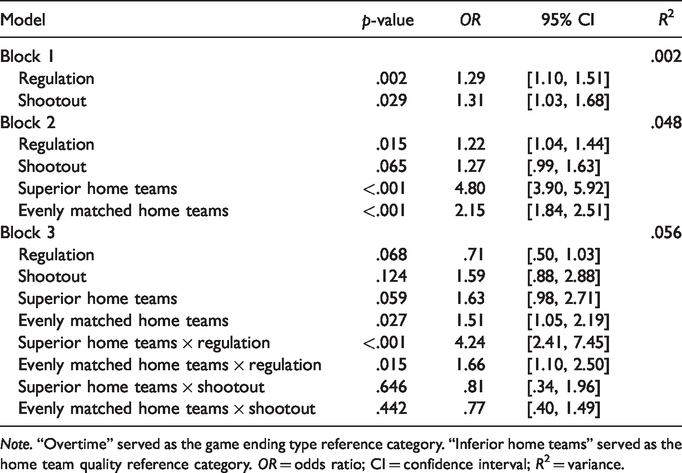
Note. “Overtime” served as the game ending type reference category. “Inferior home teams” served as the home team quality reference category. OR = odds ratio; CI = confidence interval; R2 = variance.
Shootout Compared to Overtime (Fixed-Effects Model)
We explored whether home team wins/losses were related to whether games ended in overtime or extended into the shootout (see Table 2). The results concerning game ending type in Block 3 indicated that, in general, home teams’ odds of winning as games proceeded from overtime to the shootout did not change significantly (OR = 1.59, 95% CI [.88, 2.88]). Regarding team quality interaction results, evenly matched home teams did not have significantly different odds of winning than inferior home teams when games concluded in the shootout rather than overtime (OR = .77, 95% CI [.40, 1.49]). Similarly, superior home teams did not have significantly different odds of winning than inferior home teams when games concluded in the shootout rather than overtime (OR = .81, 95% CI [.34, 1.96]).
Multi-Level Modeling
The results of multi-level modeling were nearly identical to those of the fixed-effects model; the odds ratios in both approaches were identical in Block 3 (see Table 3 in online supplemental file). The intraclass correlation value indicated that less than 1% of the variability in game-level data could be attributed to between-team variation.
Discussion
In this study, we compared NHL home teams’ odds of winning in regulation, overtime, and the shootout during the four seasons in which the newer 3-on-3 overtime format was applied. First, on average, home teams’ odds of winning in regulation compared to overtime were not significantly different. However, a pattern emerged with practical implications when interaction effects between game ending type and team quality were tested. Superior—and even equally matched—home teams had significantly greater odds of winning than inferior home teams when games ended in regulation rather than overtime. In other words, compared to inferior home teams, home teams that are equally matched or substantially better than visiting teams have a higher likelihood of winning games that finish in regulation than games that finish in overtime. Second, home teams’ odds of winning as games proceeded from overtime to the shootout did not change significantly, nor were there any interaction effects between the overtime versus shootout game ending type and team quality. That is, the odds of the home team winning in the shootout were not significantly higher or lower than in overtime, irrespective of team quality.
Our hypothesis that the overtime rule change might coincide with home teams demonstrating a higher likelihood of winning in regulation compared to overtime held true for superior and evenly matched home teams; contrastingly, home teams that were weaker than their visiting opponents performed better in overtime than in regulation. Using a continuous (rather than categorical) team quality variable, Hoffmann et al. (2017) found that superior home teams in the former 4-on-4 overtime era were 1.03 times more likely to win games that concluded in regulation versus overtime. In our study, superior home teams had a more pronounced winning likelihood in games decided in regulation versus overtime, such that they had 4.24 times greater odds of winning than inferior home teams when games ended in regulation rather than overtime. Further, evenly matched home teams had 1.66 times greater odds of winning than inferior home teams when games concluded in regulation rather than overtime. While our results and those from Hoffmann et al. cannot be directly compared because relative team quality was measured differently in each study, the average home winning percentages without considering team quality across the former 4-on-4 era Hoffmann et al. studied and the newer 3-on-3 format studied here generally support the contention that there is a larger difference between home teams’ winning odds in regulation versus overtime play in the current 3-on-3 overtime era (4-on-4 era: 56.6% [regulation] vs. 54.2% [overtime]; 3-on-3 era: 55.6% [regulation] vs. 49.3% [overtime]).
Anecdotally, 3-on-3 overtime play has been associated with reports of high patience and overcautious behavior compared to 4-on-4 overtime play (Matisz, 2018). With fewer players on the ice surface in the 3-on-3 format, players on both teams have more time and space to make decisions, often resulting in players/teams holding on to the puck for longer durations while they look to capitalize on the “right” opportunity. Possibly, this distinguishing cautious and strategic style of play is mentally taxing, particularly for players on relatively strong home teams who may experience heightened pressure to win in front of their audience. Individual play tends to be highlighted with fewer players on the ice during 3-on-3 overtime, possibly enhancing self-awareness and propensities to choke, particularly for players on superior home teams for whom fans have high expectations. The suggestion that superior home teams experience particular pressure to please their home fans in overtime after having not won in regulation is also supported by extant research on expectations for success. For example, Baumeister et al. (1985) demonstrated that audience (but not private) expectations for success lowered individuals’ performances. A related but alternative explanation is that superior home teams receive less crowd support (or possibly negative crowd reactions) after not having beaten their ostensibly weaker opponents in regulation time, which results in significant performance decrements in overtime. Whereas superior home teams may experience enhanced pressure and decreased fan support in overtime, players on inferior home teams may experience a relative performance improvement in overtime versus regulation play, because they have exceeded fans’ expectations just by getting into overtime and thus may benefit from a particularly enthusiastic crowd. Elevated crowd support in overtime may also have an indirect but positive effect on inferior home team players’ confidence levels in overtime.
The pattern of results in our study does not align with the prediction that home teams should experience a performance decline and lower winning odds in the shootout compared to overtime games, which was found in the 4-on-4 overtime era (Hoffmann et al., 2017). Indeed, the average home team winning percentage in shootouts is 56.1% in the 3-on-3 overtime era compared to 47.6% in the former 4-on-4 overtime era (i.e., Hoffmann et al., 2017). In this study we found that home teams’ odds of winning were not significantly lower when games were decided in the shootout rather than overtime. We had presumed that there would be increasingly greater pressure on home players (including the goaltender) and potential for choking among individual players in the shootout, since supportive (home) audiences are thought to have a particularly deleterious effect on individual skill execution and performance (Butler & Baumeister, 1998; Wallace et al., 2005).Our unexpected findings coud be due in part to the newer transition from 3-on-3 (versus 4-on-4) overtime play to the shootout. If 3-on-3 overtime play approximates individual play, skaters may perceive the transition from 3-on-3 overtime play to individual play in the shootout to be less drastic than the transition from 4-on-4 overtime to the shootout. That is, the 3-on-3 format might result in players perceiving that they are playing independently to a greater extent than the more team-oriented 4-on-4 format. As such, the additional pressure that comes with performing independently in a shootout in front of home fans may have had a smaller impact following 3-on-3 overtime play. Moreover, as shootouts have now been part of the NHL rules for 15 years, it is possible that home players have learned through experience how to better adapt to shootout conditions when competing at home (e.g., by learning how to better self-regulate in these situations). These explanations are speculative, and further studies of NHL home team shootout performance are clearly warranted.
Our results may also relate to the rule factor from Carron and colleagues’ home advantage model (Carron et al., 2005; Courneya & Carron, 1992) suggesting that certain league regulations place home teams at an advantage in some sports. For instance, Liardi and Carron (2011) examined whether the face-off rule in the 2006-07 NHL season requiring the visiting team’s center to place his stick down in the face-off circle earlier than the home team’s center gave the home team’s center an advantage. While these researchers found that home teams won 51.9% of face-offs, this modest advantage was not statistically associated with home wins. Viewed through the lens of the “rule factor,” the NHL’s decision to implement the shootout rule during the 4-on-4 overtime era may have (inadvertently) put home teams at a disadvantage when games were decided in the shootout (Hoffmann et al., 2017). However, the 3-on-3 overtime rule change seems to have favored home teams in shootouts.
On a related note, since the application of the 3-on-3 overtime rule, fewer games have ended in shootouts. Whereas nearly the same percentage of games concluded in regulation in both the 3-on-3 (77.4%) and 4-on-4 (76.5%) overtime eras, roughly 5% more games ended in overtime (14.7%) and 5% fewer ended in the shootout (7.9%) in the 3-on-3 (versus 4-on-4) overtime era. A greater number of games are now being decided in overtime for which superior and evenly matched home teams seem to have a lower likelihood of success compared to games than end in regulation.
Limitations and Future Directions
A strength of this study is that our results are based on data from every regular season game in which the 3-on-3 overtime format has been applied. We also adjusted for the relative quality of home and visiting teams, which revealed that team quality moderated some of the relationships between game ending type and home team outcome. Finally, we analyzed our data using both fixed-effects and multi-level modeling, and both approaches yielded identical odds ratios, providing higher confidence in the findings. Despite these strengths, there are important limitations to this study. First, the assumption that a team quality score equates to an end of season points percentage may be questioned. While prior research has suggested that end of season winning percentage correlates strongly with early, mid, and late-season performance for both home and visiting NHL teams (Hoffmann et al., 2012), future researchers might consider alternative approaches for calculating team quality. For instance, Clarke and Norman (1995) described a method that estimates home advantage and team quality simultaneously based on goal margins. Second, similar to other NHL home (dis)advantage studies (e.g., Gayton et al., 2011), we did not specifically account for goaltending performance, which may be an important factor to consider when adjusting for team quality. Gaining insight into the relationship between goaltenders’ performances and home teams’ odds of winning in shootouts relative to overtime would contribute significantly to the home (dis)advantage literature. Third, our results were generated retrospectively from archival data; future research might use qualitative approaches (e.g., interviews with NHL players) or experimental designs to confirm and/or explain the pattern of results (Wallace et al., 2005). Borrowing partly from designs used in non-sport research (e.g., Butler & Baumeister, 1998), experimental approaches where athletes perform individual skill-based tasks (e.g., shootouts in ice hockey, free-throws in basketball) versus group-based tasks (e.g., 3-on-3 play in ice-hockey or basketball)—all in the presence of a supportive audience—might glean insights into the effects of home crowds on individual versus group performance in sport. These designs would ideally control for the relative quality or talent of athletes. While such research efforts would be challenging from a recruitment and feasability standpoint, they would undoubtedly contribute to our understanding of the home (dis)advantage phenomenon.
Conclusion
From a practical standpoint, superior and evenly matched home teams should likely make every effort to win a game in regulation or, alternatively, to extend the game to the shootout if needed. Coaches of these teams might consider implementing appropriate strategies so as to increase their teams’ chances of winning in regulation. As much as possible, home teams that are substantially inferior to their visiting opponents are advised to prolong the game to the shootout, such as by implementing conservative/defensive strategies in regulation and overtime. In contrast, visiting teams that are considerably weaker than their opponents should apply more aggressive/offensively-minded strategies aimed at winning in overtime.
Supplemental Material
sj-pdf-1-pms-10.1177_0031512520966138 - Supplemental material for Home Team (Dis)Advantage Patterns in the National Hockey League: Changes Through Increased Emphasis on Individual Performance With the 3-on-3 Overtime Rule
Supplemental material, sj-pdf-1-pms-10.1177_0031512520966138 for Home Team (Dis)Advantage Patterns in the National Hockey League: Changes Through Increased Emphasis on Individual Performance With the 3-on-3 Overtime Rule by Matt D. Hoffmann, Desmond McEwan, Roy F. Baumeister, Joel D. Barnes and Michelle D. Guerrero in Perceptual and Motor Skills
References
Supplementary Material
Please find the following supplemental material available below.
For Open Access articles published under a Creative Commons License, all supplemental material carries the same license as the article it is associated with.
For non-Open Access articles published, all supplemental material carries a non-exclusive license, and permission requests for re-use of supplemental material or any part of supplemental material shall be sent directly to the copyright owner as specified in the copyright notice associated with the article.