
Abstract
The purpose of this study was to verify the effectiveness of the rate of perceived exertion threshold (RPET) for predicting young competitive swimmers’ lactate threshold (LT) during incremental testing. We enrolled 13 male athletes (M age = 16, SD = 0.6 years) in an incremental test protocol consisting of eight repetitions of a 100-meter crawl with 2-minute intervals between each repetition. We collected data for blood lactate concentration ([La]) and Borg scale rate of perceived exertion (RPE) at the end of each repetition. The results obtained were: M RPET = 4.98, SD = 1.12 arbitrary units (A.U.) and M lactate threshold = 4.24, SD = 1.12 mmol.L−1, with [La] and RPE identified by the maximal deviation (Dmax) method without a significant difference (p > 0.05) and large correlations between DmaxLa and DmaxRPE at variables for time (r = 0.64), velocity (r = 0.67) and percentage of personal best time (PB) (r = 0.60). These results suggest that RPET is a good predictor of LT in young competitive swimmers.
Introduction
Metabolic thresholds have been broadly used to prescribe training loads and predict sports performance (Quittmann et al., 2018). These thresholds can be determined according to physiological measures, such as blood lactate concentration ([La]) during exercise. The identification of these thresholds by employing the [La] curve has been suggested by several authors as a functional mechanism for determining and/or qualifying intensity in incremental tests (Berg et al., 1990; Forsyth et al., 2017; Heck et al., 1985). Thresholds that are identified using blood lactate concentrations as the variable of interest are referred to as lactate threshold (LT) (Bentley et al., 2001).
The determination of the [La] allows an indirect evaluation of the metabolic acidosis produced during exercise. Moreover, metabolic markers like [La] are extensively used in exercise programs requiring absolute intensities (Billat et al., 2003). From the values of [La] it is possible to obtain a practical evaluation of the athletes’ lactate metabolism and anaerobic thresholds. It is also possible to monitor an athletes' training intensity by observing incremental testing or a single bout of exercise during training (Gastin, 2001).
Many methods have been proposed and can be used to detect the LT, either subjectively or objectively (Heuberger et al., 2018). The visual LT method is based on visual detection of the rise in the blood lactate concentration versus work rate (Davis et al., 2007; Davis et al., 1976); and, consequently, it is highly subjective (Davis et al., 2007). While the LT 4 mmol method is more objective and is based on a fixed value (4 mmol.L−1) of lactate level in the blood (Heck et al., 1985), this method does not consider individual variability and, therefore, may under- or overestimate the individual’s real endurance capacity (Faude et al., 2009; Simon et al., 1983; Stegmann et al., 1981). Another objective method proposed for determining [La] is the maximal deviation method (Dmax) (Cheng et al., 1992). This method is defined as the maximum perpendicular distance between the line that connects the first and last point to a third-order polynomial curve representing the lactate kinetics during the incremental test (Cheng et al., 1992). The greatest advantage of this method is that the individual’s blood lactate response is considered, meaning that the estimate is not biased by influence from an idiosyncratic marker (Machado et al., 2011).
Other methods of determining [La] are expensive, impractical for day-to-day training and often inaccessible, especially for coaches who work with youth athletes. Thus, the rate of perceived exertion (RPE) has been used as an alternative means of identifying metabolic thresholds (Zamunér et al., 2011). Coaches, athletes, and researchers have reported the RPE scale to be an excellent tool for assessing exercise intensity because it is explicable, accessible, easy to apply and low-cost (Barroso et al., 2014; Wallace et al., 2008). Studies have shown a strong correlation between LT and RPE, making it possible to estimate the metabolic threshold via fixed RPE scores (Faulkner & Eston, 2008; Kang et al., 2003; Scherr et al., 2013; Zamunér et al., 2011). Furthermore, the rate of perceived exertion threshold (RPET) has been used to identify metabolic thresholds in cycling, rowing and running (Erdogan et al., 2010; Ferreira et al., 2016; Machado et al., 2011), and in each case it has proven to be an effective method for estimating anaerobic threshold in athletes and other active people in a terrestrial environment.
Considering this prior success with RPET and the fact that little is known of its applicability to an aquatic environment, we became interested in investigating the use of RPE as a mechanism for estimating the physiological transition threshold in competitive youth swimmers. We suspected that RPET would be a practical, low-cost tool, that is easily understood and accessible to coaches and youth athletes for this purpose, and we hypothesized that the RPET and the LT would be identified at similar intensities by the Dmax method. Thus, the purpose of this study was to verify the effectiveness of the RPE scale to predict the LT during an incremental test in young competitive male swimmers.
Method
Sample
We used GPower® software (version 3.1.3 – Düsseldorf, Germany) (Faul et al., 2007) to calculate an estimated required sample size, assuming a correlation of r = 0.75 between the lactate threshold (DmaxLa) and the RPET (DmaxRPE) in active men as obtained by Ferreira et al. (2016) . Adopting ‘r = 0.75’ with a tolerable error of ‘0.05’ and a statistical power of 0.95 we determined a need for at least 11 participants. Subsequently, we actually invited 13 young male swimmers, all of whom agreed to participate in this study (see the participants’ anthropometric characteristics in Table 1). Each participant had achieved national championship qualification indeces and competed at Brazilian National Swimming Championships. Participants’ ages ranged from 15-16 years old (Mage = 16, SD = 0.6).
Participants’ Anthropometric and Performance Characteristics (n = 13).
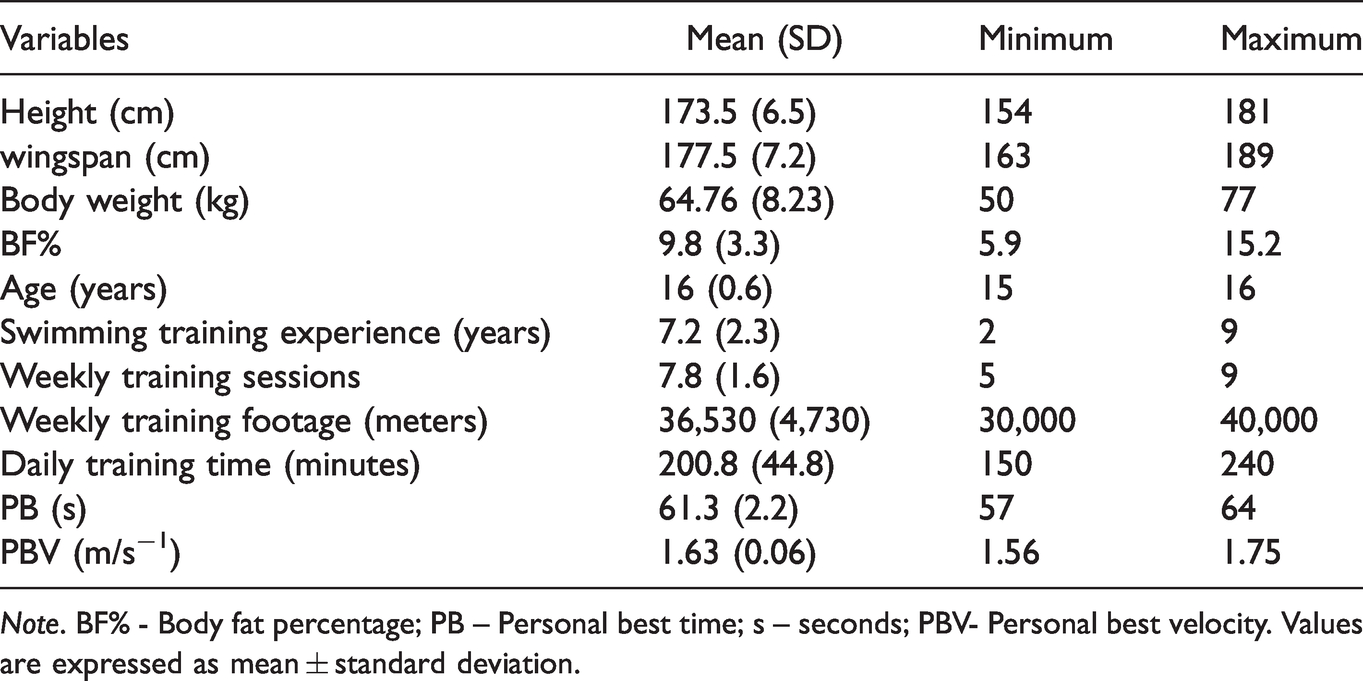
Note. BF% - Body fat percentage; PB – Personal best time; s – seconds; PBV- Personal best velocity. Values are expressed as mean ± standard deviation.
Before participants began this study, they received a comprehensive verbal and written explanation about the study’s benefits and risks and understood that they could withdraw from this study at any time. We obtained written informed consent from the parents of all participants as each participant was less than 18 years of age; as advised by the Declaration of Helsinki (World Medical Association, 2001). This study was approved by the Research Ethics Committee of the Department of Biological Sciences of the Federal University of Parana (approval number: 2.853.168).
Experimental Approach and Procedures
This was a cross-sectional study performed in a 25-meter indoor pool with the water temperature at about 28 °C as recommended by the International Swimming Federation (FINA). Participants visited the pool on three occasions, each separated by at least 48 hours. Participants started with an individualized 400–600 meter warm-up swim as adapted from a protocol by Neiva et al. (2014), with a proper intensity based on a brief approach to race pace velocity as adapted from Keskinen et al. (1989). Next, after a 15-minute interval, participants performed one maximum 100-meters swim to identify their personal best time (PB).
Participants were instructed to not drink alcohol and/or caffeine for 12 hours, to eat only light meals for up to two hours before the test protocol, and to avoid vigorous physical activity for 24 hours before testing. At the second visit, the researchers ensured that all participants were informed and familiar with the test protocol, the RPE scale to be used and the swim pace required by the test protocol. All participants had been using the RPE scale for over a year during training. During the third visit, we measured the participants’ anthropometrics (i.e., body weight, height, wingspan, and body fat percentage or BP%). Then, 15 minutes after their individualized 400–600-meter warm-up swim with intensity as described above, we conducted the incremental test using their PB time to calculate a 100-meter incremental test that involved each participant completing eight 100-meter progressive effort swims. Each of the eight progressive effort swims commenced with a push start from within the pool.
Measures
Anthropometric Assessment
We measured participants’ body mass and standing height using a Toledo® scale (model 2096 Pp Standard – Toledo, São Bernardo do Campo, Brazil) and Sanny® brand stadiometer (ES2040 - American Medical, São Bernardo do Campo, Brazil) as recommended by Gordon et al. (1988). Skinfold measurements were recorded by a Harpenden® compass (Harpenden Instruments, Marsden, UK) as recommended by Harrison et al. (1988), using the average of three measurements for further data analysis. Body density was calculated according to Jackson and Pollock (1978) (subscapular, triceps, pectoral, medial axillary, suprailiac, abdominal and medial thigh) and body fat percentage was calculated according to Siri (1961).
100-Meter Incremental Test
As described above, the incremental test protocol used in this study, adapted from Keskinen et al. (1989), required the athletes to complete eight 100-meter swims, with each 100-meter swim completed according to a predetermined individualized intensity (± two seconds), with the increasing intensity of each 100-meter swim based on each participant’s 100-meter PB time. First, we calculated each participant’s permissible bandwidth time for each of the eight swim efforts. For the first of the eight swim efforts, the time bandwidth was calculated by adding 25 seconds to their PB. For the next seven 100-meter swims the bandwidth times were calculated by decreasing the permissible swim time of the preceding swim effort by four seconds (see Figure 1). There were 2-minute intervals between each of the eight swim efforts in this protocol. One participant failed to begin the eighth swim as the time taken for the seventh was four seconds slower than the predetermined standardized protocol.
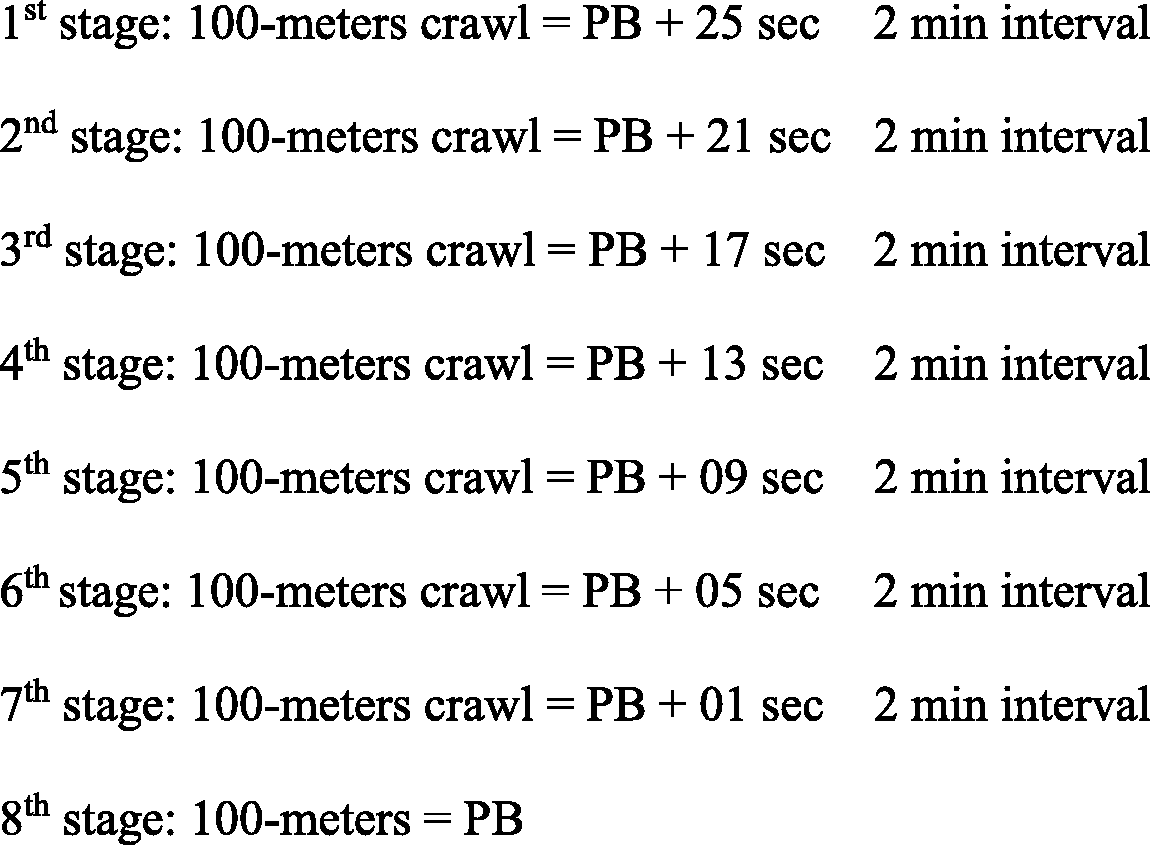
Description of the Incremental Protocol Test as Adapted From Keskinen et al. (1989).
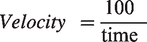
Immediately after completing each 100-meter swim, a research assistant drew the participant’s blood (for [La]) while a second research assistant recorded the same participant’s RPE response. Both sets of data were collected while participants were comfortable within their 2-minute rest intervals. The variable pace required by the incremental test protocol was personalized and controlled by a sound signal every 50 meters (PB + stage time/2) during each stage. These sound signals permitted the evaluator and athletes to identify and control the swimming pace. The velocity (m/s−1) was calculated from the time values (seconds) obtained by the swims in each stage. We divided the length of the swim (100-meters) by the time permitted, using the following equation:
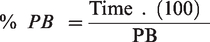
The percentage of PB was calculated by multiplying the time obtained by the swimmer in each stage by the value of 100 (percentage) and dividing this amount by the PB, using the following equation:
We gave participants instructions and familiarization opportunities with the RPE scale on the second visit. At this time, we also discussed the incremental test protocol and the variable swim pace (stroke rate) required at each stage of the test protocol. We implemented only one practice familiarization session, as each participant was highly trained and had experience with holding a variable pace during their daily training schedules and completing the RPE scale. As expected, each participant showed exceptionally good control of their pacing during the incremental test protocol; none were required to repeat the test.
Lactate Thresholds
During the incremental test and after each stage, the athlete sat on the pool’s edge and a capillary blood sample was taken from the fingers. [La]s were obtained by adding 0.7 μl of blood from the digital pulp into reagent stripes (Nova Biomedical Waltham, MA 02454 USA) and analyzed through the lactate analyzer (Lactate Plus -L+, Nova Biomedical, USA), as previously validated (Hart et al., 2013; Tanner et al., 2010). The LT was determined by the Dmax method (DmaxLa) proposed by Cheng et al. (1992). The Dmax method consisted of determining the point on an adjusted curve (polynomial curve) of blood lactate by the exercise intensity, in which the longest perpendicular distance from the drawn line connecting the first and the last point of this curve occurs (see Figure 2).
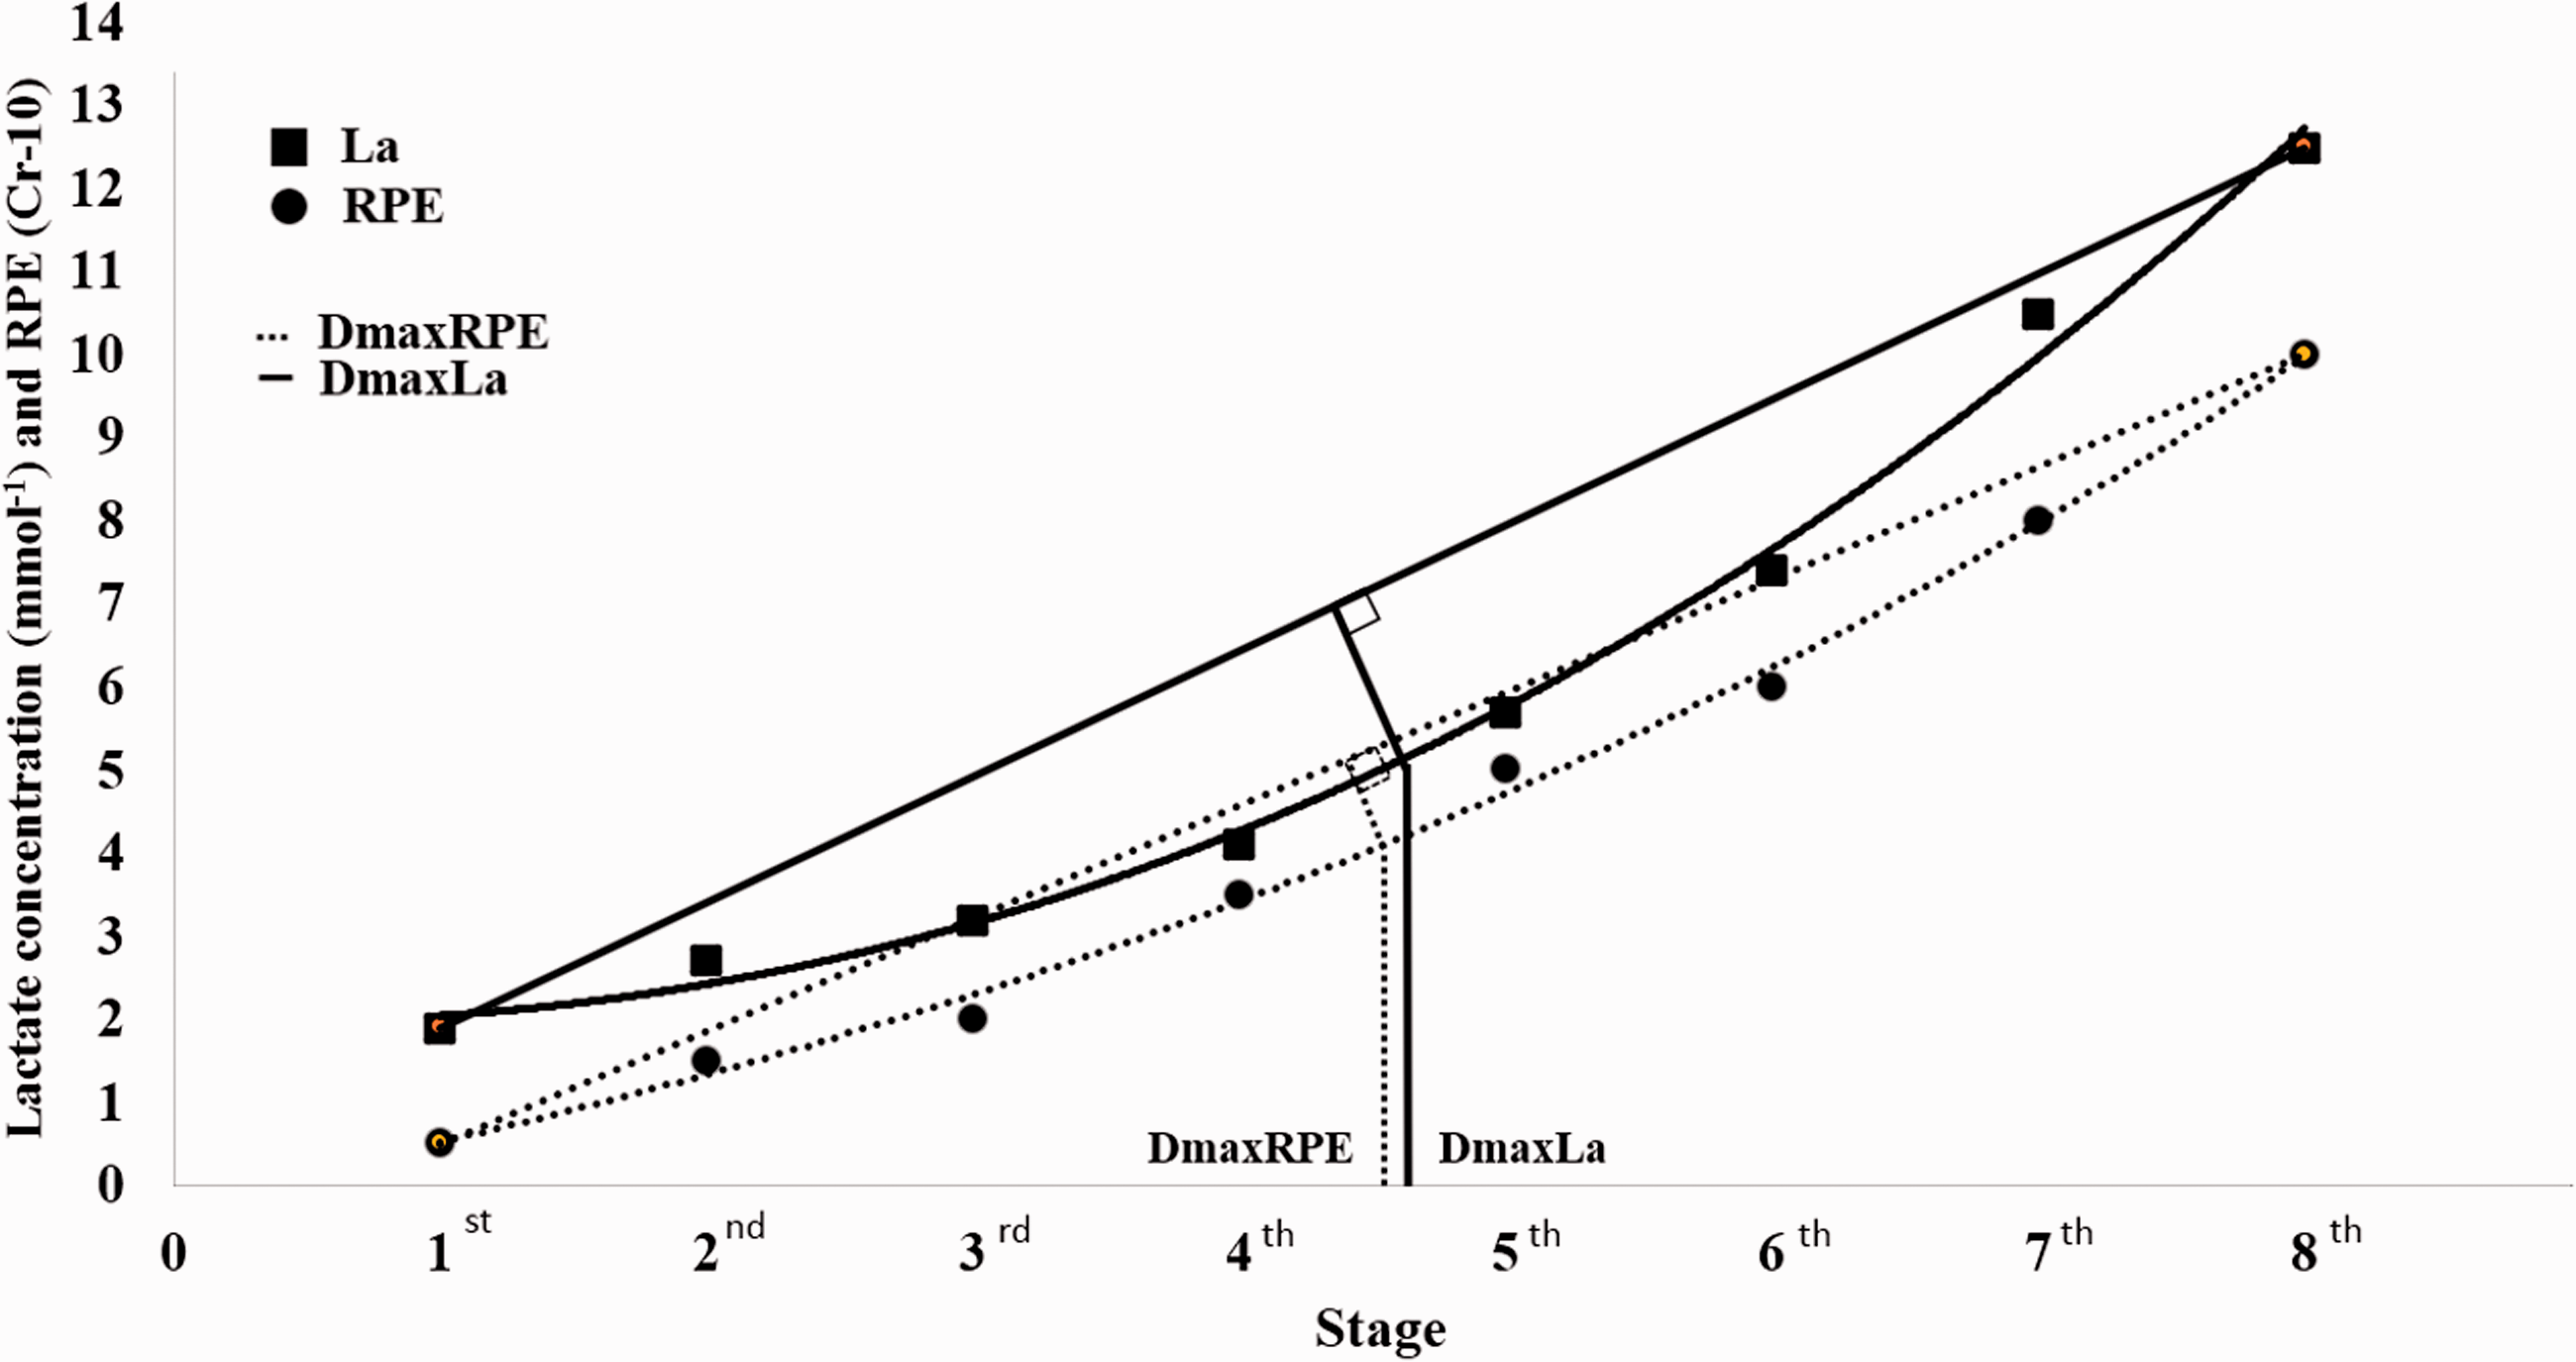
A Traditional Example of the DmaxLa and DmaxRPE Methods. Note. Data taken from one study participant.
The third order polynomial curve was represented by the following equation:

Where, v is the speed (m/s−1) during the incremental test; a, b, c and d are the parameters of the curve; and [La] is the predicted value of the lactate concentration as a function of speed (Machado et al., 2011). Parameters a, b, c and d were determined with the aid of the Statistical Package for the Social Sciences (SPSS Inc. USA), version 20.0.
RPE Threshold
Athletes and their coaches were familiar with the RPE scale (Borg CR-10), having used the measure on several occasions over the previous year. They frequently used the scale during training and had experience with it at different training intensities and volumes, decreasing the potential for incorrect RPE responses from the athletes (G. Borg, 2000). Nevertheless, in the first visit, we gave standardized instructions to all participants regarding the use of the scale during the incremental protocol. RPE was measured using the Borg CR-10 Scale (G. A. Borg, 1982) through the following question: “How do you feel about your last stage effort?” The determination of RPET followed the model proposed by Fabre et al. (2013) in which we used RPE values in the Dmax method (DmaxRPE) just as we had for determining [La] (Dmax method). The points generated by the relation between RPE scores versus intensity (velocity – m/s−1) were plotted on a graph. Thereafter, a linear adjustment was made connecting the end-points of the curve polynomial and a third-order polynomial adjustment connecting all points of the curve (Figure 2). The RPET referred to the largest difference (Dmax) observed between the two adjustments (Conde et al., 2014; Ferreira et al., 2014, 2016).
Statistical Analyses
We expressed data as means (M) and standard deviations (SD). We tested for normality of the data distribution using the Shapiro-Wilk test, and, depending on whether or not data were normally distributed, we used paired Student’s t-tests (for Time, Percentage of PB, velocity) and Mann-Whitney tests (DmaxLa and DmaxRPE) for making group comparisons.
We analyzed the correlation between thresholds with Spearman's rank-order correlation coefficients, classifying findings in accordance with Cohen’s (1988) recommendations for the meanings of various correlation findings as follows: trivial, r < 0.1; small, r = 0.1–0.3; moderate, r = 0.3–0.5; large, r = 0.5–0.7; very large, r = 0.7–0.9; nearly perfect, r > 0.9. We used the concordance limits graphs by Altman and Bland (1983) and Hirakata and Camey (2009) for further analyses between measures that demonstrated significant correlations. The difference between values measured from the two methods was plotted on the y-axis as a function of their means on the x-axis. The limit of concordance involved the mean of the differences between two methods ± 1.96 SD. In all analyses, the significance level adopted was p ≤ 0.05, and the software used was the IBM®SPSS®Statistics Version 20.0 (New York, United States).
Results
For the incremental test protocol of eight 100-meter swims, with each 100-meter swim completed according to a predetermined individualized intensity (controlled by individualized stroke rates), we found no significant differences in the time and velocities recorded from the first to the sixth swim efforts. Between the seventh and eighth swims, the athletes were slower than the permissible time required (see Table 2). For the percentage of intensity, we observed significant difference between the percentage of predetermined intensity and the percentage of intensity performed from the seventh stage onwards (see Table 2).
Particiants’ Means (and Standard Deviations) and Paired Comparisons Between Time, Velocity and Percentage of Intensity at Each of the Participants’ Stages.
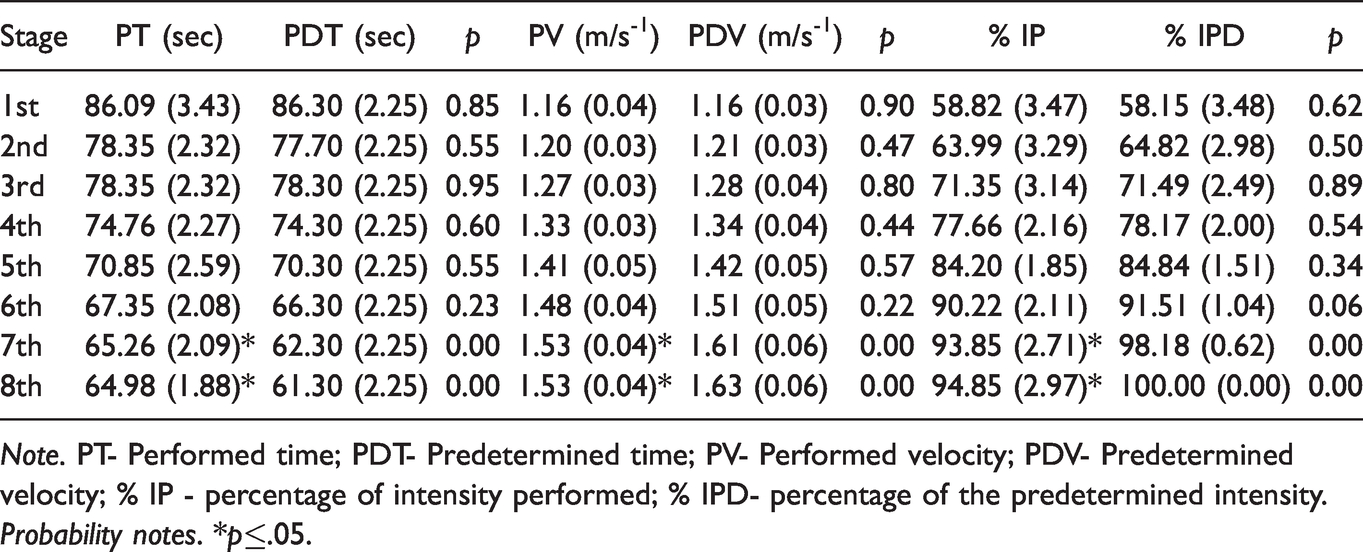
Note. PT- Performed time; PDT- Predetermined time; PV- Performed velocity; PDV- Predetermined velocity; % IP - percentage of intensity performed; % IPD- percentage of the predetermined intensity.
Probability notes. *p≤.05.
There was no significant difference between the RPE (Dmax RPE) and [La] (DmaxLa) thresholds when compared in seconds, velocity and percentage of PB (data from the first visit trial) and [La] (p > 0.05) (see Table 3).
Participants; Means (and Standard Deviations) of Intensity, Velocity and Percentage of PB in RPET and LT.
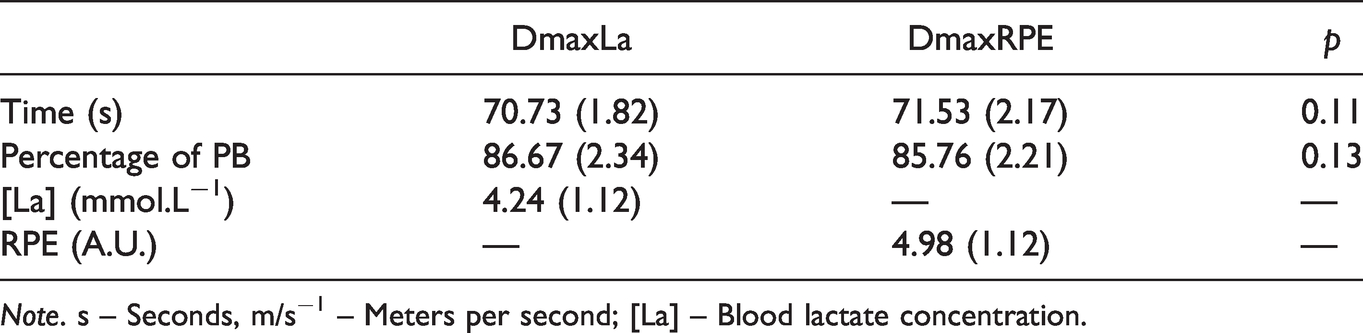
Note. s – Seconds, m/s−1 – Meters per second; [La] – Blood lactate concentration.
Figure 3A and B shows comparisons of the [La] mean value and RPE responses at different intensities (velocity) during the incremental protocol. The DmaxLa occurred during the fifth stage with [La] at 4.24 (SD = 1.12) mmol.L−1 and velocity of 1.41 (SD = 0.04) m/s−1. Correspondingly, DmaxRPE occurred in the fourth stage at 4.98 (SD= 0.91) (arbitrary units: A.U.) and velocity of 1.40 (SD = 0.04) m/s−1. Figure 3C shows both DmaxLa and DmaxRPE in the same graph. There was no statistically significant difference between DmaxLa and DmaxRPE intensities (p = 0.09).
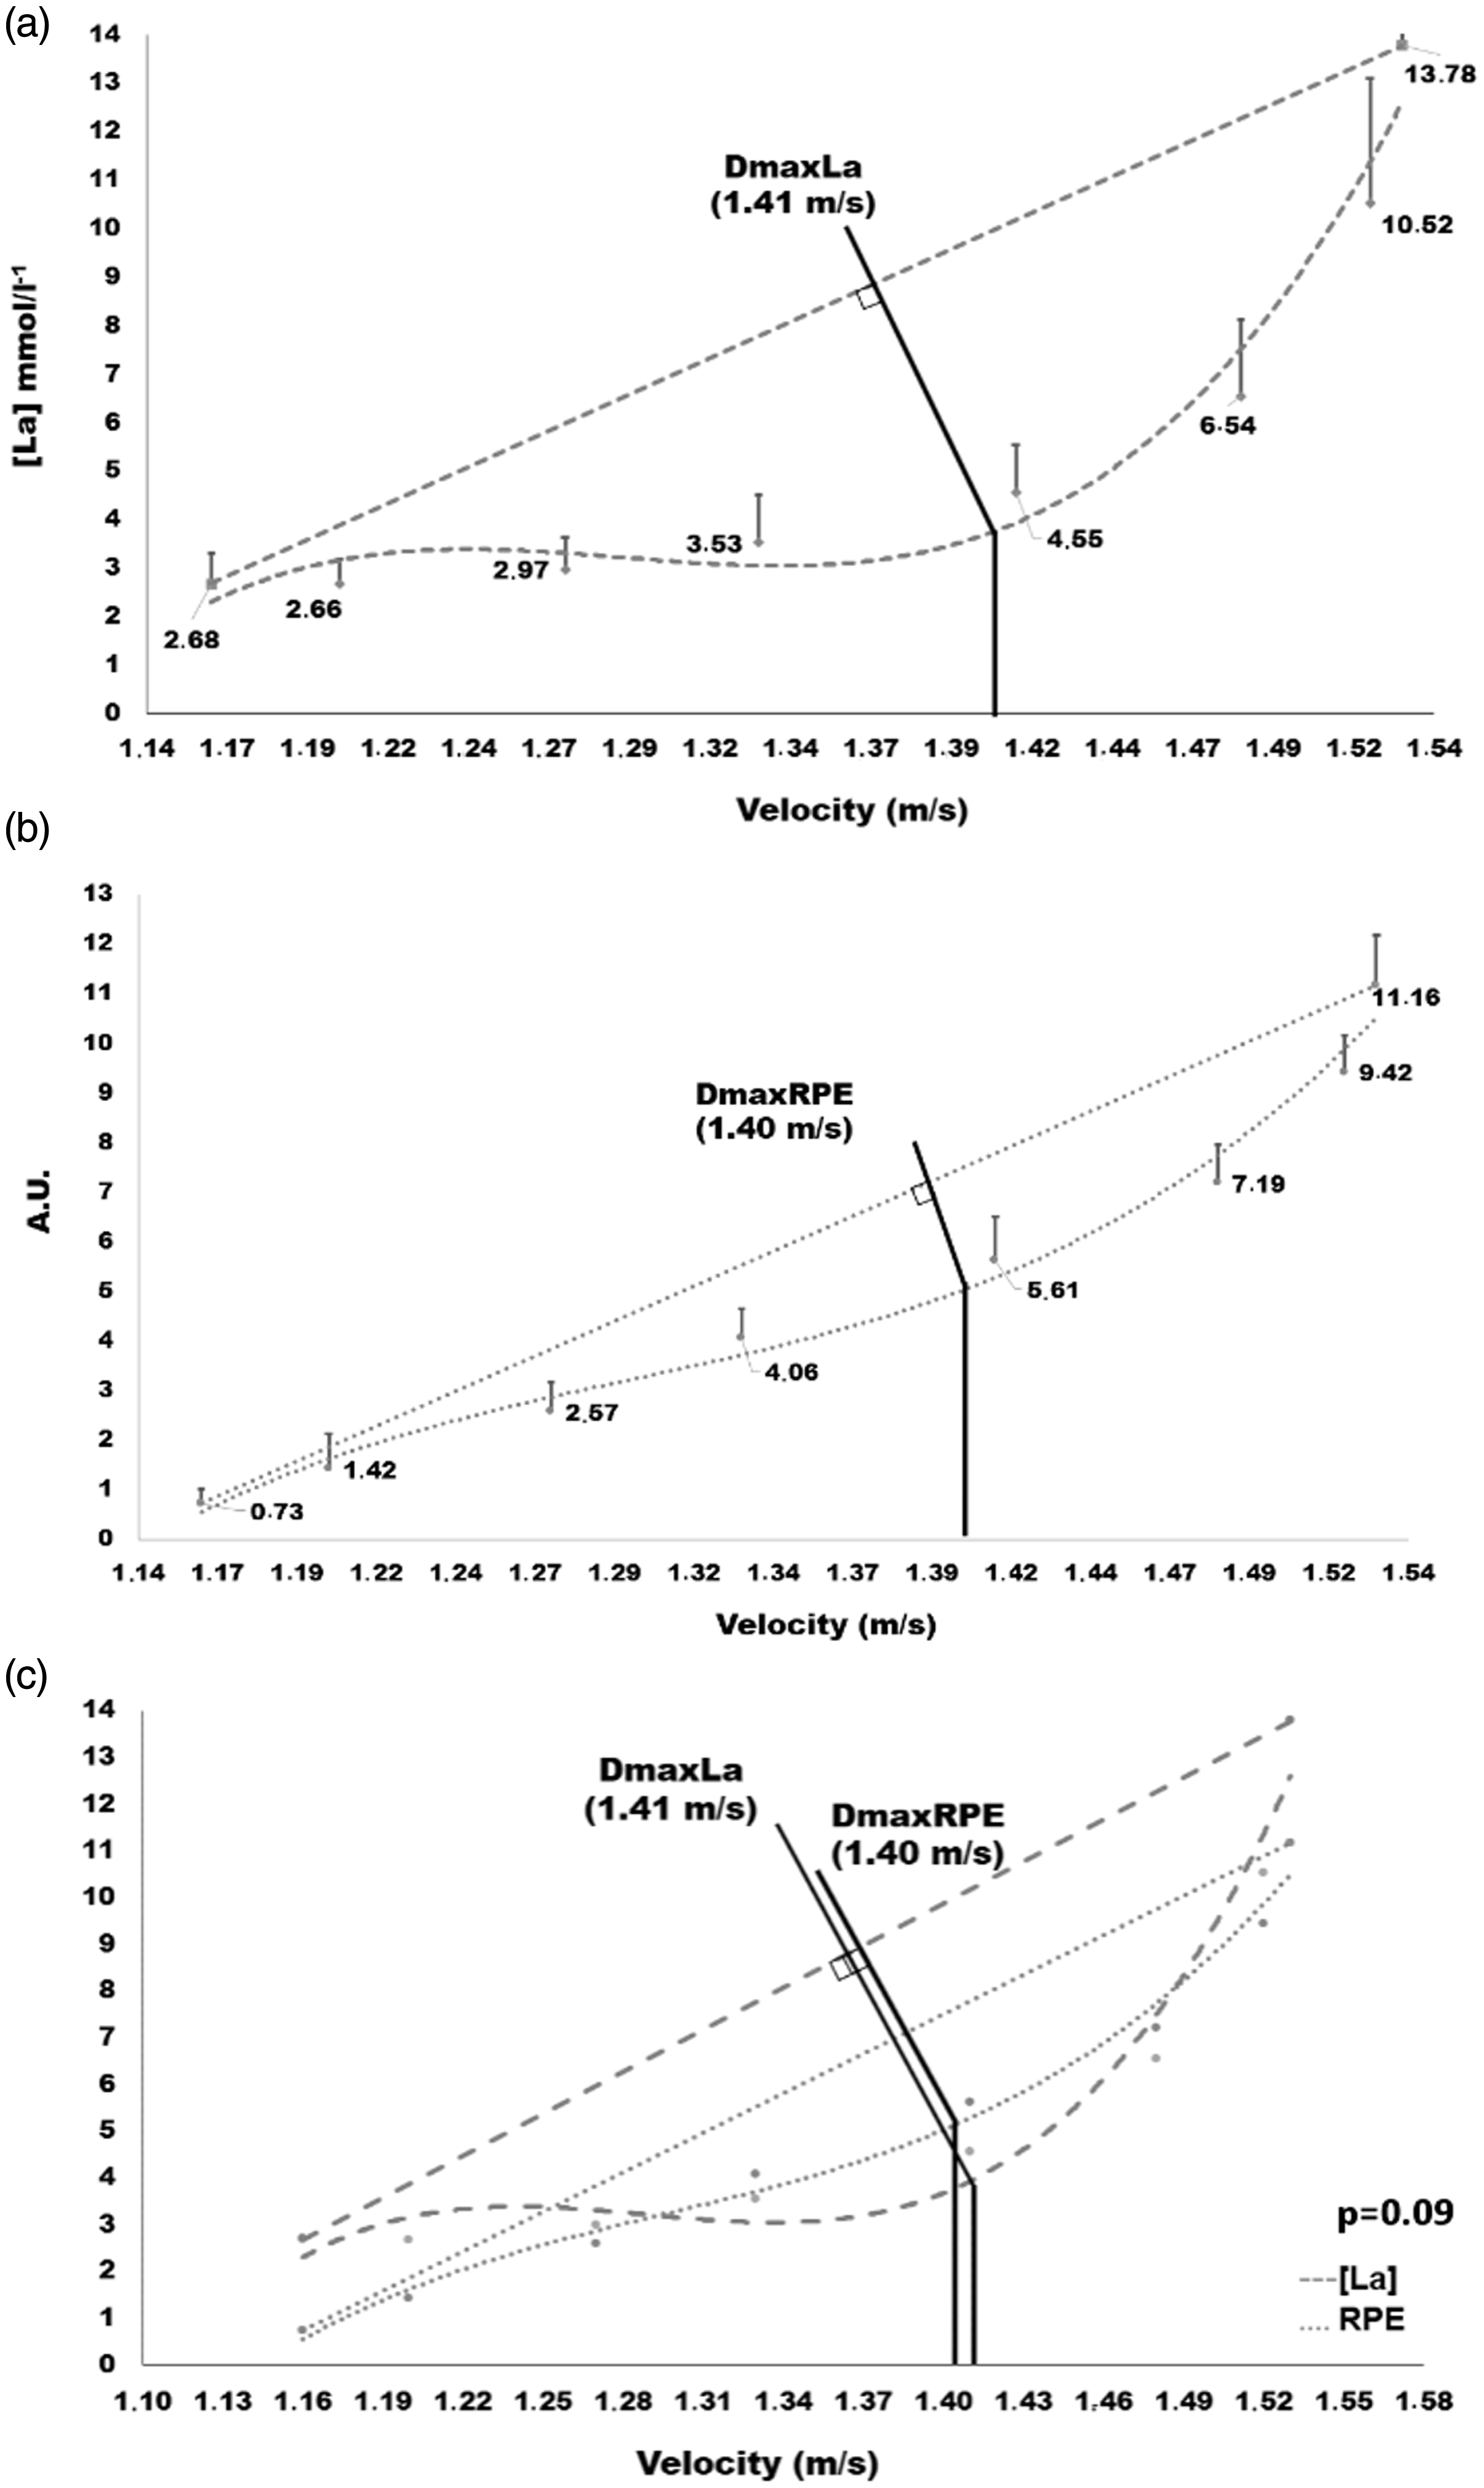
Graph of participants’ mean [La] values at velocities during test protocol (a), mean RPE values at velocities during test protocol (b), and identification of DmaxLa and DmaxRPE in velocities (c). Note. DmaxLa and DmaxRPE values were not significantly different (p = .09).
Figure 4 shows the DmaxLa and DmaxRPE correlations with time (A), velocity (B) and percentage of PB (C). There was a large positive correlation between them for time (r = 0.64; p < 0.01) and velocity (r = 0.67; p < 0.01), and there was a large correlation between them for percentage of PB (r = 0.60 p = 0.01). Figures 3D to F show the concordance analyses between DmaxLa and DmaxRPE by the Bland-Altman plot for time, velocity, and percentage of PB, respectively. The variable time presented an agreement with differences (bias) of -0.80 (SD = 1.70) and concordance limits of 2.54 and −4.14. Velocity presented concordance between the variables with a bias of 0.01 (SD = 0.03) and agreement limits of 0.07 and −0.04; and percentage of PB concordance with a bias of 1.29 (SD = 2.75) and agreement limits of 6.68 and −4.09.
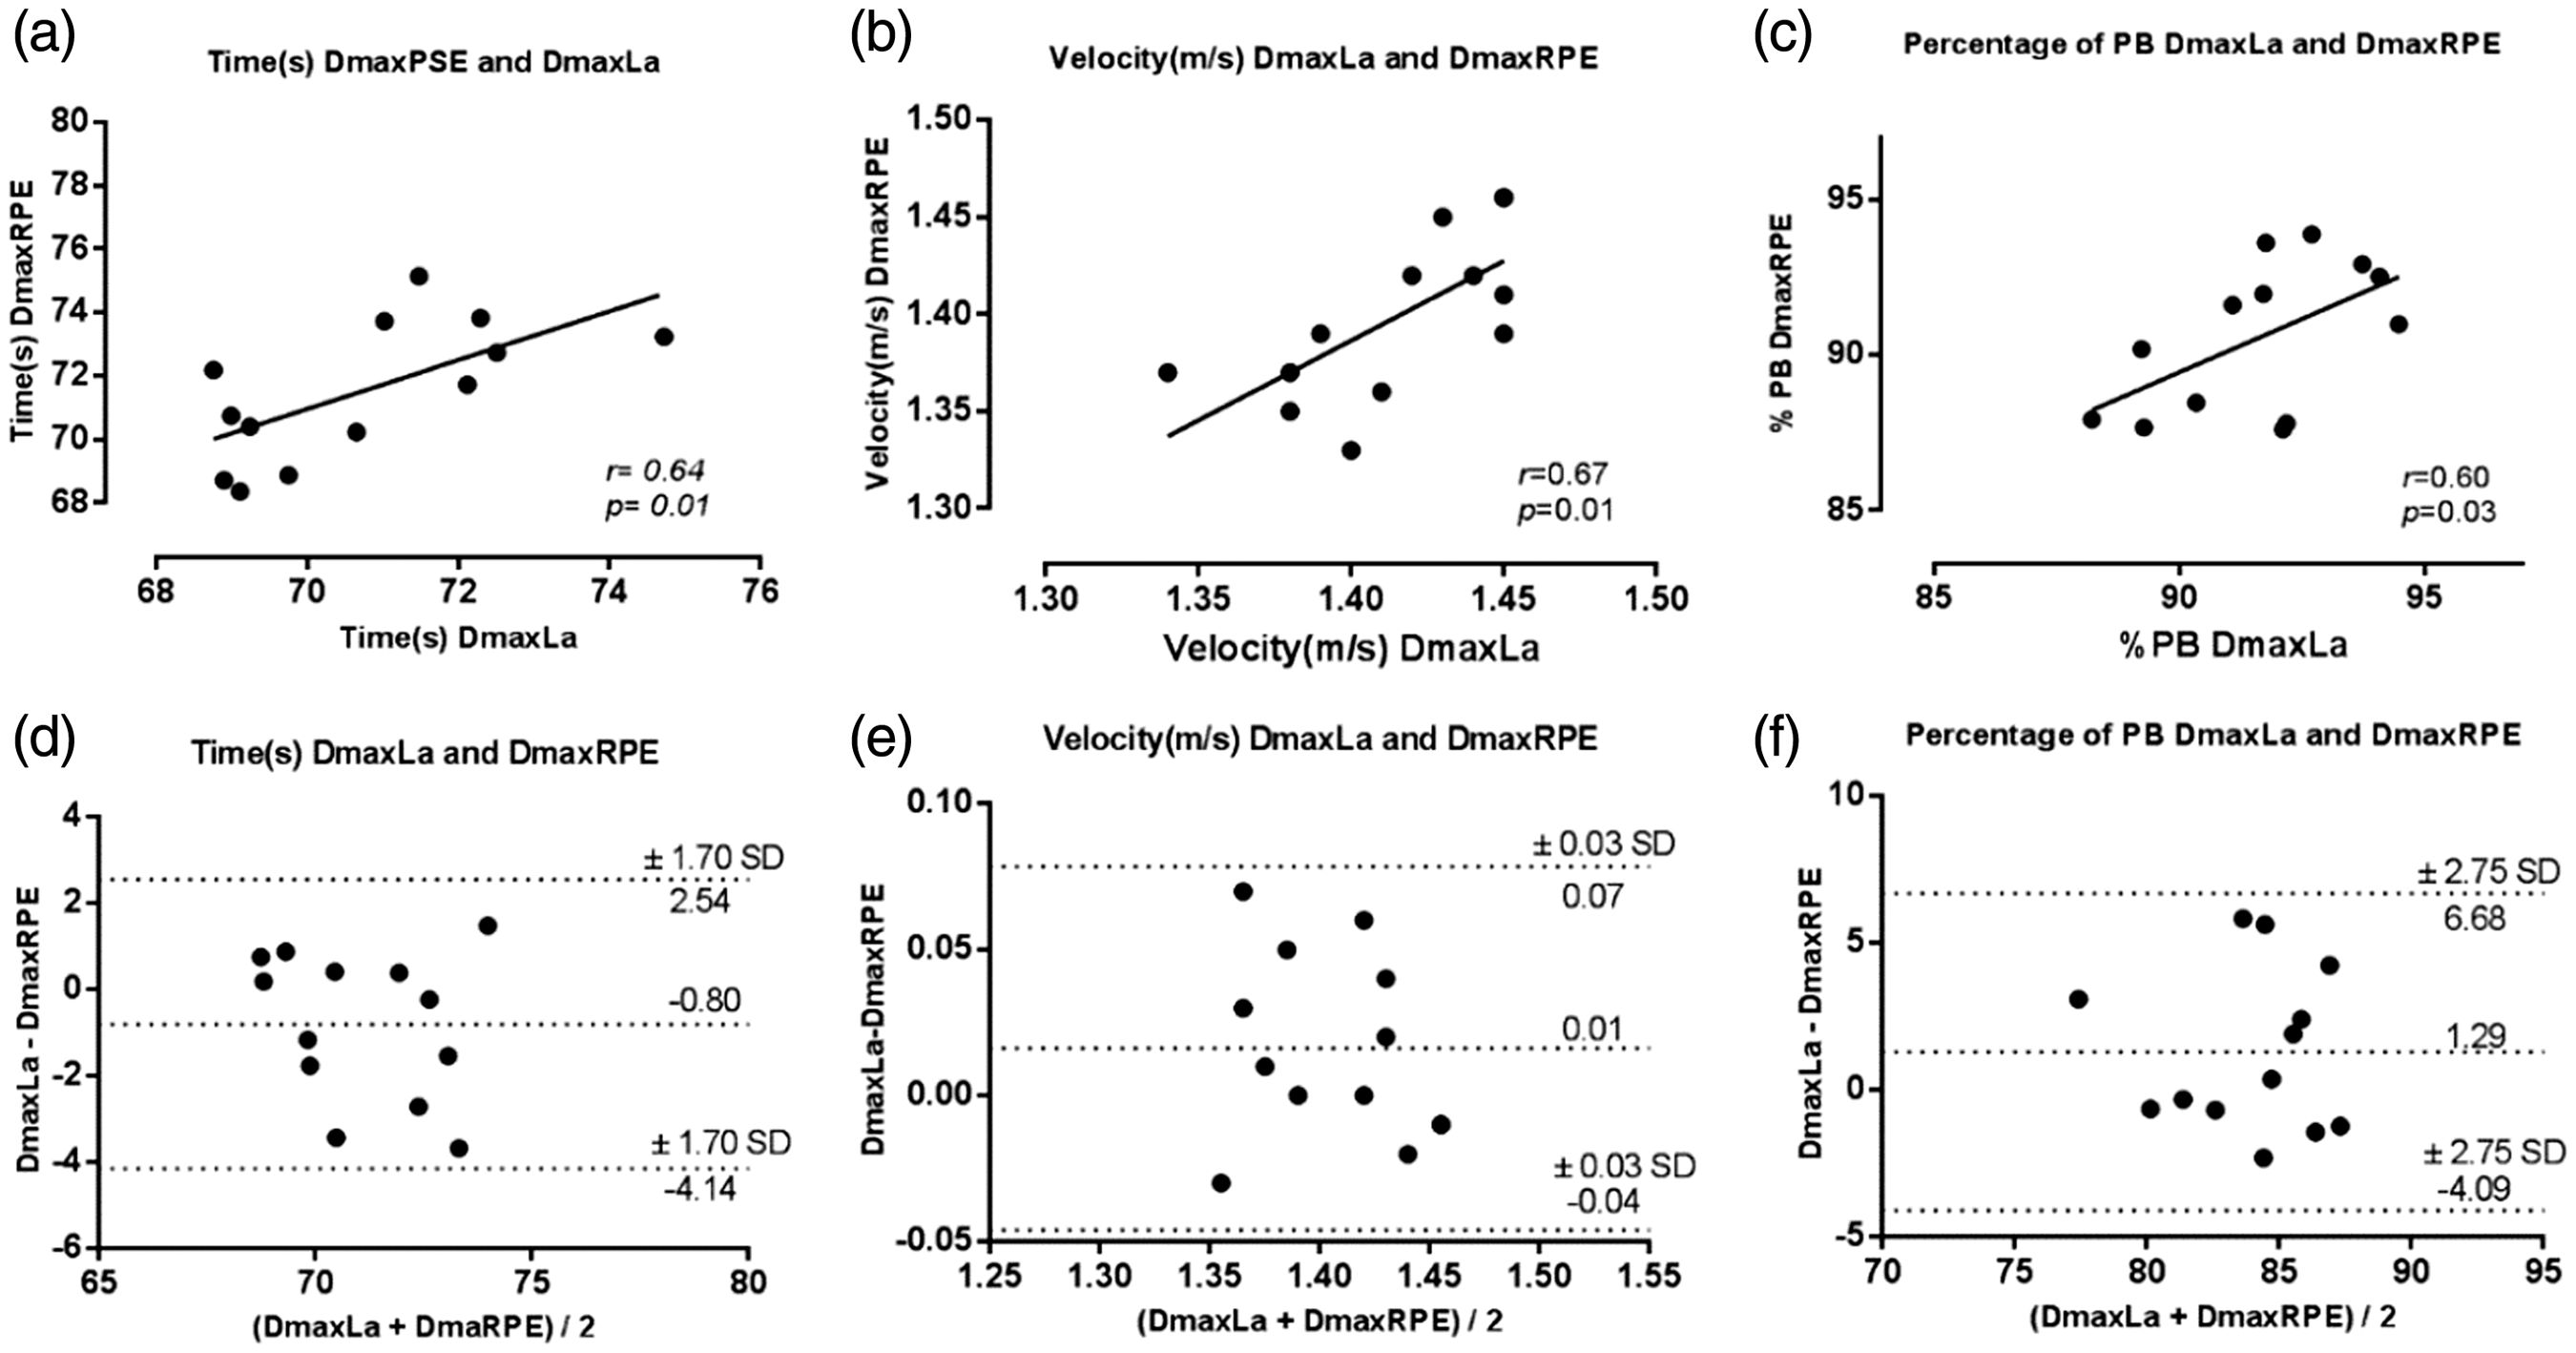
Correlation analysis of the intensities in seconds (a), velocity (b) and percentage of PB (c) and agreement analysis represented by the Bland-Altman plot of intensities in seconds (d), velocity (e) and percentage of PB (f) in the DmaxLa and DmaxRPE.
Discussion
This study aimed to verify the effectiveness of the RPE scale for predicting the lactate threshold during an incremental swim test for young competitive male swimmers. Our results confirm our hypotheses that RPET is a good predictor of lactate threshold, as we found no differences between DmaxRPE and DmaxLa at similar intensities (i.e., time, velocity and %PB). Moreover, the Bland-Altman plot showed agreement between DmaxRPE and DmaxLa for all variables analyzed (Figure 4).
To the best of the authors’ knowledge, this was the first study to test the Dmax method using a third-order polynomial curve to identify LT in swimming. Dmax is a graphical method that depends on both the shape of the lactate-intensity curve and the initial and final intensities of the incremental test (Machado et al., 2011). Dmax is a robust method in which one of the important factors is the shape of the lactate intensity curve and not just the lactate levels themselves. When using the third order polynomial method to estimate the LT4 (4 mmol.L−1), the intensity would possibly be underestimated since the LT values would shift to the left. When the longest perpendicular distance from the polynomial curve to the line is used, these values end up shifting to the right, with the LT at the highest intensity value. Thus, Dmax considers the biological individuality of each participant in the corresponding lactate values (Machado et al., 2011).
Concerning the LT results, we found the reliability to be similar to the reliability of LT values determined by fixed blood lactate level of 4 mmol.L-1 in other studies (Coen et al., 2001; Grant et al., 2002). Using LT to prescribe intensity and evaluate training effects has become a very important tool for physical performance. Ferreira et al. (2016) and Papoti et al. (2017) showed that [La], considered a gold standard variable, was able to identify metabolic thresholds during incremental swimming and running tests. Thus, we compared [La] to RPET.
Corroborating the lactate values found in our studies, Di Michele et al. (2012) had high performance swimmers (M age = 19.6, SD = 3.0 years) perform seven 200-m front crawls during an incremental test and found the lactate threshold at 3.9 (SD = 1.3) mmol.L−1 for [La] and velocity of 1.47 (SD = 0.11) m/s−1 for intensity. Papoti et al. (2017) evaluated the effects of 11 weeks of a typical free-swimming training program on aerobic and stroke parameters determined in tethered swimming (M age = 15.15, SD = 1.86 years) and identified pre-training LT at 4.01 (SD = 1.22) mmol.L−1 ([La]) and velocity of 1.42 (SD = 0.11) m/s−1 (intensity), and post-training LT at 4.59 (SD = 0.90) mmol.L−1 and 1.53 (SD =0.08) m/s−1. Although the methods of identifying LT in young swimmers were different from those used in the present study Papoti et al. (2017) observed DmaxLa at 4.24 (SD = 1.12) mmol.L−1 and 1.41 SD = 0.04) m/s−1 and these values were in accordance with other findings.
Our RPE value was 4.98 (SD = 1.12) by the DmaxRPE. Conde et al. (2014) engaged a maximal incremental treadmill test to investigate nine active male participants, aiming to identify the lactate threshold and heart rate deflection point (HRDP) by DmaxRPE. As a result, DmaxRPE demonstrated reasonable predictive power for determining LT. The RPE values were 5.4 (SD = 1.9) A.U. at DmaxRPE, 5.9 (SD = 2.1) A.U. at HRDP and 4.9 (SD =1.3) A.U. at LT. In another study, Ferreira et al. (2014) evaluated the effect of a carbohydrate-reduced diet on perceptual responses in an incremental exercise cycle test with nine active individuals. RPE values at DmaxRPE were 3.7 (SD = 1.5) A.U. for the group with carbohydrate reduction and 3.4 (SD = 1.9) A.U. for the control group (p > 0.05) and the RPE values at DmaxLa were 3.4 (SD = 1.20 A.U. for the group with carbohydrate reduction and 3.9 (SD = 1.1) A.U. for the control group (p > 0.05). There appear to be corresponding RPE values close to the anchor point 5 at LT in studies outside the aquatic environment. Zamunér et al. (2011) suggest that the value of “strong” anchor point RPE’s of 5 can be used to quantify aerobic exercise intensity for anaerobic active individuals. Thus, data from our study, with similar findings for [La], are in accord with the literature and suggest that Borg CR-10 scale values in the aquatic environment are similar to those in the terrestrial environment (Ferreira et al., 2014).
According to Fabre et al. (2013), RPE responses can be used to estimate individualized metabolic thresholds during an incremental test, as they contributed to strong correlations between DmaxRPE and DmaxLa (r = 0.97; p < 0.05) in an incremental cycle ergometer test. In this same study, the RPET and metabolic threshold occurred in intensities (watts) without a significant difference (p > 0.05). Similarly, using an incremental test in a cycle ergometer, found a significant correlation between the RPET and metabolic threshold (r = 0.75; p ≤ 0.05) and no significant difference between DmaxRPE and DmaxLa (p > 0.05). In our study too, there was a large correlation (Cohen, 1988) between DmaxLa and DmaxRPE for time and velocity (r = 0.64 and 0.67; p < 0.01) and a moderate correlation for PB percentage (r = 0.60; p = 0.03) (Figure 3).
Additionally, our Bland-Altman graphs showed a good agreement between all variables tested. The variables time, velocity and percentage of PB had a low bias with values within the predetermined limit and a very small bias and limits of agreements (LOA) (−0.80 sec; LOA= −4.14 to 2.54 sec) (Figure 4, plot D) between time and velocity (0.01 m/s−1; LOA= −0.04 to 0.07 m/s−1) (Figure 4, plot E) measured at DmaxRPE and DmaxLa (Figure 4, plot D). Similarly, Bland-Altman plots (Figure 4, plot F) comparing the percentage of PB measured at DmaxRPE and DmaxLa showed a small bias and LOA (1.29%; LOA= −4.09 to 6.68%). Compared to other studies, Fabre et al.’s (2013) Bland-Altman plots were most consistent with our results, in that they also showed very small bias and LOA (−1.8 mL.min−1 or −0.05% of VO2 max; LOA= −241 to 237 mL.min−1) between the VO2 measured at 4 mM (−204.1 mL.min−1 or −5.9% of VO2 max; LOA= −676.7 to 268.4 mL.min−1), as did Ferreira et al. (2014). Bland-Altman plots in these prior studies showed a very small bias when comparing the power output between DmaxLa and DmaxRPE (−13.9 W; LOA= −87.8 to 60.0 W), indicating that, even when variables present a high correlation, in certain situations they do not present agreement. This was not the case in the present study, as we found large correlations with an agreement between the variables.
Referring to the Borg CR-10 scale, Reilly and Atinkinson (2009) reported that, for reliable results in incremental tests, a two-week period is the minimum period necessary for familiarization with the RPE scale. Another important factor for reducing errors in the accuracy of the RPE application is the choice of the appropriate scale for the test. The G. Borg (1998b) CR-10 has shown a good correlation with lactate in incremental tests. It is also noteworthy that in this scale the athletes can report a value greater than 10 (extremely strong) when they experience an effort never tried, as G. Borg (2010) stated that values like 11 and 12 can be reported for effort never experienced. Maglischo (1999) reported that this scale has a great advantage in its use in the aquatic environment because it allows swimmers to adjust the training intensity. Thus, past literature has shown that this scale has been widely used in incremental tests for lactate analysis in active and healthy individual athletes and that it can be a great tool for making RPET predictions in young swimmers.
Limitations and Directions for Future Research
Although the different paces at which participants achieved DmaxLa and DmaxRPE thresholds were not statistically different in this study, these thresholds were identified at different stages of the protocol (stages 4 and 5, respectively). The identification of DmaxLa and DmaxRPE in different stages is justified by the proximity of the participants’ 100 m times to the upper limit of the fourth stage (DmaxRPE) and lower limit of the fifth stage (DmaxLa). According to a predetermined individualized intensity level, the athletes swam within their permissible bandwidth times until the fourth swim effort (see Table 2), and there were no differences between the DmaxLa and RPET for time, speed and percentage of intensity. It is important to highlight that the correlation results in this study were found using the PB value performed one week before the test protocol rather than the athletes’ competitive PB times. Correlating RPET with Dmax from competitive best times might have overestimated the athlete's actual current performance value.
We tested the RPET only in young male swimmers, and we used a small sample size. The gender and number of athletes used in this study were a limitation that future researchers should address (using participants of different ages, sexes and levels of training) since our findings may not generalize to other samples without replication and cross-validation. As a suggestion for future studies, the Dmax method in swimming athletes might also be tested using other types of curves to compare third order polynomial and exponential adjustment (Machado et al., 2011).
Conclusions
The results of the present study indicate that, during an incremental effort test, RPET is a good estimator of LT in young competitive swimmers. We found no statistical difference between DmaxLa and DmaxRPE across various intensity variables (i.e. time, velocity and %PB), and we found large correlations between them for time, velocity and percentage of PB, with concordant indications in the Bland-Altman graphs supporting the same conclusion. The RPET can be considered a valuable tool for identifying LT in young competitive male swimmers. RPET by the Dmax is a practical, affordable, and feasible method to easily apply, and it can help youth athletes and their coaches plan training schedules. This method negates the need for invasive data collection procedures (e.g. blood withdraw) that require parental consent for youth athletes. Proper use of RPE requires familiarization with the subjective effort scale (e.g., Borg Cr-10) prior to applying it within an incremental effort test or a prescribed exercise. To identify the RPET by Dmax method is necessary when using this method with an incremental effort test.
Footnotes
Declaration of Conflicting Interests
The author(s) declared no potential conflicts of interest with respect to the research, authorship, and/or publication of this article.
Funding
The author(s) disclosed receipt of the following financial support for the research, authorship, and/or publication of this article: This research was financed in part by the Coordenação de Aperfeiçoamento de Pessoal de Nível Superior – Brasil (CAPES) – Finance Code 001.