
Abstract
The aims for this study were to perform a Portuguese language cross-cultural adaptation of the Teruel Orthorexia Scale (TOS) and to evaluate the scale’s psychometric properties, including verifying the frequency of behaviors characteristic of orthorexia nervosa and healthy orthorexia, among a group of Brazilian gym users. First, we adapted the Spanish version of the TOS to the Brazilian Portuguese language following international protocols to guarantee idiomatic, semantic, conceptual, and cultural equivalence. Then participants completed both the new Portuguese version of the TOS and a socioeconomic questionnaire. Among our sample of 226 young Brazilian adults (63.7% men; M age = 28.8, SD = 5.1 years), we assessed the bi-factorial model of the TOS through factorial, convergent, and discriminant validity, reliability, and factorial invariance. We calculated the mean scores of the TOS factors and the frequency of behaviors of both orthorexia nervosa and healthy orthorexia. The new Portuguese version was well understood by participants, and the TOS bi-factorial model presented adequate psychometric properties and showed invariance in independent subsamples and in men and women. The mean scores were different between sexes only for orthorexia nervosa, with women obtaining higher values. The frequency of orthorexia nervosa behaviors was 5.3% and of healthy orthorexia was 41.2%. Based on these findings, the Brazilian Portuguese version of the TOS can be a useful tool for investigating orthorexia-like behaviors in future research.
Introduction
The term orthorexia nervosa was coined by Bratman (1997) to refer to a preoccupation with intake of healthy food that is obsessive to the point that it leads to more harmful than beneficial consequences (Bratman, 2017). A factor that strongly contributes to the development of this condition is having distorted beliefs (e.g., the idea that all foods containing gluten are unhealthy) that can lead to such negative consequences as nutrient deficiency, excessive weight loss, social isolation, and guilt when violating the imposed diet restrictions (Cena et al., 2019; Dunn & Bratman, 2016). Thus, it is important to investigate orthorexia nervosa in order to identify risky eating behaviors and help individuals develop behaviors that will reduce the negative physiological and psychosocial effects of this condition (McComb & Mills, 2019).
Although the negative outcomes of orthorexia nervosa have been studied (Cena et al., 2019; Dunn & Bratman, 2016; McComb & Mills, 2019; Novara et al., 2021), there is no consensus as to whether it represents a unique, independent mental disorder or is better considered a subtype of an existing disorder (e.g., other eating disorders; obsessive-compulsive disorder). Orthorexia nervosa is not listed separately in the Diagnostic and Statistical Manual of Mental Disorders (DSM-5; American Psychiatric Association, 2013) or in the International Classification of Diseases (ICD-11; World Health Organization, 2018). As there is no universal set of criteria for diagnosing orthorexia nervosa, clinical and experimental studies have often relied upon psychometric instruments to investigate its characteristics. These instruments have included the Bratman's Orthorexia Self-test–BOT (Bratman & Knight, 2000), ORTO–15 Test (Donini et al., 2005), Eating Habits Questionnaire–EHQ (Gleaves et al., 2013), Dusseldorf Orthorexia Scale–DOS (Barthels et al., 2015), Barcelona Orthorexia Scale–BOS (Bauer et al., 2019), Orthorexia Nervosa Inventory–ONI (Oberle et al., 2021), and the Teruel Orthorexia Scale–TOS (Barrada & Roncero, 2018). Systematic reviews (Cena et al., 2019; McComb & Mills, 2019; Valente et al., 2019) have reported some advantages and disadvantages of these instruments.
The BOT was the first questionnaire developed to assess orthorexia nervosa, but it was shown to have limited validity (Bratman & Knight, 2000; Valente et al., 2019). The ORTO–15 is the most commonly used instrument, but it has been criticized (Cena et al., 2019; Missbach et al., 2017; Mitrofanova et al., 2021; Valente et al., 2019) for overestimating orthorexia nervosa and for having weak psychometric properties (low reliability and limited validity). The EHQ has conceptualized the overwhelming preoccupation with eating healthy among individuals with orthorexia nervosa; but, a validity concern was that this tool does not consider negative emotions, such as sadness and guilt, that are often associated with orthorexia nervosa (Gleaves et al., 2013; Valente et al., 2019). The DOS was proposed to investigate a pathological fixation on a healthy diet, but it has not seemed able to differentiate between anorexic and orthorexic behaviors (Barthels et al., 2015; Valente et al., 2019). The BOS was also developed to address pathological fixation on healthy food intake, but the authors themselves identified its limitations, noting that not all the specialists involved in its development had advanced knowledge of orthorexia nervosa (Bauer et al., 2019; Valente et al., 2019). The ONI assesses behaviors and preoccupations with healthy eating, physical and psychosocial impairments, and emotional distress, and the initial ONI study (Oberle et al., 2021) showed adequate psychometric properties for it. However, the ONI was developed after the start of the present study and it has not yet been used in other studies. On the other hand, the TOS was developed to assess excessive preoccupation with eating believed to be healthy, and this tool includes items addressing both pathological and non-pathological aspects of this tendency. In previous studies with Spanish participants (Barrada & Roncero, 2018; Barthels et al., 2019), the TOS showed good psychometric properties, making it a promising instrument for assessing orthorexia.
The TOS was developed by Barrada and Roncero (2018). As noted, it includes items on a pathological dimension of a healthy eating preoccupation (i.e., orthorexia nervosa) and non-pathological items for detecting healthy eating interest, called healthy orthorexia. Healthy orthorexia is the interest in adequate nutrition as part of a non-extreme practice to maintain the balance between health and well-being (Bratman, 2017). However, given the recent publication of the scale in the scientific literature, few studies have used the TOS, and as far as we know, only four studies (Domingues & Carmo, 2021; Strahler, 2020, 2021; Strahler et al., 2020) applied the instrument in non-Spanish samples.
There have been few investigations of orthorexia in the Brazilian population, and few existing studies have used the ORTO–15 (Alvarenga et al., 2012; Lorenzon et al., 2020), as this has been the only instrument for this purpose that is available in Portuguese. The sparse research in this area might be associated with the low internal consistency (alpha [α] range = .31–.63) of the ORTO–15 (Alvarenga et al., 2012) and a greater interest in assessing recognized eating disorders, such as anorexia and bulimia nervosa (Barthels et al., 2019; Bratman, 2017). Therefore, for assessing and researching orthorexia behaviors in Brazil, the TOS would be useful. However, in order to establish this instrument’s validly and reliability for Brazilian samples, a cross-cultural adaptation of the TOS from Spanish to Portuguese is required. Of note, as with any psychometric tool, there is also a need for a psychometric assessment of the TOS (Marôco, 2021) before interpreting its results (e.g., scores), especially for identifying or describing specific groups of individuals who may exhibit unusual eating behaviors. Obsessive and inflexible eating behaviors are common among athletes and serious exercisers (Bert et al., 2019; Segura-Garcia et al., 2012). Bratman (2017) pointed out that a high frequency of physical activity can be associated with behaviors related to orthorexia nervosa. Our interest in applying the TOS to the study of orthorexia nervosa in Brazil had three objectives: (a) perform a cross-cultural adaptation of the TOS to the Portuguese language, (b) evaluate the psychometric properties of the scale when applied to a sample of Brazilian young adults who regularly exercise within gyms, and (c) calculate the frequency of behaviors of both orthorexia nervosa and healthy orthorexia among these participants.
Method
Participants
This was an observational, cross-sectional study of gym users of both sexes who went to gyms in Araraquara/SP, Brazil. Participant inclusion criteria were: (a) 18 years of age or older, (b) workout frequency of at least three days a week, and (c) being literate. Exclusion criteria were: (a) women who were pregnant, lactating, or puerperal, (b) > 60 years of age, (c) blindness, and (d) under treatment for any eating disorder, as determined by self-report.
To recruit participants, we first contacted the owners of 12 fitness clubs and gyms in person or by e-mail and invited them to participate in the research. Those five clubs who answered the invitation received a letter with information about the purposes of the study, and all of these owners agreed to allow a trained researcher to collect data from users of the establishment. Next, we recruited individual participants in person at the gyms, and all participants provided written informed consent before engaging in any research activities. The study was approved by the Research Ethics Committee of the university where the study was conducted (CAAE: 22051619.8.0000.5426).
Participant Procedure
We collected participant information on age, sex, marital status, work activity, race (self-reported according to the Brazilian Institute of Geography and Statistics), self-reported eating disorder (i.e., diagnosed by a therapist in the past), intake of anabolic steroids and dietary supplements to improve body appearance, weekly workout frequency, body-changing diet, and self-assessment of diet quality. Body weight and height were self-reported, and the values were used to calculate body mass index (BMI) and to obtain the anthropometric nutritional status (De Onis et al., 2007; World Health Organization, 2000). Level of education and economic class were obtained using the criteria established by the Brazilian Market Research Association (ABEP, 2020). This includes information regarding the number of household durable consumer items (e.g., washing machines and personal computers), householder’s education, and access to public services (e.g., basic sanitation). Each item corresponds to one point on the scale, and the total sum represents the score used to determine the family's economic class (e.g., 0–16 points = class D-E – i.e., low; 45–100 points: class A – i.e., high).
Gym users who agreed to participate through written informed consent and who met inclusion and exclusion criteria for continuing in the study, completed a socioeconomic questionnaire, the TOS, and the Social Appearance Anxiety Scale (SAAS) in paper format in a reserved place without the researcher present. Participants were asked to complete all the scales (there were no missing values). We used a numbering system to identify respondents to guarantee anonymity during database entry (omitting the identification page). A total of 226 individuals completed the measures (63.7% men; M age = 27.8, SD = 5.1 years; M BMI = 24.9, SD = 3.7 kg/m2).
Measures
Teruel Orthorexia Scale (TOS)
The TOS was originally developed in Spanish (Barrada & Roncero, 2018) to assess characteristics of orthorexia, considering both pathological and non-pathological aspects of this construct. This Spanish instrument has 17 items with a 4-point Likert-type response format, ranging from 0 (do not agree) to 3 (strongly agree) and a bi-factorial model (orthorexia nervosa: items 4, 5, 9, 10, 12, 14, 16, 17; healthy orthorexia: items 1, 2, 3, 6, 7, 8, 11, 13, 15). According to Barrada and Roncero (2018), people with high scores (calculated by the sum of items) on the healthy orthorexia factor are interested in healthy eating, while individuals with high scores on the orthorexia nervosa factor are highly concerned with and overwhelmed by their preoccupations. However, there are no cutoff points to classify the scores. The TOS items were developed from previous theoretical studies on orthorexia behaviors. In the original study (Barrada & Roncero, 2018), the TOS bi-factorial model showed good factorial validity (Root Mean Square Error of Approximation [RMSEA] = .06, Comparative Fit Index [CFI] = .96, Tucker-Lewis Index [TLI] = .95) and good internal consistency (Cronbach’s α: healthy orthorexia = .81, orthorexia nervosa = .85) for a sample of individuals from a Spanish community, most of whom were female university students. Subsequent studies also showed the TOS to have good psychometric properties (Barthels et al., 2019; Strahler et al., 2020). We requested and received the TOS authors’ authorization to use the TOS for cross-cultural adaptation.
Social Appearance Anxiety Scale (SAAS)
We also applied the SAAS in order to assess the relationship between the participants’ social anxiety due to physical appearance and the two TOS factors. This scale was developed by Hart et al. (2008) as a unidimensional measure. It is composed of 16 items rated on a 5-point Likert-type response format ranging from 1 (not at all) to 5 (extremely); and it has a single factor. The degree of social appearance anxiety is measured by summing all 16 items into one total score. The factorial model of the SAAS showed adequate fit (RMSEA = .09, CFI = .98, TLI = .98, Standardized Root Mean Square Residual [SRMR] = .05) and good reliability (ordinal α = .97, omega coefficient [ω] = .96, nonlinear structural equation modeling reliability coefficient [ρNL] = .97) for data.
TOS Adaptation and Cross-Validation Procedure
For the cross-cultural adaptation of the TOS to the Portuguese language, we evaluated the idiomatic, semantic, conceptual, and cultural equivalences of the TOS (Beaton et al., 2000; Reichenheim & Moraes, 2007). Three bilingual Brazilian researchers with advanced knowledge of the Spanish language and no previous knowledge of the TOS independently translated the TOS. The three versions obtained were analyzed by the authors who agreed to a single or intermediate version that was then sent to a back-translator to assess its semantic equivalence to the original TOS. This back-translation was performed by a native Spanish researcher with advanced knowledge of Brazilian Portuguese and no knowledge of the TOS. Then, the back-translated version was compared with the original version for content similarity, thus attesting to the adequacy of the new Portuguese version.
Next, three experts in nutrition, psychometrics, and physical exercise assessed the conceptual and cultural equivalences and verified whether the new Portuguese version was consistent with the original theoretical construction of the TOS and whether the content was suitable for the Brazilian culture. In this process, the only suggested alteration was replacing the phrase “ordinary people” in item three (in Spanish: “común de la gente”; in Portuguese: “pessoas comuns”) with “most people” (in Spanish: “la mayoría de las personas”; in Portuguese: “a maioria das pessoas”). In addition, in order to be able to use the TOS in Portugal, a native Portuguese specialist assessed the Brazilian version and attested that it was understandable.
We tested the Brazilian Portuguese version of the TOS in a pilot study with 30 Brazilian gym users (women = 56.7%; Mage = 26.0, SD = 6.2 years) to verify that it was understandable (Coluci & Alexandre, 2009). These participants also provided written informed consent before engaging in the research. As most of these participants gave assurance for the instrument’s instructions (86.2%), the content of the items (82.8%), and the answer options (79.3%), we used the Brazilian Portuguese version of the TOS to carry out further psychometric analyses. Table 1 shows the final Brazilian Portuguese version of the TOS.
Spanish (original) and Brazilian Portuguese Versions of the Teruel Orthorexia Scale.

Note. Factors: Healthy Orthorexia = items 1, 2, 3, 6, 7, 8, 11, 13, and 15; Orthorexia Nervosa = items 4, 5, 9, 10, 12, 14, 16, and 17.
aVersion produced by the Barrada and Roncero (2018).
bVersion produced in this study following protocols for cross-cultural adaptation.
Data Analysis
Minimum sample size was determined by the Monte-Carlo simulation as suggested by Brown (2015). The simulation was performed using estimates (i.e., factorial loadings, correlation between factors, and thresholds) from the original TOS study (Barrada & Roncero, 2018). A total of 1,000 replications employing sample sizes of 50, 100, 150, 200, and 300 were simulated using criteria defined by Muthén and Muthén (2017). A sample size of 150 was shown to be enough to achieve <1% bias for both parameters and their standard errors, coverage of the 95% confidence interval (CI) ≥ 93%, and power of 100%.
We assessed measures of data distribution and central tendency for all the TOS items. We investigated the construct validity of the TOS through factorial, convergent, and discriminant validity analyses (Anastasi & Urbina, 1997). We did not use additional measures to assess convergent and discriminant validity, since these properties were estimated using indices as recommended by Fornell and Larcker (1981).
For factorial validity, the TOS measurement model (bi-factorial) was evaluated by confirmatory factor analysis. The estimation method used was the Weighted Least Squares Mean and Variance Adjusted (WLSMV), and the quality of the fit was assessed by RMSEA with 90% CI, CFI, TLI, and SRMR. When RMSEA ≤ .10, CFI and TLI ≥ .90, and SRMR < .09 the model fit was considered acceptable (Hair Jr. et al., 2019; Hu & Bentler, 1999; Marôco, 2021). The factor loading (λ) of each item was also assessed, and values >.50 were considered adequate. To assess convergent validity, the average variance extracted (AVE) was calculated for each factor, and values above .50 were considered adequate (Fornell & Larcker, 1981; Marôco, 2021). To assess discriminant validity, we compared the AVE values obtained for each factor with the coefficient of determination (r2). To be adequate, both AVE values must be equal or greater than r2 (Fornell & Larcker, 1981). To assess the concurrent and divergent validity, we conducted a correlation analysis (Marôco, 2021) among the TOS and SAAS scores. Ideally, orthorexia nervosa and social appearance anxiety should be highly correlated, while healthy orthorexia and social appearance anxiety should be weakly correlated.
We also analyzed the reliability of the TOS factors using ρNL (Kim et al., 2020; Yang & Green, 2015). In addition, the ordinal α and ω (Gadermann et al., 2012; Zumbo et al., 2007) were computed as measures of hypothetical reliability for comparative purposes with previous studies. Values equal to or greater than .80 were considered adequate (Cicchetti, 1994).
After adjusting the factorial model of the TOS to the data, we performed a test for the invariance of independent subsamples to investigate the measure’s external validity (i.e., how well the results from the first sample can be generalized to other samples from the same study population). The total sample was randomly divided into two equal parts, and multigroup analysis was done using the chi-square difference test statistic (Δχ2). Invariance was confirmed when λ, thresholds (t), and residuals (res) did not differ significantly (p > .05) between the metric, scalar, and strict levels, respectively (Marôco, 2021). This analysis was also carried out using male and female subsamples with the same criteria.
The mean for each factor of the TOS was used to calculate the scores for healthy orthorexia and orthorexia nervosa. In addition, we compared the mean scores between men and women using analysis of variance (ANOVA) and verified their relationship with age and BMI through Pearson's correlation, with 5% level of significance. The assumption of data normality was met, based on the psychometric sensitivity of the items in the scale. We classified participants according to the likelihood of presenting behaviors of orthorexia nervosa and healthy orthorexia. This classification was performed using the 25, 50, and 75 percentiles (P) of Likert-type response scale of the TOS and scores as follows: ≤ .75 (P ≤ 25) = extremely unlikely, .75┤1.50 (P25┤50) = unlikely, 1.50┤2.25 (P50┤75) = likely; > 2.25 (P > 75) = extremely likely. The percentiles do not refer to the sample distribution, but rather divide the possible response values (i.e., Likert-type scale) into four sections. Next, we calculated the frequency of participants in each category with a 95% CI. We used SPSS Statistics for Windows, version 22.0 (Armonk, NY: IBM Corp.) and R v.3.6.2 (“lavaan”, “semTools”, “pbivnorm”, and “psych” packages) for data analysis (Genz et al., 2015; Jorgensen et al., 2020; Revelle, 2019; Rossel, 2012).
Results
Details about the study sample are shown in Table 2.
Study Sample Characteristics.
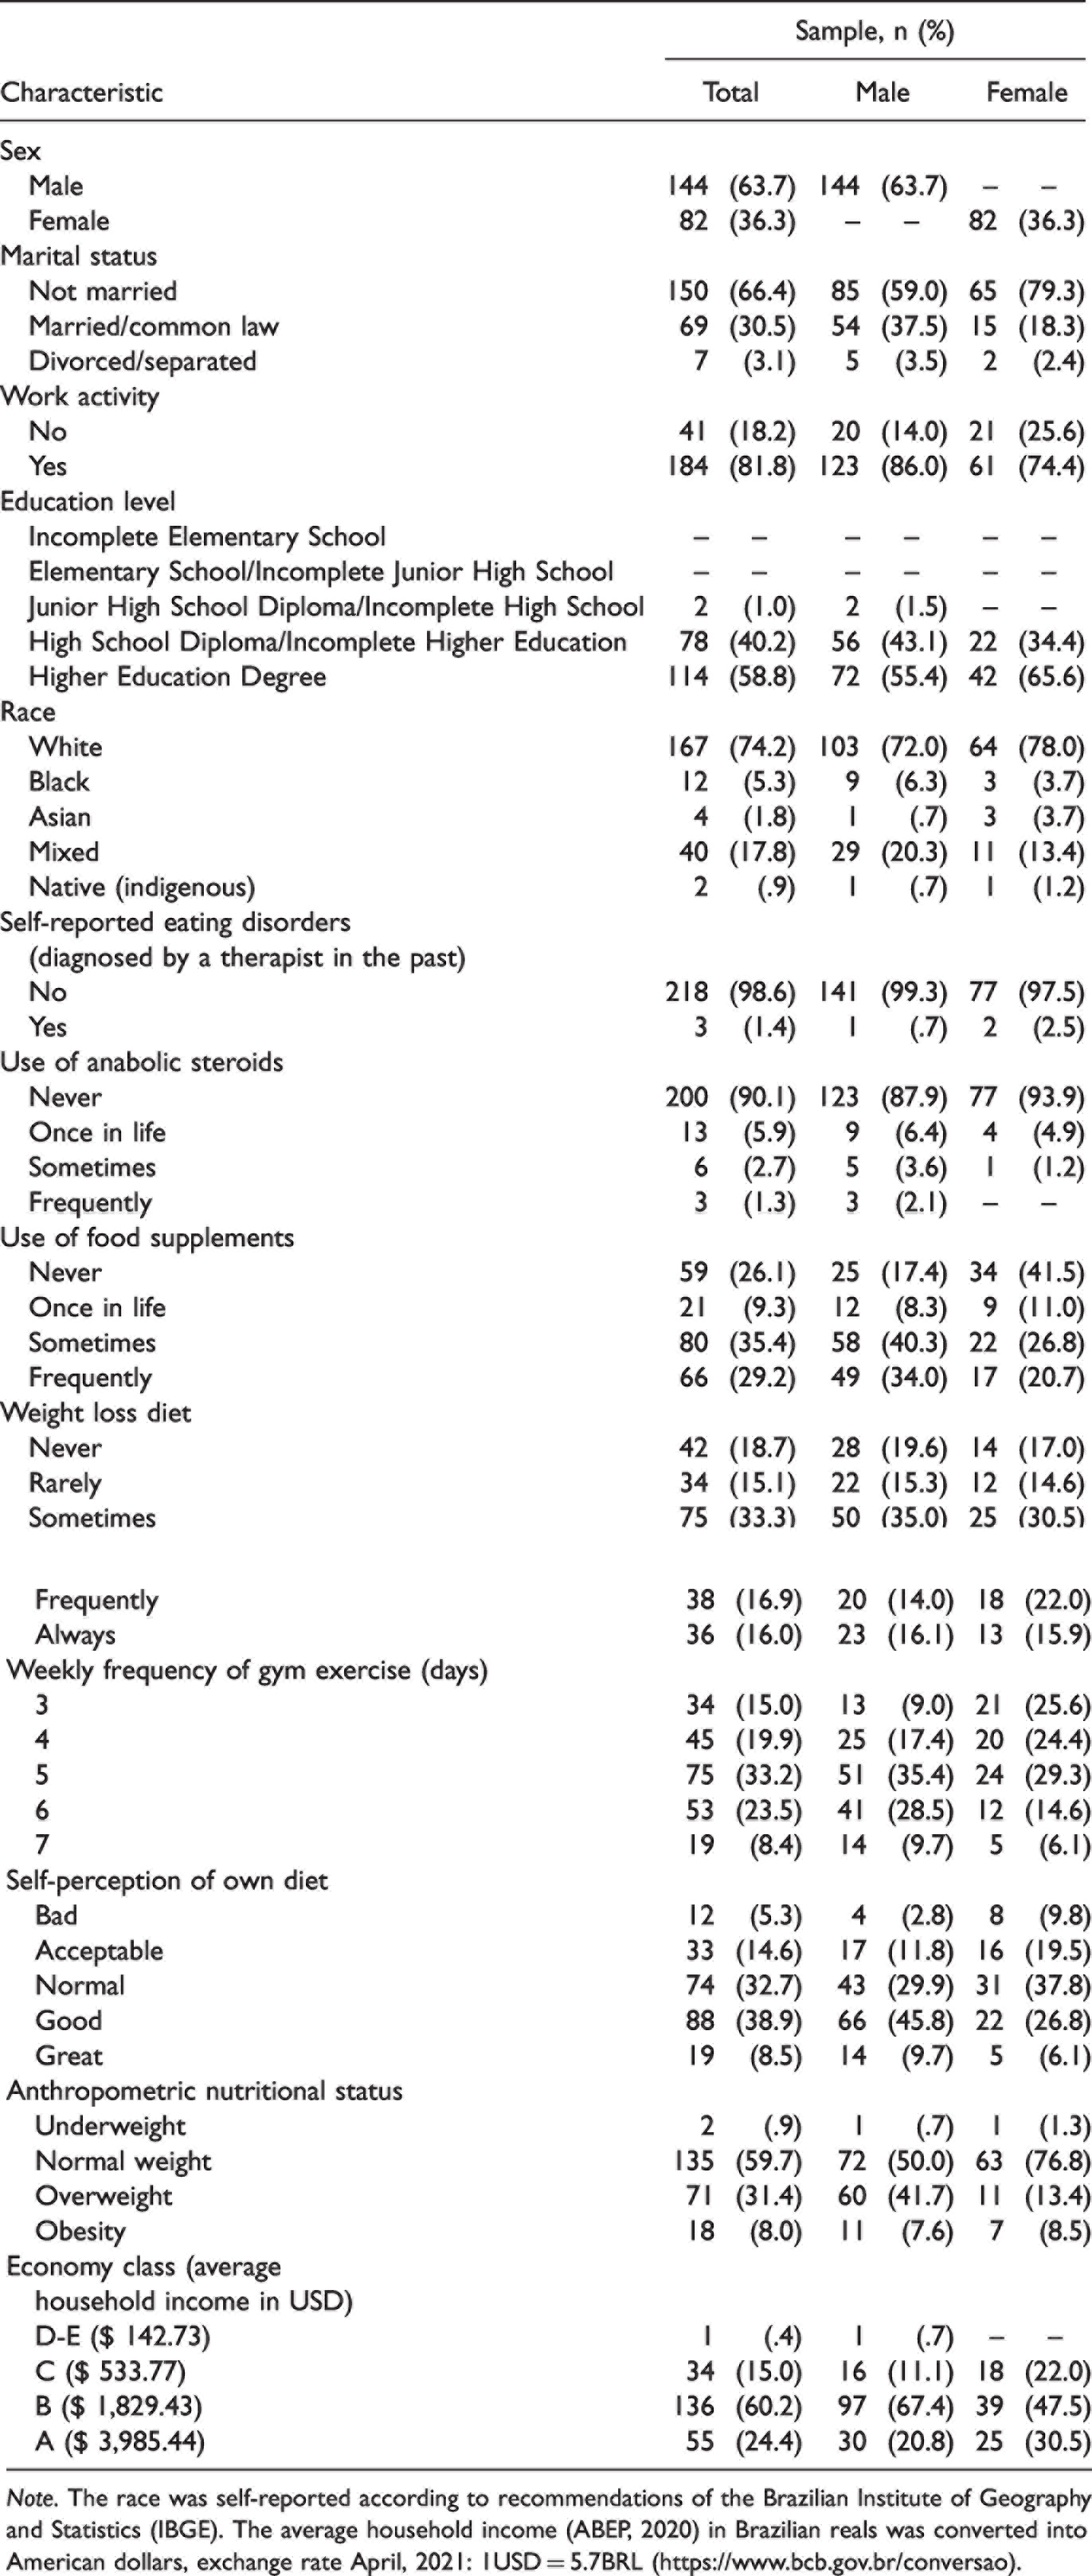
Note. The race was self-reported according to recommendations of the Brazilian Institute of Geography and Statistics (IBGE). The average household income (ABEP, 2020) in Brazilian reals was converted into American dollars, exchange rate April, 2021: 1USD = 5.7BRL (https://www.bcb.gov.br/conversao).
As noted, most participants were single, of white race, had a job, and had achieved higher education. In addition, most individuals classified their diet as normal/good, reported never having been diagnosed with an eating disorder, and were not using anabolic steroids for body enhancement. On the other hand, the use of dietary supplements and body-changing diets were reported by most participants and most went to the gym more than five times a week. In addition, the majority of this sample presented adequate weight for their height and medium-high economic status (economic class B).
Table 3 shows the summary data and measures of data distribution for the TOS items; high values of skewness and/or kurtosis were observed only in items 14, 16, and 17.
Descriptive Statistics for Responses of the Teruel Orthorexia Scale and Factor Loadings of the Items.
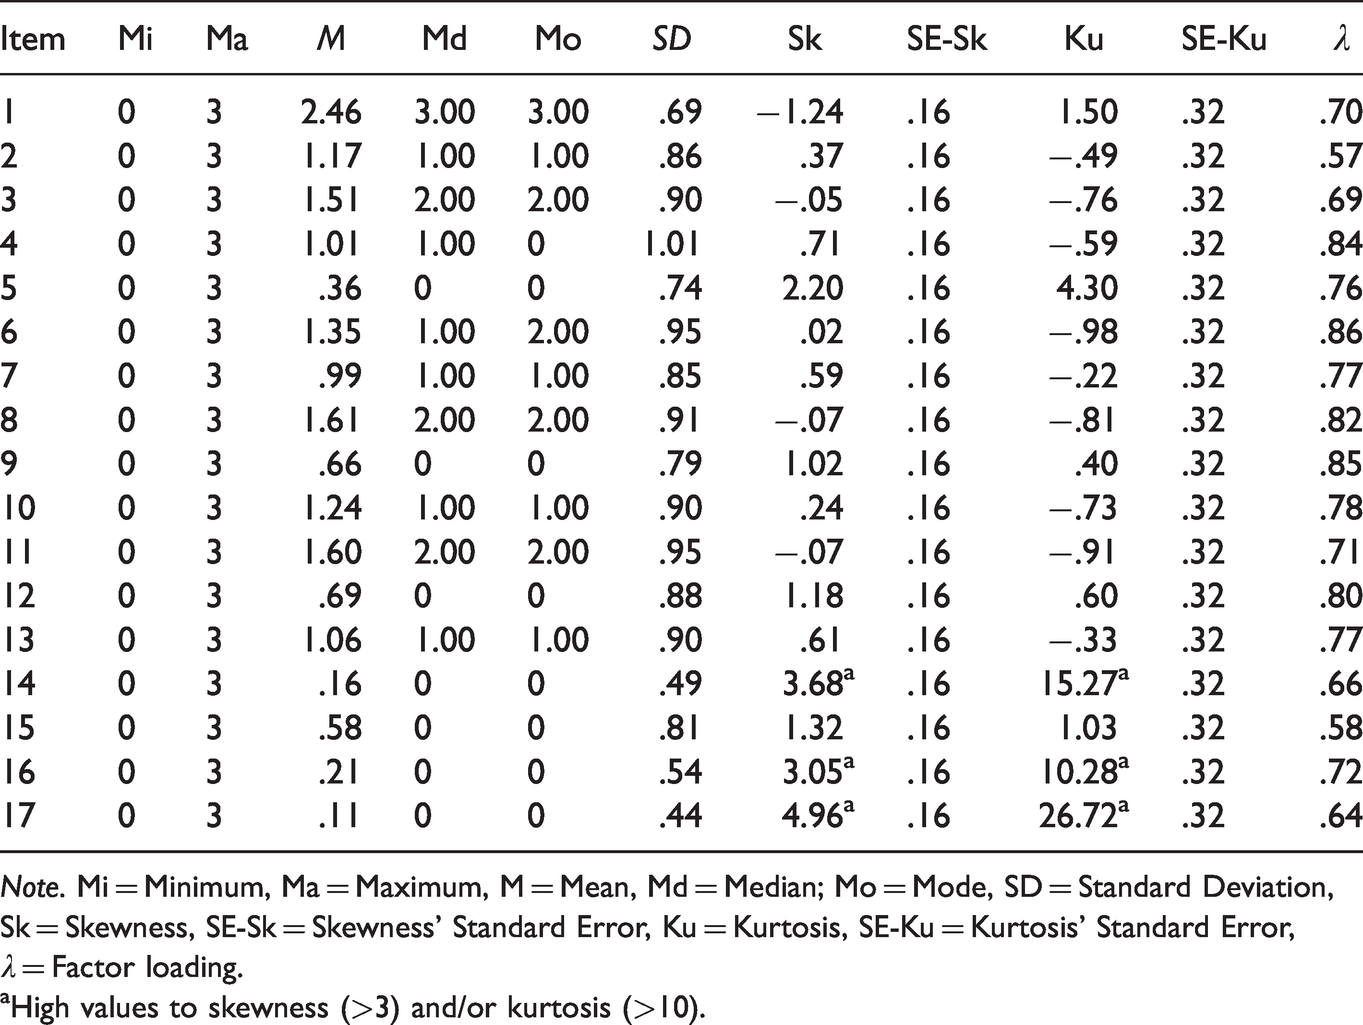
Note. Mi = Minimum, Ma = Maximum, M = Mean, Md = Median; Mo = Mode, SD = Standard Deviation, Sk = Skewness, SE-Sk = Skewness’ Standard Error, Ku = Kurtosis, SE-Ku = Kurtosis’ Standard Error, λ = Factor loading.
aHigh values to skewness (>3) and/or kurtosis (>10).
Regarding the factorial validity, an adequate fit of the TOS bi-factorial model (RMSEA = .09 [90%CI = .07–.10], CFI = .94, TLI = .93, SRMR = .09) and adequate factor loadings (λ = .57–.86) were observed for the study sample (Table 3). Convergent and discriminant validities were also adequate (AVE: orthorexia nervosa = .58, healthy orthorexia = .53; r2 = .53). We found a medium and significant correlation between orthorexia nervosa and social appearance anxiety (r = .425, p < .01) and no correlation between healthy orthorexia and social appearance anxiety (r = .056, p > .01). These findings supported the concurrent and divergent validity of TOS.
The two TOS factors were shown to be reliable (orthorexia nervosa: ρNL = .82; healthy orthorexia: ρNL = .83). The hypothetical reliability was also adequate (orthorexia nervosa: α = .91, ω = .87; healthy orthorexia: α = .90, ω = .78). The TOS measurement model was invariant across the independent subsamples (Δχ2λ = 399.72, df = 15, p = .748; Δχ2t = 388.19, df = 17, p = .514; Δχ2res = 440.34, df = 17, p = .252) and across male and female subsamples (Δχ2λ = 426.52, df = 15, p = .639; Δχ2t = 414.35, df = 17, p = .146; Δχ2res = 487.60, df = 17, p = .074). This result revealed the instrument's external validity.
The average TOS scores obtained were .55 (SD = .51) for orthorexia nervosa (male sample = .47 [SD = .44], female sample = .71 [SD = .58]) and 1.37 (SD = .61) for healthy orthorexia (male sample = 1.41 [SD = .59], female sample = 1.31 [SD = .64]). For the healthy orthorexia factor, no significant difference was observed between men and women (F = 1.404, df = 1, p = .237, partial eta squared [η2 p ] = .006). On the other hand, women had higher scores for orthorexia nervosa compared to men (F = 11.719, df = 1, p = .001, η2 p = .050). There was no significant correlation between age and both factors of the TOS (orthorexia nervosa: r = .114, p = .086; healthy orthorexia: r = .018, p = .783) or between BMI and the healthy orthorexia factor (r = .006, p = .931). The correlation between BMI and orthorexia nervosa factor was negative and significant (r = −.145, p = .030).
Distribution of Individuals According to Their Classifications From the Mean Scores for the Two Factors of the Teruel Orthorexia Scale.
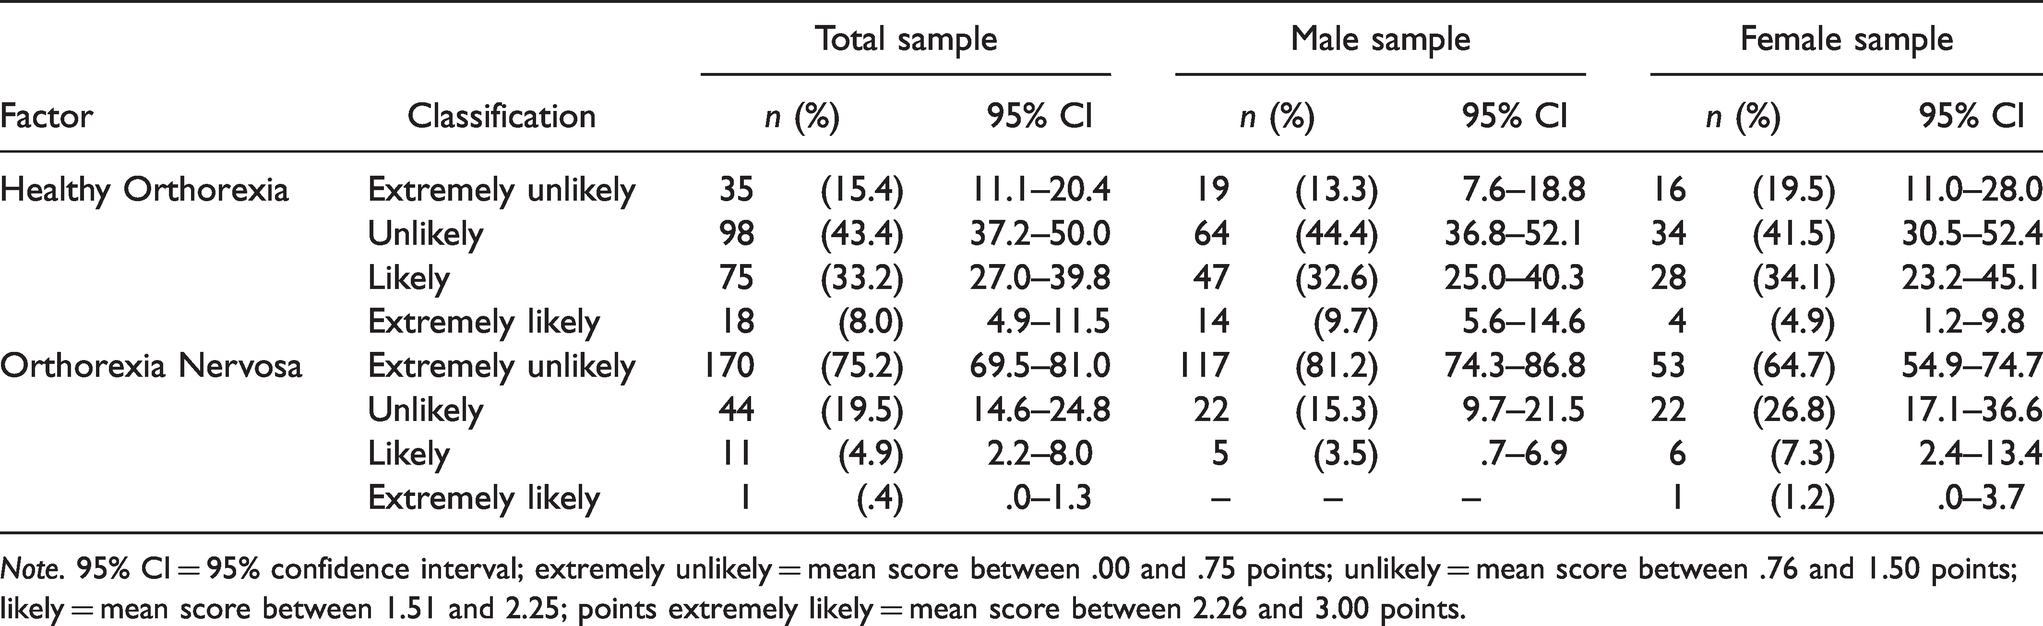
Note. 95% CI = 95% confidence interval; extremely unlikely = mean score between .00 and .75 points; unlikely = mean score between .76 and 1.50 points; likely = mean score between 1.51 and 2.25; points extremely likely = mean score between 2.26 and 3.00 points.
Discussion
As no Portuguese version of the TOS was available prior to this study, our first objective was to cross-culturally adapt the Spanish TOS to the Brazilian context in order to expand the use of the instrument. Secondly, we evaluated the bi-factorial model of the TOS with a sample of Brazilian gym users and found adequate validity and reliability data with the new Portuguese instrument. Thirdly, we calculated the average scores among these participants for each factor of the TOS and presented the frequency of behaviors characteristic of orthorexia nervosa and of healthy orthorexia among the participants. These results can be useful for future research and clinical protocols aimed at understanding orthorexia behaviors in a population of regular exercisers.
The process of cross-cultural adaptation of the TOS to the Portuguese language was carried out following international protocols (Beaton et al., 2000; Reichenheim & Moraes, 2007). An adjustment in the TOS to the Brazilian context was made, without compromising the original content of the scale (Barrada & Roncero, 2018). Thus, the Brazilian Portuguese version of the TOS was established, with good understandability by young adults.
The psychometric evaluation of the TOS indicated adequate validity of the instrument’s bi-factorial model to the data without the need for any modification. In the original study, Barrada and Roncero (2018) also found good indicators of the fit of the TOS to a sample of Spanish individuals. In our study, three items had high values for skewness and kurtosis, as also reported in the original study. However, these items presented high factor loadings for our sample and their exclusion did not result in a better fit of the model; therefore, the items were kept, respecting the original proposed of the instrument. As the factorial model of the TOS was the same for Brazilian and Spanish respondents, future studies could be developed to investigate whether these cultures share similarities with other cultures with regard to healthy eating habits.
To our knowledge, we assessed for the first time the convergent and discriminant validity of the TOS factors using the accepted Fornell and Larcker’s (1981) criteria. It is worth noting that the average variance extracted of the healthy orthorexia factor is equivalent to the r2 indicating that the discriminant validity was borderline; therefore, further studies are needed to confirm this result. The significant correlation between orthorexia nervosa and social appearance anxiety shows that these concepts were related. Similar results were reported in the original study of the TOS (Barrada & Roncero, 2018) in which orthorexia nervosa was significantly correlated with negative affect (r = .28, p < .05) and body appearance (r = -.25, p < .05). On the other hand, there was no significant correlation between healthy orthorexia and social appearance anxiety, indicating that these concepts were divergent.
In addition, corroborating prior literature (Barrada & Roncero, 2018; Barthels et al., 2019; Depa et al., 2019), we found hypothetical reliability to be adequate, and we found good ρNL values, indicating the instrument’s reliability. Moreover, we found the TOS bi-factorial model to be invariant through independent subsamples and between male and female subsamples, supporting the adequacy of the TOS model in different groups.
Mean scores of the TOS for comparing participant subgroups on dimensions of orthorexia nervosa and healthy orthorexia were new analyses that were not present in the original TOS study that relied on the sum score. We found that mean scores for healthy orthorexia were not different between men and women, but women showed higher values for mean scores of orthorexia nervosa. These results should be interpreted with caution, since this is a cross-sectional study and the effect size of this analysis was not high. Furthermore, the relationship between orthorexia and sex is controversial in prior literature (McComb & Mills, 2019), as findings from some studies were consistent with our finding that orthorexia nervosa was more common among women than men (Dell'Osso et al., 2018; Missbach et al., 2015; Parra-Fernandez et al., 2018; Rudolph, 2018) while other studies have not validated this result. McComb and Mills (2019), suggested that this relationship between sex and orthorexia nervosa prevalence may be dependent upon sample characteristics, including samples in which a greater proportion of women were included in the surveys. In addition, severe food control and intense physical exercise are common behaviors among women who wish to change their body shape (Grogan, 2017). According to Barthels et al. (2020), orthorexic eating behaviors were associated with a drive for thinness and body dissatisfaction among young women in Germany. Further research is needed to explore more specifically the effect of body image on orthorexic eating behaviors, especially in men.
We found no correlation between age and orthorexia, unlike some previous studies showing that young people who exercise were more likely to have signs of orthorexia nervosa (Almeida et al., 2018; Bóna et al., 2019). Our data’s divergence from this prior research may have been related to our participants’ ages having been less variable (18 to 40 years). While, we did find BMI to be significantly negatively related to orthorexia nervosa (r = −.145, p = .030), this result should be interpreted with caution. Missbach and colleagues (2015) reported a weak negative correlation between the same variables (r = −.09, p < .01), but, in their review, McComb and Mills (2019) pointed to divergent results in the literature on this relationship, with some studies reporting no correlation and others, significant correlations. Future studies should develop and test theoretical causal models to verify any relationship between age, BMI, and orthorexia. In addition, body composition (i.e., distribution of lean and fat mass) might prove to be a more accurate parameter than BMI to study the relationship between orthorexia nervosa and body mass.
As there is no “gold standard” definition of orthorexia for establishing cutoff points for the TOS, we used percentiles of the participants’ responses on the Likert-type scale to classify individuals regarding the probability that they presented characteristics of pathological or non-pathological eating behaviors. This could be considered a study limitation, though this method has been adopted previously for other scales without established categories (da Silva et al., 2021). The use of percentiles allows the TOS to be applied in clinical and scientific studies to identify the frequency of orthorexia nervosa and healthy orthorexia behaviors/symptoms, but further clinical investigations are needed to support this proposal.
Most participants (94.7%) did not present orthorexia nervosa behaviors; perhaps this indicates that individuals who regularly exercise generally follow healthy diets in a positive way and not as an aspect of obsessive dysfunctional behavior (Segura-Garcia et al., 2012). This low frequency of orthorexia nervosa in our sample is consistent with findings in some previous studies (Depa et al., 2017; Strahler et al., 2018), though some other studies reported high rates (Agopyan et al., 2019; Turner & Lefevre, 2017). Thus, our results should be interpreted with caution, and the different methods of evaluation between studies should be considered (McComb & Mills, 2019), as some prior studies used instruments with inadequate psychometric properties that may have overestimated the prevalence of orthorexia nervosa (Valente et al., 2019).
Similarly, most of our participants did not present behaviors of healthy orthorexia, indicating that most were not highly interested in healthy eating. Indeed, 41.2% of the sample showed non-pathological eating habits. This result shows the importance of independently assessing both healthy orthorexia and orthorexia nervosa in order to avoid over-identifying the incidence of pathological behaviors when many participants may be simply reporting an awareness of the benefits of a healthy diet (Depa et al., 2019). This risk may be particularly high when sampling regular exercisers who may be particularly informed about healthy eating as part of a healthy lifestyle (Bóna et al., 2019).
Limitations and Directions for Future Research
Apart from potential study limitations already discussed, we used a specific non-probabilistic sample (i.e., gym users) that is not representative of the general population, limiting any generalization of these results to individuals who exercise within gyms from other regions of Brazil. Second, we did not collect data on specific dietary patterns (e.g., vegetarianism), nor did we gather data from professional athletes (e.g., triathletes), though both of these variables may be of interest in beliefs about healthy eating. Third, we did not present test-retest measures to verify the stability of the scale. Another limitation was our reliance on self-report measures to calculate BMI. While self-reported weight and height have been shown to be highly correlated with actual measures of weight and height, there can be distorted self-perceptions of these variables among certain respondents. Finally, our cross-sectional study design does not allow inferences of cause-and-effect relationships, and longitudinal and prospective research is needed for drawing those conclusions.
Conclusion
We conducted the first cross-cultural adaptation of the original Spanish TOS into Portuguese and tested it with adults who regularly exercise within gyms in Brazil. Our results showed that the Portuguese version produced in Brazil presented valid and reliable data, which can assist further research regarding the psychology of eating. Additionally, we found invariance of the original model (bi-factorial) across independent samples and sexes. Moreover, we identified a low frequency of orthorexia nervosa behaviors (5.3%) and a moderate frequency of healthy orthorexia behaviors (41.2%) among our participants. Considering that our data were obtained from a specific sample (i.e., gym users), future research should address other samples to expand the use of the TOS in other Brazilian contexts. In the meantime, psychologists, nutritionists, physical educators, doctors, and other health professionals can develop psychoeducational actions for awareness on the harmful effects for physical and psychological health of adopting dysfunctional eating habits such as restrictive and inflexible diets.
Supplemental Material
sj-pdf-1-pms-10.1177_00315125211029240 - Supplemental material for A Portuguese Adaptation of the Teruel Orthorexia Scale and a Test of Its Utility with Brazilian Young Adults
Supplemental material, sj-pdf-1-pms-10.1177_00315125211029240 for A Portuguese Adaptation of the Teruel Orthorexia Scale and a Test of Its Utility with Brazilian Young Adults by Wanderson Roberto da Silva, Carlos Hernani Cruz Marmol, Angela Nogueira Neves, João Marôco and Juliana Alvares Duarte Bonini Campos in Perceptual and Motor Skills
Footnotes
Acknowledgments
We thank the School of Pharmaceutical Sciences at UNESP for institutional support.
Contributions
W. R. S. performed the analysis and interpretation of data and wrote the first draft of the article, taking the lead in the research. C. H. C. M. collected the data and contributed to write the first draft of the article. A. N. N. assisted with data collection and revised the article. J. M. assisted in the data analysis and revised the article. J. A. D. B. C. contributed to the conception of the study and critically revised the article.
Ethical Statement
This study was approved by the Research Ethics Committee of the School of Pharmaceutical Sciences of the UNESP, campus of Araraquara (CAAE: 22051619.8.0000.5426). This study followed the guidelines of the Declaration of Helsinki. All participants gave consent by signing the Free Informed Consent form.
Declaration of Conflicting Interests
The author(s) declared no potential conflicts of interest with respect to the research, authorship, and/or publication of this article.
Funding
The author(s) disclosed receipt of the following financial support for the research, authorship, and/or publication of this article: The study was financially supported in part by the Coordenação de Aperfeiçoamento de Pessoal de Nível Superior (CAPES; Finance Code 001) and by the National Council of Technological and Scientific Development (CNPq; 168533/2018-9).
Author Biographies
References
Supplementary Material
Please find the following supplemental material available below.
For Open Access articles published under a Creative Commons License, all supplemental material carries the same license as the article it is associated with.
For non-Open Access articles published, all supplemental material carries a non-exclusive license, and permission requests for re-use of supplemental material or any part of supplemental material shall be sent directly to the copyright owner as specified in the copyright notice associated with the article.