
Abstract
The purpose of the current study was to determine if, and to what extent, sex differences in performance fatigability after a sustained, bilateral leg extension, anchored to a moderate rating of perceived exertion (RPE), could be attributed to muscle size, muscular strength, or pain pressure threshold (PPT) in young, healthy adults. Thirty adults (men: n = 15, women: n = 15) volunteered to complete a sustained leg extension task anchored to RPE = 5 (10-point OMNI scale) as well as pretest and posttest maximal voluntary isometric contraction (MVIC) trials. The fatigue-induced decline in MVIC force was defined as performance fatigability. We used muscle cross-sectional area (mCSA) to quantify muscle size and a dolorimeter to assess PPT. The sustained task induced fatigue such that both men and women exhibited significant (p < 0.05) decreases in MVIC force from pretest to posttest (M = 113.3, SD =24.2 kg vs. M = 98.3, SD = 23.1 kg and M = 73.1, SD =14.5 kg vs. M = 64.1, SD = 16.2 kg, respectively), with no significant sex differences in performance fatigability (grand M = 12.6, SD =10.6%). Men, however, exhibited significantly (p < 0.05) longer time to task failure (TTF) than women (M = 166.1, SD =83.0 seconds vs. M = 94.6, SD =41.7) as well as greater PPT (M = 5.9, SD = 2.2 kg vs. M = 3.4, SD =1.1 kg). The only significant predictor of performance fatigability was PPT. In conclusion, differences in PPT, at least in part, mediate variations in TTF during self-paced exercise anchored to a specific RPE and resulting in performance fatigability.
Keywords
Introduction
The investigation of underlying mechanisms associated with self-paced exercise has garnered significant interest (Astokorki & Mauger, 2017; Azevedo et al., 2019, 2021; Keller, Housh, Anders, et al., 2020; Keller, Housh, Hill, et al., 2018; Keller et al., 2019a, 2019b; Keller, Housh, Hill, et al., 2020; Morrin et al., 2018). Of note, the outcomes of self-paced exercise rely on the complex interaction between task-specific psychophysiological and functional capacities of a given individual (Abbiss et al., 2015; Azevedo et al., 2021). One common methodology for decomposing this interaction utilizes Tucker et al’s (2006) rating of perceived exertion (RPE) clamp protocol. Astokorki and Mauger (2017) utilized this protocol to investigate the tolerance of exercise-induced pain during cycle ergometry and reported that participants who endured a greater amount of pain during a ride anchored to an RPE of 16 (6-20 scale) performed better (i.e., showed a shorter time to completion) during a subsequent 16.1 km ride. Additionally, this protocol has been used to anchor the intensity of various resistance exercises (Keller, Housh, Anders, et al., 2020; Keller, Housh, Hill, et al., 2018; Keller et al., 2019b; Keller, Housh, Hill, et al., 2020; Morrin et al., 2018). For example, our research group (Keller, Housh, Anders, et al., 2020; Keller, Housh, Hill, et al., 2018; Keller et al., 2019a, 2019b; Keller, Housh, Hill, et al., 2020) has used specific RPE values from the Omnibus Resistance Exercise (OMNI-RES) scale (0-10) (Robertson, 2004) to anchor the intensity of isometric muscle actions to a constant perceived level so that we could observe differences in neuromuscular and blood flow responses between constant load and constant perception tasks. No previous studies, however, have examined either (a) the influence of individual pain-pressure thresholds (PPT) to outcomes of self-paced, fatiguing resistance exercise bouts or (b) resulting potential sex differences. It is important to note that muscle afferents, implicated in small muscle mass exercise performance (Broxterman et al., 2018), and nociceptive nerve endings, found within the skin and the muscles, both converge in the dorsal horn of the spinal cord and likely share similar pain-related afferent nervous system tracks. Thus, hypothetically, individuals with higher pain tolerances should display superior performance (longer durations) during self-paced exercise, then leading to greater degrees of overall fatigue (i.e., performance fatigability).
It has been suggested that women exhibit a higher fatigue resistance than men when tasks are performed at the same relative intensity, especially at the low end of the intensity spectrum (Hunter, 2016; Wüst et al., 2008). Recently, the quantification of fatigue resistance has most commonly been expressed as magnitudes of performance fatigability (Azevedo et al., 2019; Hunter, 2016; Keller, Housh, Anders, et al., 2020; Keller, Housh, Hill, et al., 2020), which was originally defined as, “…the magnitude or rate of change in a performance criterion relative to a reference value over a given time of task performance of measure or mechanical output,”(Kluger et al., 2013). Wüst et al., (2008) aimed to circumvent potential motivational biases by inducing performance fatigability via electrically evoked contractions; they then found that female participants showed 8% less performance fatigability than their male counterparts. The authors explained this result by differences in muscle fiber composition rather than differences in motivation, muscle size, oxidative capacity or muscle blood flow (Wüst et al., 2008). In support of this notion, Keller, Housh, Hill, et al. (2020) recently reported that, following a unilateral leg extension task anchored to RPE = 2 (10-point OMNI scale), men demonstrated greater performance fatigability than women (30.9% vs. 13.6%, respectively), while there was no sex difference in muscle blood flow. However, our laboratory group (Keller, Housh, Hill, et al., 2018; Keller et al., 2019a, 2019b) failed to observe a sex difference in performance fatigability following unilateral tasks anchored to moderate to high RPEs (i.e., 5 and 8). Similarly, Mantooth et al. (2018) reported no sex differences in performance fatigability resulting from sustained handgrip tasks across the intensity spectrum (i.e. 20, 40, 60, and 80% of maximum strength). Previous studies that have reported sex differences in performance fatigability (Hunter, 2014; Keller-Ross et al., 2014, 2019; Mantooth et al., 2018) attributed these sex differences to differences in muscle mass, morphology, and muscular strength, such that, during isometric tasks, individuals exhibiting generally lower muscular strength demonstrated longer times to task failure and a greater resistance to fatigue at relative intensities. Hunter (2014) also asserted that large absolute differences in muscle mass between men and women likely contribute to sex differences in mechanical and metabolic perturbations, and consequently, performance fatigability. It remains unknown, however, if these previous performance fatigability findings extend to a fatiguing task requiring a large amount of muscle mass (i.e., bilateral muscle actions) anchored to a constant RPE rather than an objective relative intensity (% of maximal strength). Moreover, it is unknown if factors such as muscle size, muscular strength, and/or PPT influence sex differences in performance fatigability following a task anchored to an RPE.
Therefore, in the current study, we aimed to determine if, and to what extent, potential sex differences in performance fatigability resulting from a sustained, bilateral task anchored to a moderate RPE could be attributed to muscle size, muscular strength, and/or PPTs in young, healthy adults. Based on previous findings (Astokorki & Mauger, 2017; Hunter, 2014; Keller, Housh, Hill, et al., 2018; Keller et al., 2019a; Keller, Housh, Hill, et al., 2020; Keller-Ross et al., 2014, 2019), we hypothesized that women would exhibit a greater resistance to fatigue (i.e. lower performance fatigability) and that muscle mass and strength would be inversely related to the overall degree of performance fatigability.
Method
Participants
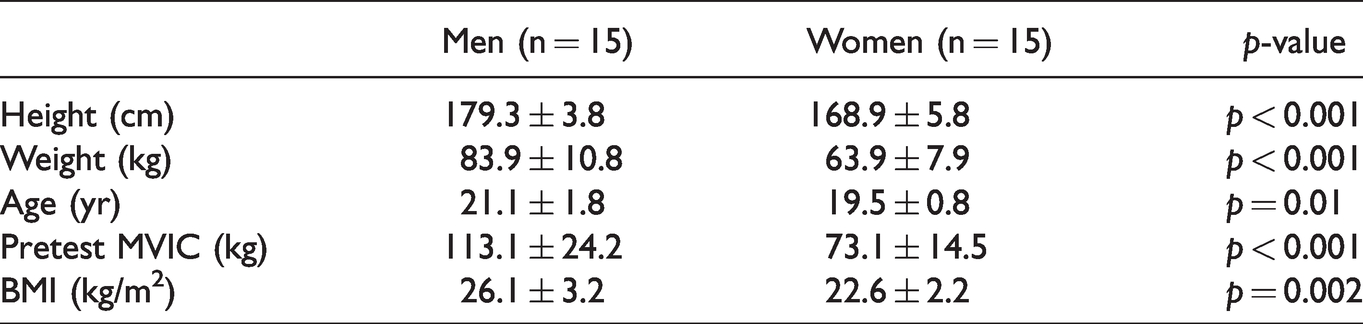
Thirty healthy, recreationally active college-aged men (n = 15: M age = 21.1, SD = 1.8 years, range = 19-25 years; M body mass = 83.9, SD = 10.8 kg, range = 68–110.7 kg) and women (n = 15: M age = 19.5, SD = 0.8 years, range = 19–21 years; M body mass = 63.9, SD = 7.9 kg, range 52.2–81.6 kg) volunteered to participate in this study (see Table 1). The participants had no known cardiovascular, metabolic, renal, or muscular diseases. They regularly engaged in recreational activities such as jogging, resistance training, intramural basketball, rock climbing, and dance. This investigation utilized data from one experimental visit within a larger multiple dependent variable study consisting of many other experimental visits. The experimental visit of interest here took place at least 24 hours after the initial familiarization visit. We have previously published non-overlapping data collected under the same application for ethical review (Garrett et al., 2021; Keller et al., 2021; Keller, Housh, Anders, et al., 2020). The University Institutional Review Board for Human Subjects approved the study (IRB Approval #: 20190619436EP), and all participants completed a health history questionnaire and gave signed, written informed consent prior to any testing.
Participants Characteristics.
Procedure
Familiarization Visit
During the familiarization visit, each participant’s age, height, and body weight were recorded. Participants were oriented to their seated position on the isokinetic dynamometer (Cybex 6000, Cybex International Inc. Medway, MA), and their dominant leg (based on kicking preference) was recorded. Also, the participants were familiarized to the OMNI-RES (Robertson, 2004) and read anchoring instructions, previously used by our research group (Keller, Housh, Anders, et al., 2020; Keller et al., 2019a, 2019b; Keller, Housh, Hill, et al., 2018, 2020; Keller, Housh, Smith, et al., 2018). Thus, participants viewed the OMNI-RES while being instructed, “You will be asked to set an anchor point for both the lowest and highest value on the perceived exertion scale. To set the lowest anchor, you will be asked to sit quietly without contracting your leg muscles to familiarize yourself with a zero. Following this you will be asked to perform two maximal voluntary isometric contractions to familiarize yourself with a 10. When instructed to give an effort corresponding to the OMNI-RES, perceived exertion should be relative to these defined anchors.”
Experimental Visit
During the experimental visit, the participants reviewed the OMNI-RES while the instructions were read to them again. Participants performed a standard warm-up of five submaximal, bilateral isometric leg extensions at a perceived moderate intensity (∼50-70% of maximum effort). Subsequently, the participants were reminded of the anchoring instructions before completing two, 6-second pretest bilateral MVIC trials, accompanied by strong, verbal encouragement. We used the MVIC with the highest force value for data analysis. Force production from each leg was measured using two independent low-profile pancake load cells (Honeywell Model 41, Morris Plains, NJ) attached to the distal end of the dynamometer lever arms. Additionally, all testing was completed on a calibrated Cybex 6000 isokinetic dynamometer at a knee joint angle of 1200 (1800=full extension). After completing the pretest MVICs, we used Tucker et al.’s (2006) RPE clamp model to anchor the intensity of the sustained, submaximal bilateral isometric leg extension to RPE = 5. Participants were blinded to force output as well as the elapsed time to minimize any potential pacing strategies. Consistent with Hutchinson and Tenenbaum’s (2019) definition of exertion, we reminded participants to be aware of sensations such as strain, intensity, discomfort, and fatigue felt during each task. The sustained leg extension was terminated once the participant indicated that he or she could no longer maintain a force corresponding to RPE = 5 or force production was equal to zero. Therefore, the time to task failure (TTF) was defined as the amount of time that the participant managed to maintain RPE = 5. Immediately after this sustained task, a posttest MVIC was completed. Based on previous recommendations (Enoka & Duchateau, 2016; Kluger et al., 2013), performance fatigability was defined as the percent decline from the pretest MVIC (sum of right and left leg force) and posttest MVIC (sum of right and left leg force). In general, performance fatigability is commonly quantified as the decline in an objective measure of performance over a discrete period of time such as force production capabilities and/or TTF (Enoka & Duchateau, 2016; Kluger et al., 2013).
Muscle Cross-Sectional Area (mCSA)
During the familiarization visit, the mCSA of participants’ right and left vastus lateralis (VL) was assessed. Utilizing a common, reliable protocol (Ruas et al., 2017), the mCSA values were recorded using ultrasound imaging obtained using a portable brightness mode of an ultrasound imaging device (GE Logiq e, USA) and a multifrequency linear-array probe (12 L-RS, 5-13 MHz, 38.4-mm field-of-view). The measurement site was 50% of the distance from the anterior superior iliac spine to the lateral aspect of their tibia on both legs. While collecting this measurement, the participants were in an upright, seated position with their leg extended and supported. Great care was taken to ensure that the probe moved perpendicularly to the skin and along the transverse plane. A line was drawn over the leg to ensure the probe traveled along a straight path. In addition, minimal pressure was applied with the probe to prevent compression of the muscle. To enhance acoustic coupling and reduce near-field artifacts, a generous amount of water-soluble transmission gel was applied to the skin prior to recording.
Images were analyzed using ImageJ Software (National Institutes of Health, USA, version 1.47v). Before analyzing, the images were scaled from pixels to centimeters using the ImageJ straight-line function. Vastus lateralis mCSA (cm2) was quantified from the panoramic images using the polygon function within ImageJ to select the maximal region of interest, while also excluding the surrounding fascia.
Pain Pressure Threshold Test
Using procedures consistent with Astokorki and Mauger (2017), we assessed PPT using a calibrated dolorimeter (Force Ten FDX Digital Force Gage, Wagner Instruments, Connecticut, USA) applied to the mid-point of the VL. The rubber footplate of the dolorimeter was held perpendicular to the muscle and display turned away to prevent the participants from viewing it. While testing for PPT, the participants sat upright and the head of the dolorimeter was applied at a constant rate until he or she stated the pressure as “uncomfortable”. As previously mentioned, this specific investigation utilized data from one experimental visit of a large, research team data collection project. The PPT values were recorded during the first four visits to determine if the measurement was reliable, due to a lack of currently published test-retest reliability data.
Data Analysis
Test-retest reliability utilized Weir’s (2005) 2,1 model. We used the sum of the right and left force and mCSA values for all analyses. We used students’ independent t-tests to examine mean differences between sexes for the participant characteristics (e.g., pretest MVIC, body mass index), mCSA, performance fatigability, TTF, dolorimeter values, and initial self-selected forces (i.e. first 5%). In addition, we used separate paired t-tests for men and women to determine differences between pretest MVIC and posttest MVIC. We determined zero-order correlations between each variable, and we used stepwise linear regression to determine significant predictors of performance fatigability. We considered a p-value of ≤ 0.05 statistically significant for all analyses, and we used Cohen’s d to report measures of effect after a significant test. We conducted the analyses using Statistical Package for the Social Sciences (SPSS) software (version 25.0 Chicago, Ill, USA).
Results
Test-Retest Reliability
The 2,1 model described by Weir (2005) indicated that there were no mean (p = 0.827) differences (systematic error) across the four measurements of PPT. There was a strong intraclass-correlation coefficient (ICC2,1) of 0.86. The standard error of the mean (SEM) was 1.69 kg, corresponding to the calculated grand mean of 4.61 kg. The 2,1 model was also used to reveal a suitable reliability for the mCSA values (ICC2,1= 0.90, SEM = 6.45 cm2, grand M = 44.5 cm2).
Maximal Voluntary Isometric Contractions
As presented in Figure 1, mean pretest, bilateral MVIC force values were significantly greater (p < 0.001; d = 2.0) for men (M = 113.1, SD = 24.2 kg) than for women (M = 73.1, SD =14.5 kg). Following the sustained task, both men and women exhibited significant (p < 0.05) decreases in MVIC force pretest to posttest (M = 113.1, SD = 24.2 kg to M = 98.3, SD =23.1 kg, d = 0.55; and M = 73.1, SD = 14.5 kg vs. M = 64.1, SD = 16.2 kg, d = 0.59, respectively). Thus, men and women showed performance fatigability values of M = 12.1, SD = ±15.0% (range: 0.94 to 59.3%) and M = 13.1, SD = 10.1% (range: 2.1 to 40.8%), respectively, that were not significantly different (p = 0.83).
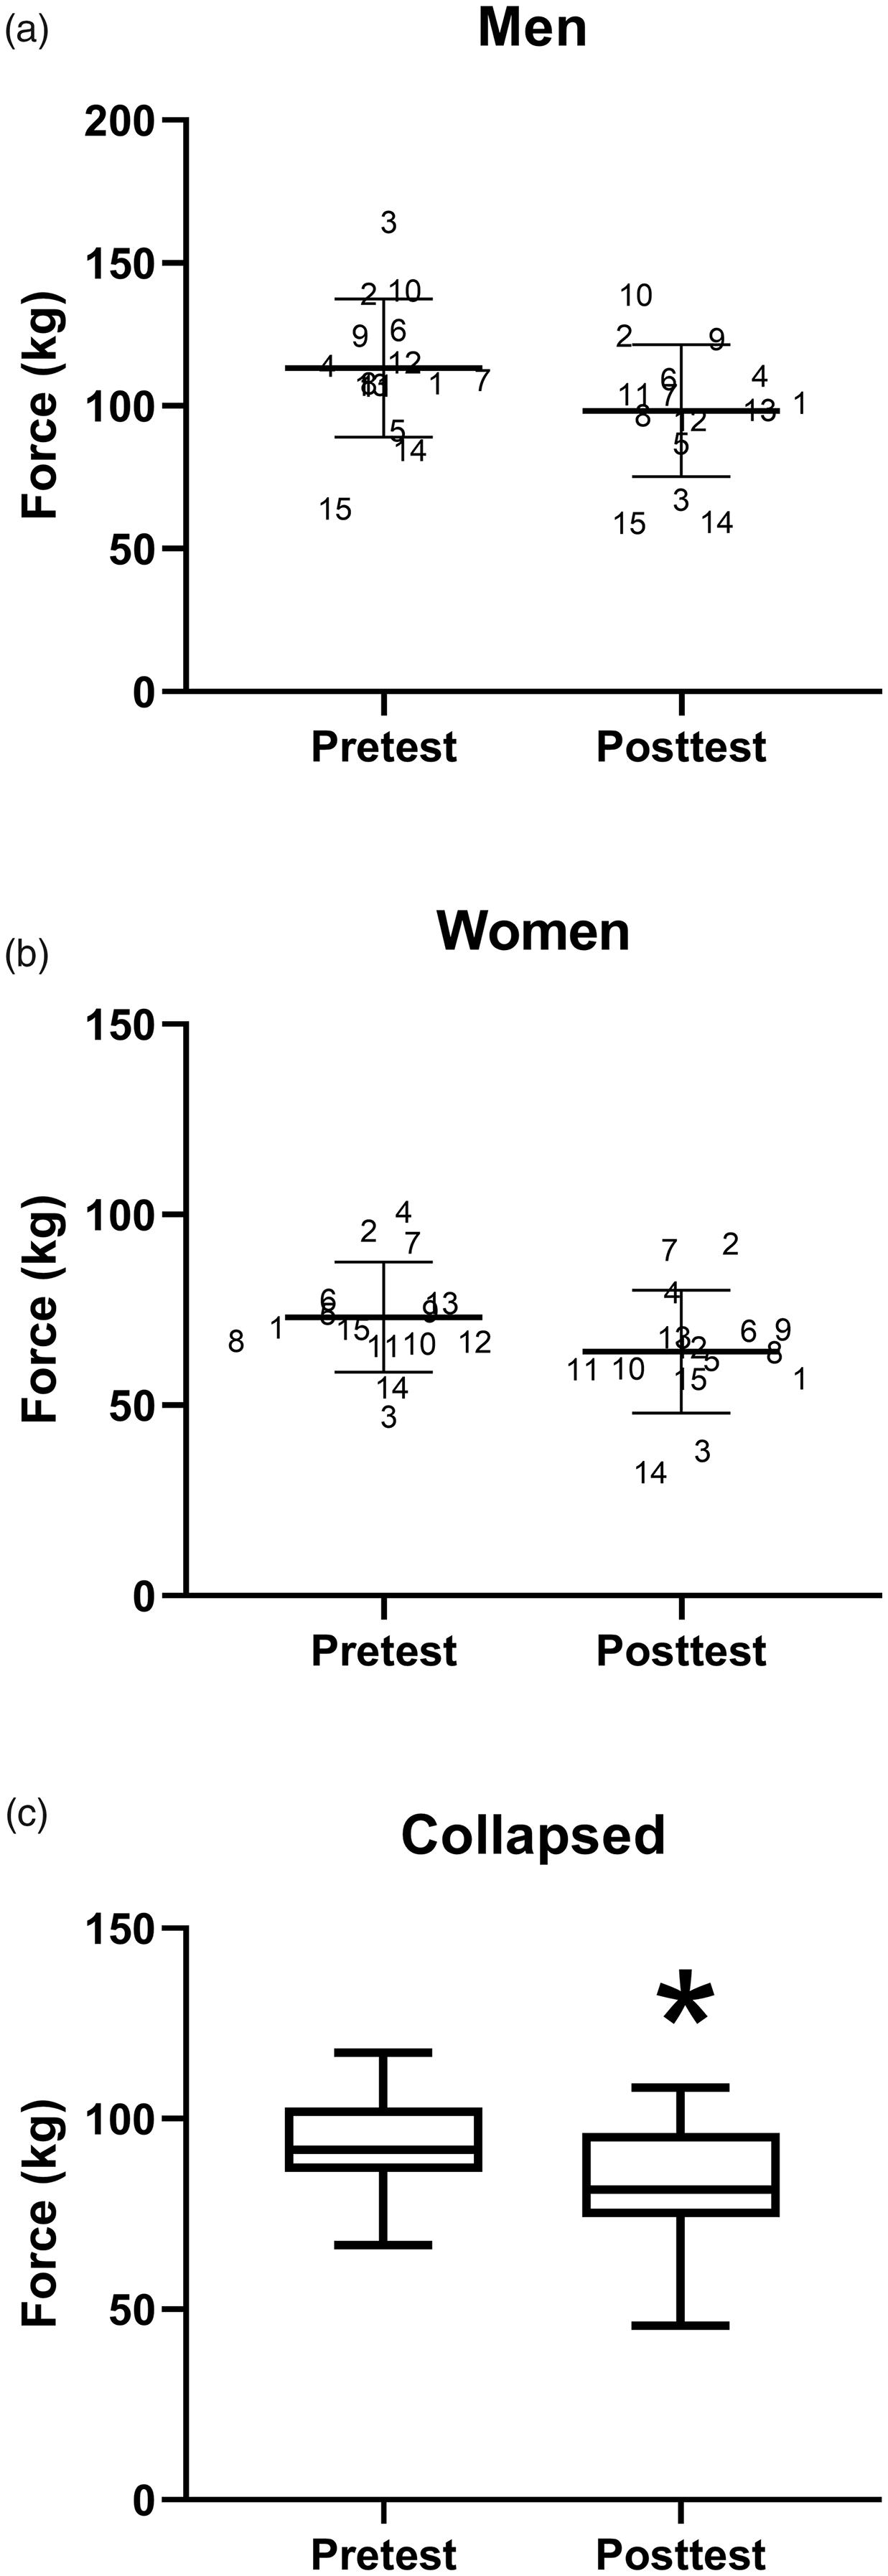
Individual (Participant Number) Pretest and Posttest MVIC and M and SD (bars) Values of Men (Panel A; M = 113.1, SD = 24.2 kg vs. M = 98.3, SD = 23.1 kg) and Women (Panel B; M = 73.1, SD = 14.5 kg vs. M = 64.1, SD = 16.2 kg), Respectively (With No Significant Difference in Fatigability (p >.05); Panel C Depicts the Box and Whisker Plot (minimum to Maximum) of the Significant (p <.05*) Fatigue-Induced Mean Decrease in MVIC (Collapsed Across Sex) Force Values From Pretest (M = 93.2, SD = 13.9 kg) to Posttest (M = 81.2, SD = 17.9 kg).
Initial Self-Selected Force Values
For the initial (i.e., the average of the first 5% TTF) self-selected bilateral forces, the participants produced a force below the expected value (i.e., 50% MVIC), but there was no difference (p = 0.503) in these estimates between men (M = 44.8, SD =14.8% MVIC) and women (M = 39.3, SD = 19.9% MVIC).
Time to Task Failure, Muscle Cross-sectional Area, and Dolorimeter
For the TTF, the men’s times (M = 166.1, SD = 83.0 seconds) were significantly (p = 0.007; d = 1.1) greater than the women’s (M = 94.6, SD = 41.7 s). For mCSA (i.e. sum of right and left legs), the independent t-test showed a significant (p < 0.001; d = 2.2) difference between men (M = 50.9, SD = 7.6 cm2) and women (M = 38.1, SD = 3.6 cm2). For the dolorimeter (i.e. measure of PPT), the independent t-test indicated that men (M = 5.9, SD = 2.2 kg) tolerated significantly (p < 0.001; d = 1.4) greater pain than women (M = 3.4, SD = 1.1 kg).
Pearson Correlations and Stepwise Linear Regression
All zero-order correlations are presented in Tables 2 and 3. For the men, the Pearson’s zero-order correlations indicated significant (p < 0.05) relationships for strength - mCSA (r=.750), strength - weight (r=.634), mCSA - weight (r=.649), performance fatigability - weight (r=.623), performance fatigability - PPT (r=.597), as well as PPT - weight (r=.734). For the women, there were significant (p < 0.05) relationships for strength - mCSA (r=.747) and PPT - mCSA (r=.531). Based on the above significant correlations, dolorimeter values, weight, and sex were used to predict performance fatigability via stepwise linear regression. The stepwise linear regression analysis indicated that the only significant (p = 0.013; r2=0.450), albeit moderate, predictor of performance fatigability was the PPT.
Men’s r-Values for Pearson Correlations.
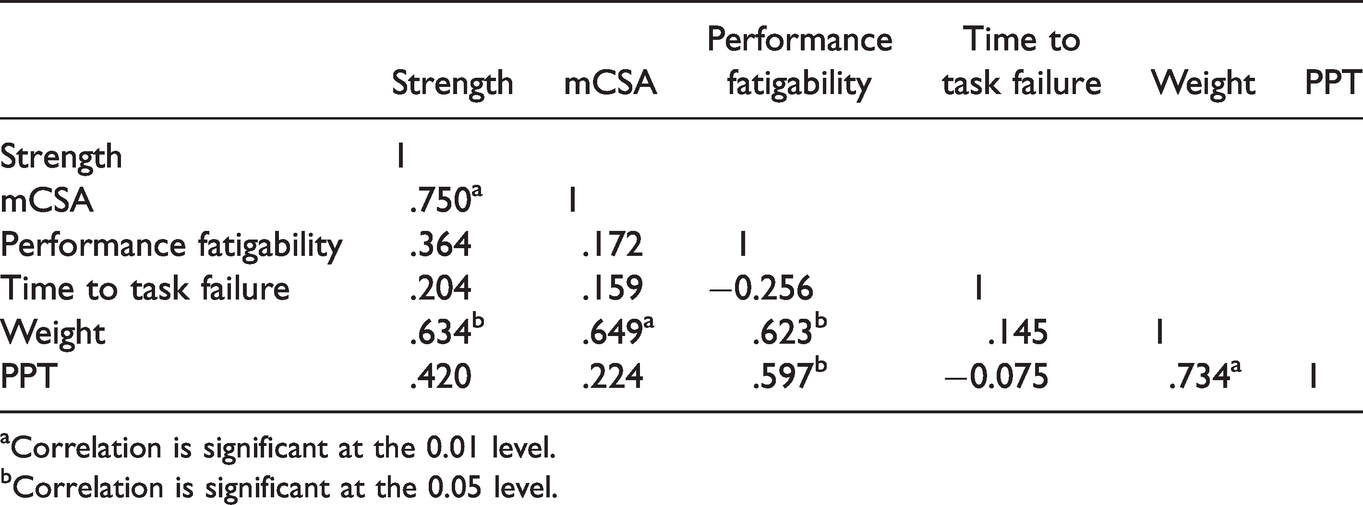
aCorrelation is significant at the 0.01 level.
bCorrelation is significant at the 0.05 level.
Women’s r-Values for Pearson Correlations.
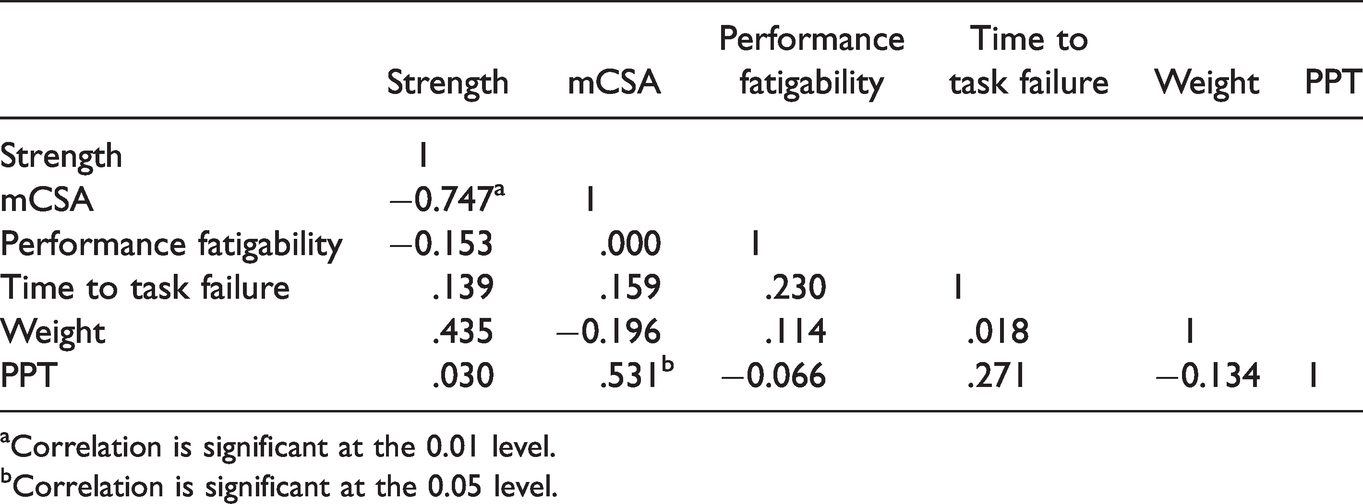
aCorrelation is significant at the 0.01 level.
bCorrelation is significant at the 0.05 level.
Discussion
The purpose of the current study was to determine if, and to what extent, potential sex differences in performance fatigability after a sustained, bilateral task anchored to a moderate RPE could be attributed to muscle size, muscular strength, and/or PPTs in young, healthy adults. Our principal findings were: (a) The sustained leg extensions anchored to RPE = 5 resulted in performance fatigability, but the magnitude did not differ between men and women; (b) men exhibited longer TTF and higher PPTs than women; (c) men demonstrated relationships between PPT and performance fatigability, and (d) PPT was the only significant predictor of performance fatigability. Overall, these findings suggested that PPT was more closely related to performance fatigability following a task anchored to an RPE than were such previously suggested factors as sex, muscle size, and muscular strength (Hunter, 2014, 2016; Keller-Ross et al., 2014, 2019).
Both men and women self-selected a moderate intensity (∼42% MVIC) for their initial force production value, which was slightly lower than the expected force value for RPE = 5 (i.e. 50% MVIC). In prior research, men, but not women, exceeded the amount of force expected when asked to generate force corresponding to RPE = 5 (i.e. 0-10 scale; accurate value: 50% MVIC) for a discrete 6-second isometric leg extension (Keller, Housh, Smith, et al., 2018). During sustained unilateral leg extensions anchored RPE = 5, however, both men and women have self-selected lower initial forces than the expected forces (∼35% MVIC vs. 50% MVIC) (Keller, Housh, Hill, et al., 2018; Keller et al., 2019b). Similar to these sustained unilateral findings (Keller, Housh, Hill, et al., 2018; Keller et al., 2019b), in the current study, it is likely that individuals self-selected slightly lower than expected initial force values for the sustained task due to their naivety to the task, its unknown duration, and/or their subconscious pacing strategies. It also remains possible that the anchoring procedures were not understood by some participants. We have, however, used these exact procedures to demonstrate that men and women were most accurate when estimating the center of the intensity spectrum during short, known duration muscle actions (Keller, Housh, Smith, et al., 2018). Moreover, despite the lower than expected self-selected forces, the sustained, bilateral leg extension resulted in performance fatigability for each participant (Figure 1). There was, however, no sex difference in the average magnitude of performance fatigability (% decline pretest to posttest MVIC). In contrast to these findings, others demonstrated (Keller, Housh, Hill, et al., 2020) sex differences in performance fatigability after unilateral leg extensions anchored to a low perception of exertion (i.e. RPE = 2). Thus, based on the current results and previous reports (Keller et al., 2019a; Keller, Housh, Hill, et al., 2020) we hypothesized that sex differences in performance fatigability after fatiguing tasks anchored to perceptually based intensities are only present at the low end of the intensity spectrum and, potentially, after tasks requiring a low amount of muscle mass (i.e., unilateral tasks, not bilateral tasks).
In support of this hypothesis, sex differences in performance fatigability have been shown to diminish across the intensity spectrum (Hunter, 2016) and there is typically a lower magnitude of performance fatigability following a bilateral compared to a unilateral task (Rossman et al., 2012, 2014). Rossman et al. (2014) reported that in eight, recreationally-active men, leg extensions at 85% peak workload resulted in a greater magnitude of performance fatigability following the unilateral condition compared to the bilateral condition (25% vs. 12%, respectively), which suggested that a greater degree of fatigue is tolerated when only small amount of muscle mass is recruited. Thus, under the current conditions, we hypothesize that the degree of performance fatigability may have been limited to such an extent for both men and women that it may have prevented the observance of a sex difference. Additionally, the men did have a greater amount of skeletal muscle mass in the VL than the women (i.e., mCSA). One possible underlying mechanism associated with these findings has previously been termed the sensory tolerance limit (Gandevia, 2001; Hureau et al., 2018), which states there is “… a hypothetical ‘threshold’ whereby the consequences of continuing the task become sufficiently unattractive such that the exercising human either terminates the task, or if possible, reduces the exercise intensity to ensure the continuation is tolerable.” Furthermore, it has been suggested that the sensory tolerance limit may contribute to a greater degree during bilateral tasks compared to unilateral tasks due to a reduced likelihood of catastrophic disruptions to homeostasis during tasks that require less engaged skeletal muscle mass (Rossman et al., 2012, 2014). Perhaps, when tasks are anchored to a defined perceptual intensity, the sensory tolerance limit is set to that respective intensity. Therefore, our findings of no sex difference in performance fatigability after fatiguing, bilateral leg extensions anchored to a moderate RPE may be due at least in part to the intensity of the task, the large muscle mass nature of the task, and/or the sensory tolerance limit having been set to RPE = 5.
We found that men tolerated ∼54% more discomfort (i.e., PPT) than women, which was likely reflective of the fact that men also exhibited a ∼55% greater TTF than the women. Thus, men took a significantly longer to reach their theoretical sensory tolerance limit of RPE = 5. Based on these results, we hypothesize that the women were less tolerant of factors such as exercise induced pain and discomfort, which contributed to their earlier aversion to maintaining an exertion at the level of RPE = 5. Astokorki and Mauger (2017) previously demonstrated the relative contributions of exercise-induced pain by examining 41 adults during a cycle ergometry test at a fixed RPE = 16 (Borg 6-20 scale; ‘very hard’); they reported that exercise-induced pain explained a significant amount of variance in cycling performance (i.e., time trial). Thus, in conjunction with the current findings, we suggest that participants who were willing to tolerate a greater amount of pain/discomfort performed better (i.e., longer TTF, shorter time trial). There may, however, be an effect of intensity since the current investigation utilized a moderate RPE value, whereas Astokorki and Mauger used a higher intensity. However, the current findings extended those of Astokorki and Mauger to resistance exercise by investigating sex as a factor and finding a difference between men and women. Interestingly, as a group, women have previously shown greater pain sensitivity, less tolerance to pain, and more somatization than men (Fillingim et al., 2009; Fillingim & Maixner, 1995; Riley et al., 1998; Wiesenfeld-Hallin, 2005). These findings have been attributed to estrogenic influences on pain processing, since estrogen has been shown to increase the release of peripheral cytokines such as γ-interferon as well as the ability to sensitize primary afferents involved in nociceptive processing (de Leeuw et al., 2006; Fillingim & Ness, 2000; Fillingim et al., 2009). Moreover, de Leeuw et al. (2006) demonstrated that there were sex differences in neural responses following the application of a painful heat stimulation and that the magnitude of these responses were dependent on women’s estrogen levels, providing the basis for the influence of sex hormones on the activation of neuronal patterns in response to painful stimuli. Within the central nervous system, these responses have been primarily observed within the anterior cingulate cortex (ACC), which has been shown to be involved in the affective-motivational component of pain (de Leeuw et al., 2006; Xiao et al., 2019). Of note, the ACC has been implicated in various theories and models related to the formation of the perception of exertion and/or effort (Keller et al., 2019b; McMorris et al., 2018).
An alternative explanation has been suggested by Jackson et al. (2002) who demonstrated that higher task-specific self-efficacy ratings were predictive of increases in pain tolerance and lower ratings of average pain intensity, and, interestingly, that men reported greater physical and task-specific self-efficacy than women. Thus, the association between sex and pain perception may be mediated by self-efficacy beliefs. Socialization practices that encourage male stoicism and physical robustness likely play a contributing role in the reported sex differences in self-efficacy (Bendelow, 1993). Relating this notion to performance outcomes, Keller, Housh, Smith et al., (2018) demonstrated that, unlike women, men generally produced too much force when estimating forces across the intensity spectrum during isometric leg extensions. Overall, differences in pain/discomfort tolerance are likely mediated by a combination of hormonal and psychological factors that promote men’s tendencies to sustain tasks anchored to RPEs longer than women. Future studies are still needed, however, to determine to what extent these differences will affect the magnitude and rate of resistance training-induced muscle adaptations resulting from exercise prescriptions utilizing perceptual-based intensities.
It is important to note that the current protocol required participants to maintain a defined level of exertion, not effort. It has previously been shown that in order to maintain a constant level of exertion, individuals must continuously reduce force production, which typically exhibits a curvilinear pattern across time in men and women (Keller et al., 2021; Keller, Housh, Hill, et al., 2018; Keller et al., 2019a; Keller, Housh, Hill, et al., 2020). Hutchinson and Tenenbaum (2019) highlighted the significance of differentiating effort from exertion such that exertion has been related to sensations of pain and/or discomfort, whereas effort is a cognitive feeling of work associated with voluntary actions. It has been suggested that the perception of exertion is likely modulated by afferent feedback from the working muscles (i.e., group III/IV muscle afferents), subjective perceptions of force, inputs from a central motor command system, fatigue, and changes in motivation or task aversion (Hutchinson & Tenenbaum, 2019; Smirmaul, 2012). Because these terms (i.e., effort vs. exertion) have different operational definitions and are associated with different fatigue-related symptoms, there is a rationale for theorizing different underlying mechanisms (perhaps not entirely exclusive of each other) that modulating their separate perceptions. Classically, Cafarelli (1982) suggested that, in general, the sensations occurring during voluntary muscle actions can be attributed to three possible underlying mechanisms: (a) afferent feedback (signals travel from group III/IV muscle afferents to somatosensory regions of the brain) (Broxterman et al., 2018); (b) feedforward (corollary discharges; copy of the motor command is simultaneously sent to somatosensory brain region as well as the corticospinal tract) (McMorris et al., 2018); and (c) feedforward + feedback (expected [i.e. corollary discharges] sensations are compared to the actual [i.e. information from group III/IV muscle afferents] sensations and the motor output is continuously adjusted) (Tucker et al., 2006). Broxterman et al. (2018) previously demonstrated the influence of group III/IV muscle afferents on small muscle mass (unilateral leg extension) performance by reporting RPE values were lower during a task with limited afferent feedback (via intrathecal fentanyl administration) compared to a control trial. Thus, based on the lower reported RPE values (4.3 vs. 9.9) (Broxterman et al., 2018) following the inhibition of group III/IV afferents, it appears that afferent feedback plays a meaningful role in the perception of exertion. Applying Broxterman et al.’s (2018) findings to our own, the main, contributory factors to the previously observed declines in force during the sustained task anchored to RPEs were sensations such as strain, pain and discomfort that were initially recorded by the group III/IV afferents and sent to the somatosensory regions of the brain. While outside of the scope of the current investigation, we at least partially agree that the perception of effort is more influenced by the amount of mental or physical energy being given to a task than by the sensations resulting from it (Abbiss et al., 2015). Of note, however, Drouin et al. (2019) attempted to assess effort via the Task Effort Awareness (TEA) scale while concurrently clamping neural drive (i.e., holding central motor command constant) during a handgrip task; they found that, despite no change in neural drive during the task, there was an increase in effort (TEA values). Our speculative interpretation of Drouin et al. is that (a) effort is not entirely reflected by neural drive; (b) TEA is a semi-flawed measurement of effort; and/or (c) effort is affected by a combination of underlying mechanisms such as feedforward and feedback. In our study, while exertion was held constant by design, effort likely decreased during the task in response to various physiological and psychological factors such as afferent feedback as well as self-efficacy and attentional focus (Broxterman et al., 2018; Jackson et al., 2002). This decline in effort may have also manifested itself during the posttest MVIC and the resulting degree of performance fatigability. Overall, based on our results, we suspect that during fatiguing tasks anchored to a constant RPE, feedback and feedforward mechanisms together with psychological factors contributed to the observed decrease in force production necessary to maintain RPE = 5 and likely continued to elicit their effects during the posttest MVIC. Future studies should continue to assess the proposed disassociation between perceived exertion and effort as well as their underlying mechanisms while quantifying neuromuscular parameters such as neural drive. Additionally, future work is warranted for developing strategies to maintain attentional focus and improve self-efficacy.
Limitations
Limitations to the current study included the absence of any assessment of potential differences in muscle fiber composition characteristics as well as body composition or circulating sex hormone(s) that have been attributed to various sex differences in prior performance outcome studies (Hunter, 2016; Wüst et al., 2008). We also chose to not control for the variations of the menstrual cycle among our female participants, due to a recently published point-counterpoint narrative (Stanhewicz & Wong, 2020). Additionally, in our current opinion, testing women only during a narrow window of their menstrual cycle, when estrogen and progesterone levels are low, may jeopardize the generalizability of research findings to real life circumstances and thereby threaten external validity. Instead, our random recruitment likely examined women whose menstrual cycle phases were equally distributed. It should also be noted that we did not assess/report neuromuscular data within this study, rendering our interpretation of underlying neurophysiological mechanisms speculative at best. In addition, we did not quantify exercise-induced pain during the task, which may have provided further understanding and interpretations. The relationship between PPT and exercise-induced pain still requires investigation. Overall, our results were derived from healthy, college-aged adults, which may not be reflective of the general, adult population. Every attempt was made to have a sample that was representative of the university population and curriculum to minimize the potential nuisance variable of previous exercise science-based knowledge.
Conclusions
The current study found that men and women experienced equal degrees of performance fatigability following a sustained bilateral task defined by a perceptually-based moderate intensity. Thus, we hypothesized and confirmed that there would be no sex-specific changes in global fatigue as a result of the current fatiguing task, and we suspect that a combination of both feedback and forward mechanisms contributed to reaching the sensory-tolerance limit specific to RPE = 5. Despite the absence of a sex difference in global fatigue, men displayed longer TTF and greater PPT than women, a finding we interpreted as due to men having set a higher relative sensory tolerance limit corresponding to RPE = 5 that was likely mediated by the differences in sex-specific degrees of self-efficacy. Future work investigating specific locations exhibiting diminished neuromuscular function as a result of fatiguing perceptual-based tasks, remains warranted.
Footnotes
Acknowledgements
We would like to thank all the participants for volunteering to adhere to the protocol of this investigation. The National Strength and Conditioning Association as well as the Northlands American College of Sports Medicine Chapter partially sponsored this project in the form of doctoral/graduate student grants (JLK). Lastly, thank you to the Undergraduate Creative Activities and Research Experience (UCARE) program at the University of Nebraska-Lincoln for supporting KH.
Declaration of Conflicting Interests
The author(s) declared no potential conflicts of interest with respect to the research, authorship, and/or publication of this article.
Funding
The author(s) received no financial support for the research, authorship, and/or publication of this article.