
Abstract
This is a two-part study to determine one or more reliable physiological anchors for perception of effort. The purpose of Study 1 was to compare ratings of perceived exertion (RPE) at the ventilatory threshold (VT) in running, cycling, and upper body exercise with the premise that if RPE at VT did not differ across exercise modes, VT might provide a unique set of physiological inputs for perception of effort. For 27 participants, values for VT and for RPE at VT (Borg 6 to 20 scale) averaged 9.4 km⋅h−1 (SD = 0.7) and 11.9 km⋅h−1 (SD = 1.4) respectively in running, 135 W (SD = 24) and 12.1 W (SD = 1.6) in cycling, and 46 W (SD = 5) and 12.0 W (SD = 1.7) in upper body exercise. RPE did not differ, suggesting that VT may anchor effort perception. In Study 2, 10 participants performed cycle ergometer exercise for 30 minutes at their VT (M = 101 W, SD = 21), at their maximal lactate steady state (M = 143 W, SD = 22), and at their critical power (CP; M = 167 W, SD = 23). Mean end-exercise RPE were 12.1 (SD = 2.1), 15.0 (SD = 1.9), and 19.0 (SD = 0.5), respectively. The very close clustering of RPE during exercise at CP hints that the confluence of physiological responses at CP may (also) serve as a determinant in perception of effort.
Keywords
Introduction
Ratings of perceived exertion (RPE; Borg, 1970) have been described as “the single best indicator of the degree of physical strain” (Borg, 1982), and they provide a psychological complement to physiological data that may be monitored during exercise. An underlying assumption in the present study and in the application of RPE generally is that effort perception is determined by physiological responses during exercise, although it is acknowledged that factors, such as previous experience, motivation, and anxiety, among others, may influence this perception. The question remains – what responses contribute to the perception of effort? Some possibilities are provided below, but suffice it to say, the connection between the biology of the response and the psychology of the perception of effort is not clear and straightforward.
As described in detail elsewhere in this paper, there is a belief that the unique combination of physiological responses that define certain threshold intensities (like the ventilatory threshold; VT) might be associated with a particular sensation of effort. In other words, the perception of effort might be ‘anchored’ at some threshold intensity. Although research for many years has focused on the VT as the anchor for the perception of effort (e.g., Purvis & Cureton, 1981), other thresholds have their own unique combination of physiological responses, and they might also serve as anchors in effort perception. The overarching purpose of the two studies reported here was to investigate whether the confluence of responses associated with certain threshold intensities (VT in Study One; VT, maximal lactate steady state (MLSS), and critical power (CP) in Study 2) might be key to the perception of effort.
The VT is accepted as the point of demarcation between moderate and heavy exercise intensity domains. Moderate intensity exercise is characterized by a mono-exponential increase in VO2 to a steady-state value at ∼55% of VO2max at the VT (the actual percentage is a function of training status), and anaerobic contribution is limited to the first few minutes, as the VO2 is increasing to meet the oxygen demand. Heavy intensity exercise is characterized by an exponential increase in VO2 followed, after ∼2 minutes of exercise, by a slow component response that leads to delayed attainment of the VO2 steady-state, and there is an anaerobic contribution throughout the exercise, because VO2 is below the oxygen demand (Whipp & Wasserman, 1972). Given the homogeneity of RPE values at the VT (Purvis & Cureton, 1981; Hill et al., 1987; 1989; Boutcher et al., 1989; Seip et al., 1991), some have suggested that RPE may be anchored by the combination of cardiorespiratory and metabolic responses associated with the VT (DeMello et al., 1987; Mihevic, 1981; Robertson, 1982; Zamunér et al., 2011).
As noted above, while most studies involving anchors for RPE have focused on VT, there are other thresholds that demarcate intensity domains and that are associated with more immediate and more marked response differences. For example, the MLSS (Beneke & von Duvillard, 1996) demarcates heavy intensity exercise (characterized by elevated but steady state blood lactate concentrations and a constant blood pH and associated with a two-component VO2 response before achievement of a steady state; Whipp & Wasserman, 1972) from very heavy exercise (characterized by constantly-increasing blood lactate concentrations and associated with a three-component VO2 response leading to a steady state; Hill et al., 2021). Consistent with the idea that MLSS might play a special role in effort perception, Hill et al. (2021) reported that RPE values during exercise at MLSS were quite uniform in a group of 15 participants, and Hutchinson et al. (2021) found that RPE at MLSS was the same for cycling and upper body exercise.
Another threshold that distinguishes between exercise intensity domains associated with markedly different physiological responses is CP. CP is defined as the asymptote of the mathematical relationship between time to exhaustion (Texhaustion) and work rate (Monod & Scherrer, 1965; Hill, 1993), and it demarcates very heavy exercise (characterized by a constantly increasing blood lactate concentration and associated with a three-component VO2 response leading to a steady state; Hill et al., 2021) from severe exercise (characterized by a more rapidly increasing blood lactate concentration and a rapidly decreasing blood pH and associated with a two-component VO2 response leading to VO2max; Poole et al., 1990).
Practically, with regard to using RPE to prescribe exercise intensity, it is crucial to know if the RPEs at VT, at MLSS, and/or at CP are consistent within a population. Psychophysiologically, it is important to learn if the confluence of physiological responses at VT, MLSS, and/or CP may be central to effort perception.
In our first study, our purpose was to compare RPE at VT in incremental and constant-power during running, cycling, and upper body arm cranking exercises. We hypothesized that, while physiological responses at VT in the three exercise modes would be dissimilar, the RPE at VT would not be significantly different. Consistent RPE values at VT in different exercise modes and the associated differences in metabolic and neuromuscular demands would support VT as a physiological anchor in effort perception. Therefore, our working hypothesis in Study 1 was that the unique combination of physiological responses at the VT would be responsible for the perception that the exercise feels ‘light,’ whereas the combination of responses to exercise slightly above the VT would account for the perception that it feels ‘somewhat hard.’ In our second study, our purpose was to evaluate the similarities of the RPE values during a cycle ergometer exercise at VT, MLSS, and CP in a sample of university students. The working hypothesis for Study 2 was that RPE values at one or more of these thresholds would be closely clustered, indicating that the confluence of physiological responses associated with that threshold (indeed, the physiological responses that define the threshold) provide pertinent physiological cues for effort perception.
Method
Study 1: RPE at VT in Running, Cycling, and Upper Body Exercise
Participants
Study 1 was approved by the Institutional Review Board for the Protection of Human Subjects at the University of North Texas. We explained the general purpose, detailed methods, risks, and benefits of the study to potential participants, but they were kept naïve to the study’s hypothesis. Data were collected in the Applied Physiology Lab (not a psychophysiology lab), meaning that participants were not focusing on RPE as the key variable in the study. All participants provided voluntary written informed consent prior to any data collection. A total of 27 participants completed all aspects of testing, including 12 women (M age = 22 years, SD = 1; M height = 162 cm, SD = 6; M weight = 63 kg, SD = 7) and 15 men (M age = 22 years, SD = 2; M height = 178 cm, SD = 7; M weight = 78 kg, SD = 8). This sample included two Asian/Hispanic, one Asian/non-Hispanic, three Black/Hispanic, five Black/non-Hispanic, seven white/Hispanic, and nine white/non-Hispanic participants. All were undergraduate kinesiology majors who were involved in recreational and fitness activities, but none was involved in any organized competitive sport. Typically, they reported participating in resistance exercise 2 – 3 times a week and participating in aerobic activity, such as jogging, cycling, or stair-stepping, 1 – 2 times a week. They were moderately fit, as indicated by a mean VO2max of 46 mL·kg−1·min−1 (SD = 7).
Prior to data collection, we familiarized participants with the RPE scale, including the verbal cues associated with the odd numbers on the scale. Prior to each session, participants verified that they (a) had obtained ‘a good night’s sleep,’ (b) had refrained from performing exhausting exercise, drinking alcohol, and taking non-prescription medication for 24 hours, (c) were not taking prescription medications that could affect exercise responses, and (d) had abstained from carbonated or caffeinated beverages for 4 hours. They were tested only if they verified adherence to these guidelines. They were free from disease for the duration of the study.
Procedures
On separate days, each participant performed three maximal incremental treadmill running tests, three incremental leg cycling tests, and three incremental arm cranking tests to determine the work rate (or speed) at the VT, and the associated RPE. The order of the testing was randomized. Next, participants performed 20 minutes of constant-power running, cycling, or arm cranking exercises at the mode-specific VT, each on separate days. The order of these three different constant-power tests was determined by randomization. For each participant, laboratory visits were scheduled at the same time of day to avoid the confounding influence of different circadian rhythms on responses to exercise (Hill et al., 1989). The values for the physiological and RPE responses at the VT in the incremental tests performed using each exercise mode were compared via one-way analysis of variance (ANOVA) with repeated measures across exercise mode, using the Statistical Package for the Social Sciences (SPSS, v22, Armonk, NY, USA). The responses from the 20-minute exercise bouts at the mode-specific VT were compared in SPSS using a two-way ANOVA with repeated measures across mode and over time. Thus, participants performed 12 tests, with at least 24 hours rest between them, and all testing was completed in five weeks.
Measures
Incremental Running Tests for VT Determination
These incremental tests were performed on a Quinton 633 treadmill (Seattle, WA USA) with 0% slope. For both women and men, the first test began at a speed of 100 m·min−1, and speed then increased by 10 m·min−1, each minute. The participants were instructed to continue as long as possible, and they were provided strong verbal encouragement. Tests were terminated when the participant grasped the handrails (signaling an inability to continue) or at the discretion of the investigator who observed signs of participant intolerance, such as a staggering gait. Speeds for the second and third tests were selected on the basis of earlier responses in the previous test, with tests involving ∼12 stages and lasting ∼12 min. For example, if an individual completed 15 stages, the starting speeds for the second and third tests would be increased, perhaps to 120 m·min−1 for one and 125 m·min−1 for the other.
Incremental Cycling Tests for VT Determination
Incremental leg cycling tests were performed on an Monark Ergomedic 828E cycle ergometer (Varberg, Sweden), using a pedaling cadence of 80 revolutions per minute (rev·min−1). Seat height and handlebar position were individually adjusted for each participant. For women, the first test began at 40 W and increased by 15 W each minute. For men, the first test began at 60 W, and increased by 20 W each minute. The participants were required to exercise in time to a metronome, and they were instructed to continue as long as possible. Tests were terminated when the cadence fell below rev·min−1 and could not be returned to 80 rev·min−1 despite strong verbal encouragement. Work rates for subsequent tests were selected based on participant’s responses in the first test so that they would last ∼12 minutes.
Incremental Upper Body Exercise Tests for VT Determination
The incremental arm cranking tests were performed on a Monark 881E upper body ergometer (Varberg, Sweden), using a cadence of 70 rev·min−1. The participant stood, and the ergometer was adjusted so that the fulcrum was at shoulder height. The participant was instructed to use arms and shoulders only. To minimize lower body contribution, participants stood with their buttocks against the edge of a solid table. The first test began at 20 W and increased 5 W each minute for women and 10 W each minute for men. Starting work rates and increments for the second and third tests were individually selected for participants based on responses in the previous test. The participants were required to exercise in time to a metronome, and they were instructed to continue as long as possible. Tests were terminated when the cadence fell below 65 rev·min−1 and could not be returned to 70 rev·min−1 despite strong verbal encouragement.
Constant-Power Tests at VT for the Three Exercise Modes
Each participant performed three 20-minute constant-power tests, one using each exercise mode, and each at the mode-specific VT. The same equipment was used for the incremental and constant-power tests, and the individual settings were the same as in the incremental test.
Determination of VT and RPE at VT
VO2 and other measures were obtained on a breath-by-breath basis using a Medical Graphics Express system (St Paul, MN USA), which was calibrated immediately prior to each test. All tests began with four minutes of seated (cycling tests) or standing rest to allow the participant to adjust to the mouthpiece and nose clip. HR was measured at the end of each stage in incremental tests, and after 5, 10, and 20 minutes in the constant-power tests, using an FT7 monitor (Polar Electro Oy, Kempele, Finland). RPE were obtained at the end of each stage of incremental tests, and after five, 10, and 20 minutes in the constant-power tests, using Borg’s (1970) 6 – 20 RPE scale. Standardized instructions were given each time an RPE was elicited.
For the determination of the work rate (or speed) at the VT, results from each individual’s three incremental tests in each exercise mode were collapsed into one file. The VT was determined using a plot of the ventilatory equivalent for oxygen (VE/VO2; the ratio between minute ventilation (VE) and VO2) versus work rate (or speed). A spline function identified the VT as the work rate (or the speed) associated with the nadir of the VE/VO2 response, that is, the point above which there was a sustained increase in the ventilatory equivalent for oxygen (Caiozzo et al., 1982). Other markers included consistent changes in the pattern of response of VE, CO2 production, and the fraction of oxygen in expired air. The RPE, VO2, and HR associated with the nadir were recorded.
Data Analysis
Prior to statistical analysis, we confirmed the normality of the data distributions using the Shapiro-Wilk test. Values for RPE and other responses at the VT during the incremental tests were compared using a one-way repeated-measures ANOVA. Responses during the 20-minute exercise bouts at VT were compared using a two-way ANOVA (with repeated measures across Exercise Mode [running, cycling, and upper body exercise] and over Time [5, 10, and 20 minutes]). Initially, all ANOVAs included sex as an independent variable. However, there was no significant interaction effect involving sex for any dependent variable. Therefore, data were collapsed across sex for the analyses and comparisons reported here. For all analyses, we used the 0.05 probability level to denote statistical significance. In each analysis, data were tested for sphericity using Mauchly’s Test of Sphericity, so that, if necessary, results would be interpreted using a Greenhouse-Geisser correction. All values reported in this paper are given as means (and standard deviations), abbreviated as M and SD, respectively. In addition, the CV and the 95% confidence interval (CI) were calculated for the RPE values at VT during the incremental tests and at each of the three time-points during the constant-power tests at VT.
Study 2: RPE at VT, RPE at MLSS, and RPE at CP, in Cycling
Participants
Study 2 was approved by the Institutional Review Board, and we obtained written informed consent from all participants prior to data collection. Ten undergraduate kinesiology majors completed all aspects of Study Two testing, including 5 women (M age = 22 years, SD = 1; M height = 162 cm, SD = 6; M weight = 63 kg, SD = 7) and 5 men (M age = 22 years, SD = 2; M height = 178 cm, SD = 7; M weight = 78 kg, SD = 8). There were one Asian/Hispanic, two Black/Hispanic, one Black/non-Hispanic, two white/Hispanic, and four white/non-Hispanic participants. Participants were moderately fit, as indicated by a mean VO2max of 43 mL·kg−1·min−1 (SD = 6). Participants’ exercise habits were like those of the participants in Study 1, and instructions were the same as in Study 1. As in Study 1, the participants were naïve to the purpose of the study.
Procedures
Participants performed three incremental cycle ergometer tests to identify the VT, four to seven non-exhausting 30-minute cycle ergometer tests to determine MLSS, and four to seven cycle ergometer tests (exhaustion after 3 – 12 minutes) to calculate CP. Next, they performed 30 minutes of constant-power cycling exercise at each threshold intensity. RPE was elicited using the Borg 6 – 20 scale (Borg, 1970) during these tests, and the values after 8 minutes and after 30 minutes were recorded (consistent with the times that blood samples were obtained in the test that were used to determine MLSS, see below). The RPEs at each threshold were compared using a two-way ANOVA, and the homogeneity of RPE at each time point was described using the 95% CI. Participants performed an average of 16 tests, with at least 24 hours rest before each, and all testing was completed in 6 weeks.
Measures
Incremental Tests for VT Determination
Each of the 10 participants performed three incremental tests using the same methods as those described for the incremental cycling tests in Study 1 except that these tests were performed using a Lode Excalibur cycle ergometer (Groningen, Netherlands) and VO2 and other metabolic parameters were obtained using a MedGraphics (St Paul, MN USA) CardiO2 metabolic cart.
Tests for MLSS Determination
Participants performed a series of 30-minute constant-power tests using the same ergometer, seat height and handlebar positions, and pedaling cadence as for the incremental tests. VO2 and other metabolic parameters were obtained using the same equipment as for the incremental tests, and 30-second values were recorded after 8 minutes and in the final minute of each test. Every 30-minute test began with 4 minutes of seated rest to allow the participant to adjust to the mouthpiece and nose clip. RPE was elicited after ∼8 minutes of exercise and again prior to termination (but before blood sampling began, at each time point). Blood samples were obtained from a warmed fingertip after 8 minutes and after 29 minutes of exercise and analyzed in duplicate using identical Accusport Lactate analyzers (Hawthorne, NY, USA). This analyzer has been validated against bench chemistry reference methods (Bishop, 2001; Fell et al., 1998). The average of values obtained early in exercise was subtracted from the average of values obtained near the end of exercise to provide a ‘delta lactate’ value.
For the first 30-minute test, the work rate was halfway between the VT and peak power determined in the incremental tests. Work rates for the subsequent tests were selected to produce smaller and smaller delta lactate values, and testing continued until both the smallest increase and the smallest decrease were <1.0 mM. This required 4 – 7 (M = 5.6, SD = 1.0) tests. The smallest decrease in blood lactate concentration was in tests for which the average work rate was 140 (SD = 21) W; in these tests, the mean blood lactate concentration was 3.5 mM (SD = 0.8) at eight minutes and 3.2 mM (SD = 0.7) at 30 minutes, resulting in a mean decrease of 0.3 mM (SD = 0.1). The smallest increase was in tests at 146 W (SD = 3); in these tests, the mean blood lactate concentration was 3.7 mM (SD = 0.7) at 8 minutes and 4.0 mM (SD = 0.8) at 30 minutes, resulting in a mean increase of 0.3 mM (SD = 0.2). The power at MLSS was calculated using a method that was proposed and validated by Billat et al. (2004). This method is illustrated below, using mean delta lactate and work rate values:

Tests for CP Determination
Each participant performed constant-power, severe-intensity tests to exhaustion, using the same materials as for incremental tests. The work rate in the first predicting trial was the peak work rate (M = 235 W, SD = 40) from the incremental tests. Subsequent work rates were selected based on results in prior tests, with the goal of having a range of Texhaustion of ∼3 – 15 minutes. All trials began with 4 minutes of seated rest to allow the participant to adjust to the mouthpiece and nose clip.
Work rate and Texhaustion data were fit to three mathematically equivalent models (as shown below) using nonlinear (equation (2a)) or linear regression (equations (2b) and (2c)) in SPSSv22 to determine CP and W′ (which is a measure of the anaerobic capacity):


After a participant completed four tests, the values for CP and W′ were determined, and the CVs among the CP and W′ estimates were calculated. More tests were scheduled until the CVs for CP and W′ from the three equations were <1% and <2%, respectively (see Hill & Smith, 1994). This required 4 – 7 tests (M = 5.8, SD = 0.9). The CP value derived using equation (2a), which correctly (in the physiological sense) sets Texhaustion as the dependent variable (Hill, 1993), was selected a priori as the criterion measure.
Constant-Power Tests at VT, MLSS, and CP
Participants performed 30-minute exercise bouts at VT, at MLSS, and at CP. The data reported for the 30-minute test ‘at MLSS’ were actually the data from the 30-minute test used in the calculation of MLSS that was associated with the smallest decrease in blood lactate concentration (the smallest delta lactate); this work rate was M = 3 W (SD = 0) or M = 2% (SD = 1) below MLSS. VO2 and other metabolic parameters were obtained, and RPE was elicited after 8 minutes of exercise and prior to termination, as elaborated above in the description of the determination of MLSS. Each test was preceded by 4 minutes of seated rest.
Data Analysis
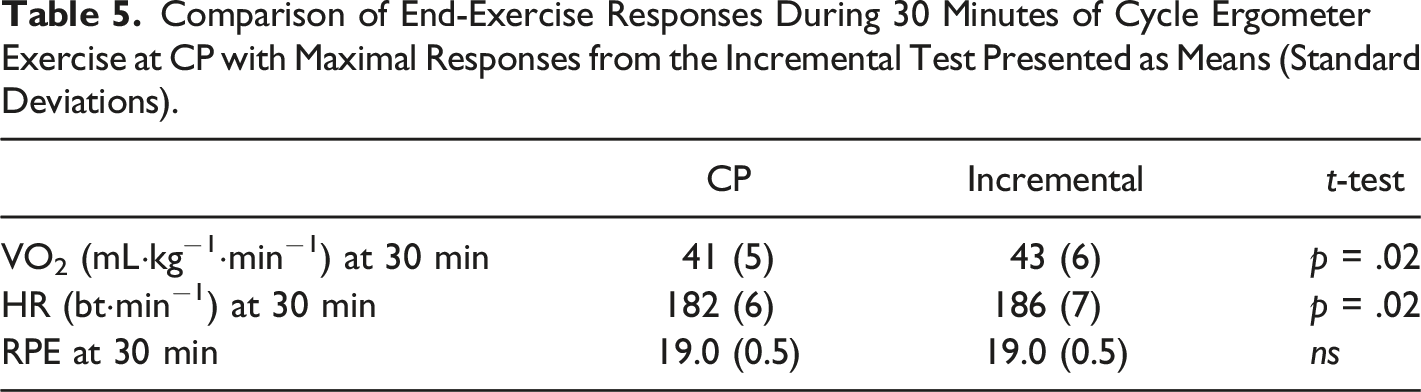
Prior to statistical analysis, we confirmed the normality of the data distributions using the Shapiro-Wilk test. Values for RPE and other responses in the constant-power cycle ergometer tests were compared using a two-way ANOVA (with repeated measures across Intensity [VT, MLSS, and CP] and Time [eight minutes and 30 minutes]). When there was a significant Time × Intensity interaction, post hoc comparisons were performed using paired-means t-tests to compare 8-minute and 30-minute responses at each threshold. For all analyses, we used the 0.05 probability level to denote statistical significance. For each ANOVA, data were tested for sphericity using Mauchly’s Test of Sphericity, so that, if necessary, results would be interpreted using a Greenhouse-Geisser correction. After inspection of the data revealed that HR, VO2, and RPE values at the end of the tests at CP were similar to values from the incremental tests, post hoc comparisons of these values were conducted using paired-means t-tests. To evaluate the homogeneity of RPE responses at three thresholds, the CV and 95% CI were calculated for RPE at each time point.
Results
Study One: RPE at VT in Running, Cycling, and Upper Body Exercise
Incremental Tests. Maximal Data Presented as Means (Standard Deviations).
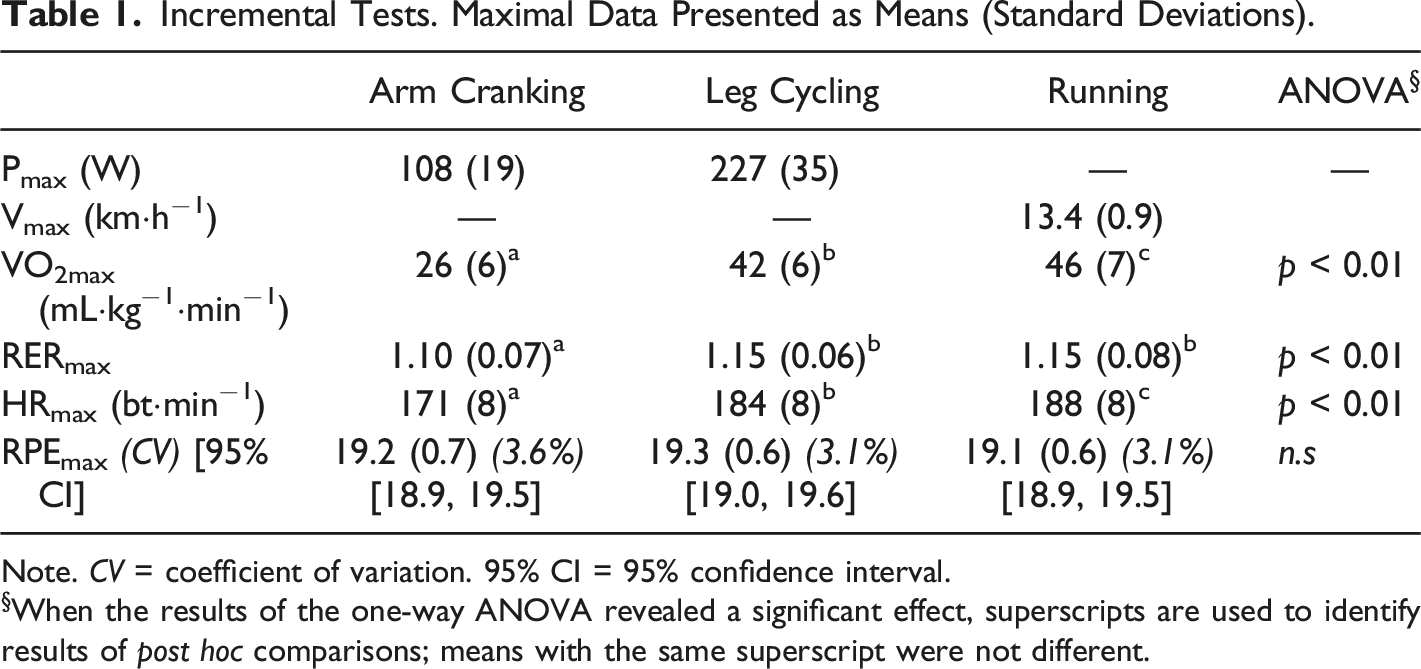
Note. CV = coefficient of variation. 95% CI = 95% confidence interval.
§When the results of the one-way ANOVA revealed a significant effect, superscripts are used to identify results of post hoc comparisons; means with the same superscript were not different.
Incremental Tests. Data at the Ventilatory Threshold Presented as Means (Standard Deviations).
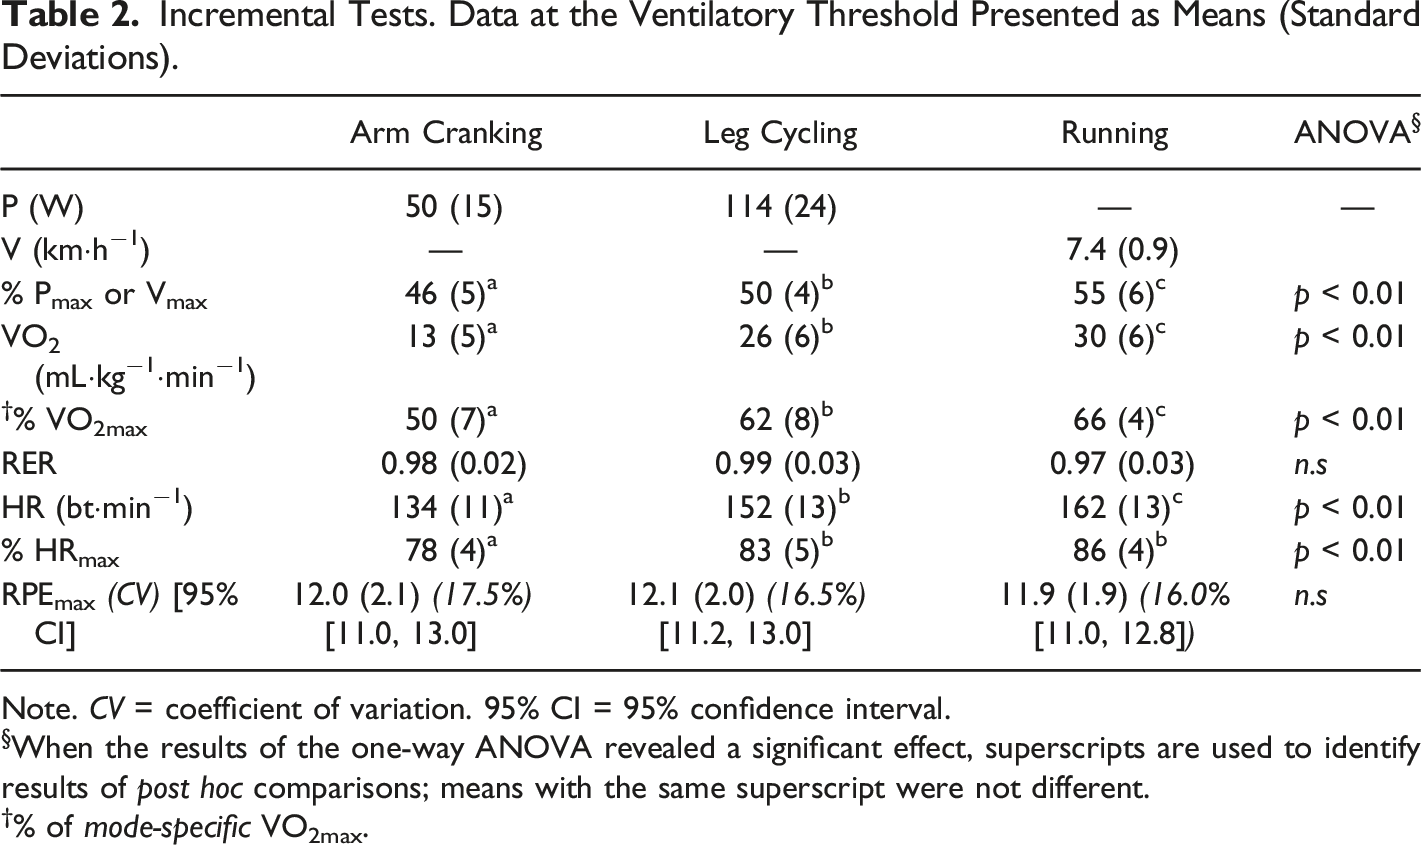
Note. CV = coefficient of variation. 95% CI = 95% confidence interval.
§When the results of the one-way ANOVA revealed a significant effect, superscripts are used to identify results of post hoc comparisons; means with the same superscript were not different.
†% of mode-specific VO2max.
Responses to 20 Minutes of Exercise at the Ventilatory Threshold Presented as Means (Standard Deviations).
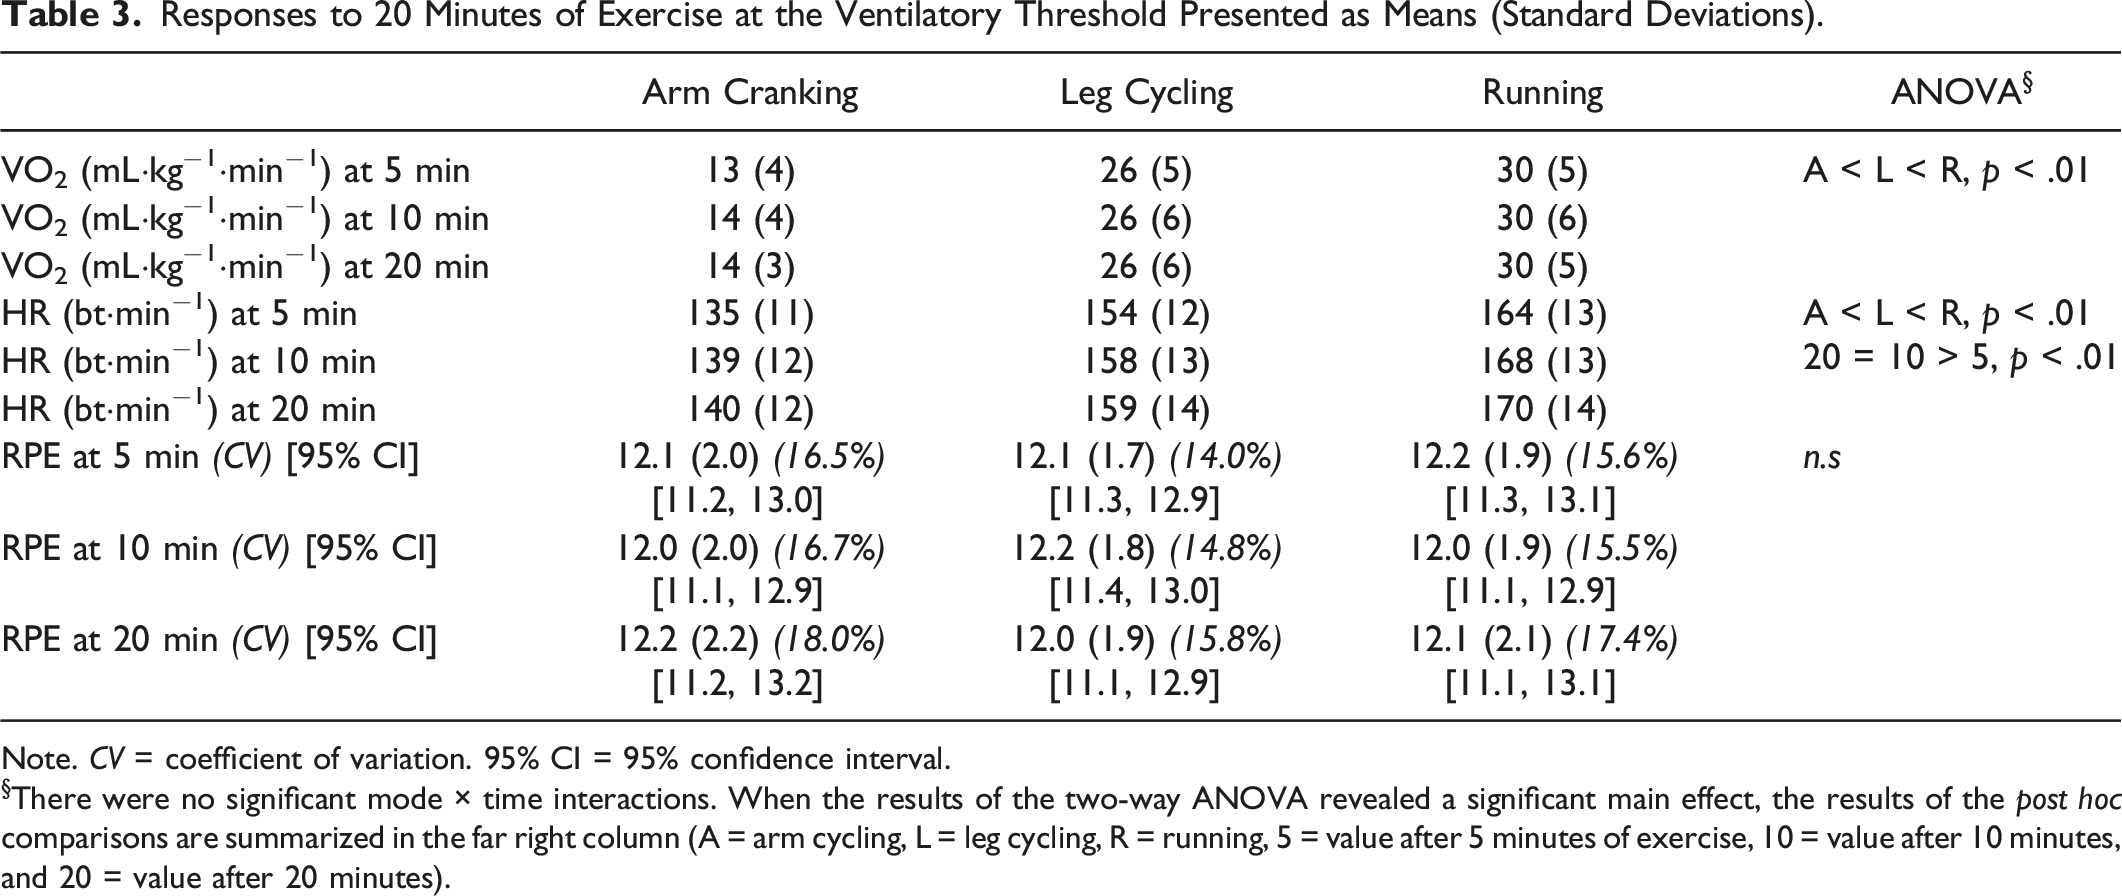
Note. CV = coefficient of variation. 95% CI = 95% confidence interval.
§There were no significant mode × time interactions. When the results of the two-way ANOVA revealed a significant main effect, the results of the post hoc comparisons are summarized in the far right column (A = arm cycling, L = leg cycling, R = running, 5 = value after 5 minutes of exercise, 10 = value after 10 minutes, and 20 = value after 20 minutes).
Study 2: RPE at VT, at MLSS, and at CP, All Using Cycling Exercise
The mean work rate at the VT was 101 W (SD = 21). This work rate was determined with precision, by using data from the three incremental tests.
The mean work rate associated with the MLSS was 143 W (SD = 22). It, too, was determined with precision, by extrapolation between work rates that elicited, on average, a decrease of 0.3 mM (SD = 0.1) and an increase of 0.3 mM (SD = 0.2). As noted above, the data from the exercise ‘at MLSS’ are actually the data from exercise at 140 W (SD = 21), which was M = 98% (SD = 1) of the actual MLSS. Like MLSS, this work rate lies within the heavy exercise intensity domain.
The mean CP derived using equation (2a) was 167 W (SD = 23) and the mean W′ was 16.0 kJ (SD = 2.9). Values for CP and W′ were calculated using three mathematically-equivalent equations (equations (2a), (2b), and (2c)). In all cases, the CV among a participant’s CP and W′ values from the three equations were <1 and <2%. The SEE associated with the CP and W′ values from equation (2a) averaged 2 W (SD = 2) (∼1.5% of the mean) and 0.7 kJ (SD = 0.4) (∼2.5% of the mean).
Responses During 30 Minutes of Cycle Ergometer Exercise at Three Different Threshold Intensities Presented as Means (Standard Deviations).
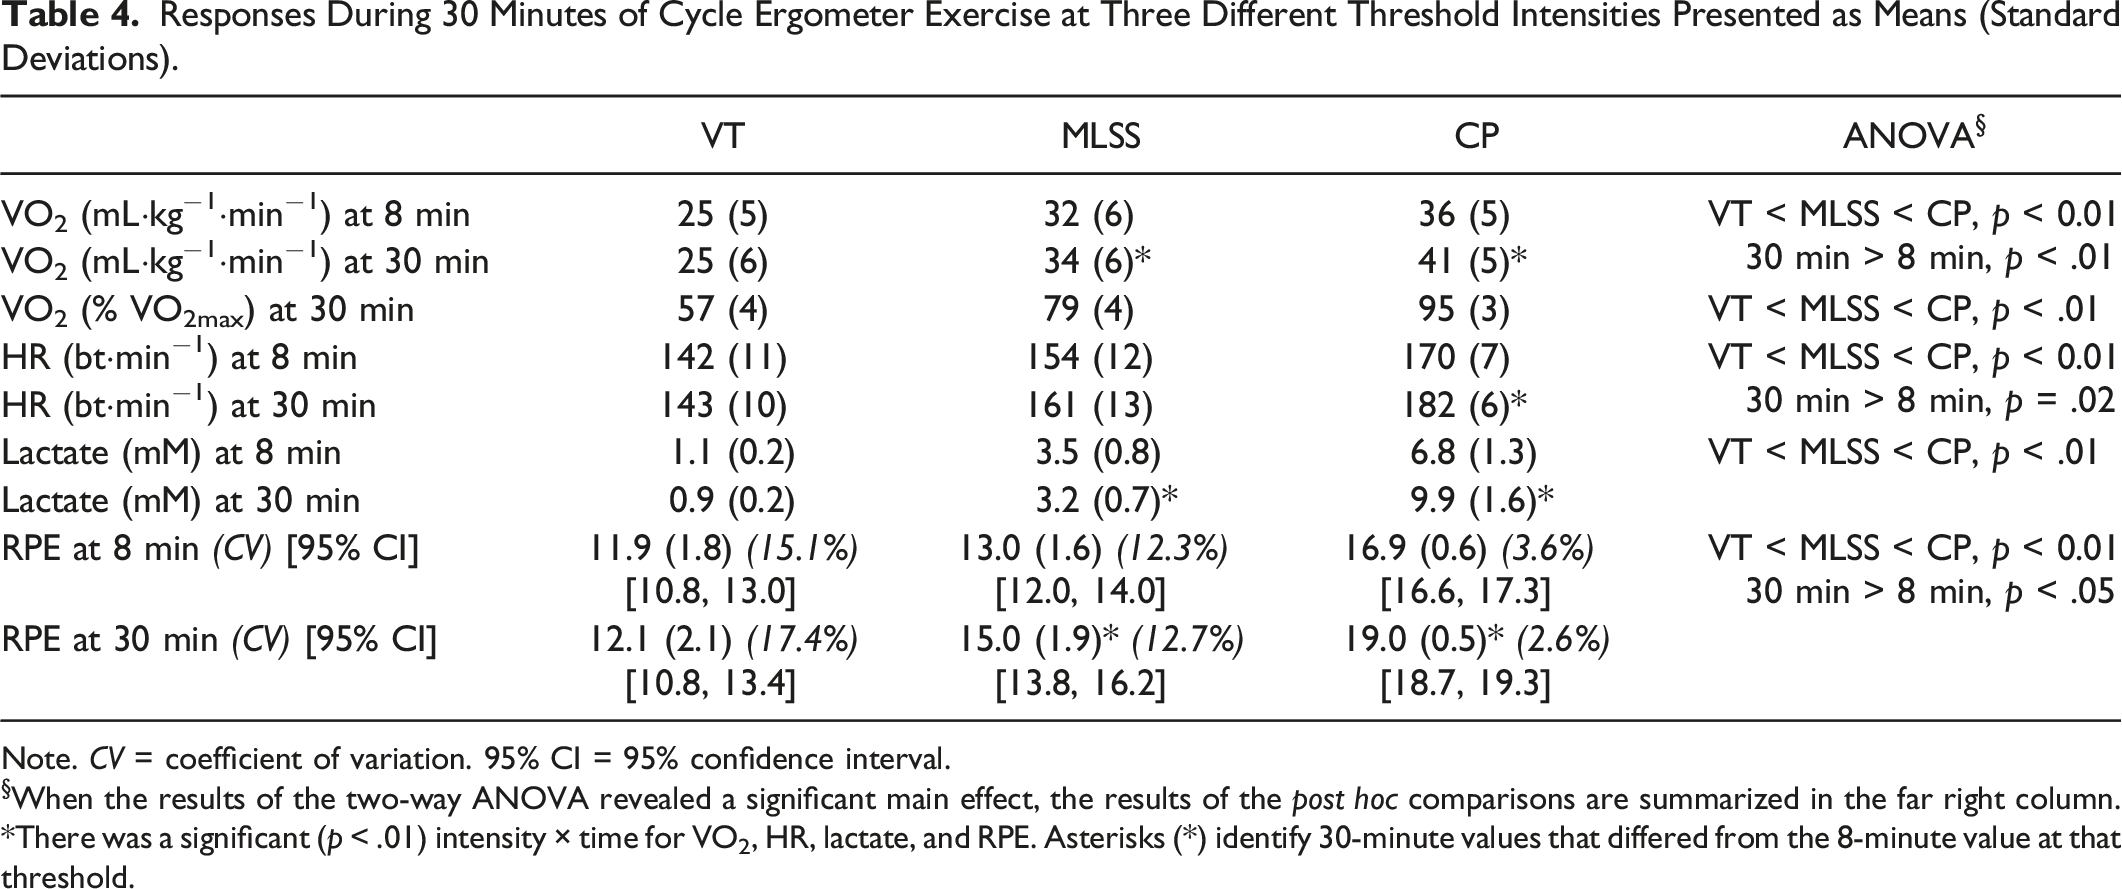
Note. CV = coefficient of variation. 95% CI = 95% confidence interval.
§When the results of the two-way ANOVA revealed a significant main effect, the results of the post hoc comparisons are summarized in the far right column.
*There was a significant (p < .01) intensity × time for VO2, HR, lactate, and RPE. Asterisks (*) identify 30-minute values that differed from the 8-minute value at that threshold.
Comparison of End-Exercise Responses During 30 Minutes of Cycle Ergometer Exercise at CP with Maximal Responses from the Incremental Test Presented as Means (Standard Deviations).
Discussion
The most important finding in Study 1 was that, despite marked disparity in VO2 and HR responses to running, cycling, and arm cranking at the VT, participants’ perceptual judgments of effort were not different. The exercise was perceived as ‘light’ in incremental and constant-power tests, regardless of exercise mode. In Study 1, the RPE scores at VT – both in the incremental tests and in the 20-minute constant-power tests – clustered closely around 12 on the Borg scale of RPE, and the CV among values at any time point was never more than 18.0%. Similar results were reported in Study 2 in which, during 30 minutes of cycle ergometer exercise at the VT, RPE scores also clustered around 12, and again the CV was low, never more than 17.4%. The invariability of perceptual responses at the VT (in both studies) supports the contention that the VT serves to anchor the perception of effort. In addition, these results support using RPE for prescribing moderate intensity exercise.
In both studies reported in this paper, RPE tracked with VO2, HR, and VE, but the relationships between RPE and these variables were different in running, cycling, and arm cranking; for example, the mean RPE at a VO2 of 26 mL·kg−1·min−1 was 19.2 (SD = 0.7) in upper body exercise, 12.1 (SD = 2.0) in cycling, and 10.4 (SD = 1.5) in running. As in previous studies (Dekerle et al., 2002; DeMello et al., 1987; Hill et al., 1987; 1989; Mihevic, 1981; Robertson, 1982; Sharkey, 1993; Zamunér et al., 2011), these data suggest that some combination of physiological responses at VT, and not the VO2, HR, VE, blood lactate concentration, or neuromuscular strain, alone, contributes to effort perception. And, indeed, it is the unique combination of responses that defines the VT, that anchors the perception of effort to the VT, and exercise at an intensity that is slightly above the VT, which engenders a disproportionate increase in VE relative to VO2 (or in VCO2 relative to VO2), will be perceived as ‘somewhat hard’ (Dekerle et al., 2002; DeMello et al., 1987; Hill et al., 1987; 1989; Mihevic, 1981; Robertson, 1982; Sharkey, 1993; Zamunér et al., 2011).
Importantly, Study 2 results revealed that, while RPE scores clustered around the perception of ‘light’ effort during exercise at the VT (CV ≤ 17.4% for every time point), they clustered more closely during exercise at MLSS (CV ≤ 12.7%) and even more closely during exercise at CP (CV ≤ 0.6%). These latter findings suggest that the confluence of physiological responses at MLSS and/or the confluence of physiological responses at CP may also anchor the perception of effort; these responses include cardiovascular, ventilatory, biochemical, and neuromuscular inputs. The findings also support the use of RPE for prescribing exercise at intensities that demarcate heavy, very heavy, and severe exercise intensity domains.
Methods Used in the Present Studies that Contributed to the Fidelity of Conclusions
Three Incremental Tests to Identify VT
Past investigators of perceived effort at VT generally have reported the RPE elicited during a single incremental test. The reported VT can be the work rate in the tests completed before the criterion response (e.g., breakaway in VE) was observed, meaning that the VT could be underestimated by the increment used in the tests (often up to 30 W). In contrast, in our two studies, because participants performed three incremental tests with each exercise mode, effective increments were 5 to 10 W, allowing for precise and accurate determination of VT, as the intensity above which there was a breakaway in ventilation, and the associated RPE.
Five or Six 30-minute Tests to Identify MLSS
The work rate at the MLSS has often been identified, based on data from three 30-minute tests, as the work rate associated with a ≤1.0 mM increase in blood lactate concentration. That is, in those studies, the work rate identified as the maximal lactate steady state, inevitably engenders an increase in blood lactate concentration, an increase that may be as great as 1.0 mM. This means that the use of this ‘short cut’ in many past studies has overestimated the value of MLSS (typically by ∼10 W, often more). Our Study 2 used 5 – 6 tests to interpolate between work rates that engendered a very small increase (∼0.3 mM) and a very small decrease (∼0.3 mM) in blood lactate concentration – not a work rate that, by its definition, does not elicit a steady state, but, rather, engenders an increase of up to 1.0 mM) (see Billat et al., 2004).
Five or Six Exhaustive Severe Intensity Tests to Calculate CP
It takes the results of several tests to exhaustion to accurately describe the relationship between power and Texhaustion and, thus, to generate values for CP and W′. To ensure the accuracy of the parameter values, values obtained using the three mathematically-equivalent models (i.e., Equations 2a, 2b, and 2c) must be similar (Hill & Smith, 1994). Yet, in many studies, CP is calculated from the results of three (sometimes only two) tests to exhaustion and in most studies, the reported value for CP has been derived using only one of the three equations, with no explanation for why that particular model was selected. Here, in Study 2, participants performed as many tests as needed until the until the CP and W′ from the three equations were very similar (CV among the three CP estimates was <1% of the mean CP value and CV among the three W′ estimates was <2% of the mean CP value. Hill and Smith (1994) validated criterion values of 10 and 5%, respectively. Every participant clearly met these criteria.
Inclusion of Prolonged Constant-Power Tests at the Thresholds
In practice, exercise training and performance usually involve prolonged exercise at a constant power, and not the short-duration, step-wise exercise seen in laboratory testing. Therefore, the use here of prolonged – 20 or 30 minute – exercise periods is useful for understanding relationships between physiological and perceptual responses and for evaluating the role of RPE in exercise description and prescription.
Study 1 – Inclusion of a Very ‘Different’ Exercise Challenge
Aerobic exercise training and testing usually involve activities like running, rowing, cycling, or swimming that activate large muscle mass. However, the use of activities that involve smaller muscle mass (e.g., upper body exercise) may be indicated in certain cases, such as in rehabilitation, specific sport training, or other circumstances. Study One in this research report is one of the few studies (e.g., Dekerle et al., 2002; Sharkey, 1993) to have compared RPE at VT across three exercise modes, and it is the first to have extended the analysis to prolonged exercise at the VT. These new data that can be applied to a variety of real-life exercise conditions.
RPE at VT
The VT is a threshold intensity that demarcates moderate and heavy exercise intensity domains (Whipp & Wasserman, 1972). The hypothesis that the VT is a physiological anchor in perception of effort is based on the rationale that responses to moderate intensity exercise (i.e., work rates at or below the VT) are markedly different from responses to heavy exercise (i.e., work rates above the VT) (Whipp & Wasserman, 1972). Heavy exercise involves an anaerobic contribution with the production of lactic acid, buffering of the lactic acid, and, consequently, an exaggerated ventilatory response (Whipp & Wasserman, 1972). However, it is important to note that, despite these differences, the responses to exercise at and above the VT are, in many ways, remarkably similar in that, in both moderate and heavy intensity exercise, a steady-state VO2 is attained at 55% of VO2max (in moderate exercise) and at 75% of VO2max (in heavy exercise), a VE steady state is attained at between 20% of VEmax (in moderate exercise) and at 50% of VEmax (in heavy exercise), and the pH is unaffected in both domains for at least the first ∼60 minutes of exercise.
Exercise at the VT is typically perceived as ‘light,’ and exercise at work rates above the VT is typically perceived as ‘somewhat hard’ or harder (Au et al., 2017; Elsangedy et al., 2013; Jabbour & Majed, 2018; Mahon et al., 1998; McAuliffe et al., 2018; Sharkey, 1993; Scherr et al., 2013). Exceptions to these generalizations appear in a series of studies conducted at the University of Georgia in the 1980s (DeMello et al., 1987; Hill et al., 1987; Purvis and Cureton, 1981; Prusaczyk et al., 1992) in which exercise at the VT was perceived as ‘somewhat hard’ to ‘hard.’ However, in those studies, the RPE at the VT may have been elicited during exercise at work rates above the VT. For example, when 2-minute stages were used in the incremental tests, the work rate identified as the VT was the work rate during the minute before the minute in which there was an increase in VE and other marker variables; and, in at least half the cases, the work rate identified as the VT (which should be the work rate above which there was an increase in VE) was actually the work rate at which there was an increase in VE. Since some of the work rates were actually above VT, this would explain the high RPE values and also the relatively large inter-individual variability in values (e.g., > 20% CV in the Hill et al., [1989] study). Consistent with recent results from different laboratories (Au et al., 2017; Elsangedy et al., 2013; Jabbour & Majed, 2018; McAuliffe et al., 2018; Scherr et al., 2013; Sharkey, 1993), participants in the presents studies perceived exercise at the VT as ‘light.’
Pertinent to Study 1 are those past studies in which the pattern for the effect of exercise mode on physiological responses at the VT was similar to the present results. Dekerle et al. (2002) reported that VO2 at the VT in cycling was double the value seen in arm cranking, and Wyatt (1999) reported that VO2 at the VT was more than 15% greater in running than in cycling, and 40% greater in cycling than in arm cranking. Differences were more modest when VO2 at the VT are expressed in relative terms (54% and 57% of VO2max in Dekerle et al., (2002) and 72% of VO2max in running and cycling, 46% of VO2max in arm cranking in Wyatt (1999)), because of the established effect of exercise mode on VO2max (Dekerle et al., 2002; Schneider et al., 2002), which is usually attributed to the amount of activated muscle mass (Weyand et al., 1993). Here, in Study 1, VO2 at the VT averaged 30 (SD = 6) mL·kg−1·min−1 for running, 26 (SD = 6) mL·kg−1·min−1 for cycling, and 13 (SD = 5) mL·kg−1·min−1 for arm cranking (or 66, 62, and 50% of the mode-specific VO2max).
Study 1 results are consistent with past findings of RPE at VT for different modes of exercise, although none of those investigators evaluated responses of the same participants to three different exercise modes. Pierce et al. (1990) and Bogdonis et al. (2021) reported similar RPE values to those reported here, even though the VT elicited 75% of VO2max for running and 60% for cycling. Hetzler et al. (1991) found similar RPE values at blood lactate concentrations that approximated the VT for both running and cycling, despite differences in metabolic and neuromuscular demands of the two exercise modes. Similarly, while the VT for arm cranking occurred at a lower percentage of VO2max in arm exercise than in leg exercise, RPE values at the VT were similar (Dekerle et al., 2002; Hutchinson et al., 2021; Schneider et al., 2002).
Past literature regarding the stability of RPE values at VT for different modes of exercise is particularly pertinent to the present study. It is also important to note that the RPE at VT was found to be unaffected by sex (DeMello et al., 1987; Purvis & Cureton, 1981; and Study One here), time of day (Hill et al., 1989), dietary status (Prusaczyk et al., 1992), state of training (Boutcher et al., 1989; Hill et al., 1987; Jabbour & Majed, 2018; Seip et al., 1991), and fitness level (Zamunér et al., 2011). Therefore, it should be possible to use RPE to prescribe exercise across modalities for a wide range of adults if the target exercise intensity is the VT. Support for this use of RPE is that RPE was consistent during 20 minutes of exercise at VT (Study 1) and during 30 minutes of exercise at that intensity (Study 2). Despite the apparent (but not statistically significant) increase in HR during the 20 minutes of exercise at VT, and despite the apparently higher HR in constant-power versus incremental tests, RPE was stable throughout the 20- or 30-minute exercises at VT and not different from the values elicited during incremental exercise. Thus, while exercise prescription by HR might be compromised during prolonged exercise, prescription by RPE is not.
RPE at MLSS
MLSS is a threshold intensity that demarcates heavy and very heavy exercise intensity domains (Hill et al., 2021). In the previous section, it was noted that a reason that RPE might be anchored at VT is that the VT separates intensity domains where there is (heavy), or is not (moderate), lactate accumulation. From a teleological standpoint, it would seem more important to perceive or differentiate between very heavy intensity exercise, with its non-steady-state responses, and heavy intensity exercise, with its steady-state responses, than to perceive or differentiate between moderate and heavy intensities. Hill et al.’s (2021) findings that the RPE during the first 10 minutes of exercise at MLSS (actually, at 99% of MLSS) was quite homogenous (M = 13, SD = 1, CV = 11%) within a population of 15 university students, and that it differed markedly (by an average of 1.7 [SD = 0.2] units) from RPE at 103% MLSS (M RPE = 14, SD = 1, CV = 10%) suggests that MLSS might also help anchor the perception of effort. Consistent with this possibility, Hutchinson et al. (2021) reported that RPE at the respiratory compensation point (which may be considered analogous with MLSS) was the same for both cycling and upper body exercise.
Here, in Study 2, RPE at MLSS was quite uniform across individuals and throughout the 30-minute exercise bout. Note that the RPE values reported herein as RPE at MLSS were those reported in the highest 30-minute trial that was associated with a decrease in blood lactate concentration from minute 8 to 30. The work rate in this trial was 3 W below MLSS (i.e., at 98% of MLSS) and, like MLSS, was at the very upper end of the heavy-intensity exercise domain. Exercise ‘at MLSS’ was quite uniformly perceived as ‘somewhat hard’ (CV = 12%), early on, and ‘hard’ (CV = 13%) late in the exercise. These results are consistent with the possibility that physiological responses at MLSS may be causally related to effort perception. The counter-argument is that, if responses at the MLSS are linked to effort perception, this is due to the unique responses associated with the threshold. While MLSS is the threshold intensity above which there is a non-steady in blood lactate concentration and a three- (rather than two-) phase VO2 response, the consequences of these differences may again be considered trivial, as both heavy and very heavy exercise elicit steady-state VO2 responses and no depletion of the anaerobic reserves. Instead, if one accepts the postulate that RPE is anchored by VT, then it is possible that the uniformity of RPE at MLSS may merely reflect the strong relationship between the work rates at VT and MLSS (r = 0.88, p < .01, in the present study).
RPE at CP
CP demarcates very heavy exercise from severe intensity exercise (Poole et al., 1990). There are few reports of RPE during exercise at CP and, unfortunately, the many different methods of calculating CP appear to generate divergent CP values, some sustainable for less than 20 minutes (Penteado et al., 2014) and others for over an hour (Hill & Smith, 1999). Regardless of its calculation, when exercise at CP is performed to exhaustion, end-exercise RPE values are near-maximal (Hill & Smith, 1999; Penteado et al., 2014).
In Study Two, during exercise at CP, RPE values were closely clustered and the exercise was perceived as ‘very hard’ (M RPE = 16.9, SD = 0.6, CV = 3.6%, 95% CI = 16.6 – 17.2) within minutes of its initiation and as ‘very very hard’ (M RPE = 19.0, SD = 0.5, CV = 2.6%, 95% CI = 18.8 – 19.2) after 30 minutes. If the homogeneity of RPE at VT supports the idea that the VT might provide pertinent physiological cues for effort perception, then the much closer clustering of RPE values during the exercise at CP certainly suggests that CP might (also) serve to anchor perception of effort. As noted above, if responses at CP are causally linked to effort perception, it is because of the unique confluence of responses associated with the threshold. Indeed, while exercise at CP is associated with a submaximal steady-state VO2 response, exercise slightly above CP elicits immediate and inexorable decreases in pH, complete depletion of the anaerobic reserves, and the attainment of VO2max. Arguably, these differences are not trivial. However, there are three counter-arguments regarding the possible role of CP in the perception of effort. First, the homogeneity of RPE responses at CP – especially as exhaustion is approached – might simply be attributed to a ceiling effect (values cannot exceed 20). However, neither the 8-minute nor end-exercise values were maximal. Second, one reason that the measure of homogeneity – CV – is smaller during exercise at CP is that the denominator used in its calculation (the mean RPE) is larger, meaning that a given variability (a given SD) will result in a smaller CV for the RPE at CP. However, despite this effect of differences in the denominator, the actual RPE variability, as indicated by the SD, was considerably smaller at CP. Third, from a teleological perspective, it might seem surprising that a scale would be anchored at its highest point, even if there is vital survival importance to the body’s ‘knowing’ that an intensity will tax its aerobic and anaerobic systems to the max. However, as noted above, RPE at CP was not maximal and there is undeniable importance to being able to differentiate between heavy and severe exercise.
Limitations and Directions for Future Research
There were 27 research participants in Study 1, but an obvious limitation in Study 2 was our reliance on only 10 participants. This sample size was due, in part, to the demanding nature of the study. In order to ensure accurate and precise determination of the three exercise thresholds, participants were required to perform three incremental tests to exhaustion, five to six 30-minute heavy or very heavy intensity tests, 5 to 6 severe intensity tests to exhaustion, a 30-minute test at the VT, and a 30-minute test at CP. In addition to the heavy demands on participants, Study Two was an exploratory test of the possibility that either MLSS or CP might be an ‘anchor’ in the perception of effort. Not to ignore the evidence from this study of the possible importance of MLSS but, given the strong indication that responses at CP may be important in the translation of physiological responses into perceptual responses, future studies might focus on exercise at CP and peri-CP intensities. Additionally, these studies might well include consideration of psychological factors and measures of neuromuscular responses associated with the various thresholds, including motor unit recruitment, and greater emphasis on biochemical responses, including blood lactate concentration, which provide additional information about metabolic demands.
Future investigators might also address the possibilities that age, fitness, and/or health status might impact the relationship between responses at CP and the RPE at CP. In addition, just as the relationship between RPE and physiological responses at VT has been challenged by training and time-of-day differences, future investigators might test the robustness of the relationship between RPE and physiological responses at CP in the faces of differences in age, certain psychological traits (e.g., locus of control), training status, time of day, and/or sleep status, among other possibilities.
In the present two studies, the thresholds identified the upper boundaries of the moderate domain (VT), the heavy domain (MLSS), and the very heavy domain (CP). We assumed that, if the moderate intensity (exercise at VT) exercise feels ‘light’ then heavy intensity will feel ‘(somewhat) hard’. Similarly, if very heavy intensity exercise (exercise at CP) feels ‘very hard’ from the onset, then the first minutes of severe intensity exercise (exercise at intensities above CP) will feel ‘very very hard’. Perhaps a more meaningful research design would involve determining the RPE at intensities slightly above these thresholds: (a) at the lower end of the heavy domain (e.g., at VT + 5 W) rather than at the upper end of the moderate domain (VT); (b) at the lower end of the very heavy domain (e.g., at MLSS +5 W) rather than at the upper end of the heavy domain (MLSS); and (c) at the lower end of the severe domain (e.g., at CP + 5 W) rather than at the upper end of the very heavy domain (CP).
While the results of these studies suggest that exercise at a given threshold intensity elicits a given RPE, there is some inter-individual variability, the genesis of which cannot be addressed in this study. An important question yet to be answered is, when an individual is challenged to exercise at that given RPE, will s/he choose that same intensity? If exercise is to be prescribed using RPE, it is necessary that this be the case.
Conclusion
An important finding in this study was that RPE at the VT was unaffected by exercise mode, both in incremental exercise and in 20 or 30 minutes of exercise at the threshold. The RPE at VT was stable across exercise modes, despite differences in the metabolic profiles in the different modes. These findings provide strong support for the contention that the VT may serve as an anchor point for the perception of effort from central factors. If homogeneity of RPE responses at a given threshold intensity indicates that physiological responses at that threshold might contribute to the perception of effort, then Study Two results suggest that MLSS might serve as an anchor in the perception of effort and even more strongly support the theory that CP also serves in this role. The confluence of physiological responses at CP is responsible for the perception, within minutes of initiating of exercise, that the exercise is ‘very hard,’ but tolerable for 30 minutes or more. These results also mean that RPE at VT can be used to help prescribe exercise across many exercise modes and they support the use of RPE for prescription of exercise intensity at VT, at MLSS, and at CP.
The results of our two studies confirm that the RPE at VT is stable across exercise intensities. Practically, this means that – if the VT is considered an optimal training intensity – the RPE at VT determined in one exercise mode can be used to prescribe exercise in another mode. To a lesser degree, these results support using an RPE of 12 – prescribing exercise so that it feels ‘light’ and not quite ‘somewhat hard’ when the target intensity is VT –for running, cycling, or arm cranking exercise. From a theoretical perspective, these results support assertions that it is the confluence of responses at the VT (not the VO2 or the VE or other some other response but, rather, the combination of cardiorespiratory, biochemical, and neuromuscular inputs) that contributes to effort perception and, specifically, to whether the exercise is perceived as ‘(somewhat) hard’ or not. The results of Study Two suggest that the confluence of physiological responses at other thresholds may play a similar role. Notably, the very close clustering of RPE values during 30 minutes of exercise at CP suggests that the confluence of responses led quickly to the interpretative that the exercise is ‘very hard’ and that perception increased y to ‘very very hard’ within 30 minutes. Similarly, during the first minutes of performing severe intensity exercise, the sensation that the exercise is very hard (RPE >17) would provide a perceptual warning that the exercise will be associated with a decreasing pH, depletion of anaerobic reserves, and a tolerable duration of less than 60 minutes, just as the perception of effort itself may be a factor in determining the tolerable duration of exercise at any given intensity.
Footnotes
Declaration of Conflicting Interests
The author(s) declared no potential conflicts of interest with respect to the research, authorship, and/or publication of this article.
Funding
The author(s) received no financial support for the research, authorship, and/or publication of this article.