
Abstract
Our primary objective in this study was to investigate the offensive strategies employed in the attack phase of men’s volleyball, specifically focusing on side-out as stratified by the type of confrontation that was determined by the opponent’s team performance. We analyzed 5524 attacking actions during 22 games of the 12 teams that participated in the Volleyball Men’s Superliga (season 2021–2022). Based on their final rankings in the championship, we classified these teams into three tiers: high-performance, intermediate-performance, and low-performance. Subsequently, we examined the dynamics of these matches using Social Network Analysis. We found that the opponent teams' performance levels did not influence the game dynamics. Notably, the eigenvector values were prominently higher for Attack Zones 2 and 4, wherein the middle-blocker jumped to attack close to the setter across all networks. Thus, setters opted for traditional and low-risk strategies to minimize errors, disregarding available information about the skill level of the opposing team, making their offensive tactics predictable.
Introduction
Match analysis, a branch of sports performance analysis, enables an understanding of team and player performance as influenced by game context and complexity (Araújo et al., 2017). This performance analysis facilitates the recognition of players' perceptions of possible actions, which, based on situational constraints, influence player performances and allow them to interpret and alter game patterns by adjusting to the competitive context (Gréhaigne et al., 2001). As part of this analysis, comprehending the factors that influence both individual and collective decisions, capable of altering the game’s pattern, becomes imperative. Armed with this information, coaches and players could potentially enhance team performance with greater effectiveness (Araújo & Davids, 2018; Araújo et al., 2006).
In volleyball, match analysis may be based on Game Complexes, with Complex I (KI) consisting of reception, setting, and attack, as the main focus of investigation (Hurst et al., 2016; Laporta et al., 2018a; Loureiro et al., 2017). From this perspective, analysts frequently observe a recurrent game pattern in the side-out phase of high-level volleyball (a successful point scored by the receiving team during the opponent’s serve) (Costa et al., 2016, 2016, 2016; Rocha et al., 2022). The side-out phase is characterized by receptions that enable an organized attack, setting conditions that adapt to the positions of attackers and blockers, and attacks against less structured blocks (Costa et al., 2017a, 2018; Dutra et al., 2021; Rocha et al., 2021, 2022).
Despite the existence of a team’s recurring and systematic sequence of actions, strategies, and interactions, changes occur that depend on the balance between the teams’ skill levels (Drikos et al., 2022). In matches between teams of similar performance levels, the teams may opt for a less risky approach by focusing their attacks primarily on court positions 2 and 4, especially as the set nears its conclusion (Conti et al., 2018; Costa et al., 2017b). Thus, teams may adopt a more cautious strategy to raise their chances of winning in closely contested matches (Drikos et al., 2022; Marcelino et al., 2011). Moreover, in these balanced games, teams may adopt another cautious strategy in which they engage in more compact blocks, either when there is a significant point difference in the match or after receptions that reveal the setter’s intention (Marcelino, et al., 2011; Marcelino, et al., 2012). In unbalanced confrontations between teams with different performance levels, high-performance teams may take more risks, as exemplified by their use of faster settings at court positions 3 and 4, and their promotion of powerful attacks even in off-system offensive conditions (Costa et al., 2017b; García-de-Alcaraz & Marcelino, 2017). Furthermore, regardless of whether team abilities are balanced, certain team behavior patterns are expected. In one such predictable pattern, the middle blocker is expected to jump near the setter to perform an attack; in another, the attack would be related to the position where the setting is performed (Rocha et al., 2021).
It is noteworthy that past investigators primarily utilized inferential or predictive statistical analyses within match analysis, focusing on game events, rather than the interactions and (dyadic) relationships among team constituents within intricate systems (Silva et al., 2016). This type of statistical analysis does not foster a holistic understanding of dynamic interactions in the game context (Laporta et al., 2019); Moreover, new information might arise from focused analyses of specific game scenarios, such as the side-out, given its importance in the outcome of a match (Rocha et al., 2023). From this perspective, contemporary researchers have sought to analyze sports team performance through Social Network Analysis (SNA) (Laporta et al., 2018a). SNA provides different avenues for understanding game flow, facilitating interpretation through the interactions between players and game procedures to consider and weigh all variables in the network (Wäsche et al., 2017; Wasserman & Faust, 1994).
In this manner, SNA enables the visualizing and mapping player interactions within or between teams to better identify patterns of communication and collaboration and provide a more comprehensive view of game dynamics. A specific analysis of interest might be the influence of the performance level of the opposing team on the setting location. Through SNA, it is possible to identify which players have central roles or strategic positions within the interactions network, and how this varies according to the two teams’ ability levels. Either key players or the setting location can have a significant impact on the performance and outcome of the game.
The impact of balanced or unbalanced teams on the side-out pattern in high-level volleyball has yet to be investigated using SNA. However, such an analysis holds the potential to uncover whether the cautious or aggressive strategies previously identified in teams during balanced and unbalanced matches remain consistent, or whether new factors come to light, thereby broadening or revising our understanding based on previous findings.
Our objective was to analyze offensive strategies within Complex I (KI), focusing on organized attack conditions (ideal setting conditions) through the application of SNA. We investigated key game variables within a comprehensive network and explored whether the opponent team’s relative skill level would influence the attacking team’s game patterns during side-out situations. Our hypotheses were as follows: (a) in balanced games between teams of similar performance, we anticipated observing the highest eigenvector values for settings in court zones 2 and 4, occurring both in the middle and at the end of the set; (b) in unbalanced games, we expected the eigenvector values to be elevated for settings in court zones 3 and 2; (c) irrespective of the teams' balanced or unbalanced ability levels, we predicted the eigenvector values to be higher for the middle-blocker’s jump attack near (in front and behind) the setter, with the setter’s initial position remaining consistent.
Method
Participant Data Sample
The data for these analyses comprised player actions in 5554 attacks across 22 games, involving 12 teams that competed in the 21-22 Brazilian Men’s Superliga. Each team played 11 games at home and 11 away games (Hurst et al., 2016). Notably, the Brazilian Men’s Superliga is a premier volleyball competition in Brazil, and at the time of data collection, Brazil was ranked among the world’s top four teams, as confirmed by public records from FIVB (2021).
Variables Analyzed
We categorized the teams’ performance levels based on their standings at the conclusion of the championship. Teams finishing between the 1st and 4th positions were designated as high performance (HI), those ending between the 5th and 8th positions were classified as intermediate performance (INT), and those concluding between the 9th and 12th positions were categorized as low performance (LOW).
For set segments, we divided each set into specific moments: the beginning from 0 to 8 points (INI), the middle from 9 to 16 points (MED), and the end from 17 points to the conclusion of the set (FIN). In the case of the 5th set, we defined the INI as ranging from 0 to 5 points, the MED from 6 to 10 points, and the FIN from the 11th point until the end of the set.
To examine the distribution of sets by teams, we evaluated settings for the following zones: 4 (SETT-P4), 3 (SETT-P3), 2 (SETT-P2), 1 (SETT-P1), and 6 (SETT-P6). Additionally, we analyzed instances where the ball was attacked by the setter on the second team touch, which encompasses setter dumps (2SETT).
For the location of the middle-blocker hitter attack, we considered the place where the middle-blocker hitter jumped to carry out the attack: (a) ahead and close to the setter (TF); (b) behind and close to the setter (TC); or (c) ahead and away from the setter (T7) (Costa et al., 2016; Fellingham, et al., 2013).
We also factored in the number of blockers to examine the impact of the distribution on subsequent play procedures. The block configurations were categorized as follows: (a) triple [1 × 3], (b) broken triple [1 × (2 + 1)], (c) double [1 × 2], (d) broken double [1 × (1 + 1)], (e) single [1 × 1], and (f) no block by merit of the setter [1 × 0] (Rocha et al., 2020a).
For the attack effect, we considered (a) an error to be when the attacker struck the ball into the net, out of bounds, or violated the regulations, (b) a blocked attack to be when the attacker failed due to an opponent’s block, (c) continuity to be when the attack did not result in a final action and allowed a counter-attack, and (d) a point to be when the attack resulted in a direct point after the ball touched the ground on the opponent’s side or was deflected by the opponent team blocking it off the court (Marcelino et al., 2011).
Lastly, we analyzed the initial position of the setter at the beginning of the rally, by identifying the configuration of the net as zone 1 (P1), zone 2 (P2), zone 3 (P3), zone 4 (P4), zone 5 (P5), and zone 6 (P6). From the setter’s initial position, it was possible to understand the offensive organization. For example, when the setter was in P1, there were three attackers at the net, but the opposite hitter was in P4 and the outsider-hitter was in P2. On the other hand, when the setter was in P2, there were two attackers at the net and the outsider hitter was in P5.
Data Collection
All matches were filmed with a view from above the court, using a high-definition (1080p) Sony® camera positioned approximately 7–9 m behind the court bottom line, 5 m above ground level. All footage was provided by the technical staff of the Brazilian Volleyball Team. Three physical education professionals with more than five years of experience as volleyball performance analysts conducted the analyses used in this study. For reliability testing, 30% of all actions were reanalyzed, which is above the 10% reference value (Tabachnick & Fidell, 2013). Cohen’s Kappa values for intra-observer reliability ranged between .93 and .99 with respective standard errors of .03 and .01. The Inter-observer value was 1 with a standard error equal to 0. These values exceeded the recommended value of .75 (Fleiss et al., 2013).
Data Analyses
The data were recorded in a Microsoft Excel 2015 spreadsheet and IBM SPSS (Statistical Package for the Social Sciences) software; specifically, Version 23 was utilized for data quality control and exploratory statistical analyses. For the SNA, we employed Gephi .8.2-beta for Windows (Version 10.10.3, France). We opted for SNA to explore the connectivity and specific relationships among all setting variables, allowing for a comprehensive overview. The SNA produced three distinct networks based on performance levels: (a) for games involving high-performance teams against high, intermediate, and low-performance teams; (b) for games of intermediate-performance teams against the same range of performance; and (c) for games featuring low-performance teams against different performance levels. In our analysis, we utilized eigenvector centrality as the index measure. This measure is grounded on the concept that a node exhibits higher centrality when connected to other nodes that are also more central (Bonacich, 2007; Borgatti, 2005). Thus, a node’s centrality isn’t solely based on the number of adjacent nodes but also on its interaction characteristics (Hurst et al., 2016).”
The node size and edge thickness were adjusted to visually represent the magnitude of the eigenvector measure. This manipulation allowed us to convey the significance of the variables based on the centrality of the eigenvector. As a result, the node size was indicative of the variable’s centrality. Variables that were directly or simultaneously related received a connection, and the centrality of the eigenvector also factored in the weight of the node’s indirect connections (Laporta et al., 2018a; 2018b). For arranging the network layout, we employed the Fruchterman layout with the Reingold distribution (area 100,000). This arrangement positioned nodes with the highest eigenvector centrality at the center of each subnetwork, following the methodology proposed by Newman (2006).
Results
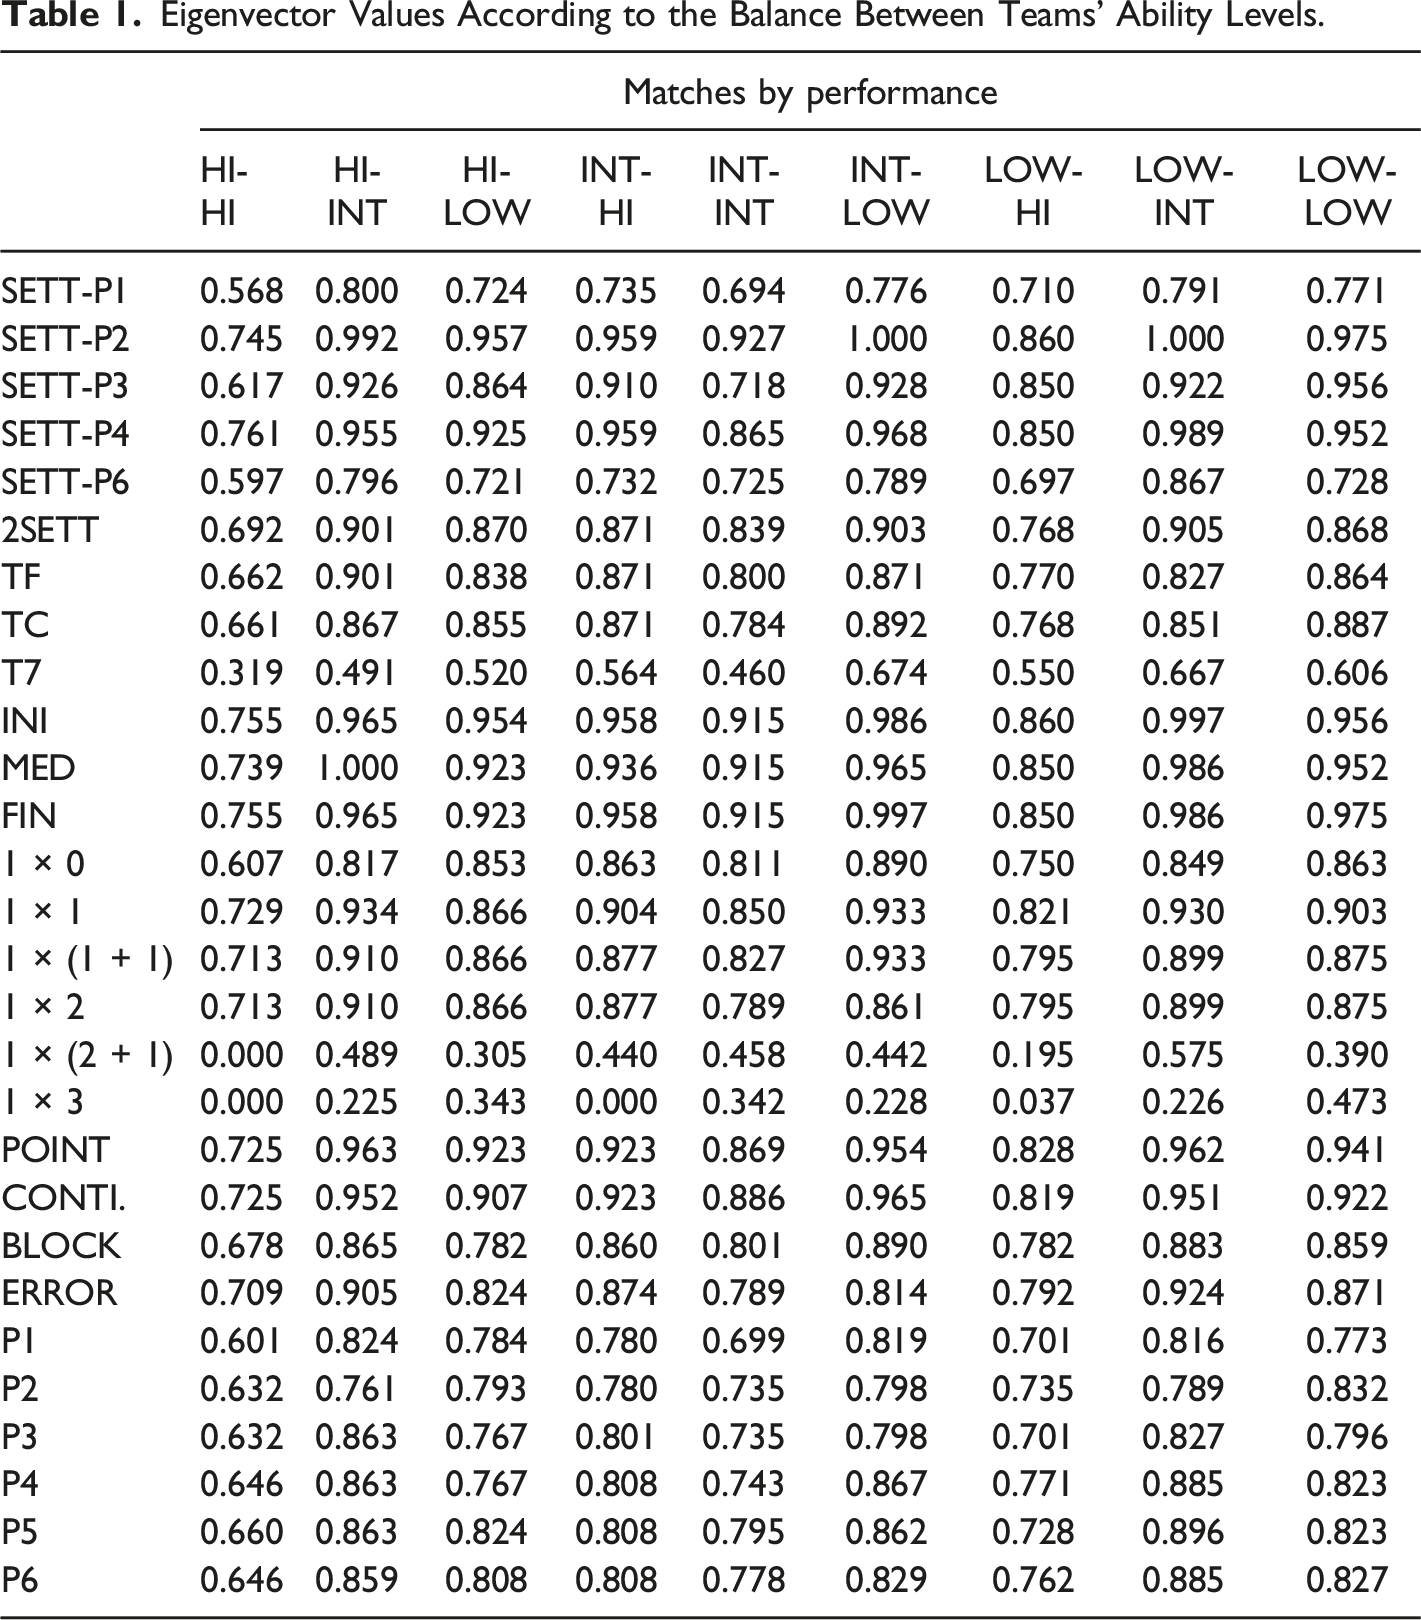
Eigenvector Values According to the Balance Between Teams’ Ability Levels.
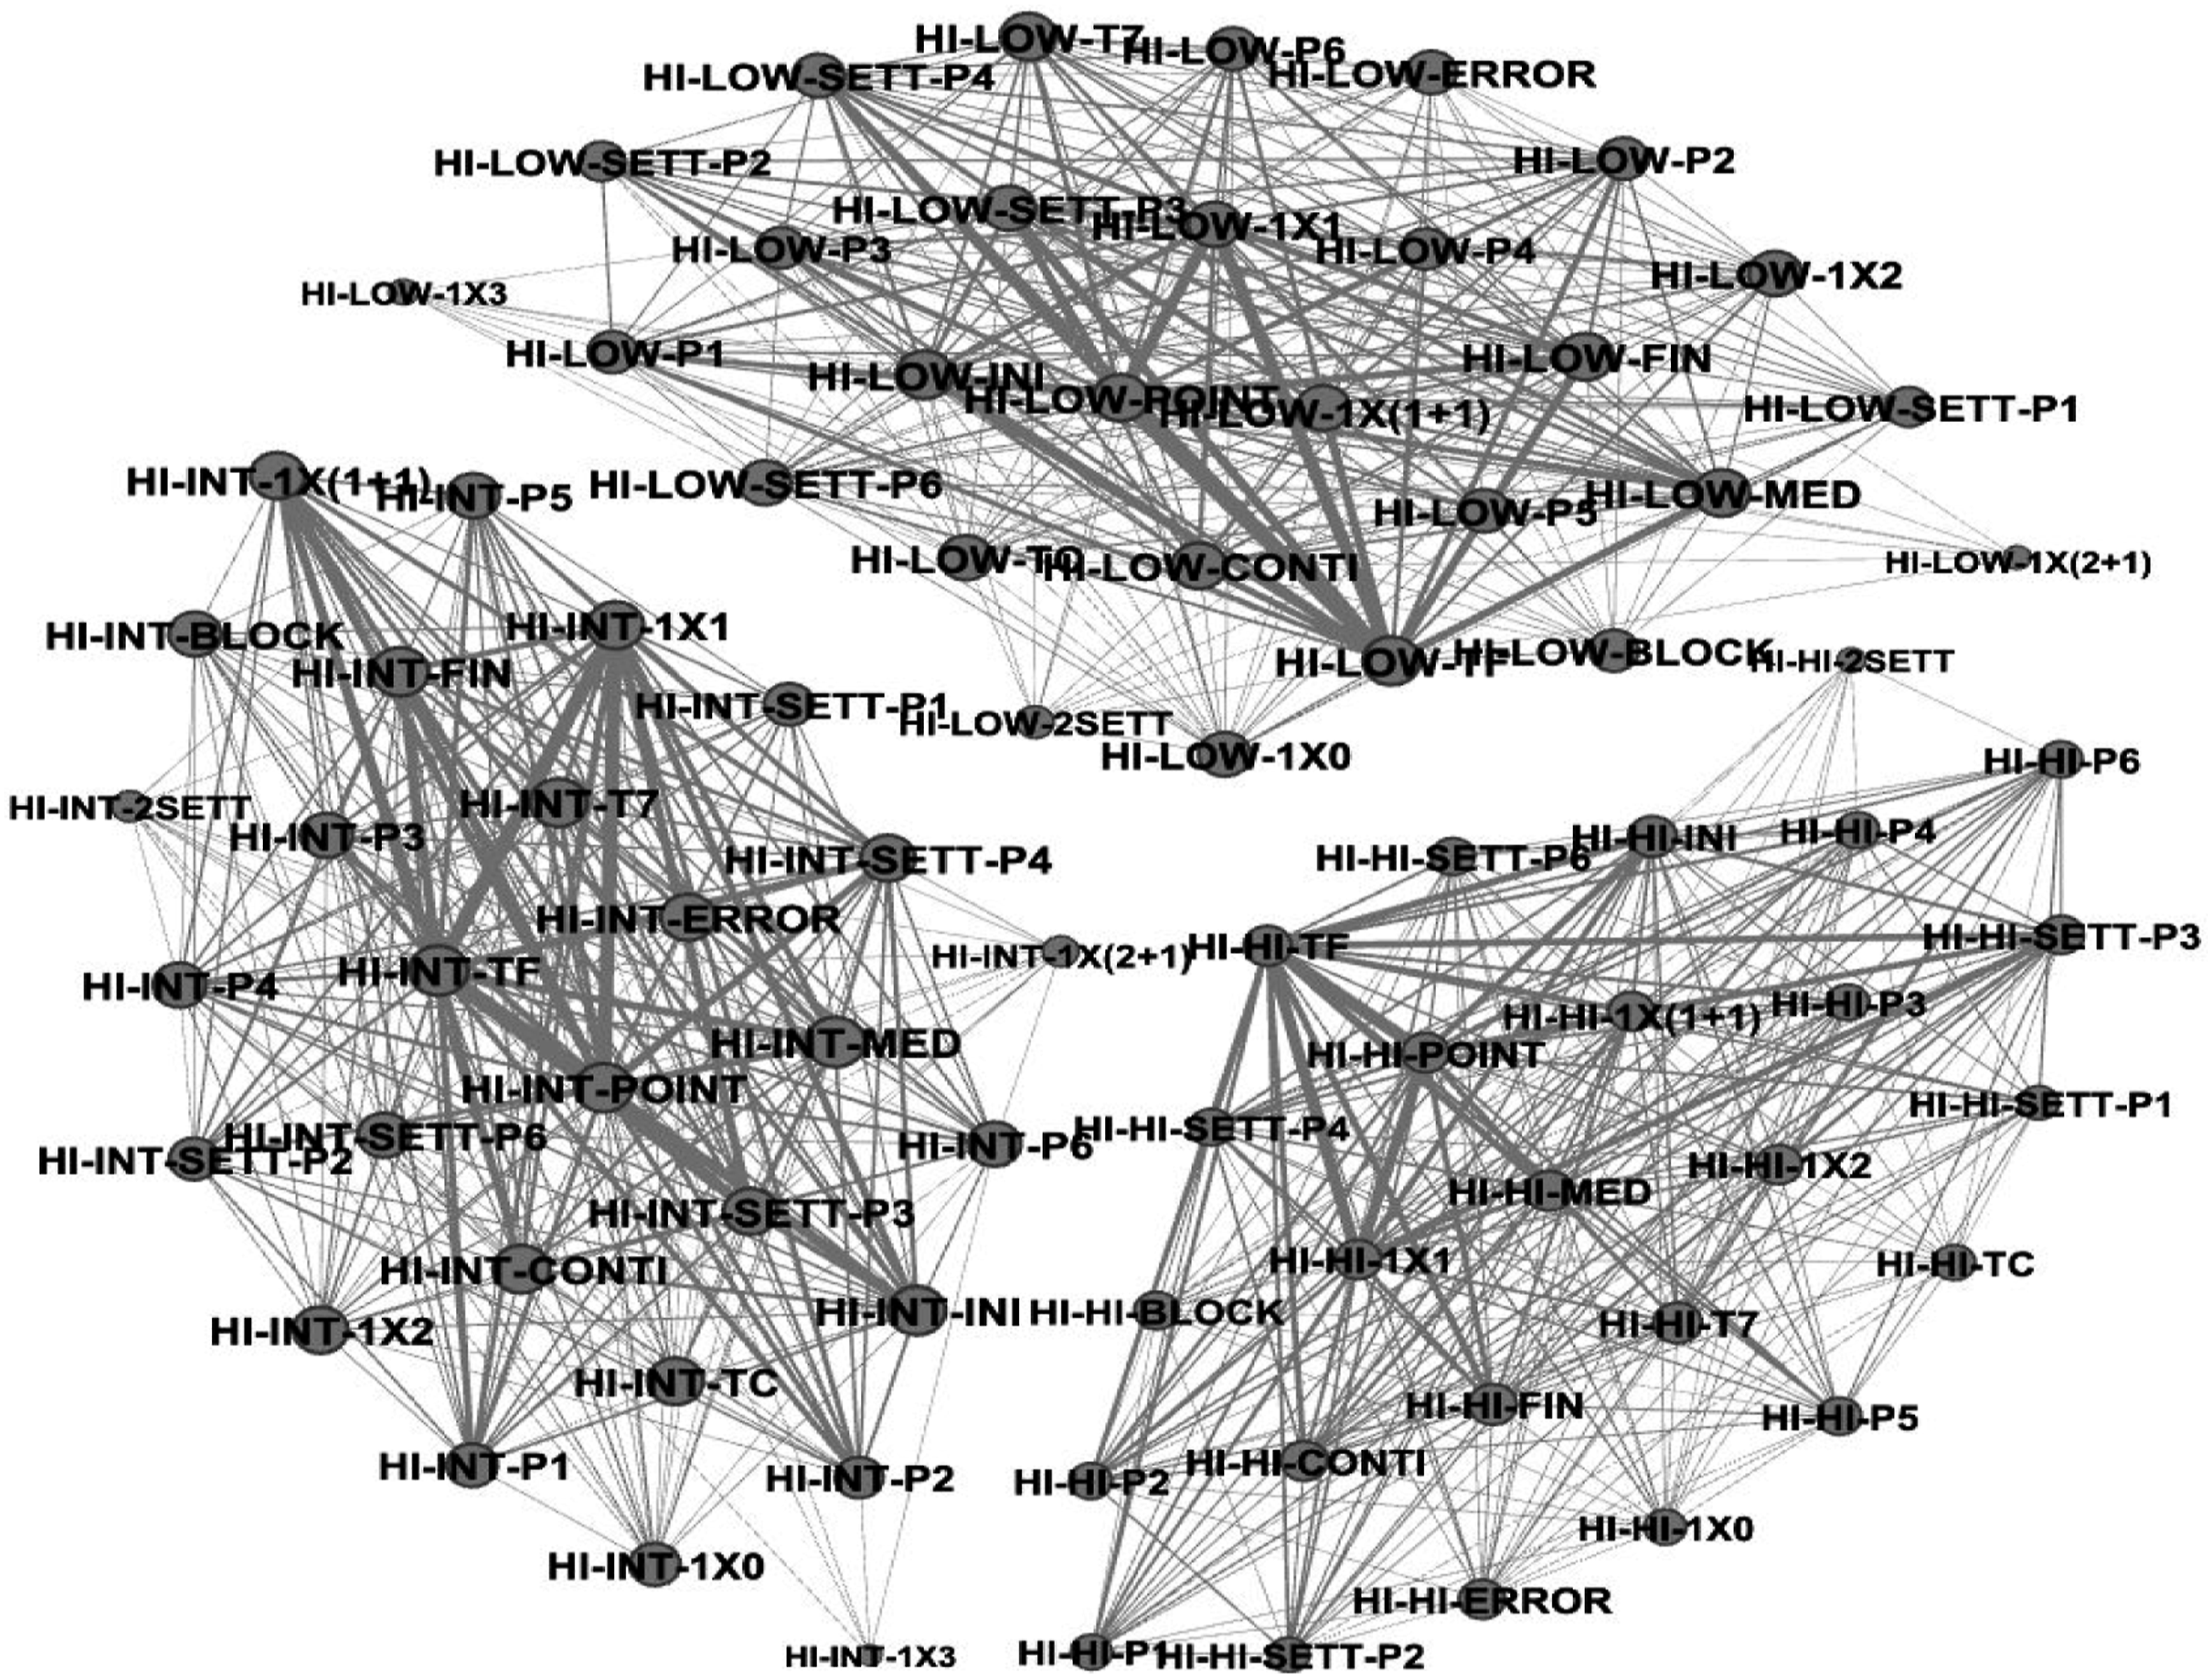
Network Analysis of Matches Performed by High Performance Teams.
When considering the matches performed by teams with intermediate performance (Figure 2), we observed that the highest eigenvector values were: (a) - when a team played against high performance teams, setting was zone 2 (SETT-P2 = .959) and 4 (SETT-P4 = .959), the middle-blocker jumped close to the setter in front (TF = .871) and behind (TC = .871), at the beginning (INI = .958) and at the end of the set (FIN = .958), there was a simple block (1 × 1 = .904), point (POINT = .923) and continuity of attack (CONTI = .923) and the setter was in starting positions 4 (P4 = .808), 5 (P5 = .808) and 6 (P6 = .808); (b) when a team played against intermediate performance teams, setting was zone 2 (SETT-P2 = .927), the middle-blocker jumped forward and close to the setter (TF = .800), at all times of the set (INI = .915, MED = .915 and FIN = .915), there was a simple block (1 × 1 = .850), attack continuity efficacy (CONTI = .886) and setter was in initial position 5 (P5 = .795); and (c) when a team played against low performing teams, settings were in zone 2 (SETT-P2 = 1.00), the middle-blocker jumped behind and close to the setter (TC = .892), at the end of the set (INI = .997), there were single blocks (1 × 1 = .933), and broken double blocks (1 × [1 + 1])1 = .933), attack continuity efficacy (CONTI = .965) and setter in was starting position 4 (P4 = .867). Network Analysis of Matches Performed by Intermediate Performance Teams.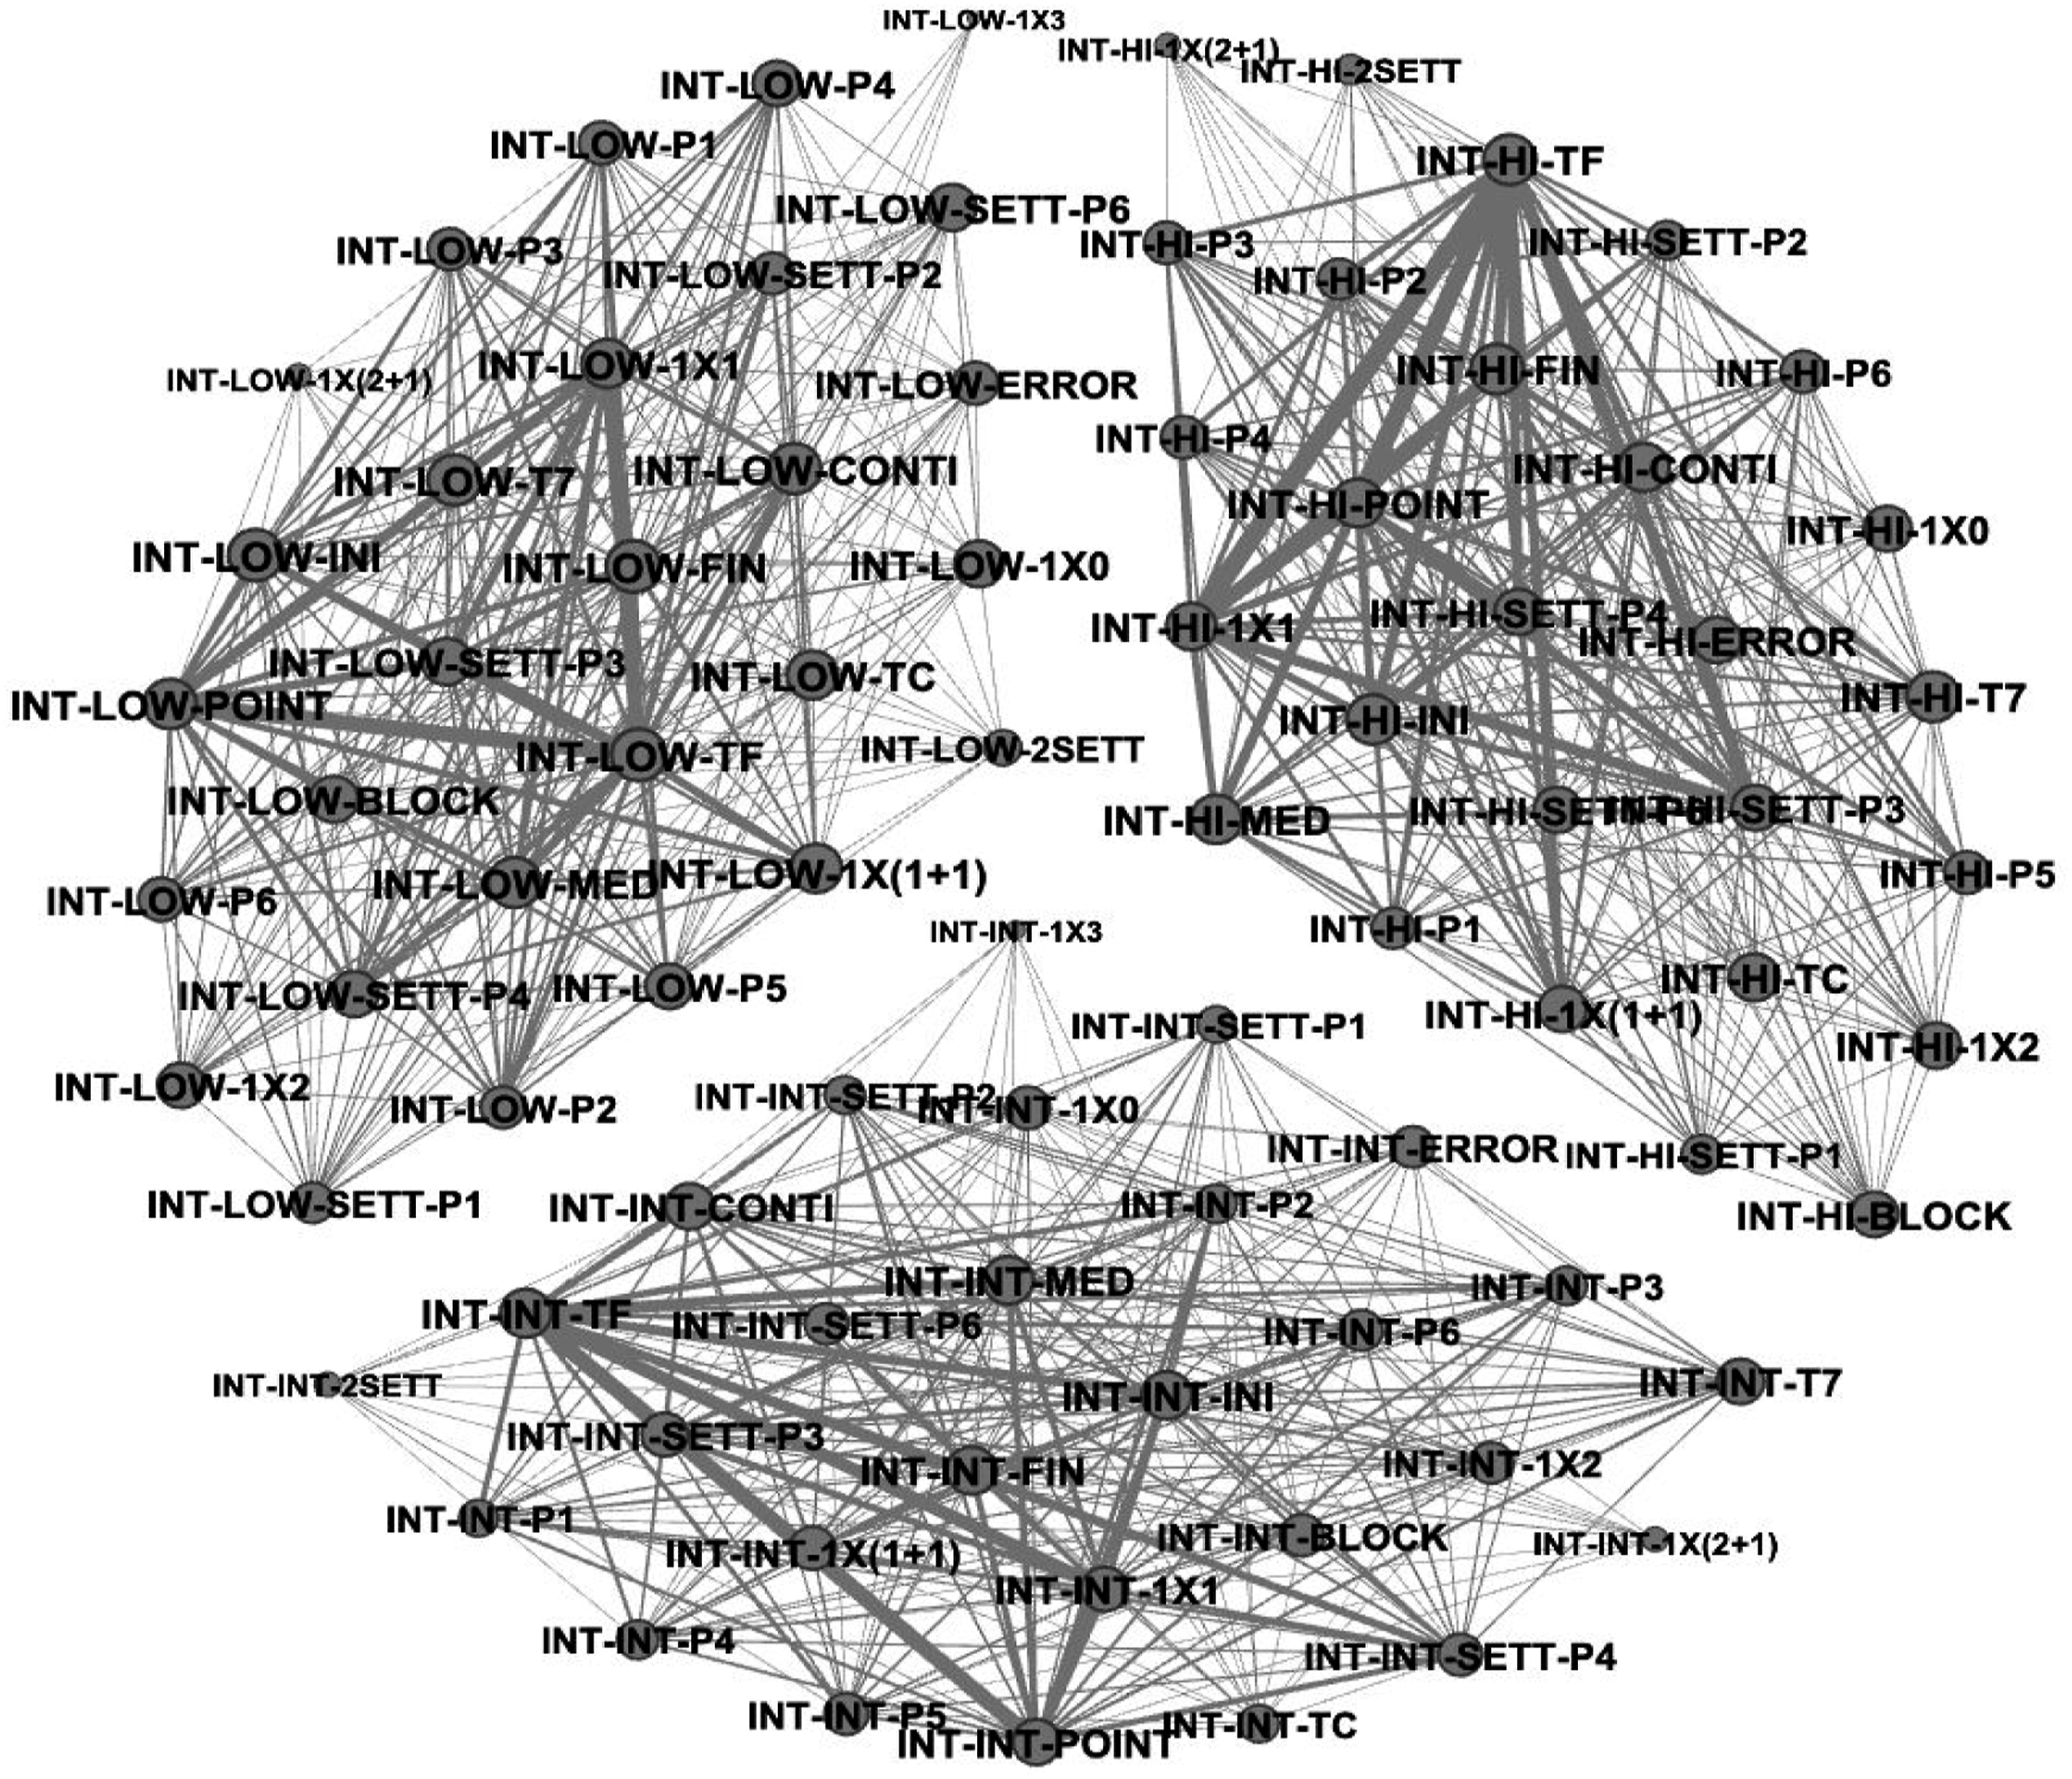
When considering the confrontations performed by low performance teams (Figure 3), we observed that the highest eigenvector values were: (a) when a team played against high performance teams, settings were in zone 2 (SETT-P2 = .860), the middle-blocker jumped next to the setter and ahead (TF = .770), at the beginning of the set (INI = .860), there was a simple block (1 × 1 = .821), point of attack (POINT = .828) and setter was in the initial position 4 (P4 = .771); (b) when a team played against intermediate performance teams, settings were zone 2 (SETT-P2 = 1.00), the middle-blocker jumped behind and close to the setter (TC = .851), at the beginning of the set (INI = .997), there was a single block (1 × 1 = .930), point of attack (CONTI = .862) and setter was in in starting position 5 (P5 = .896); and (c) when a team played against low performance teams, settings were zone 2 (SETT-P2 = .975), the middle-blocker jumped behind and close to the setter (TC = .887), at the end of the set (INI = .975), there were single blocks (1 × 1 = .903), point of attack (CONTI = .941) and setter was in starting position 6 (P6 = .827). Network Analysis of Matches Performed by Low Performance Teams.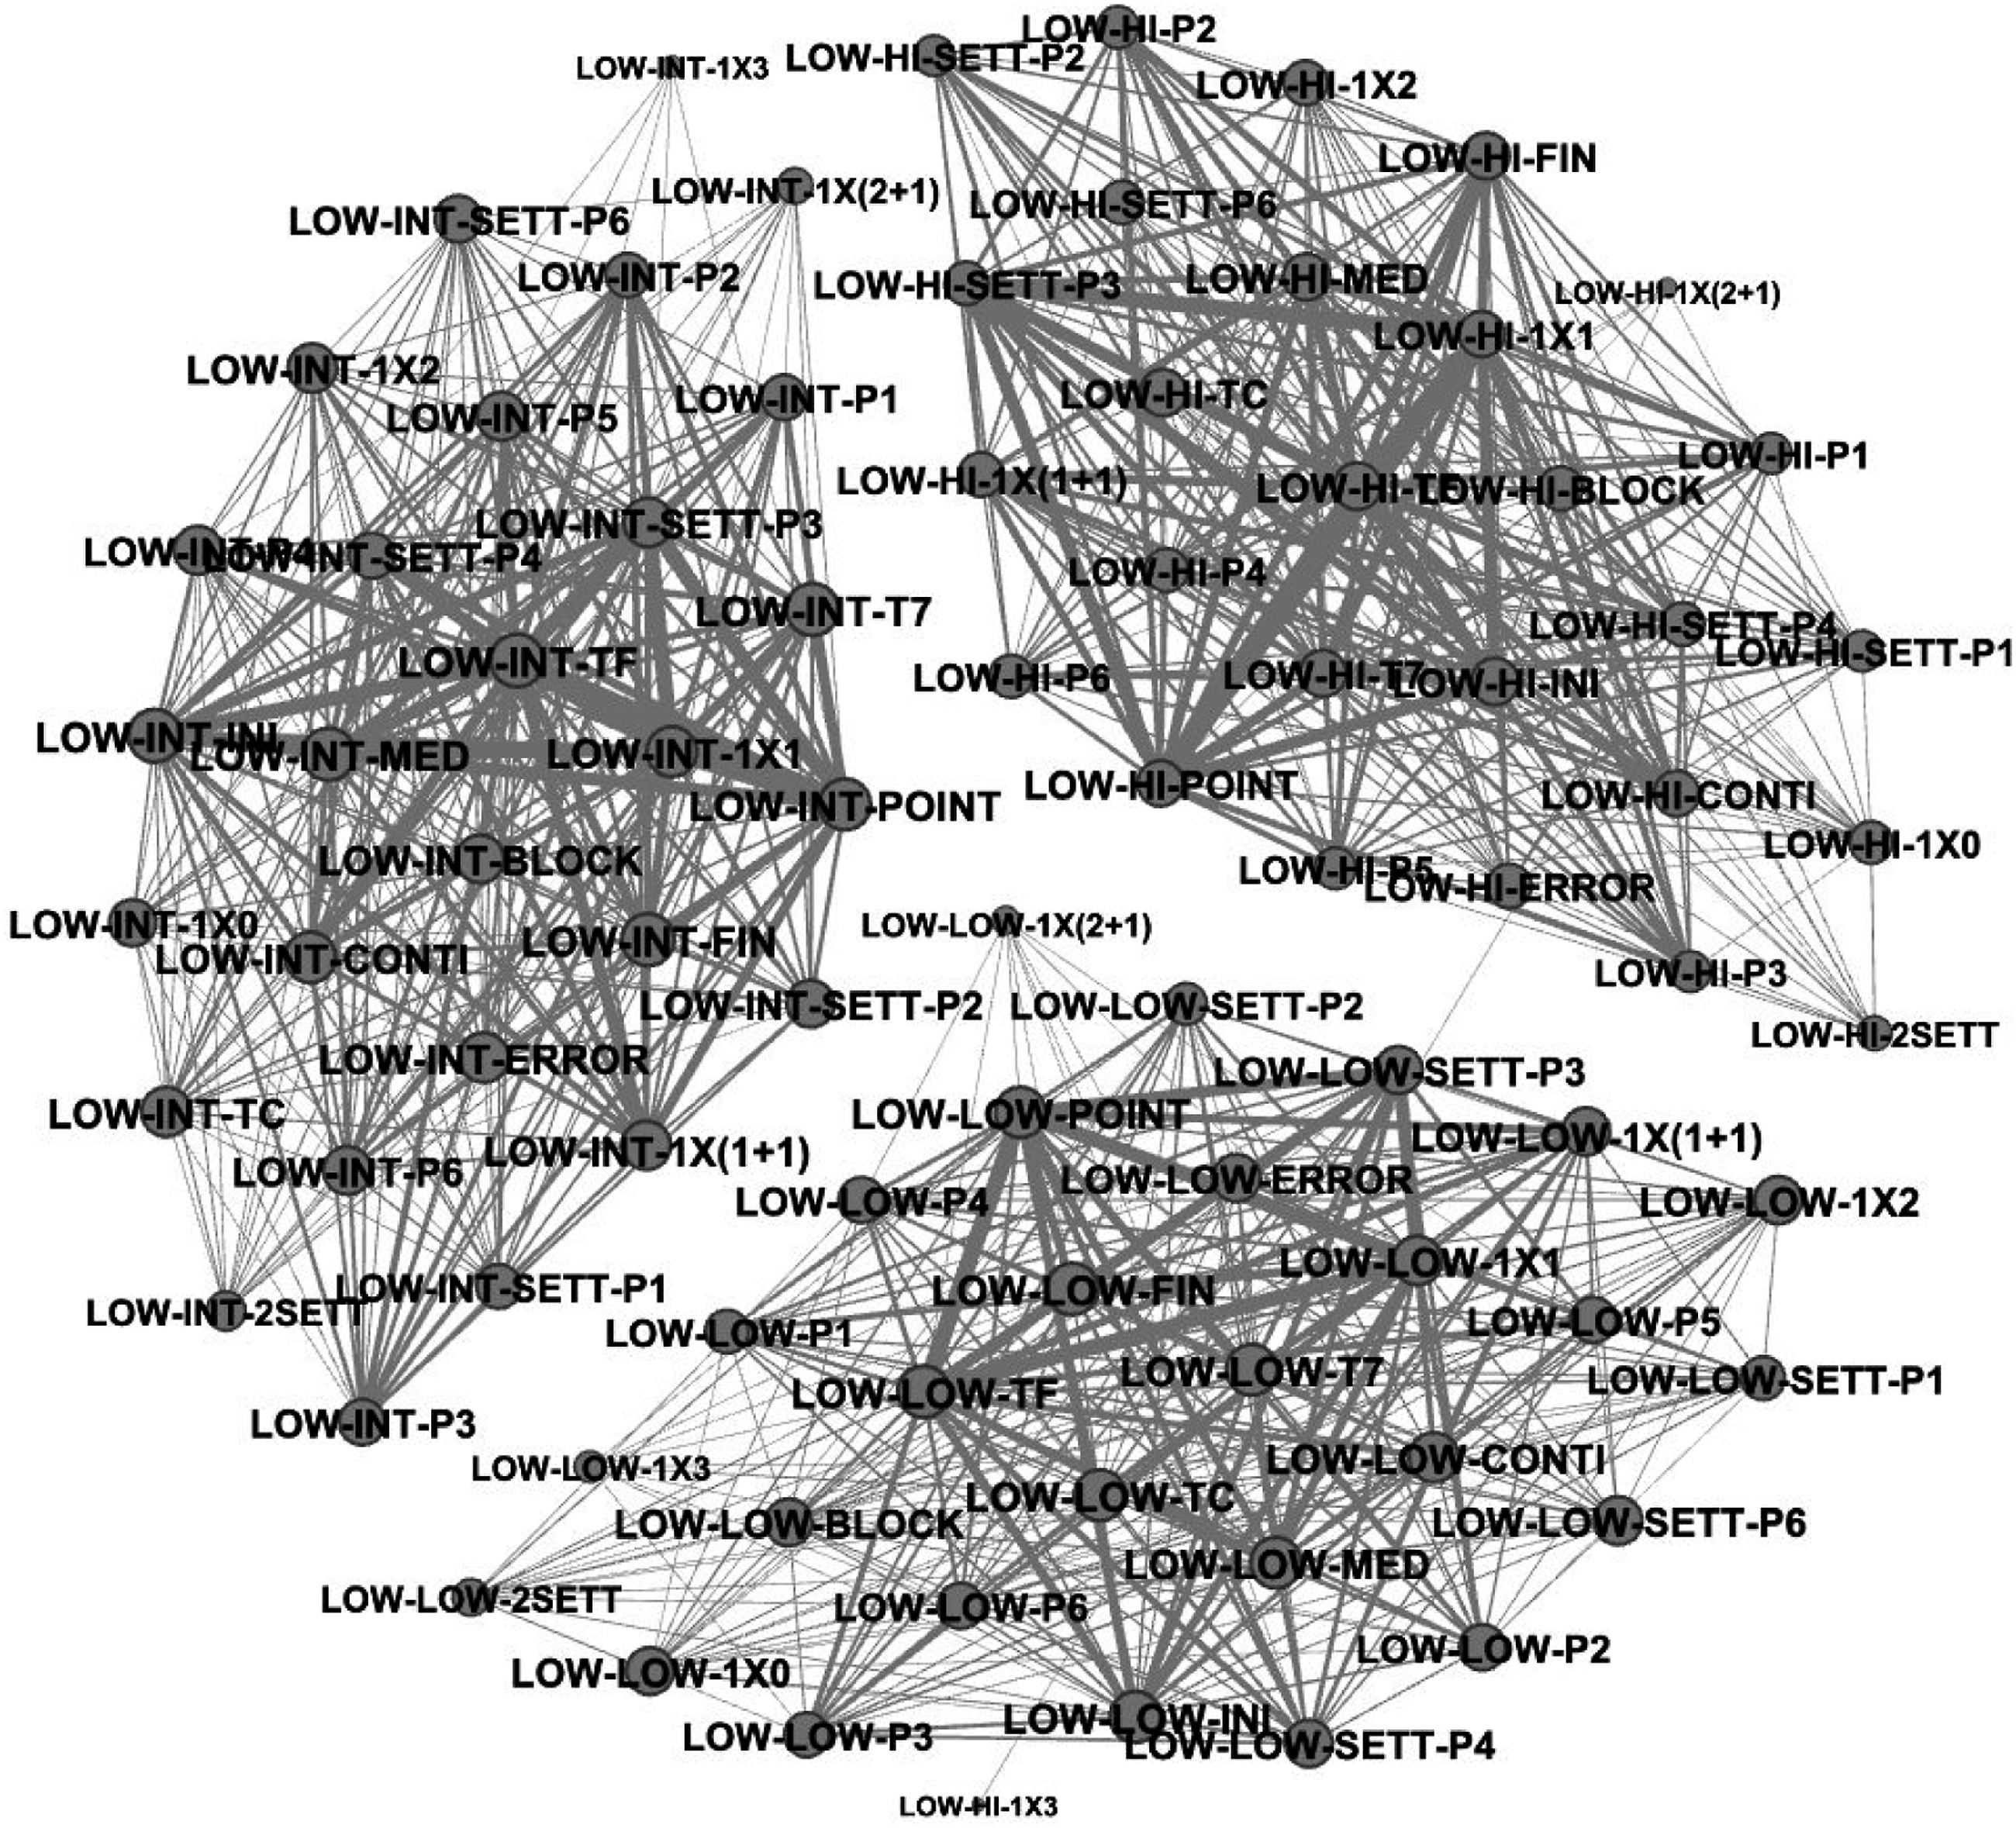
Discussion
We conducted this SNA on the assumption that applying match analysis within an ecological framework would facilitate comprehension of concurrent and consecutive action possibilities while considering the environmental constraints (Gil-Arias et al., 2019; Raab et al., 2019; Woods et al., 2020). From this perspective, the different configurations that derive from the game contexts require flexibility in the action patterns, since the athlete-environment interaction changes throughout the sporting scenario, as well as in response to the opponent’s strategies (Araújo & Davids, 2018; Araújo et al., 2006; Renshaw et al., 2019). Thus, our objective was to analyze with SNA the offensive construction in KI in conditions of organized attack, according to the type of confrontation from a team’s performance during the 21-22 Volleyball Men’s Superliga.
The data partially confirmed our first hypothesis that, in balanced games between teams with similar performance (HI × HI, INT × INT, and LOW × LOW), there would be notable centrality values for settings in zones 2 and 4. Such actions predominantly occurred mainly in the middle and end of the set. Subsequent data analysis revealed that during matches between high and intermediate performance teams, the eigenvector values were higher for settings executed in zones 2 and 4. Conversely, in matches between low performance teams, the highest eigenvector centrality values were for settings for zone 4 and 3.
These findings are consistent with prior research indicating an increased utilization of settings at the network’s extremities under favorable setting conditions, reflecting proficient and effective execution of game strategies (Costa et al., 2016; González-Silva et al., 2020). The setter’s decision-making during the side-out phase hinges on the availability of attackers and the positioning of opponent blockers, engendering a sense of uncertainty and caution among opposing players. Consequently, anticipatory movements are hindered (Rocha et al., 2020b, 2021). Given this context, the distribution of plays under optimal conditions might challenge players in deciphering the middle-blocker’s intentions, prompting greater activity towards the extremities, particularly towards the end of the set when the block system’s structure is less rigid.
Regarding the set moment, we noted a fluctuation aligned with the team’s performance level. Nonetheless, all teams displayed elevated centrality values during the final set moment. This trend is in line with the observations of other researchers who highlight the significance of critical game scenarios (Martins et al., 2022a; Martins et al., 2022). Hence, the final set moment emerges as a pivotal juncture demanding decisions that are contextually calibrated. An erroneous choice at this juncture could result in the conclusion of the set or even the entire game.
Our data also partially confirmed our second hypothesis that, in unbalanced games, the eigenvector values would be higher for setting in zones 3 and 2 during side-out. We observed that the highest eigenvector values were for settings in zones 2 and 4, and in the LOW-HI confrontation, there were similar centrality values for surveys in zones 3 and 4.
These results corroborate prior findings when considering that the play distribution in the volleyball games, in general analysis, occurs mostly towards the net extremities, specifically zones 2 and 4, as supported by previous research (González-Silva et al., 2020; Laporta et al., 2018a, 2018b; Loureiro et al., 2017). Our analysis focused exclusively on high-quality receptions, the setter’s decision to prefer the net extremities is probably justified for this location makes it more difficult for the opposing middle-blocker, due to the greater play displacement and related concerns regarding available attackers. Notably, this positioning creates complexities in structuring the block system and the defense (Rocha et al., 2020b, 2021). Conversely, the relatively low values for zone 3 settings indicate that the setters did not prioritize fast attacks in the central court zone. This finding diverges from established literature, as high-level volleyball often exhibits a tendency, during a side-out and counter-attack in-system scenario, to play fast particularly involving the middle-blocker (Denardi et al., 2017; González-Silva et al., 2020; Millán-Sánchez et al., 2019). This strategic approach provided numerical superiority on the court central zone, aligning with the attack zone 6 (pipe) and employing faster settings because it provides proximity to the setter (Costa et al., 2016; Costa et al., 2017a; Rocha et al., 2021).
This low-risk strategy implies that offensive teams minimized the variability in attack locations by employing slower attack tempos. This approach intentionally avoided delving into additional explorations of possibilities and game dynamics, which could potentially align better with contextual demands favoring high-risk strategies (Laporta et al., 2018a). Although others have observed that in unbalanced matches, there exists a greater tendency for teams to take risks in their play distribution strategies depending on the context (Costa et al., 2017b; García-de-Alcaraz & Marcelino, 2017), our analysis of these games revealed predominantly conventional strategies. For instance, traditional approaches were employed in tendencies to make attack decisions at the net extremities.
This finding may suggest that setters when making decisions in unbalanced games, did not consider the opponent’s block position. Instead, they preferred pre-established solutions involving the existing attackers or opted for settings with lower inherent risks, consequently transferring the responsibility for play success onto the attackers.
Our third hypothesis was that, regardless of the balance of team abilities, there would be higher centrality values for the middle-blocker’s attack jumps, both when positioned close to the setter (in front and behind), and during instances of broken single or double blocks. We also anticipated a relationship with point attack efficacy and that the initial setter position would show oscillating, rather than consistently higher eigenvector values, for a particular starting position. This hypothesis was partially confirmed. When considering the center approach, we confirmed the team’s inclination to execute plays centered around the middle-blocker when situated near the setter, and we observed fluctuations in the setter’s initial position. However, we noted that the eigenvector values were higher for scenarios involving single, broken double, and compact double blocks. Moreover, the efficacy of attacks demonstrated dynamic oscillation between defensive actions and continuity. These observations affirm the assertions posited in our second hypothesis and align with existing literature, that has shown that setters employ a low-risk strategy, particularly during the side-out phase of high-level volleyball. Nevertheless, players strategically utilize the tactic of positioning the middle-blocker’s jump near the setter, thereby diminishing the likelihood that the opposing blockers will anticipate attacks directed toward the net extremities (Costa et al., 2016; Laporta et al., 2018a).
From this perspective, the strategic placement of the middle-blocker positioned for close attacks near the setter, especially in the front area, remains compelling as long as these attackers remain engaged. This dynamic is due to the ecological conditions of the game, where an increased number of attack opportunities arise, despite a potential decrease in attack effectiveness for balls that are farther away from the setter (Millán-Sánchez et al., 2019). However, it should be noted that the higher centrality values in zones 2 and 4, combined with the limited variation in setting locations, might have contributed to more predictable attack scenarios during side-out. This predictability, in turn, could have facilitated better defensive structuring, resulting in elevated eigenvector values for double blocks, as well as for the attacking effects that allowed the game continuity.
From this context, recognizing that decision-making emerges from the individual’s interaction with task constraints, deriving emergent solutions for game problems, through the dynamic instability arising from the ecological context (Araújo et al., 2004, 2006, 2017; Woods et al., 2020, 2020b). We observed that the setters exhibited limited capacity to interpret the game scenario during side-out. To a certain extent, they seemed to opt for predetermined conventional choices (attacking through the net extremities), often neglecting crucial information provided by opponents regarding their defensive system (identifying points where the opposing blockers were better positioned, or the opponent’s most effective position).
Limitations and Directions for Further Research
Regardless of the classification place and the confrontation type, we noticed that the teams adopted low-risk game strategies. Even in an organized attack situation, the extremities net zones were the ones with the highest centrality values. The strategies revolving around utilizing the middle-blocker in a forward position close to the setter underscore the necessity of keeping the opposing middle-blocker in proximity to the central net area. This strategic choice aimed to impede the opponents’ ability to swiftly transition to constructing more cohesive blocks at the extremities. And, finally, introducing critical game situations to training, such as the set final part, can help athletes better adjust their decisions to not compromise the end of the set end of the match result. While Brazilian volleyball holds a significant position in high-level volleyball competitions, our study’s exclusive focus on “in systems” circumstances during the side-out phase within men’s volleyball was a study limitation. Future researchers might expand the analysis of these variables to encompass global championships, including women’s volleyball, and consider non-standardized attack scenarios.
Conclusion
Our results in this study indicate that high-level men’s volleyball players’ actions during side-out, especially those of the setter, were not influenced by the opposing team’s performance level. Rather, teams opted for lower-risk decisions and showed predictability. Attacks occurred most frequently in zones 2 and 4 with the middle attacker executing attacks near the setter against single or disrupted blocks.
Supplemental Material
Supplemental Material - The Decision-Making of High-Level Volleyball Setters in the 2021-2022 Volleyball Men’s Superliga: Does the Opponent Matter?
Supplemental Material for The Decision-Making of High-Level Volleyball Setters in the 2021-2022 Volleyball Men’s Superliga: Does the Opponent Matter? by Marcos Henrique Nascimento, Lorenzo Laporta, Gustavo Ferreira Pedrosa, Augusto Cezar Rodrigues Rocha, Claudio Andre Barbosa de Lira, Mário Hebling Campos, Juracy da Silva Guimarães, Thiago José Leonardi, Marcelo Couto Jorge Rodrigues, Lucas Figueiredo Savassi, Henrique de Oliveira Castro, and Gustavo De Conti Teixeira Costa in Perceptual and Motor Skills
Footnotes
Declaration of Conflicting Interests
The author(s) declared no potential conflicts of interest with respect to the research, authorship, and/or publication of this article.
Funding
The author(s) received no financial support for the research, authorship, and/or publication of this article.
ORCID iDs
Supplemental Material
Supplemental material for this article is available online.
Author Biographies
References
Supplementary Material
Please find the following supplemental material available below.
For Open Access articles published under a Creative Commons License, all supplemental material carries the same license as the article it is associated with.
For non-Open Access articles published, all supplemental material carries a non-exclusive license, and permission requests for re-use of supplemental material or any part of supplemental material shall be sent directly to the copyright owner as specified in the copyright notice associated with the article.