
Abstract
The duration, accuracy, and consistency of responses to various types of stimuli are widely accepted as indirect indicators of the efficiency of brain information processing, but current clinical tests appear to lack sufficient sensitivity to detect subtle impairments. Immersive virtual reality (VR) offers a new means to acquire measures of perceptual-motor responses to moving visual stimuli that require rapid conflict resolution, but their test-retest reliability has not yet been demonstrated. Repeated measures. We analyzed data from 19 healthy young adults who performed a 40-trial VR test on three consecutive days. We focused on response time (RT) and perceptual latency (PL) for eye, neck, arm, and whole-body step displacements involved in executing a reaching/lunging movement in a right or left direction toward a peripherally located virtual target. Measures of RT and PL included a 40-trial mean, an intra-individual variability (IIV) value, and a rate correct score (RCS) that incorporated both response duration and accuracy. Most mean and IIV values for PL and RT demonstrated a positive distributional skew that was substantially reduced by natural logarithm transformation. While a learning effect was evident between sessions 1 and 2 for 7 of 8 mean PL and RT measures, 3-session intraclass correlation coefficient (ICC) values were moderate to excellent for 15 of 16 transformed PL and RT measures (range: .618 to .922). The composite RCS metric did not require transformation for either PL or RT, whose respective 3-session ICC values were .877 and .851. This moderate to excellent test-retest reliability for various VR measures of perceptual-motor function, combined with evidence of their validity from both past and future research, suggest that these measures can advance clinical detection of impaired brain processing and longitudinal assessments of potentially modifiable performance deficiencies.
Keywords
Introduction
Virtual reality (VR) has been defined as a computer-generated simulation of an environment that enables user interactions with its elements (Santos et al., 2020). Non-immersive VR methods project a simulated environment onto a screen or computer monitor that is viewed within the surrounding real environment, whereas immersive VR methods project the user into a simulated three-dimensional environment through a head-mounted display that completely removes visual awareness of the real environment (Müller et al., 2023; Santos et al., 2020). A growing awareness of the limitations of existing clinical tests for detecting subtle performance deficiencies among athletes has created a critical need for new clinical measures that will identify those with elevated injury risk (Crasta et al., 2023; Wong et al., 2023). Compared to standard clinical tests of neurocognitive and neuromuscular function, VR can provide greater control of visual stimuli (e.g., location, duration, speed of movement and closer coupling between perceptual and motor responses) (Harris et al., 2020; Müller et al., 2023).
A variety of clinical test protocols have been devised to impose various combinations of visual, cognitive, or motor demands, and these are believed to reveal brain processing deficiencies that are not evident when component tasks are performed in isolation (Slobounov et al., 2006b). Cognitive demand has often been imposed by such activities as reciting months of the year backwards, reciting results of a series of simple mathematical operations, or giving verbal responses to word-color combinations (i.e., Stroop task); and the complexity of motor responses to visual stimuli has ranged from simple button presses to multi-directional whole-body movement patterns (Harper et al., 2022; Lynall et al., 2021). A possible explanation for the limited sensitivity of many clinical tests used for detecting subtle impairment is that they lack an assessment of integrated visual-cognitive-motor challenges that require simultaneous activation of multiple specific brain circuits frequently employed during real-world functioning (Kiefer et al., 2018; McGowan et al., 2018).
Early studies of the expanded potential of VR testing for revealing impaired sensorimotor function utilized a non-immersive projection system to display a virtual “moving room” that induced postural sway, which was measured by a force plate (Slobounov et al., 2006a, 2006b, 2007). The same non-immersive VR projection system was later combined with a head-mounted motion tracking system to compare how visual motion affected college athletes who had sustained a concussion within the preceding 7–10 days versus college students with no history of concussion (Teel et al., 2016a, 2016b; Teel & Slobounov, 2015). In the first study to use an immersive VR measure with a head-mounted display, a simulated classroom environment with auditory and visual distractions elicited deficits in attention and inhibitory control among adolescent athletes who had sustained a concussion within the preceding 2-year period (Nolin et al., 2012). The collective results of these early studies suggested that VR might provide a more sensitive means of identifying a brain processing impairment than standard clinical tests (Santos et al., 2020).
Recent findings from immersive VR studies suggest that the use of multiple visually guided exercises may reduce sport-related injury risk (Reneker et al., 2019) and improve various performance capabilities (Reneker et al., 2020). Similarly, simulating a sport-specific VR environment and permitting user interactions with other players and objects has revealed more high-risk hip, knee, and ankle displacements than clinical tests administered without VR immersion (DiCesare et al., 2020). Although maximally realistic simulated environments (i.e., ecological validity) may best promote naturalistic responses of the musculoskeletal system (Schuermans et al., 2022), a virtual environment that looks and feels real may not necessarily present perceptual, cognitive, and motor challenges in a manner that permits measurement of integrated responses (Harris et al., 2020). For example, an immersive VR application designed to give the user the realistic experience of riding a racehorse quantified the rider’s response times through an unrelated secondary task involving pressing a button in response to superimposed geometric shapes of different colors (Horan et al., 2020).
Whether designated as “reaction time” or “response time” (RT), the interval between a stimulus onset and initiation or completion of some specified response provides a widely accepted representation of the speed of brain information processing (Harper et al., 2022; Marmolejo-Ramos et al., 2015). Overlapping stages of neural processing include stimulus detection (i.e., perceptual awareness), stimulus interpretation and response selection (i.e., cognitive processing), and response execution (i.e., motor activation and control). Despite overlap between the cognitive and motor stages of RT, subdivision of the elapsed time is needed to estimate the durations of component processes that may yield different information (Pfister et al., 2023). The terms “decision time” or “perceptual latency” (PL) can be used to refer to the duration of these various delays between stimulus appearance and initiation of some detectable response, in which case the term “movement time” refers to the additional amount of time required to complete a specified action (Morral-Yepes et al., 2022). Because some amount of cognitive control guides a motor response beyond its initiation, including rapid ballistic movements (Pfister et al., 2023), assessment of only PL may provide an incomplete representation of integrated cognitive and motor processing.
The RT measure derived from a given testing paradigm is often the outcome of primary interest, but the overall accuracy of responses may be an equally important consideration for tests that present a cognitive conflict resolution challenge requiring response inhibition during selection from more than one response option (Goswami et al., 2016). The “rate correct score” (RCS) metric derived from division of the number of correct responses by the sum of response times for a set of trials has been shown to provide an advantageous composite indicator of both speed and accuracy (Vandierendonck, 2017). Another potentially important behavioral indicator of neural processing efficiency is intra-individual variability (IIV) of RTs, which yields information that is distinct from mean RT. Numerous studies have documented an inverse relationship between behavioral performance consistency and moment-to-moment brain signal variability (Fjell et al., 2011; Garrett et al., 2014, 2020; Grady & Garrett, 2018; Johnson et al., 2015; Kelly et al., 2008; McIntosh et al., 2008; Mennes et al., 2011; Roberts et al., 2022; Wang et al., 2017). Furthermore, elevated IIV has been associated with a history of sport-related concussion (McGowan et al., 2018, 2019; Merritt et al., 2019, 2021; Parks et al., 2015; Rabinowitz & Arnett, 2013; Wong et al., 2023). Despite growing evidence that longitudinal assessment of RT-related measures (e.g., RCS and IIV) may serve as important indicators of subtle change in brain processing efficiency, assessment of distribution normality and test-retest reliability have received relatively little attention.
The development of new measures for clinical use requires knowing an estimated magnitude of change over short retest intervals for healthy individuals to properly distinguish this change from change associated with positive gains in performances or declines due to an exacerbated impairment (Horan et al., 2020). In this study, we presented a VR test in which there were moving visual stimuli of two types that required respondents to select stimulus-matched directional responses over multiple successive trials, and to execute of a combination of eye movements, neck rotation, upper extremity reaching, and whole-body lateral lunging toward a virtual target; we then measured the duration of each displacement. Previous research has demonstrated that measures derived from this specific VR test have good predictive validity for the identification of college athletes and military cadets with a remote history of concussion (Wilkerson et al., 2023). Based on the findings reported by the only previous study that has assessed the test-retest reliability of RT values derived from an immersive VR test (Horan et al., 2020), we expected adequate statistical results to justify the clinical use of most, if not all, measures derived from this unique VR test. Thus, our purpose in this study was to assess the test-retest reliability of measures derived from a unique VR system that quantified different aspects of complex perceptual-motor performance in healthy young adults. We hoped this data would permit determinations of the suitability of this type of VR testing for clinical purposes.
Method
Participants
A convenience sample of 24 healthy graduate students voluntarily completed immersive VR assessments conducted on three consecutive days. We obtained Institutional Review Board approval of the study protocol and informed consent from all participants prior to their participation. Potential participants were excluded if they reported any injury-related limitations in physical functioning. Although we did not complete an a priori power analysis, prior studies of test-retest reliability involving dual-task responses to visual stimuli suggested that 20 participants would be a sufficient sample size (Lempke et al., 2022; Lynall et al., 2021).
Instrumentation and Procedures
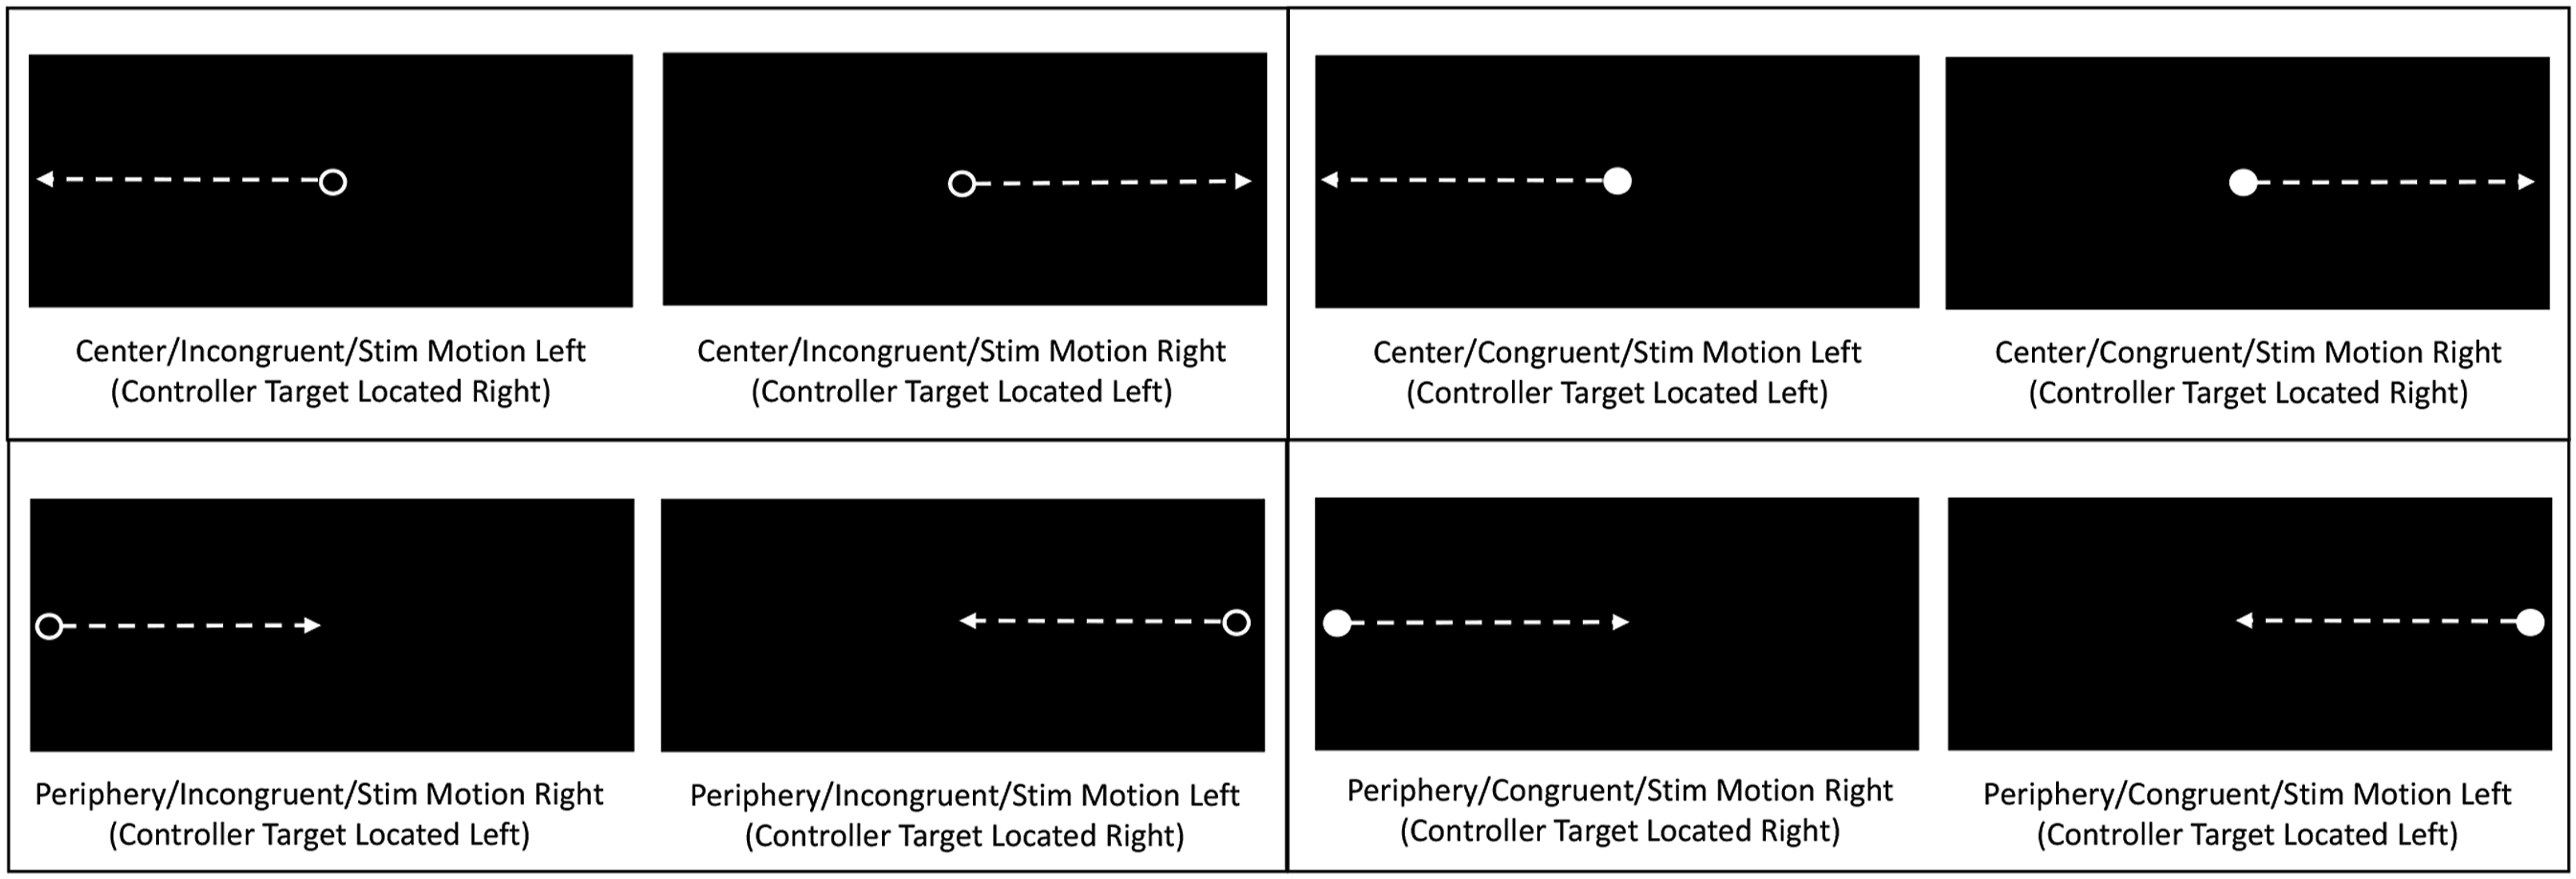
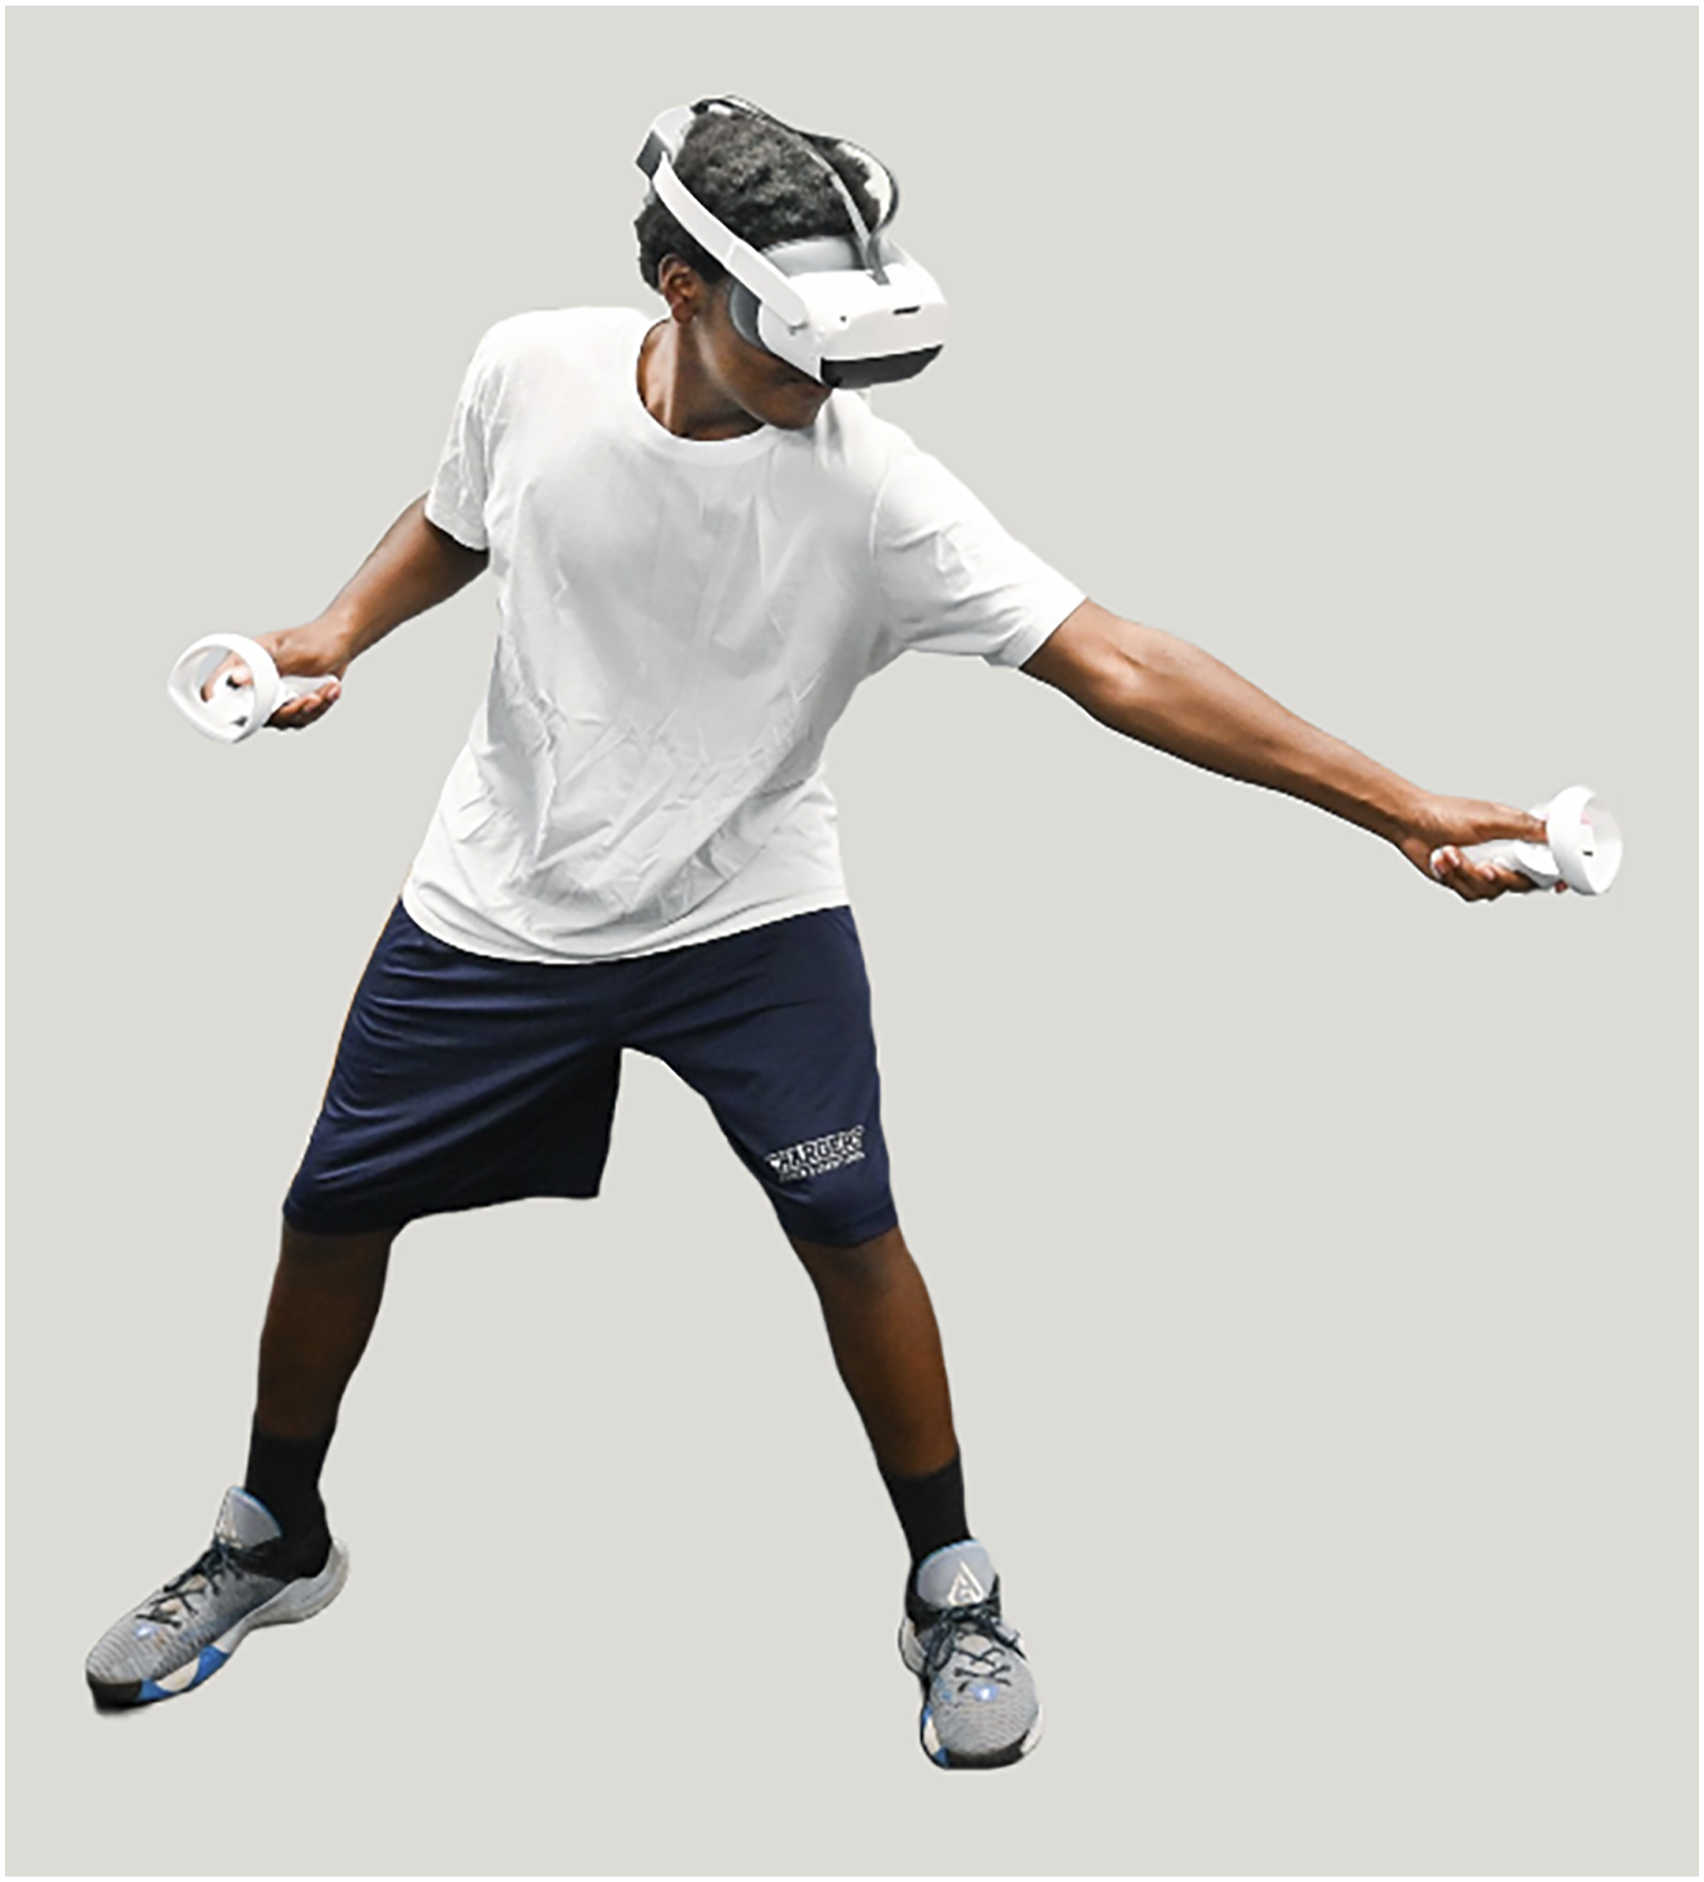
Prior to initiation of the VR test, virtual response targets (i.e., green spheres) could be seen against the black background of the head-mounted display (Pico Neo 3 Pro Eye, Pico Immersive, Ltd., Mountain View, CA) (Figure 1 View of Virtual Reality Environment Prior to Relocation of Spherical Response Targets to a Position Beyond the Peripheral Limits of the User’s Field of View, Thereby Requiring Neck Rotation for Visualization. (Figure reproduced with permission from Wilkerson, G. B., et al. (2023). Subtle impairments of perceptual-motor function and wellbeing are detectable among military cadets and college athletes with self-reported history of concussion. Frontiers in Sports and Active Living, 5, 1,046,572.). Depictions of 8 Combinations of Moving Visual Stimulus Type (Incongruent Open Ring vs. Congruent Filled Circle), Initial Location (Central vs. Peripheral), and Movement Direction (Left-to-Right vs. Right-to-Left) that were Superimposed on the Virtual Reality Environment. (Figure reproduced with permission from Wilkerson, G. B., et al. (2023). Subtle impairments of perceptual-motor function and wellbeing are detectable among military cadets and college athletes with self-reported history of concussion. Frontiers in Sports and Active Living, 5, 1,046,572.). Reaching/Lunging Movement Required to Make Hand Controller Contact with Virtual Target.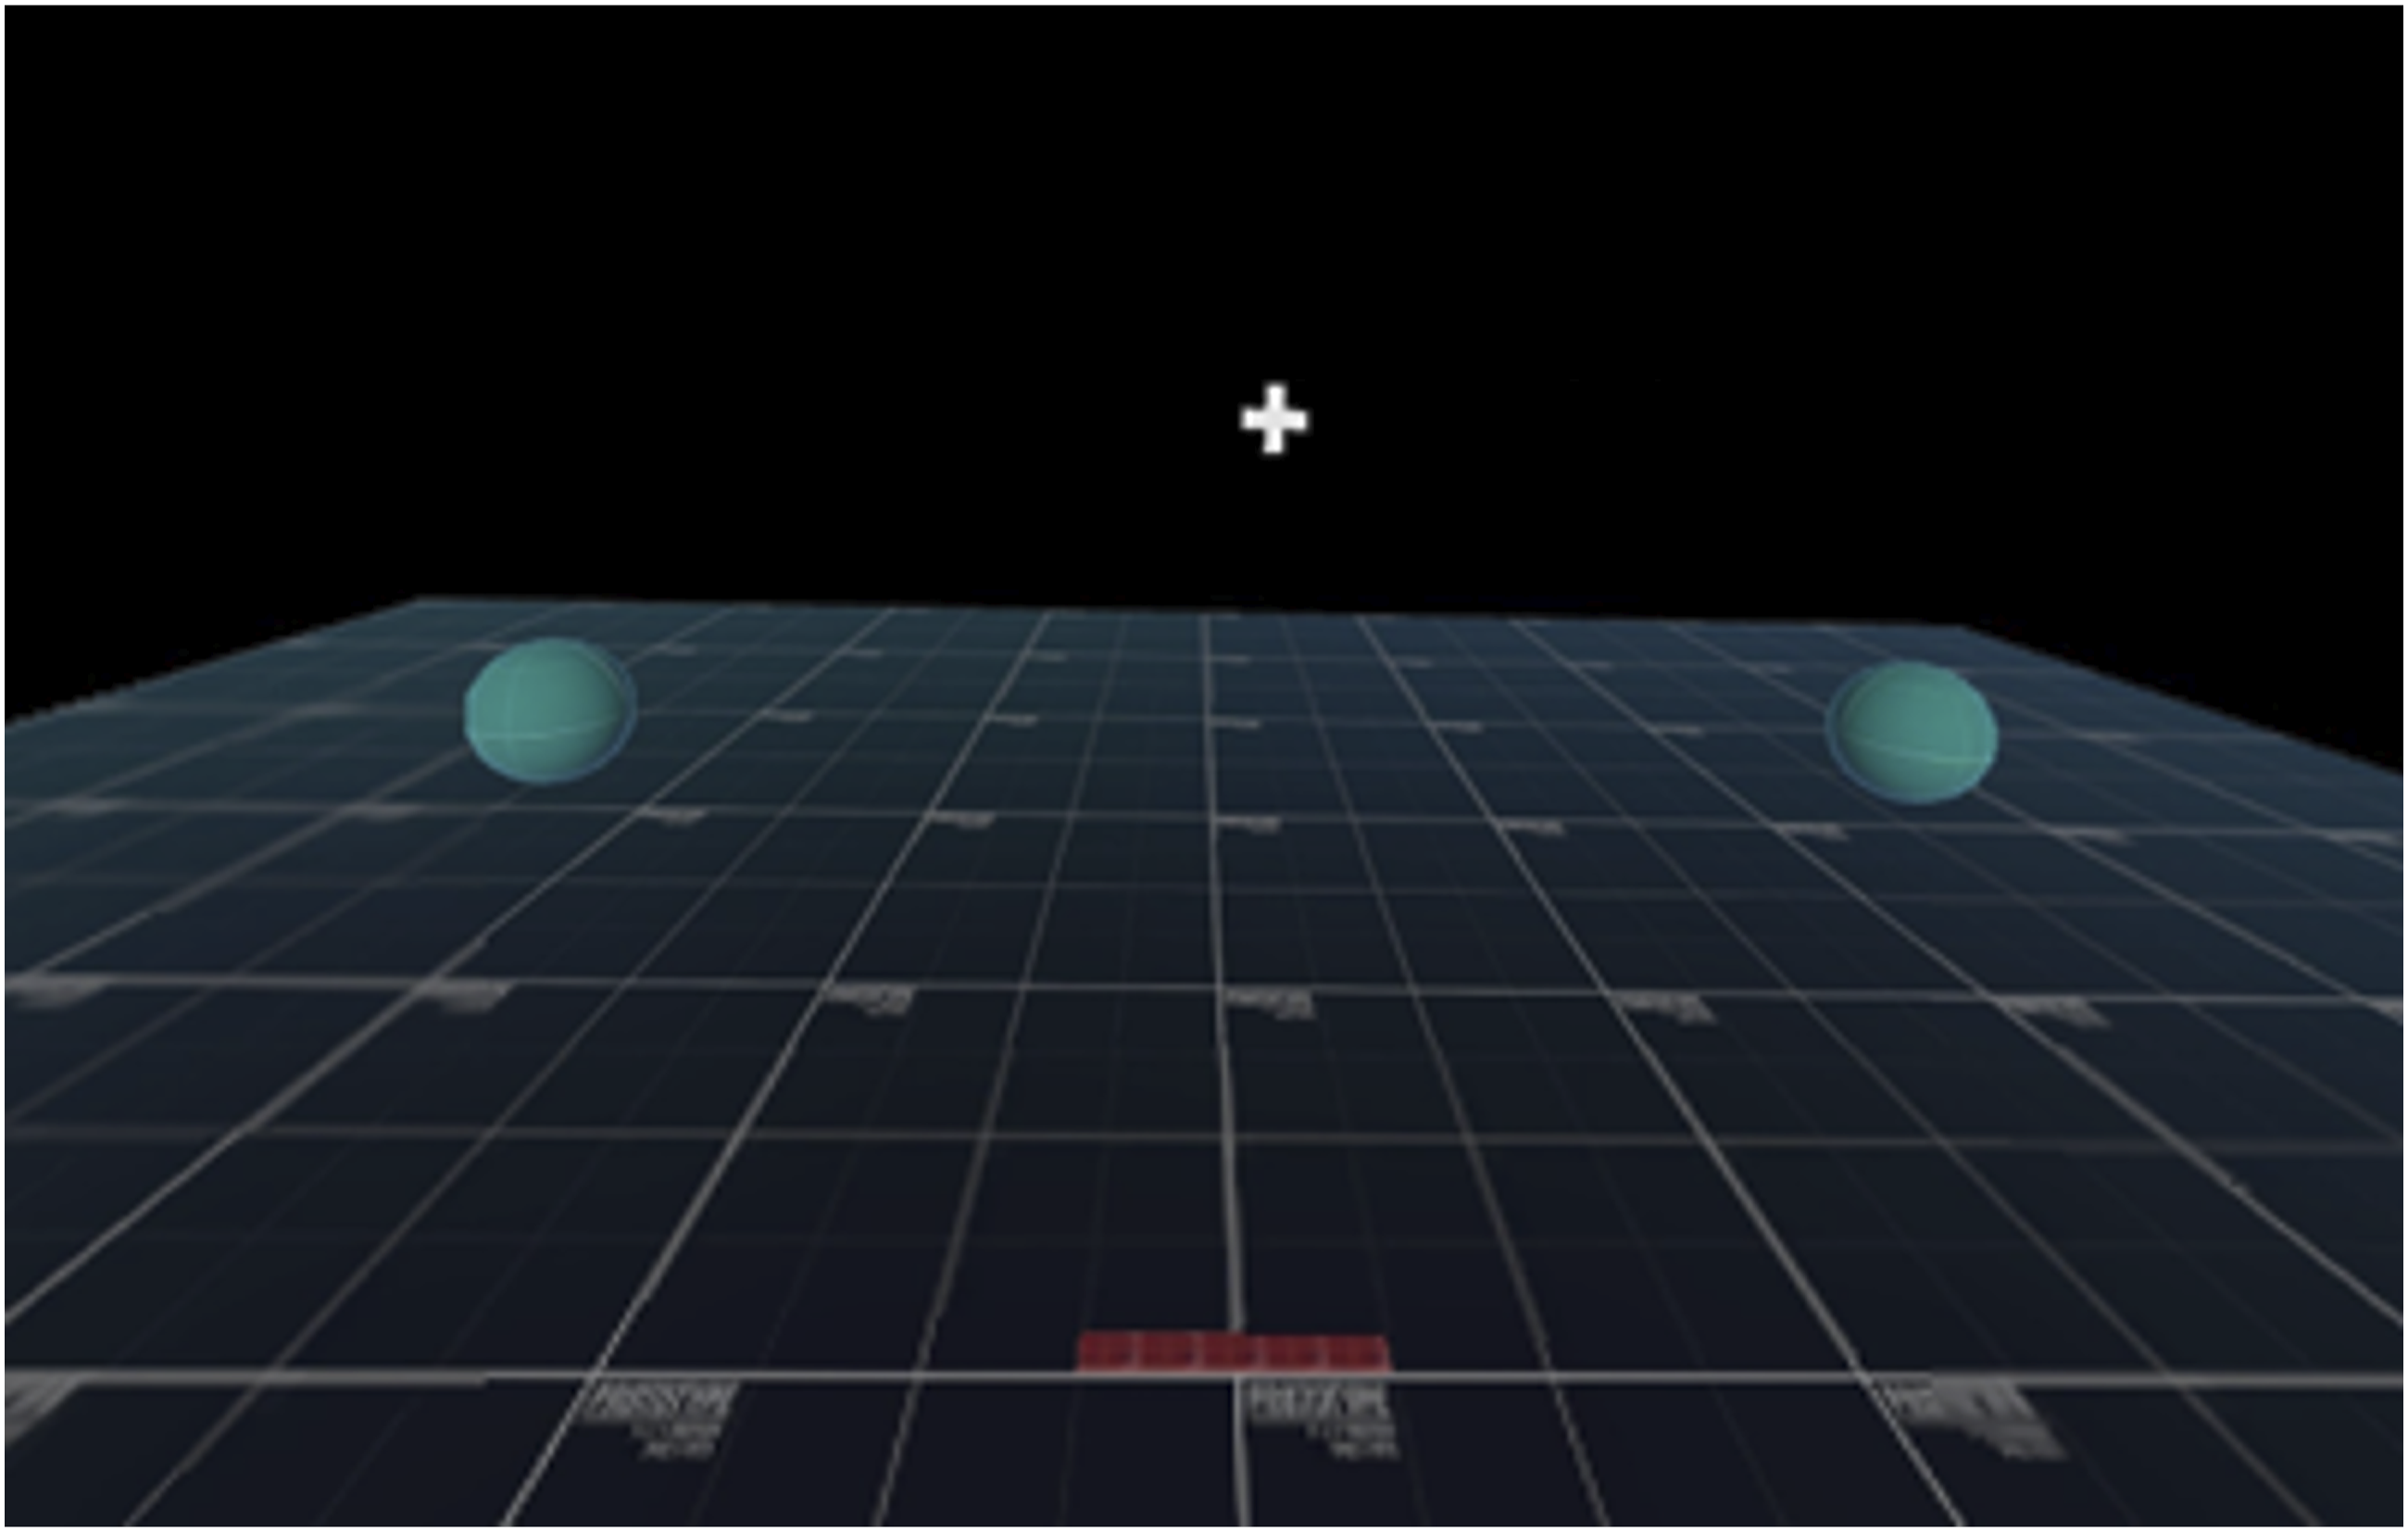
Immediately prior to the start of the test, participants assumed a slightly crouched posture with the hand controllers held close to the chest midline, and with their eyes focused on a central fixation cross that disappeared when a moving stimulus appeared. The direction, speed, and displacement distance of eye responses were derived from an eye tracking camera. Corresponding neck, arm, and step responses were measured at a 60-Hz sampling frequency by inertial sensors and an inside-out ultrasonic tracking system within the head-mounted component of the VR system. When a virtual target was contacted by a hand controller, a simultaneous auditory tone and controller vibration served as a cue to return to the initial position and prepare for another trial. The intervals between successive trials were 2, 2.5, or 3 s, which prevented anticipation of the timing of the appearance of the next moving stimulus. A standardized visual and auditory orientation that included congruent and incongruent practice trials was provided prior to the first of 3 test sessions conducted on consecutive days, which each consisted of one 40-trial test.
Perceptual latency was defined as the interval from stimulus appearance to movement initiation, which corresponded to a threshold of 6° for angular displacement of the eyes and neck and a threshold of 10 cm of linear displacement of the hand controller (arm) and the whole-body lunge step (defined by the position of the head). The displacement thresholds were chosen to maximize the number of intentional responses to visual stimuli, while minimizing the number of false responses (i.e., unintentional oscillatory movements preceding intentional responses). Response time (RT) was defined as the interval from stimulus appearance to maximum displacement measured prior to reversal of movement direction in preparation for another trial (Figure 4) Operational Definitions of Response Time (RT) and its Perceptual Latency (PL) Subcomponent.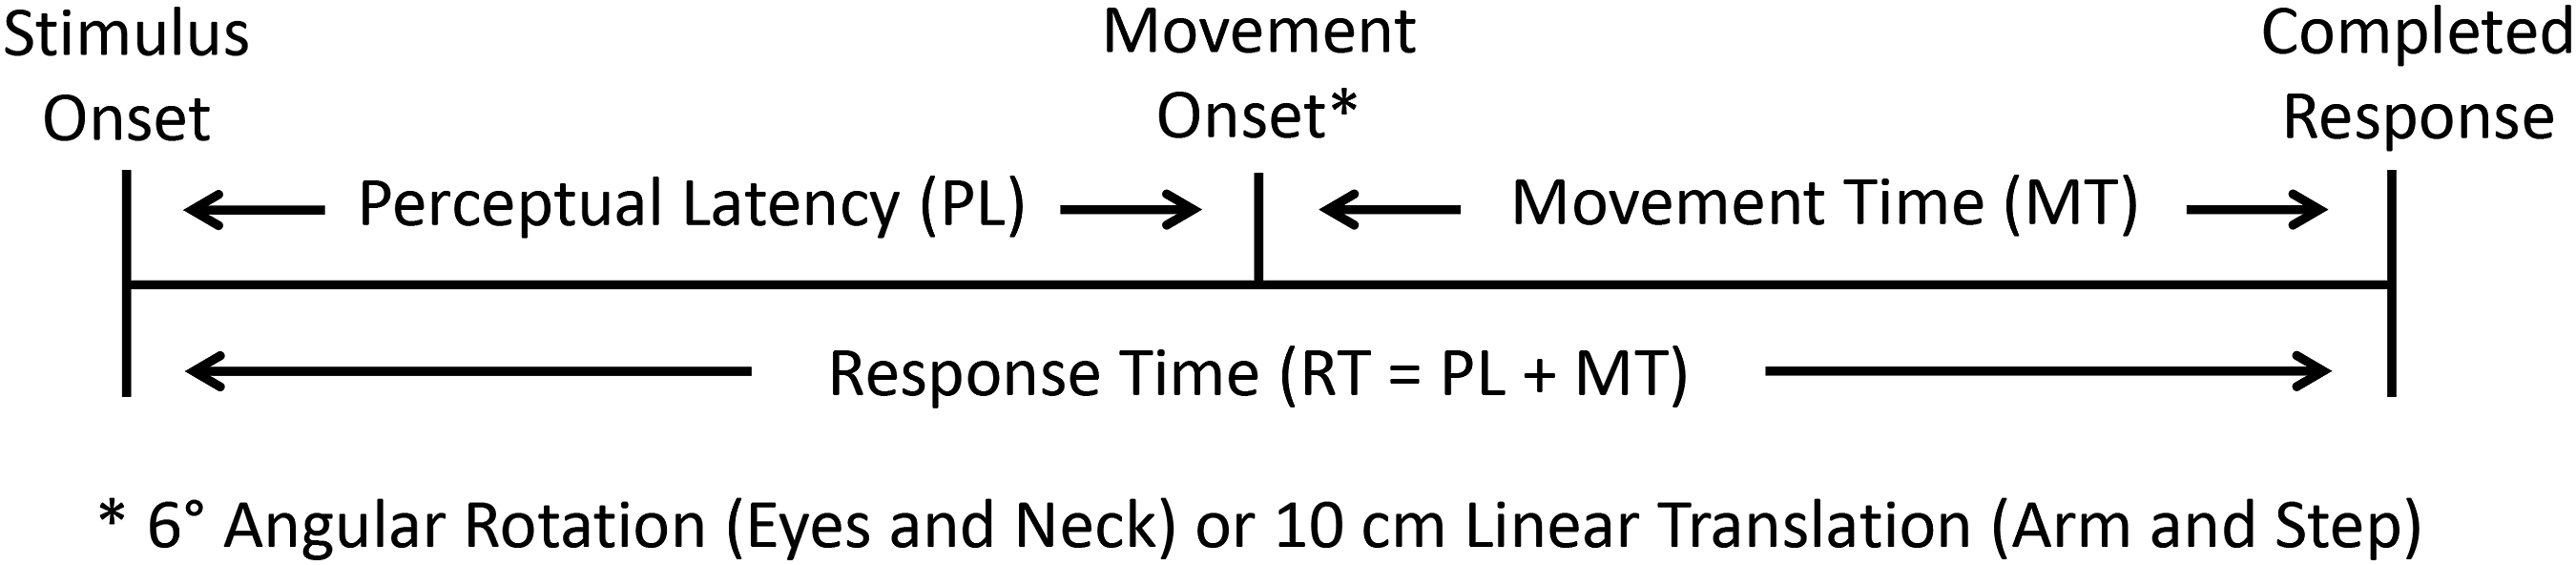
Statistical Analysis
Cases missing data for any of the three test sessions were excluded from the analysis, as were those that failed to demonstrate ≥75% response accuracy for all sessions. We assessed the normality of the data distribution by the Shapiro-Wilk test for each measure acquired during each test session. We used natural log(Loge) transformation to improve the normality of each distribution that demonstrated positive skew and a statistically significant (p < .05) Shapiro-Wilk test result (Dunlap et al., 1994; Olivier & Norberg, 2010). We used repeated measures analysis of variance (ANOVA) to assess statistically significant differences (p < .05) among the 3 sessions, along with follow-up pairwise comparisons. We assessed test-retest reliability through calculation of the intraclass correlation coefficient (ICC) with the two-way random effects, absolute agreement, and average of measures model (2, k) to include variance associated with systematic error among sessions. (Koo & Li, 2016; Weir, 2005). Raw data were used for measures that exhibited distribution normality, whereas Loge transformed data were used for measures that demonstrated improvement of distribution normality for ≥2 of the 3 test sessions. Qualitative interpretations of the ICC values were <.50: poor, .50 to .74: moderate, .75 to .89: good, and ≥.90: excellent (Koo & Li, 2016). We used an ICC value ≥.60 as a standard for determining that a measure had adequate reliability for clinical use (Broglio et al., 2007). We calculated the standard error of measurement (SEM) and minimal detectable change at a 95% confidence level (MDC95) for measures that did not require transformation to improve distribution normality. All analyses were performed with IBM SPSS version 29.0 (IBM Corporation, Armonk, NY).
Results
Geometric Mean Values (Natural Log Transformation of Original Values) and Intraclass Correlation Coefficients.
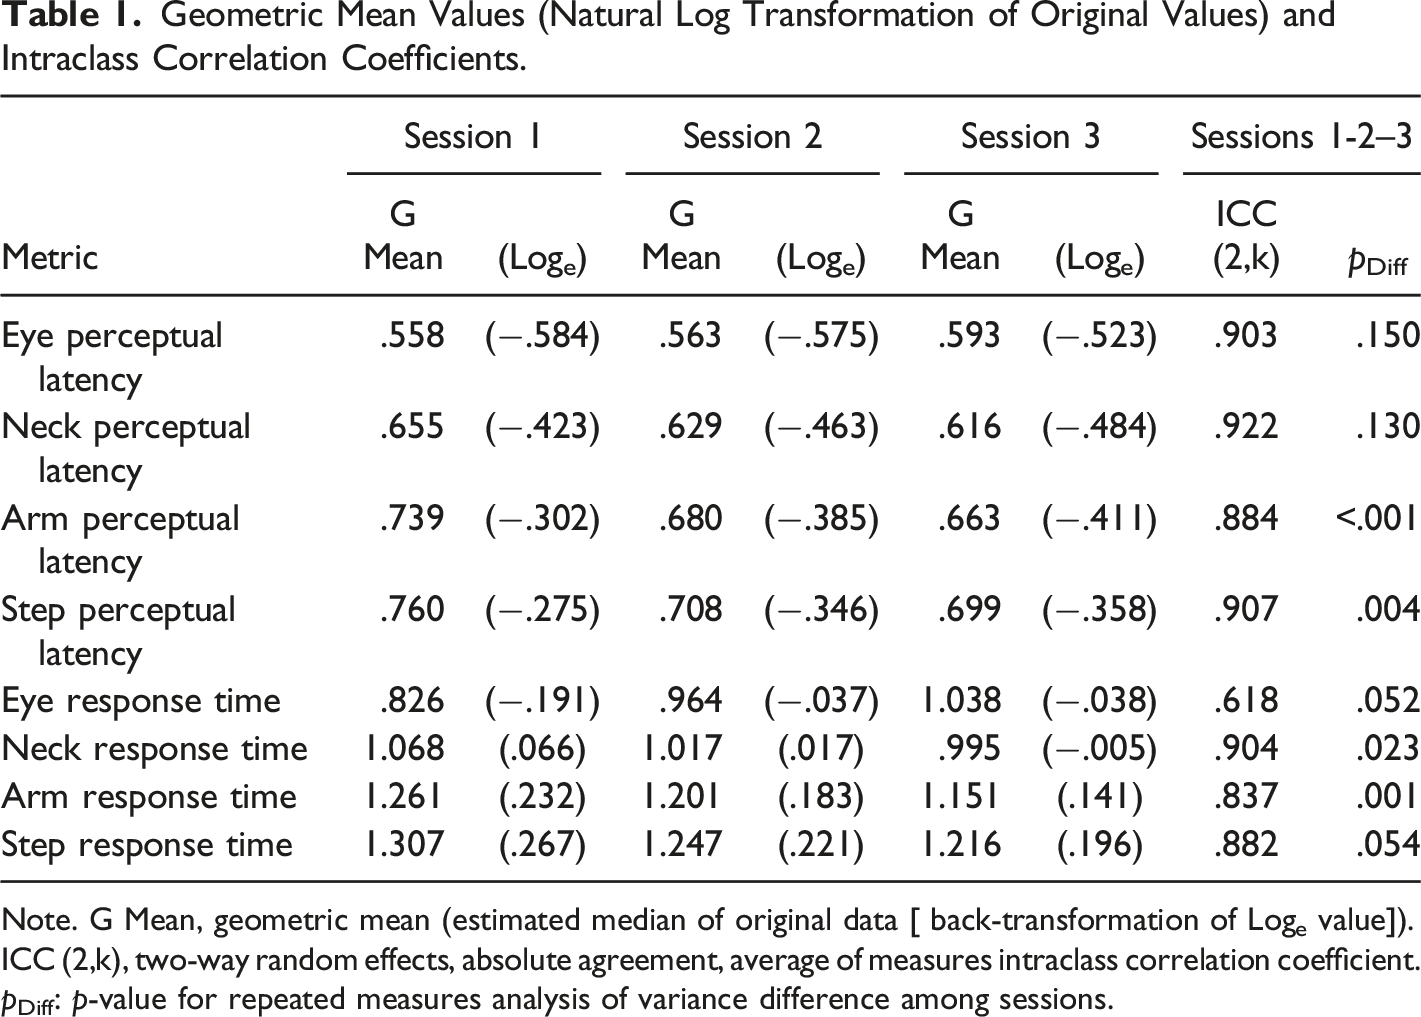
Note. G Mean, geometric mean (estimated median of original data [ back-transformation of Loge value]).
ICC (2,k), two-way random effects, absolute agreement, average of measures intraclass correlation coefficient.
pDiff: p-value for repeated measures analysis of variance difference among sessions.
Geometric Means of Intra-Individual Variability (IIV) Values (Natural Log Transformation of Original Values) and Intraclass Correlation Coefficients.
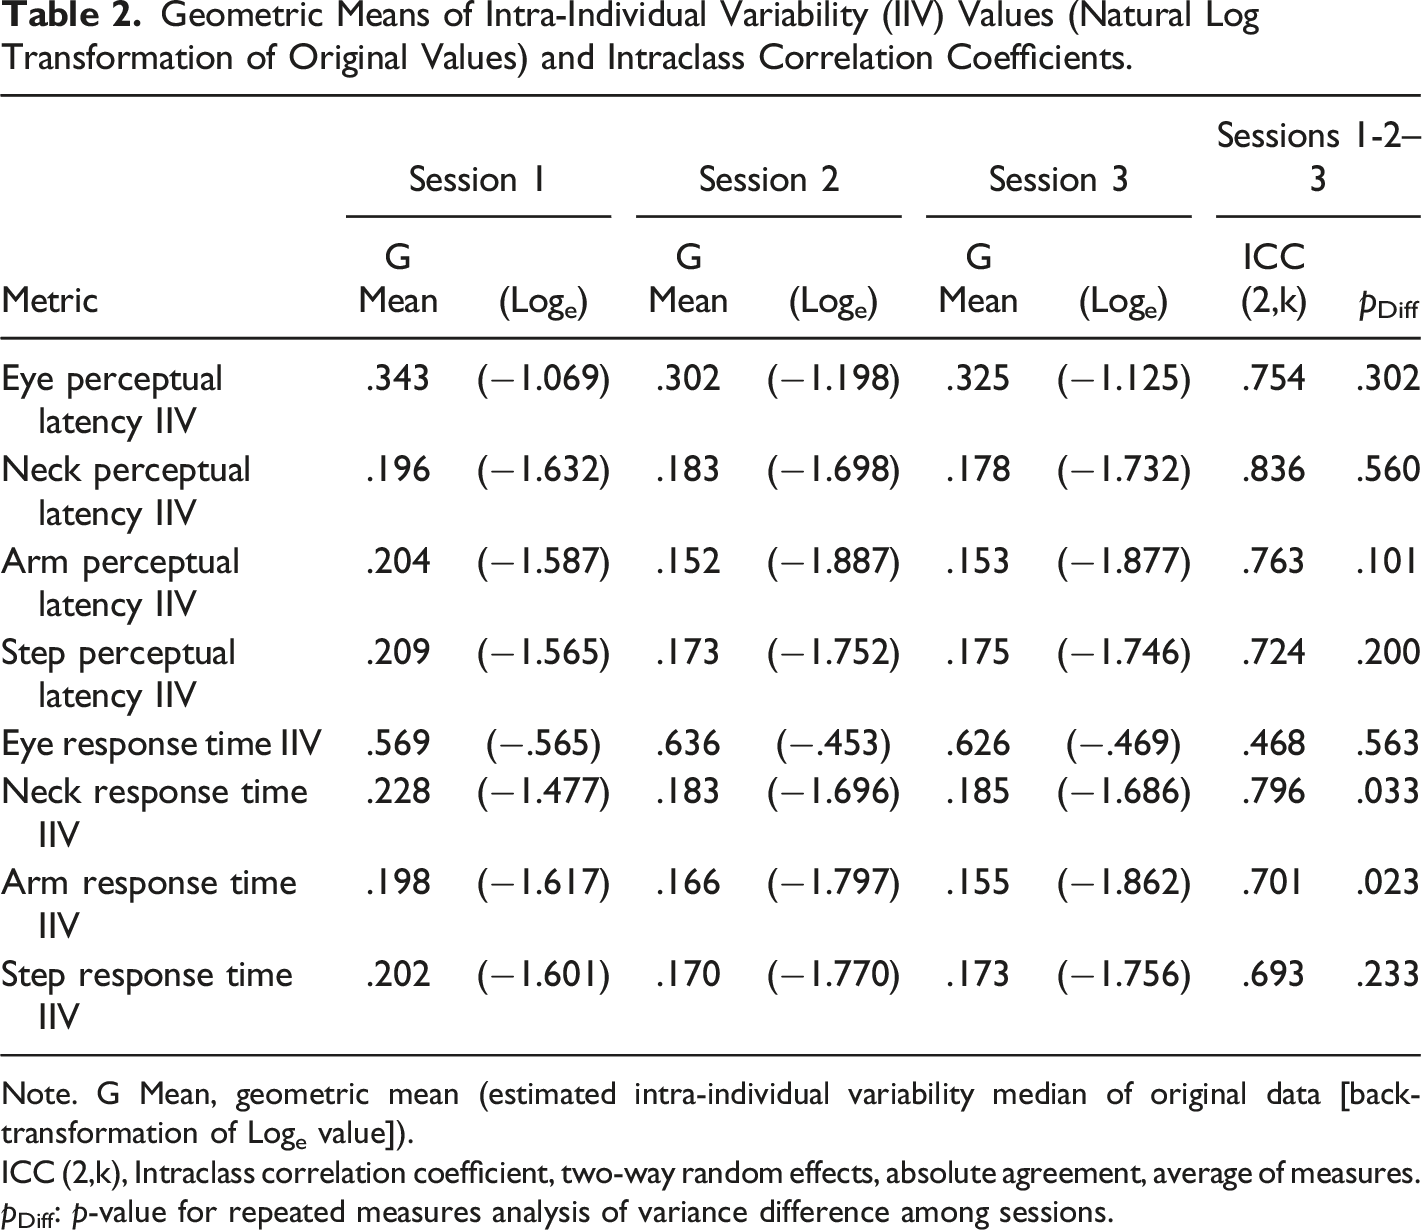
Note. G Mean, geometric mean (estimated intra-individual variability median of original data [back-transformation of Loge value]).
ICC (2,k), Intraclass correlation coefficient, two-way random effects, absolute agreement, average of measures.
pDiff: p-value for repeated measures analysis of variance difference among sessions.
Pairwise Comparisons of Natural Log Transformations of Original Mean Values.
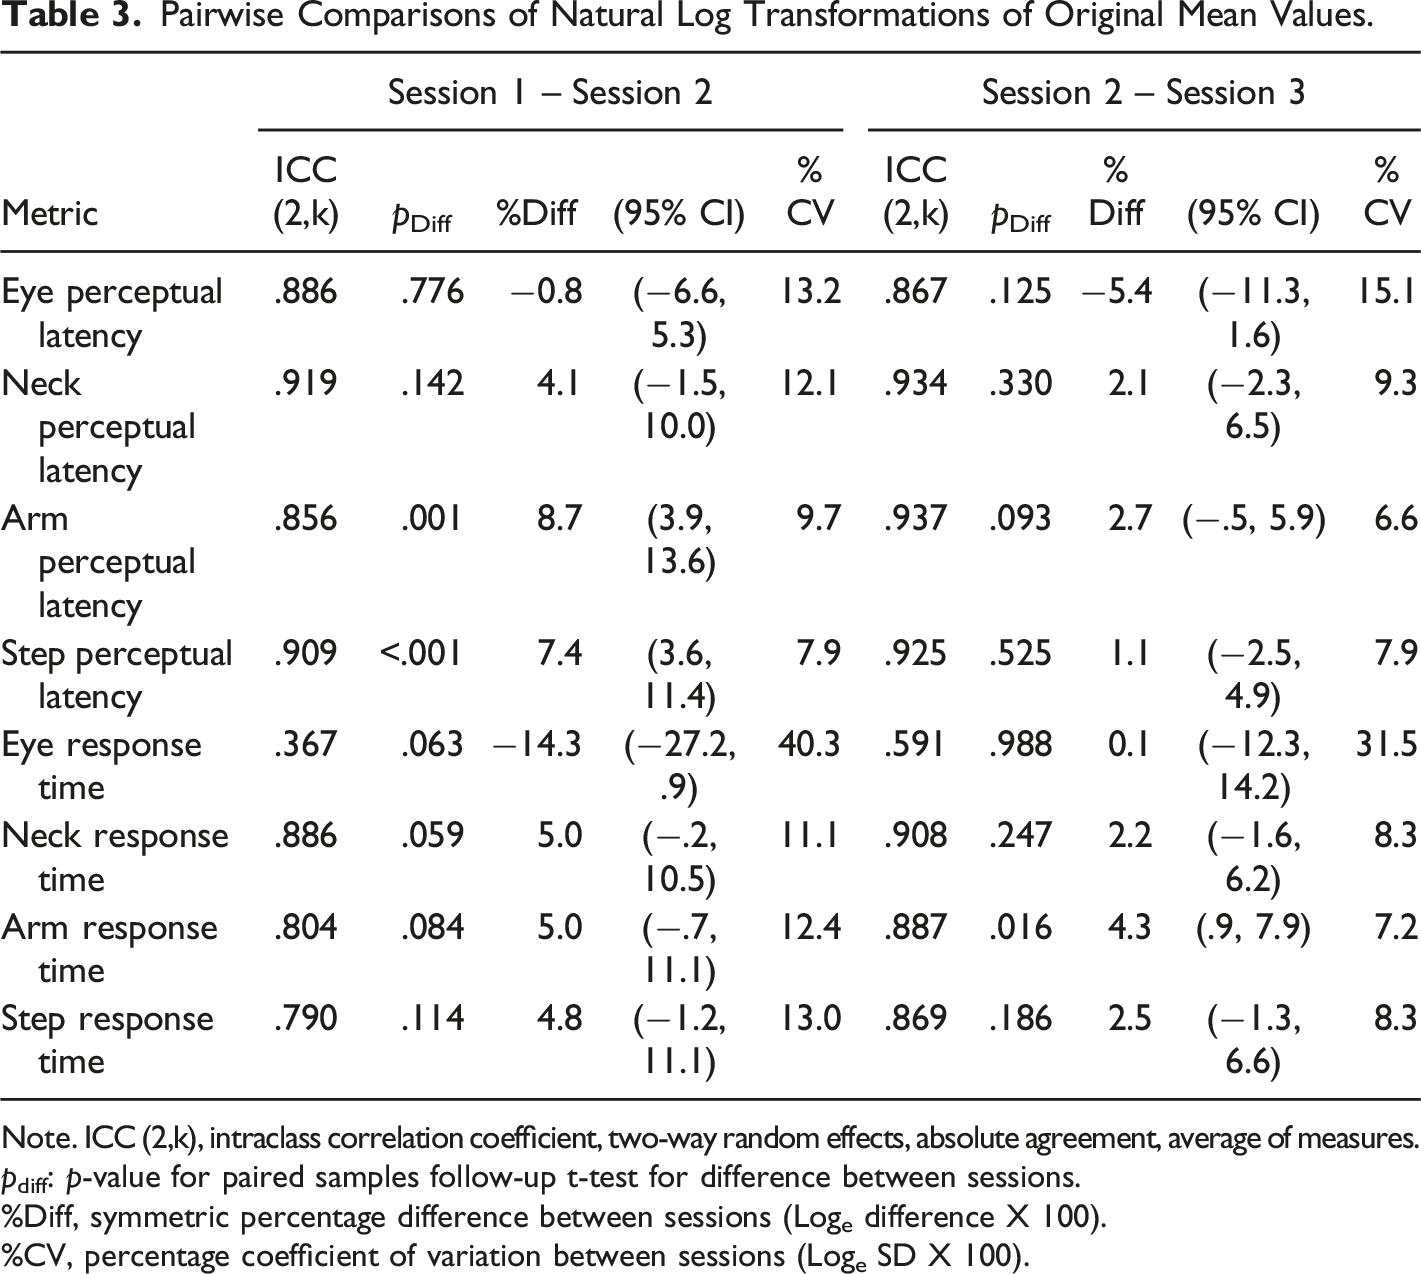
Note. ICC (2,k), intraclass correlation coefficient, two-way random effects, absolute agreement, average of measures.
pdiff: p-value for paired samples follow-up t-test for difference between sessions.
%Diff, symmetric percentage difference between sessions (Loge difference X 100).
%CV, percentage coefficient of variation between sessions (Loge SD X 100).
Pairwise Comparisons of Natural Log Transformations of Original Intra-individual Variability (IIV) Values.
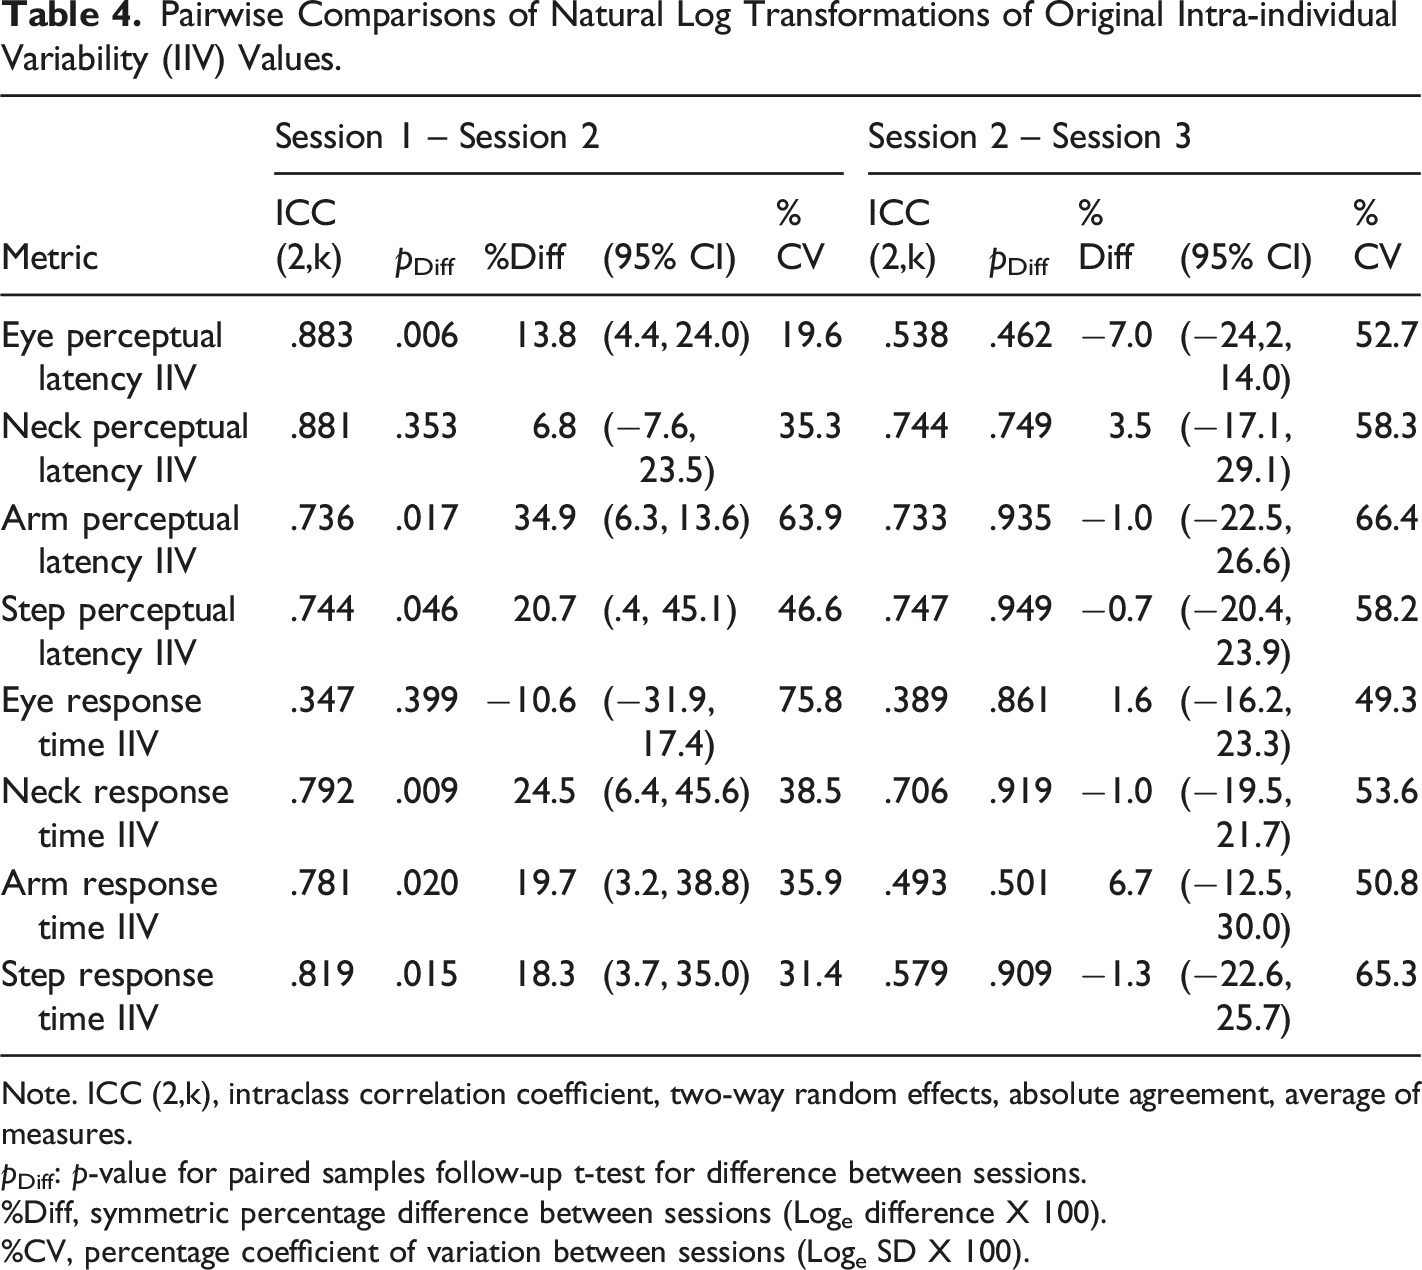
Note. ICC (2,k), intraclass correlation coefficient, two-way random effects, absolute agreement, average of measures.
pDiff: p-value for paired samples follow-up t-test for difference between sessions.
%Diff, symmetric percentage difference between sessions (Loge difference X 100).
%CV, percentage coefficient of variation between sessions (Loge SD X 100).
Rate Correct Score Mean Values, Intraclass Correlations, and Minimal Detectable Change Values.
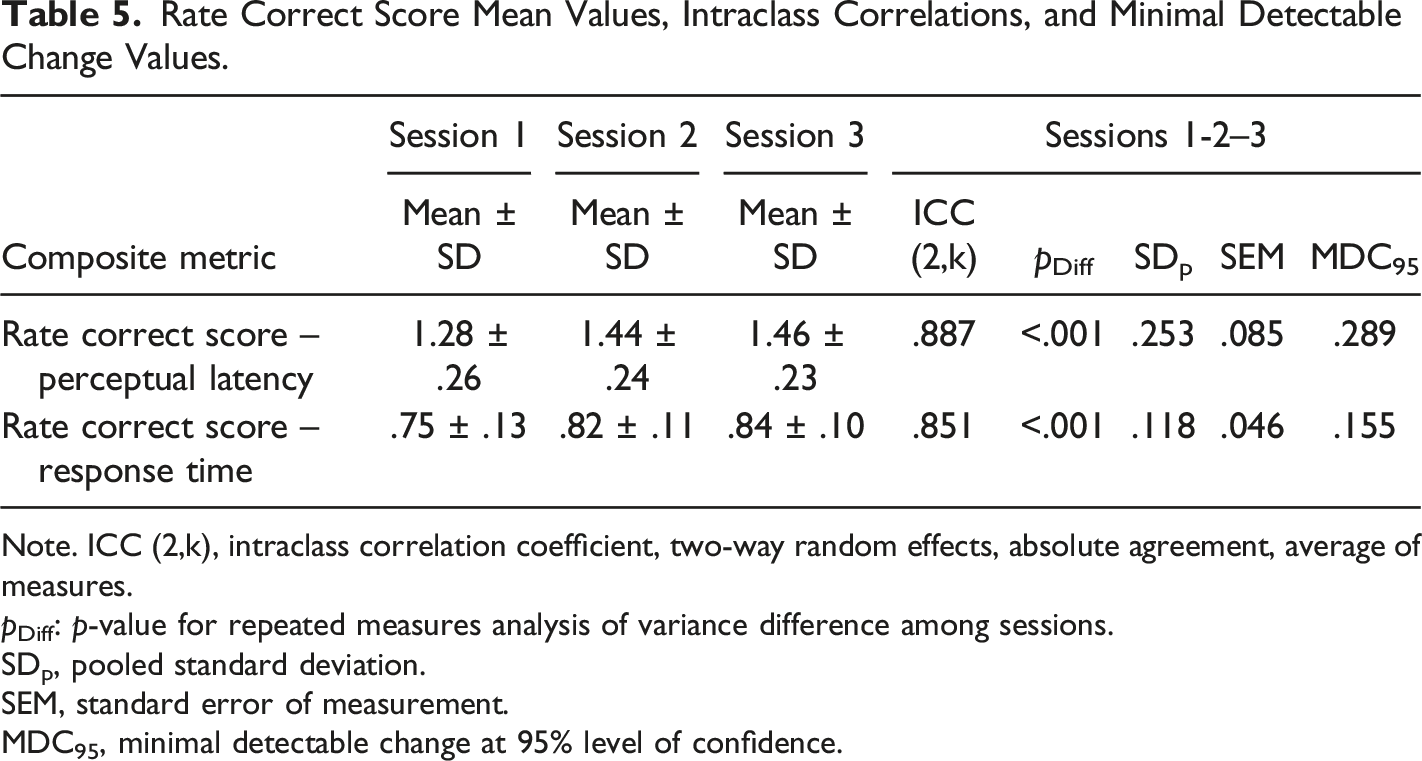
Note. ICC (2,k), intraclass correlation coefficient, two-way random effects, absolute agreement, average of measures.
pDiff: p-value for repeated measures analysis of variance difference among sessions.
SDp, pooled standard deviation.
SEM, standard error of measurement.
MDC95, minimal detectable change at 95% level of confidence.
Pairwise Session Comparisons of Rate Correct Score Mean Values, Intraclass Correlation Coefficients, and Minimal Detectable Change Values.
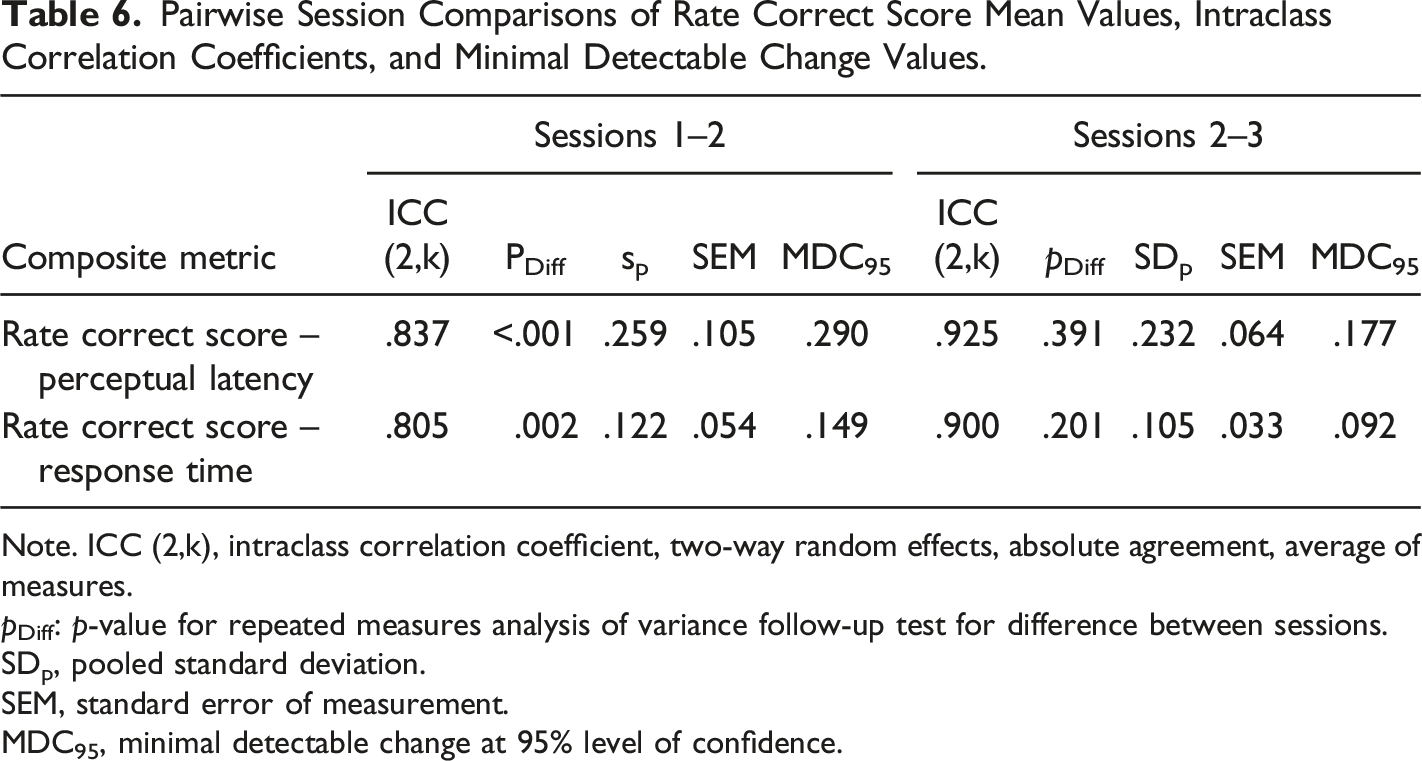
Note. ICC (2,k), intraclass correlation coefficient, two-way random effects, absolute agreement, average of measures.
pDiff: p-value for repeated measures analysis of variance follow-up test for difference between sessions.
SDp, pooled standard deviation.
SEM, standard error of measurement.
MDC95, minimal detectable change at 95% level of confidence.
Discussion
A unique aspect of our immersive VR test was simultaneous quantification of four different perceptual-motor responses (i.e., eye, neck, arm, and step) to eight different combinations of moving visual stimuli characteristics. Regarding test validity, our prior VR research demonstrated that a composite metric derived from multiple component measures had very good discriminatory power for distinguishing individuals with a remote history of concussion from those who denied ever having sustained such an injury (Wilkerson et al., 2023). Findings in this study further support clinical use of our VR test by documenting moderate to excellent test-retest reliability for numerous measurements. Our rationale for testing these healthy participants was to quantify the magnitude of performance fluctuations that are attributable to factors other than concussion or other clinical effects (e.g., sleep deprivation, stimulant use, overtraining, or daily stressors). We expect these data to establish a “normal” degree of performance inconsistency among healthy examinees; this is likely to be greater among patients experiencing the adverse effects of a concussion (Broglio et al., 2007).
Pfister et al. (2023) recommended evaluating a diverse set of measures of complex perceptual motor movement as a means of gaining an improved understanding of relationships between cognitive processes and motor behavior). Separating an estimated PL interval from the overall task RT distinguishes the duration of primarily visual detection and decision-making processes from the total amount of time required to complete a movement response after visual stimulus appearance. Although PL may be most relevant to the efficiency of brain information processing, RT can provide an important representation of the overlap between decision-making, motor planning, and response execution. Measures of brain processing speed derived from other perceptual-motor tests are known to exhibit skewed distributions that deviate from normality in proportion to the difficulty of the decision-making process that links perceptual detection of a stimulus and response execution (Marmolejo-Ramos et al., 2015). Distributional skewing of both RT and IIV measures are also known to be sensitive to disruption of white matter integrity, which is most likely to be revealed by complex attention-demanding tasks (Jackson et al., 2012).
In this study, the composite RCS metrics for both PL and RT demonstrated good to excellent reliability, which supports their value as numeric representations of speed-accuracy trade-off. Diminished response inhibition (i.e., impulsivity) has been shown to be a behavioral manifestation of white matter disruption that often results in fast and inaccurate responses to stimuli (Goswami et al., 2016; Shen et al., 2020). Prior research has found RCS to yield an integrated effect size that accounts for a larger proportion of variance than that provided separately by the component measures used for its calculation (Vandierendonck, 2017), and it has been shown to approximate a normal distribution more closely than either of its component measures (Woltz & Was, 2006). Furthermore, composite metrics may be more sensitive than a single raw measure for detection of subtle early changes in cognitive abilities (Jonaitis et al., 2019). Higher ICC values for sessions 2 to 3 compared to sessions 1 to 2 clearly indicate that an RCS learning effect occurred, which might be addressed by providing a more thorough practice session prior to administration of the first test used for data acquisition.
Logarithmic transformation for improved distribution normality of both mean and IIV data is appropriate for test-retest reliability assessment (Dunlap et al., 1994; Olivier & Norberg, 2010), but it complicates interpretation of some aspects of the analysis results. Although Loge transformation precludes calculation of statistics that require a sample SD, back-transformation of mean values provides estimated median values for the original data that can be used to compare session-to-session changes (Lee, 2020). In this study, most 3-session ICC values for mean PL and RT were good to excellent (7 of 8), whereas the majority for IIV of PL and RT were moderate to good (7 of 8). Despite mean PL and RT having demonstrated better reliability than IIV of PL and RT, the latter measures appear to provide adequate reliability, and they may be more sensitive to subtle change in cognitive function (Jonaitis et al., 2019). An inverse association between brain signal variability and trial-to-trial IIV of RT has been documented in healthy individuals (Grady & Garrett, 2018), as has an inverse association with both IIV of RT and response accuracy among patients with a history of traumatic brain injury (Beharelle et al., 2012).
Very recent research has confirmed that brain signal variability optimizes information exchange among distributed network components (Baracchini et al., 2021), and that disrupted connectivity is likely due to microscopic damage within white matter tracts (Wong et al., 2023). Furthermore, clinical testing that measures responses to congruent and incongruent visual stimuli has been shown to yield mean RT and IIV of RT measures that associate with resting state functional connectivity patterns among female college athletes (Roberts et al., 2022). Intra-individual variability has been conceptualized as either “inconsistency” across successive task trials or “dispersion” of standardized scores for multiple cognitive tasks that differ somewhat from one another (Costa et al., 2019; Holtzer et al., 2008). Because the VR test we used included eight different combinations of stimulus types, initial location, and movement direction that required activation of different neural circuits, the 40-trial IIV (i.e., intra-individual SD) incorporated aspects of both trial-to-trial inconsistency and dispersion among values for trials with different characteristics.
Limitations and Directions for Further Research
We observed the poorest pairwise ICC values between sessions (i.e., 1– 2 and 2–3) for mean RT and IIV of RT for eye movements, which ranged from .347 to .591. Inadequate continuous tracking of eye position may have contributed to the low values, as well as the reversal of eye movement direction required by some stimulus-response combinations. Because neck rotation toward the correct target location could permit its visualization with a lesser amount of eye rotation, differing relative amounts of eye and neck rotation on different trials may have contributed to low test-retest reliability. Interestingly, both pairwise ICC values for mean PL were good (.886 and .867), as well as the sessions 1 to 2 ICC for IIV of PL (.883). Previous research has demonstrated an association between inconsistency of eye movements in response to moving visual stimuli and incidence of head impacts during participation in high school ice hockey, which suggests that efficient eye movements may contribute to collision avoidance (Kiefer et al., 2018). If using VR to assess change in eye responses to visual stimuli, the results of this study suggest that eye PL (i.e., stimulus appearance to 6 degrees of angular displacement) provides better reliability than eye RT (i.e., stimulus appearance to maximum angular displacement).
The primary limitation of this study was our use of a convenience sample that included only 9 male and 10 female graduate students. Although an ICC value for a given test measure can depend on the characteristics of the participants included in the analysis (Weir, 2005), our findings included responses from 17 former competitive athletes that probably have good generalizability to other groups of healthy, competitive young adults. Despite the relatively small sample size, the ICC (2,k) model specification included systematic variance from session to session and imposed a stringent standard for absolute agreement of measures. One-day intervals between test sessions were chosen to obtain a precise estimate of a short-term learning effect. A much longer interval between test sessions would be needed to assess retention or decline of performance capabilities among athletes who have recently sustained a concussion, which may enhance interpretation of change between a pre-participation screening test and a subsequent post-injury evaluation, or assessment of post-injury recovery rate.
Test-retest reliability is an important consideration for selection of a test measure to use for clinical assessment, but a measure that exhibits excellent reliability is not necessarily the most valid indicator of a suboptimal or dysfunctional state (Jonaitis et al., 2019). Thus, these results must be complemented by separate validity research that establishes associations of specific perceptual-motor test measures with other clinically meaningful measures or categorizations of an individual’s health status or functional capabilities. Future research to validate use of these VR metrics for assessment of acute concussion effects should include both injured patients and healthy participants.
Conclusion
Numerous measures of perceptual-motor performance derived from an immersive VR system demonstrated good to excellent test-retest reliability values among healthy graduate students who were tested on three consecutive days. A learning effect was evident for mean PL and RT measures between session 1 and session 2, which was diminished between session 2 and session 3. Reported values for the SEM and MDC95 of the RCS metric for integrated representation of speed-accuracy trade-off provide a basis for estimation of meaningful change between testing sessions. The results of this study affirm the suitability of the immersive VR test for clinical use, but further research is needed to validate it for specific applications, such as assessment of improved or worsened status immediately following diagnosis of a concussion.
Supplemental Material
Supplemental Material - Test-Retest Reliability of Immersive Virtual Reality Measures of Perceptual-Motor Performance
Supplemental Material for Test-Retest Reliability of Immersive Virtual Reality Measures of Perceptual-Motor Performance by Gary B. Wilkerson, Jonathan C. Lansey, Courtney N. Noblett and Caroline E. Sarris in Perceptual and Motor Skills
Footnotes
Declaration of Conflicting Interests
The author(s) declared the following potential conflicts of interest with respect to the research, authorship, and/or publication of this article: GBW serves as a consultant and JCL is employed as Data Science Lead for REACT Neuro (Cambridge, MA), which supplied the virtual reality equipment used to acquire the study data.
Funding
The author(s) received no financial support for the research, authorship, and/or publication of this article.
Supplemental Material
Supplemental material for this article is available online.
Author Biographies
References
Supplementary Material
Please find the following supplemental material available below.
For Open Access articles published under a Creative Commons License, all supplemental material carries the same license as the article it is associated with.
For non-Open Access articles published, all supplemental material carries a non-exclusive license, and permission requests for re-use of supplemental material or any part of supplemental material shall be sent directly to the copyright owner as specified in the copyright notice associated with the article.