
Abstract
Introduction
Past research has supported the view that sports teams tend to perform better when playing at home, where they have a statistically higher chance of winning than does the away team. This phenomenon, referred to as home advantage (HA), has been found across different sports (Pollard & Stefani, 2021), countries (Pollard & Gómez-Ruano, 2021), time periods (Gómez-Ruano & Pollard, 2021), and levels of competition (Leite & Almeida, 2021). Crowd support, turf familiarity, travel, and referees are the most common explanatory factors for HA (Pollard & Pollard, 2005), as they have been shown to be associated potential influencers of the athletes’ play, the coaches’ activities, and the teams’ technical, tactical, and mental performance in competition, and referee behavior (Lago-Peñas, 2021; Pollard & Pollard, 2005). Extensive research in soccer has shown a significant statistical HA effect on game outcome. Most soccer studies have focus on professional play, with less known about other levels of competition and player age groups. NCAA Division 1 (D1), the highest level of college soccer in the Unites States, makes up a distinct age group of student-athletes typically aged between 18 and 22 years old. NCAA D1 play is has a distinct competition format in which college teams must collect wins throughout the regular season to reach end-of-season playoffs (NCAA, 2021). Their match confrontations change each season, and home and away matches are not necessarily balanced. In this competition, teams can also establish part of their schedule according to their best interests. College soccer is an amateur sport in which teams’ travel conditions change, teams play 15-20 games in three and a half months, and the game environment changes a lot between different venues. College programs with higher budgets have higher performances (Jones, 2013) and better resources (facilities and travel conditions), which are aspects that may impact home advantage. However, it is not clear how the competition strength of a team affects any HA and if any HA changes for different types of match confrontations.
The existence of the HA effect in professional soccer has been well-established, with an above average percentage of points won at home. For instance, there was an average HA effect of 62.3%. In the American Major League Soccer (Pollard & Gómez, 2015). There have been varied explanations, including but not limited to (a) the effects of the home crowd on players of both teams as well as on the referees (Avugos & Bar-Eli, 2021); (b) the home team’s greater familiarity with the setting and playing conditions, including facilities, temperature, or altitude (Wunderlich et al., 2021); and (c) changes in technical and tactical play, with the home team playing more offensively (Lago-Peñas, 2021). How much and why each factor contributes to HA is still disputed, but likely to be related to an interaction of several psychological and physiological factors. The skill level of the teams could also affect HA, but more evidence and research in this area are needed.
HA has not been clearly established in collegiate sports, but may be even greater in most college sports (Leite & Almeida, 2021) due to more vocal and hostile crowds, weaker referee skills, interrupted pregame player routines (including nutrition and sleep), players’ psychological differences, and more heterogenous playing conditions (Pollard & Gómez, 2015). Investigations of field surfaces and dimensions of different also suggested that larger fields could also increase HA for some teams (Sendin-Castelao, 2020). While the HA effect in collegiate soccer is still apt to be significant, the effect may be smaller than for professional soccer, possibly due to a significantly smaller crowd attendance and higher coach interventions (Pollard & Gómez, 2015). Also, while there seems to be a decline in the HA effect in professional sports (Pollard & Gómez-Ruano, 2021), this does not seem the case for collegiate sports (Leite & Almeida, 2021). Regarding the technical-tactical performance indicators, previous research has shown home teams tend to play with a more offensive style and away teams tend to play with a more defense style (Lago-Peñas, 2021). However, this trend can be influenced by the quality of the opponent (Gómez-Ruano et al., 2018). To our knowledge, there is not information about how the type of quality of opponent (type of game confrontation) influences the home-advantage effect and the technical-tactical match performance indicators.
There has been little specific HA research in NCAA D1 soccer, which has its own characteristics, rules, and format. Particularly, there is little information relating the HA effect to team quality in college soccer, partly because some important factors could not be included, as, for example, differing travel budgets and distances traveled, two games per week, different stressors among student-athletes, an unusually short season (August-November), or imbalanced team schedules with only one matchup per season with a given team and alternating years of playing home and away with a given team. Coaches are able to schedule additional non-conference games and game locations (home, away, and neutral) to slightly modify the schedule. To generate a better understanding of HA, researchers can use a team’s winning percentage to estimate a team’s quality and to group teams accordingly. Our hypotheses are (a) that there is HA effect in college
Method
Participant Data Sample
Our data sample was comprised of team and game statistics for all 39,393 NCAA Division 1 men’s soccer matches for the 10-year period from the 2010-2011 season to the 2019-2020 season (19,571 home games, 2382 games in neutral locations, and 17,440 away games). The games played in neutral locations were analyzed separately, due to the fact they were away games for both teams. This data sample includes all matches played by all teams, including conference, non-conference, conference tournament, and national tournament games. The matches were played by ≅ 212 different teams (varying slightly each season). The variables we studied were obtained from the official reports of each match published for open access by the National Collegiate Athletic Association (NCAA) and extracted from the tournaments and archive sections of the NCAA Web site (https://stats.ncaa.org).
Research Design and Study Variables
We utilized a non-experimental retrospective observational research design. Our variables of interest were the game result (win, lose or tie), game location (home, away or neutral), team winning percentage, team winning percentage level (high level, mid-level, or low level), type of match confrontation (team match-ups of levels 1vs1, 1vs2, 1vs3, 2vs2, 2vs3, and 3vs3), team home points, team goals, opponent team points, opponent team goals, team assists, team shot attempts, team shots on goal, team efficacy (percentage of shots scored), team penalties, team corner kicks, team fouls, team red cards and team yellow cards. To calculate the team winning percentage, we awarded the team with a win a score of 1, a team with a tie a score of .5, and a team with a loss a score of 0. The points were then added up and divided by the team’s number of total games. We determined the winning percentage team level using the team’s winning percentage and ranking teams into three groups on the basis of the 33rd and 66th percentile (high level, mid-level, or low level). We quantified team home points advantage as the number of points won at home, and we expressed this value as a percentage of the total number of points won at home and away (Pollard, 1986).
Procedures and Statistical Analyses
We transferred information from the match reports to a spreadsheet and debugged and verified the data by performing a descriptive analysis of the results, visual representations and random reviews of the data entered. To establish the reliability of a match report, one researched observed five matches from different seasons. The observer had master’s degrees in Sport Science and more than five years of experience with sports analytics in soccer. The observation relied upon Lince Plus software (Soto-Fernández et al., 2022). We calculated inter-rater reliability between the observer and the NCAA official report using Cohen’s Kappa for the categorical variables and we used an intraclass correlation coefficient (ICC) for the continuous variables. All the variables studied had an ICC value of 1.
The unit of analysis was the match per team for analyzing the percentage of home, away and neutral games results and the game statistics. The unit of analysis was the season for analyzing the team home points advantage. We used a Chi-square test to study the percentage differences between winning and losing according to the location of the game, and the game statistics according to the location of the game. We used one-way analyses of variance (ANOVA) to study the differences between team levels and match confrontation types for the home points advantage. To analyze differences according to the type of match confrontation and game location for the home points advantage, we performed a paired sample t test pair. To establish the technical-tactical performance indicators that discriminate winning and losing according to the game location, we used a multivariate discriminant analysis (eigenvalue, Wilks’ Lamba, canonical coefficients, chi-square, and reclassification). The threshold for the variables was established when the standardized structural coefficient was above 0.30. The reclassification values were calculated to establish in which percentage of cases these variables allow us to predict the match outcome. We set statistical significance level at p < .05. The effect size was established with the partial eta square value (one-way ANOVA and paired sample t test) and phi value (chi-square test). The following scale was used to assess partial eta square value (effect size): no effect (<0.20), small (0.20–0.49), medium (0.50–0.79), large (0.80–1.19), and extra-large (>1.2) (Sawilowsky, 2009). The following scale was used to assess the Cramer’s V phi value scale (effect size): N = no effect (<0.10) S = small (0.10–0.29) M = medium (0.30–0.49) and high (>0.50) (Cohen, 2013). All analyses were conducted using the Statistical Package for the Social Sciences (IBM Corp Released, 2021. IBM SPSS Statistics for Windows, Version 28.0. Armonk, NY: IBM Corp).
Results
Percentages of Home, Neutral and away Games That Resulted in Wins in Relation to Team Skill Levels in NCAA Division I Men’s Soccer (2010–2011 to 2019-2020 Seasons).
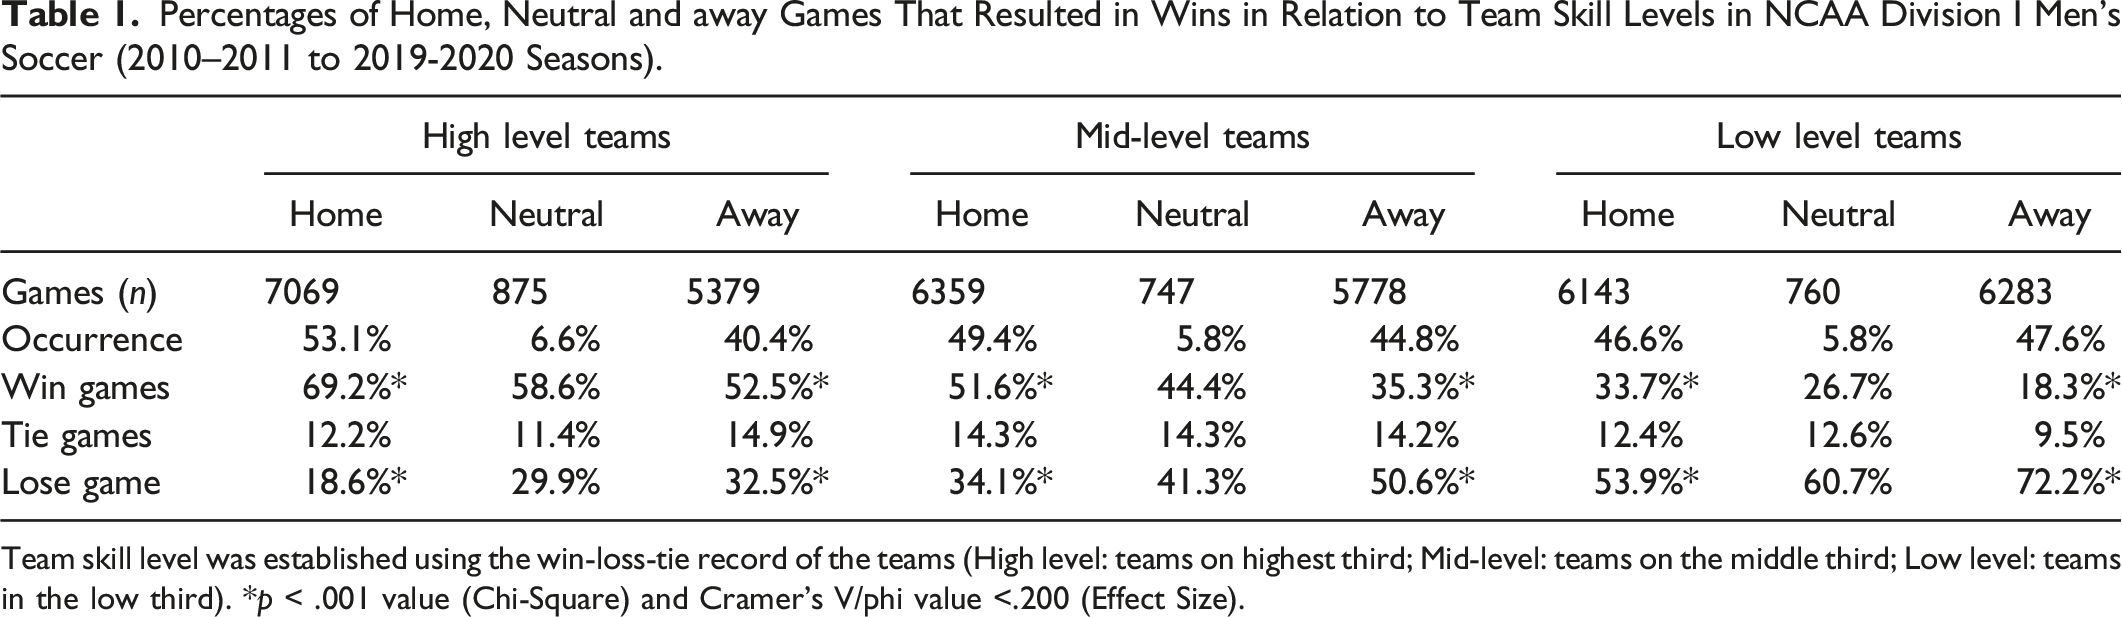
Team skill level was established using the win-loss-tie record of the teams (High level: teams on highest third; Mid-level: teams on the middle third; Low level: teams in the low third). *p < .001 value (Chi-Square) and Cramer’s V/phi value <.200 (Effect Size).
Percentage of Home, Neutral and away Games That Results in Win in Relation to the Team Skill Levels in NCAA Division I Men’s Soccer (2010–2011 to 2019-2020 Seasons).
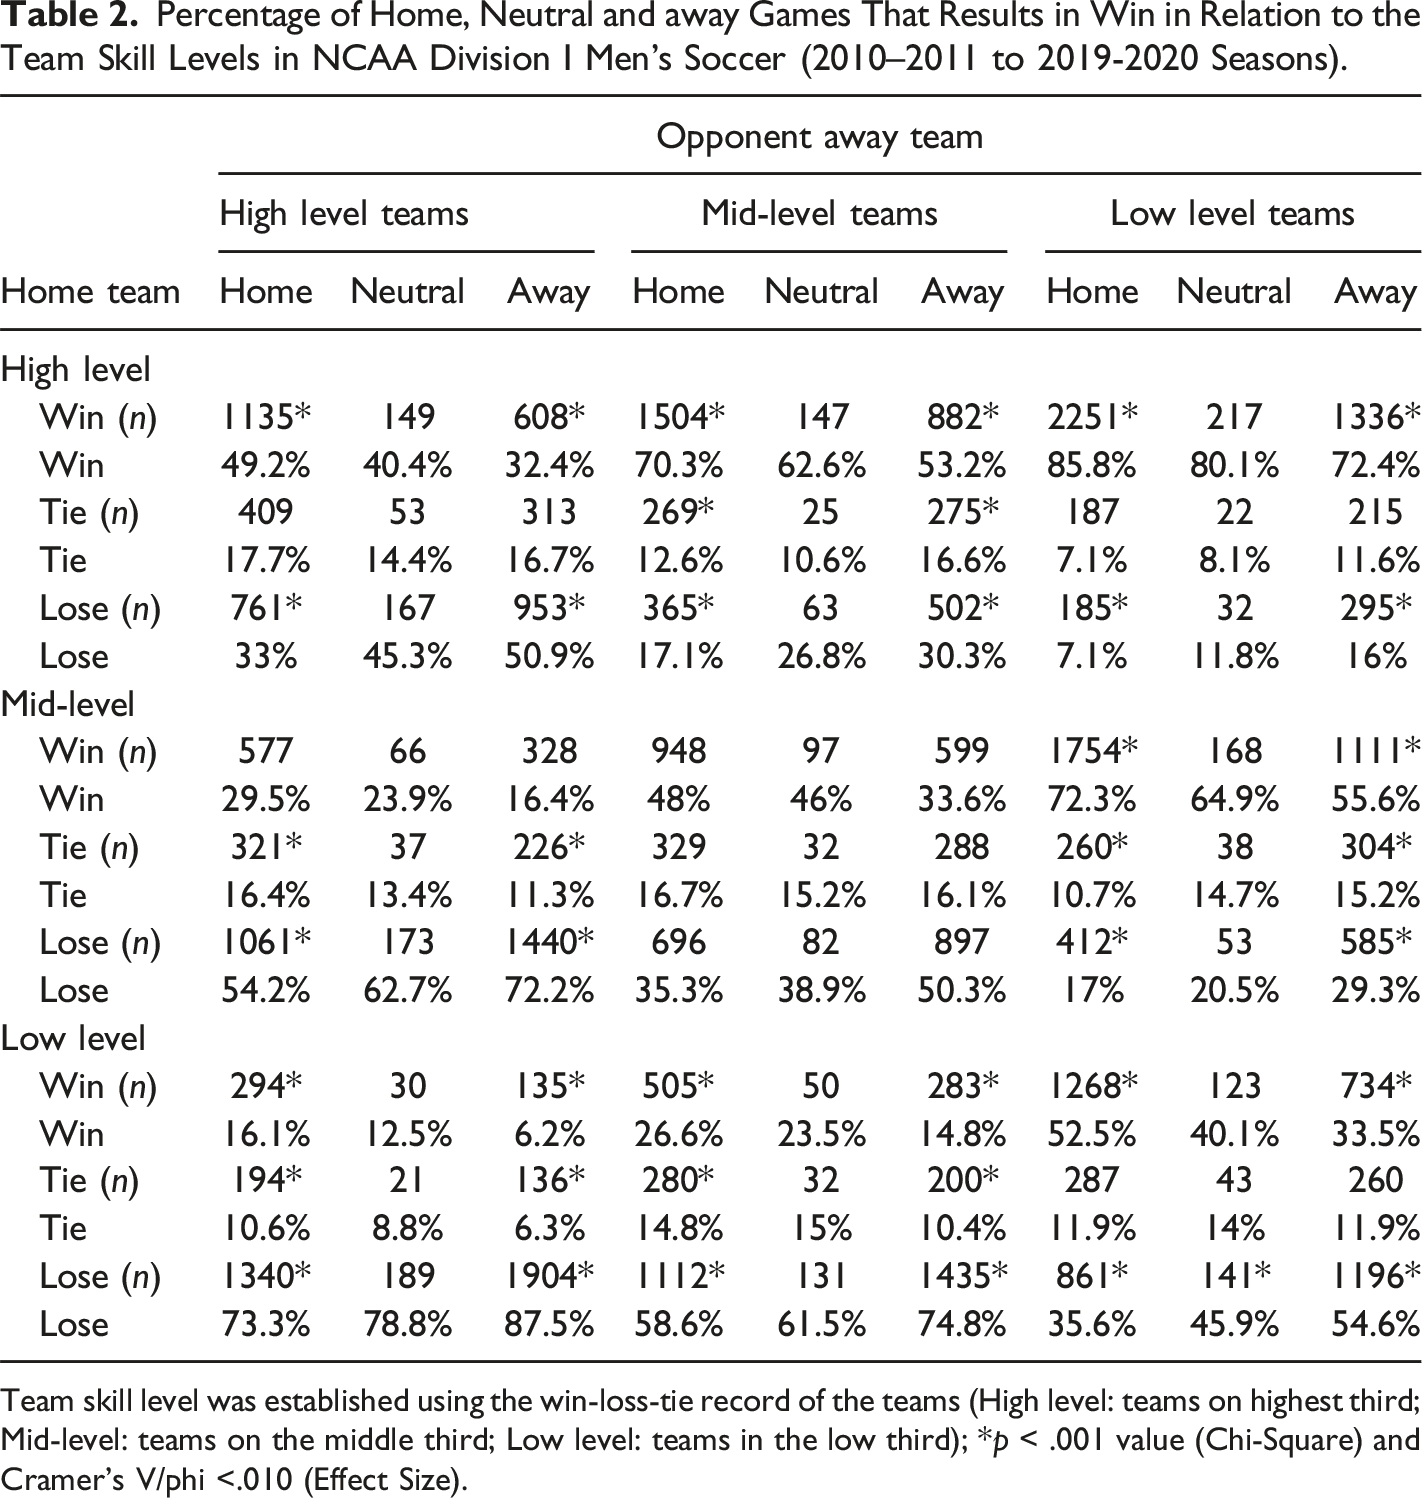
Team skill level was established using the win-loss-tie record of the teams (High level: teams on highest third; Mid-level: teams on the middle third; Low level: teams in the low third); *p < .001 value (Chi-Square) and Cramer’s V/phi <.010 (Effect Size).
Home Points Advantage in Relation to the Team Skill Levels and Match Confrontation Types in NCAA Division I Men’s Soccer (2010–2011 to 2019-2020 Seasons).
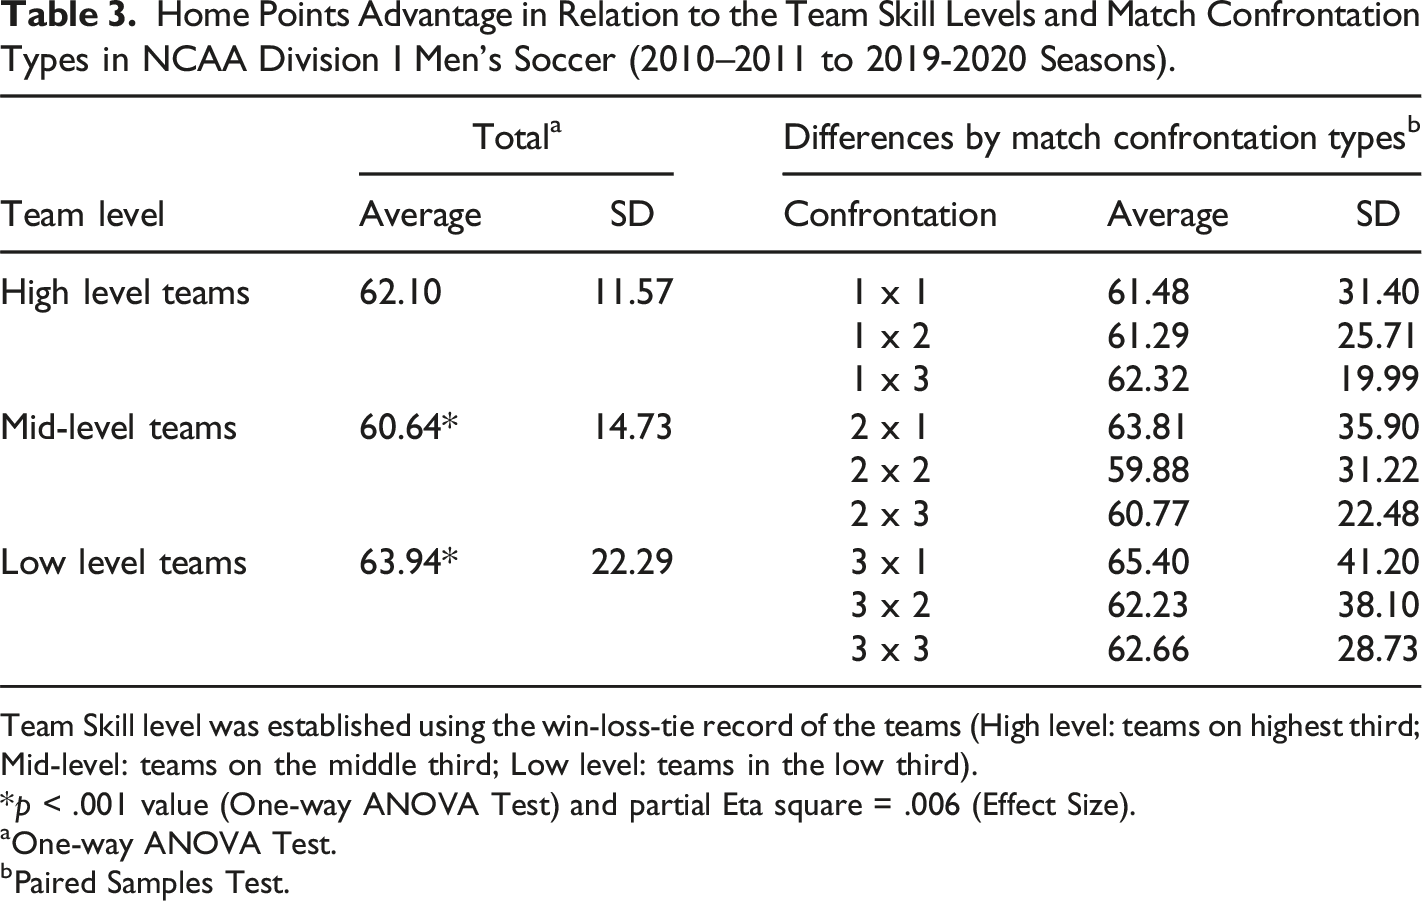
Team Skill level was established using the win-loss-tie record of the teams (High level: teams on highest third; Mid-level: teams on the middle third; Low level: teams in the low third).
*p < .001 value (One-way ANOVA Test) and partial Eta square = .006 (Effect Size).
aOne-way ANOVA Test.
bPaired Samples Test.
Game Statistics of Home, Neutral and away Games in Relation to the Team Skill Levels in NCAA Division I Men’s Soccer (2010–2011 to 2019-2020 Seasons).
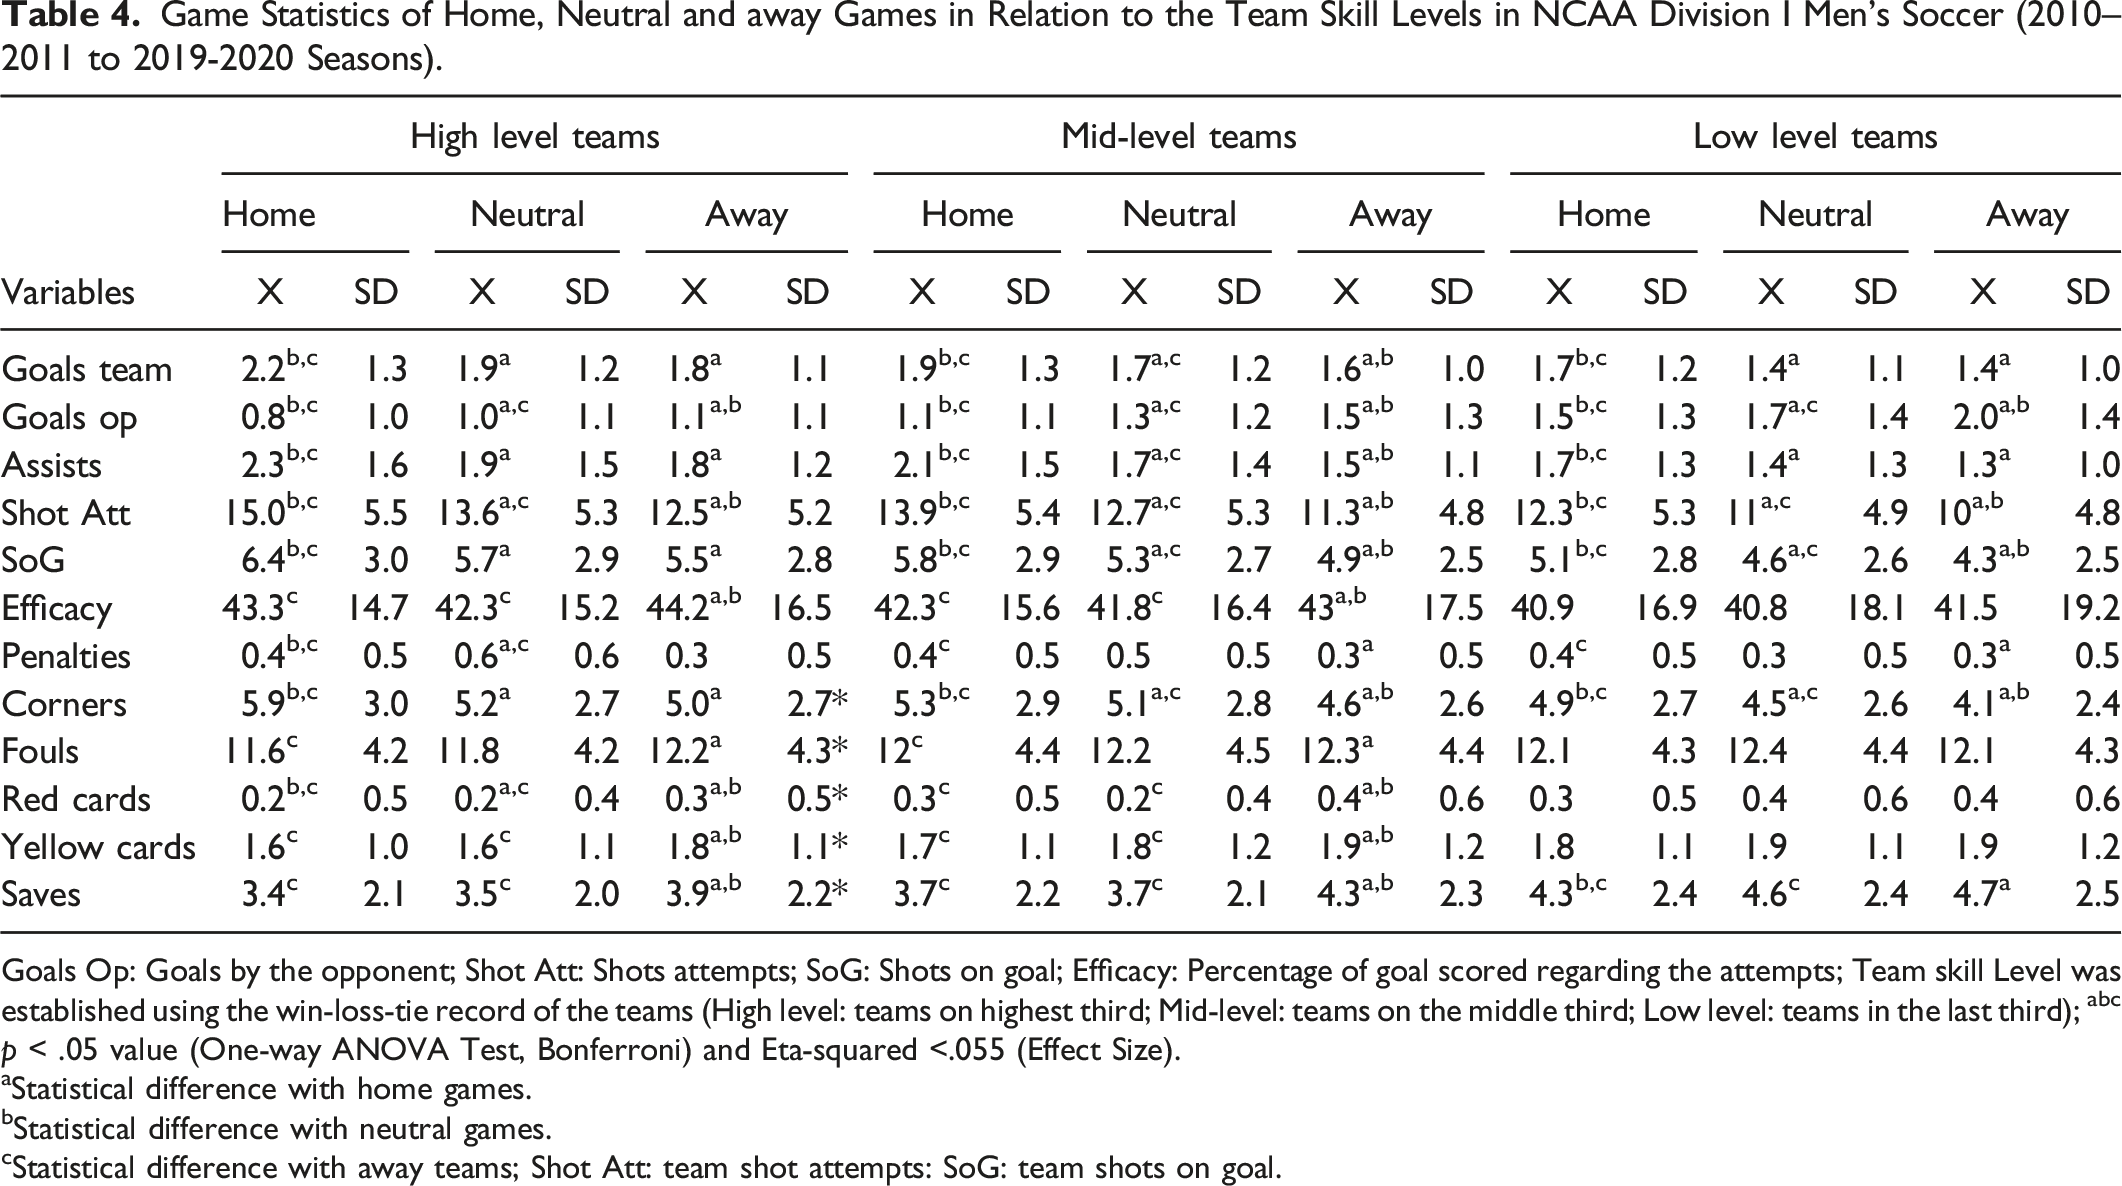
Goals Op: Goals by the opponent; Shot Att: Shots attempts; SoG: Shots on goal; Efficacy: Percentage of goal scored regarding the attempts; Team skill Level was established using the win-loss-tie record of the teams (High level: teams on highest third; Mid-level: teams on the middle third; Low level: teams in the last third); abc p < .05 value (One-way ANOVA Test, Bonferroni) and Eta-squared <.055 (Effect Size).
aStatistical difference with home games.
bStatistical difference with neutral games.
cStatistical difference with away teams; Shot Att: team shot attempts: SoG: team shots on goal.
Multivariate Discriminant Analysis of Win, Tie and Loss in Home, Neutral, and away Games in Relation to the Team Skill Levels in NCAA Division I Men’s Soccer (2010–2011 to 2019-2020 Seasons).
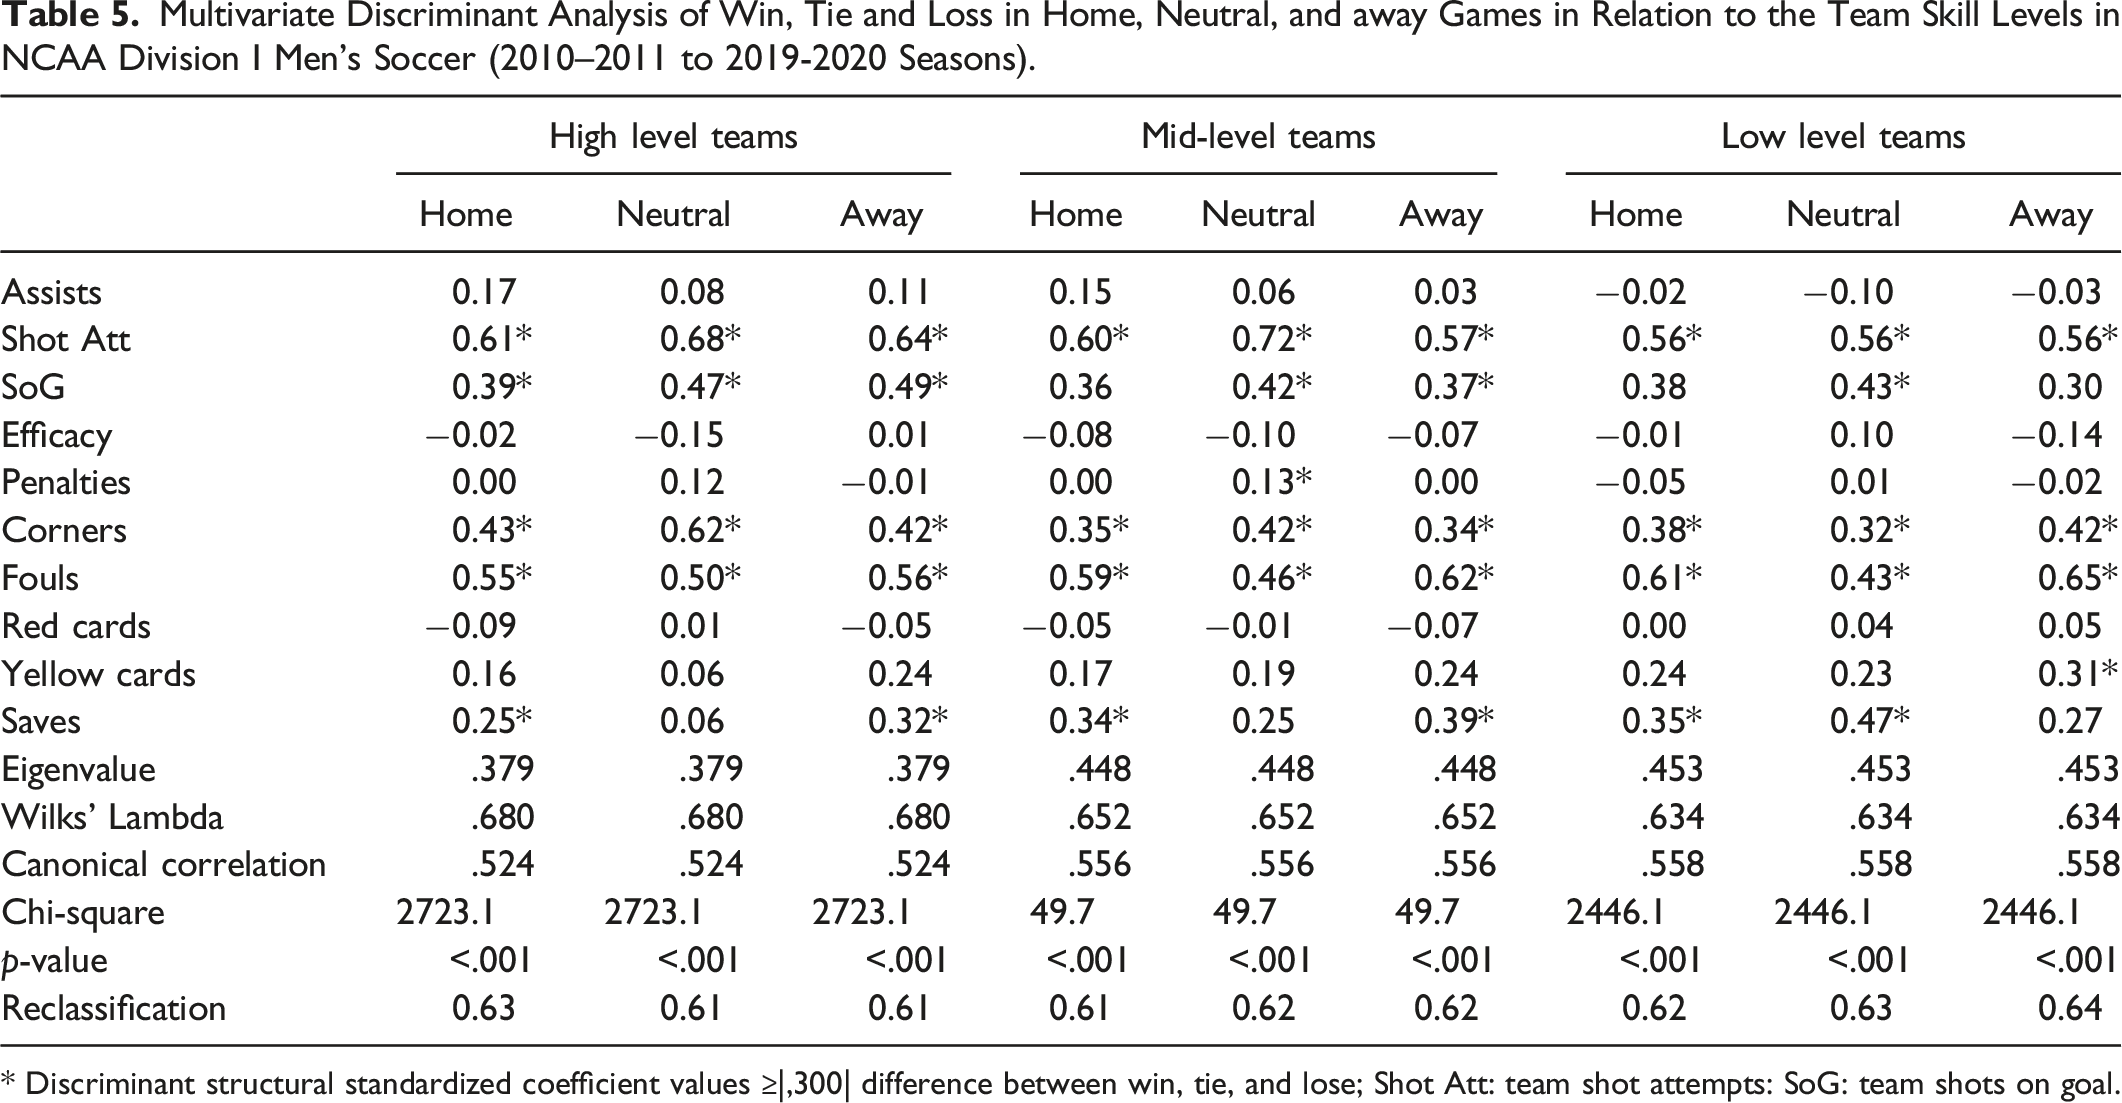
* Discriminant structural standardized coefficient values ≥|,300| difference between win, tie, and lose; Shot Att: team shot attempts: SoG: team shots on goal.
Discussion
The goal of this study was to check our hypotheses that home advantage (HA) effect occurs in collegiate men’s soccer (NCAA D1), regardless of the level of the team or match confrontation type and, further, that home teams have more offensive technical-tactical indicators and away teams more defensive technical-tactical indicators. Data from ten seasons (2010–2019) supported the home advantage effect. Games played at home resulted in a win more frequently (and in a loss less frequently) than games played away. Moreover, this was true regardless of the level of the team. High-level, mid-level, and low-level teams, all performed better at home than away. The fact that neutral games did not result in any significant differences further supports the notion of the HA-effect. Lower-level teams had a significantly higher home points advantage than mid-level teams. These results could relate to the fact that programs plan part of their competition schedule. Teams with lower win-loss-tie records may add games against opponents for whom they have greater chances of winning (i.e. of a similar level or lower divisions of competition) to their home schedule. This aspect could be considered a specific characteristic of this competition. More research is needed to confirm this hypothesis about the schedule. It is also possible that lower-level teams focus more on preparation for their home games, and they are more motivated to beat higher-level teams. These two aspects, scheduling and game preparation, could be some of the causes behind the higher HA effect found by previous studies at the college level (Leite & Almeida, 2021). The findings may also show that teams with better win-loss records (and usually with higher budgets (Jones, 2013)) do not have a higher home advantage effect.
While the HA-effect can be affected by several psychological and physiological factors, this study particularly displayed tactical variances that contribute to HA. When considering game statistics while playing at home, teams tend to play in a more attacking manner and with a more offensive playing style. Thus, teams had more shot attempts, shots on goal, and corner kicks, resulting in more goals and assists. In contrast, teams playing away had more team fouls, team yellow cards, and team red cards. This suggests a more defensive and destructive playing style. The changes in game dynamics cannot be explained by the level of the opponent as all these differences were apparent for all team levels. Interestingly, despite having fewer shot attempts, teams playing away demonstrated better efficacy. This could also be due to their defensive playing style. When focusing on defense first and relying more heavily on counter attacks, teams will often have fewer but higher quality goal-scoring opportunities (Fernandez-Navarro et al., 2016).
The discriminant analysis did not demonstrate differences between playing at home, away, or at a neutral site for the different levels studied. Teams with more shot attempts, fouls (likely to control the game), and corner kicks were more successful. However, the classification model allowed us only to establish the outcome of 60–65% of the matches. These results matched previous studies in senior men’s professional soccer teams (Castellano et al., 2012; Lago-Peñas et al., 2010; Mao et al., 2016). These findings may demonstrate there is no specific set of technical-tactical performance indicators affected by the home advantage effect. It appears different teams adapt their game style in different ways depending on game location. However, studies that analyze the game styles in U.S. college competitions are needed to confirm this hypothesis (e.g., Fernandez-Navarro et al., 2019).
Analyzing the occurrence of wins and losses showed consistent results, regardless of the strength of the team and the match confrontation type. There were consistently better performances at home than away (more wins and less losses). However, interesting observations can be made regarding ties, as they can possibly be seen as either good or bad. The study showed that teams had fewer ties at home than away but only when playing weaker teams. This might be due to the fact that a tie against a weaker team could be considered more negative when playing at home than when playing away. Thus, at home, teams might adopt an even more offensive playing style and take more risks (e.g., subbing in extra attacking players for defenders), especially late in the game, in order to prevent a tie. The high risk may result in a win, but also in a loss. Yet, either way, a tie becomes more unlikely.
Previous studies on the HA-effect in soccer have observed similar findings in different professional soccer leagues (Pollard & Gómez, 2014) as well as in collegiate soccer (Fullagar et al., 2019; Pollard & Gómez, 2015). Hence, the existence of the HA-effect in soccer is well established. Moreover, the notion that teams adopt a more attacking playing style when playing at home is consistent with prior research (Lago-Peñas, 2021; Lago-Peñas et al., 2016) that found similar results in other soccer leagues. Other studies attributed the higher occurrence of fouls, as well as yellow and red cards, to referee bias. Different studies have stated that referees might favor the home team, due to fan pressure, and therefore take more disciplinary actions against the away team (Avugos & Bar-Eli, 2021; Goumas, 2014; Sors et al., 2023). Playing styles can greatly affect the outcome of the game. Moreover, as this study has shown, playing styles differ significantly when playing at home versus away. Players, and especially coaches, should be aware of this tendency and consequently adapt the same playing style regardless of the location of the game, to have similarly high winning percentages when playing away as they have when playing at home.
Limitations and Directions for Further Research
This study has some limitations. First, the schedule of the college teams was not balanced (i.e. they did not play against their opponents both at home and away during the same season). Also, teams played opponents outside their conference. Finally, some games were played in neutral locations. Another aspect to consider is that the match report used basic game statistics, and it does not collect information about the actions without the ball, physical aspects, or specific playing styles. However, it provides evidence about the impact of the HA effect at this level of competition. Future research should address other aspects such as travel distance, crowd support, familiarity, or the way in which teams plan their schedule.
Conclusion
This study confirms the HA effect in college men’s soccer (NCAA D1). Regardless of team level and match confrontation type, teams won significantly more games when playing at home compared to when playing away. Comparing home points advantage, low level teams had a significantly higher home advantage effect than middle level teams, which could be related to scheduling and game preparation factors. However, more research is needed to confirm the influence of these factors. Regarding the technical-tactical indicators, this study confirms home teams have more offensive technical-tactical indicators (more goals, assists, shot attempts, shots on goal, and corner kicks) and away teams have more defensive technical-tactical indicators (team fouls, team yellow cards, and team red cards). The defensive style of away teams involves better offensive efficacy given their higher proportion of offensive actions in counterattack. There were no significant differences in neutral games (i.e., games between teams of the same level), further supporting the HA-effect and the changes in the game style. The study also provides reference values according to team level and match confrontation regarding win-loss-tie records, points earned through the home advantage, and game statistics. In summary, these data confirm the HA effect in NCAA Division 1 men’s soccer regardless of team level or match confrontation type.
Footnotes
Declaration of Conflicting Interests
The author(s) declared no potential conflicts of interest with respect to the research, authorship, and/or publication of this article.
Funding
The author(s) received no financial support for the research, authorship, and/or publication of this article.