
Abstract
Introduction
Within running distances from 100 m to the marathon, world records average about 10.7% (range 9.5%–12.1%) slower for women than men (Hallam & Amorim, 2022; Thibault et al., 2010). The sex gap narrows with ultra-endurance events to 4.4% slower in women (Waldvogel et al., 2019). The sex gap is smaller for elite than nonelite and recreational runners (Hallam & Amorim, 2022). Reasons for this include differences in heart size, lung size, hormones, body fat percentage, and muscle composition (Reybrouck & Fagard, 1999). The female heart is on average 26% smaller in mass than the male heart (Molina & DiMaio, 2012; Molina & DiMaio, 2015). The female ventricaular wall thickness and its ventricular and atrial diameters are about 9% smaller than in males (Molina & DiMaio, 2012; Molina & DiMaio, 2015). The volume of lungs for adult females is about 10–12% smaller than adult males who have similar height and age (Bellemare et al., 2023). More testosterone in men results in less fat and more muscle mass than in women (Ma et al., 2024; Mouser et al., 2016). In addition, women have on average 12% lower hemoglobin (a protein regulated by hormones) levels than men, after accounting for age and race, resulting in lower oxygen delivery per unit red cell mass (Murphy, 2014). Because men tend to have larger hearts, lungs, and higher hemoglobin mass than women, they have a greater ability to deliver oxygen to muscles during exercise (Santisteban et al., 2022).
On the other hand, estrogen in women may cause them to store more body fat than men, which may reduce the ability to burn energy after eating, helping them prepare biologically for fertility, fetal development, and lactation (O'Sullivan, 2019). Women have 6%–11% more body fat than men, on average (University of South Wales, 2009). Men tend to have more fast-twitch muscle fibers than women and women have more slow-twitch muscle fibers than men (Nuzzo, 2024). A higher proportion of slow-twitch fibers in women (which are efficient in using oxygen, delaying muscle firing, and fatiguing less easily as fast-twitch fibers) (Haizlip et al., 2015), helps explain why women tend to do comparatively well running longer distances.
Biomechanical differences between women and men due to anthropometrics also affect movement patterns and performance in distance running (Besson et al., 2022). Women tend to have a greater Q-angle (Gant et al., 2024). This can lead to different lower-limb mechanics such as greater hip adduction and knee valgus producing slightly less powerful positions for generating the required vertical forces in running (Ferber et al., 2003). Women also tend to have greater knee internal rotation, ankle eversion, and less hip flexion during running (Sinclair et al., 2012). Women and men also exhibit different changes in running mechanics as they age which could lead to differing performances between sexes throughout the lifespan (Boyer et al., 2017).
Although women have, on average, slower running times in distances up through the marathon, the time difference per mile narrows in the later miles (Hubble & Zhao, 2016). Research has shown that in the later stages of the marathon women tend to slow less than men (Smyth, 2021). In a study assessing trail runners, the gap between sexes decreased 4.02% (95% CI 3.02%–4.25%) for every 10 km for men compared with 3.25% (95% CI 3.02%–3.46%) for women (Le Mat et al., 2023). Data trends in ultra running over the last 23 years, with results from over 5 million athletes in over 15,000 ultra running events, show that the gap in times between men and women narrows with longer distances, women slow down less than men, and at distances over 195 miles women are faster than men (RunRepeat, 2024a). Further, based on 10 years of marathon results, men increased 14.07% in their average pace during the second half of the marathon versus 11.49% for women (RunRepeat, 2024b). Thus, women are 18.33% better at maintaining an even pace than men. These results may be because women have additional fat stores to provide more energy to draw on and have a greater volume of slow-twitch fibers (Haizlip et al., 2015; Karastergiou et al., 2012).
Although men are faster than women at the marathon distance, and women pace the race better, it is not clear how the difference in times and pacing vary by age, distance traveled, and place ranking. Differences between men and women in the percent running a negative split and percent slower times the second versus the first half of the marathon may also vary according to age and place ranking. Specific hypotheses addressed in this paper are as follows: 1. Faster average marathon times in men than women are more pronounced when adjustment is made for differences in the age distributions. 2. Faster average marathon times in men than women decline with older age. 3. Faster average marathon times in men than women decline in the later stages of the race. 4. Faster average marathon times in men than women decline among those with a poorer place ranking. 5. Women will consistently have better (more even) pacing over the marathon. 6. Women will consistently have better (more even) pacing across the place rankings.
The purpose of this study was to address these hypotheses to provide a greater understanding of the differences in marathon times between men and women by age, distance, and place ranking. Marathoners can use this information to plan the correct pacing strategy for a successful race.
Methods
Analyses are based on data from the 2022 St. George Marathon. It is in St. George, Utah. A single year allowed us to ascertain the same weather conditions for all participants and the race represented a mostly downhill course starting at a relatively high altitude. The marathon was established in 1977 and accommodates up to 7400 runners. The race is held the first Saturday of October, starts at 7:00 am, beginning in the scenic Pine Valley Mountains (elevation 5240 feet, and descends to Vernon Worthen Park in St. George City (elevation 2680 feet) (Figure 1). Most of the decline in elevation is in the second half (1892 ft) versus the first half (668 ft) of the marathon. The temperature typically ranges from 38 to 44°F at the start of the race, and 65–85°F at the end of the race. Runner’s World Magazine refers to the St. George Marathon as a more scenic and faster marathon in the USA (McCoy, 2023). St. George marathon elevation course, 2022.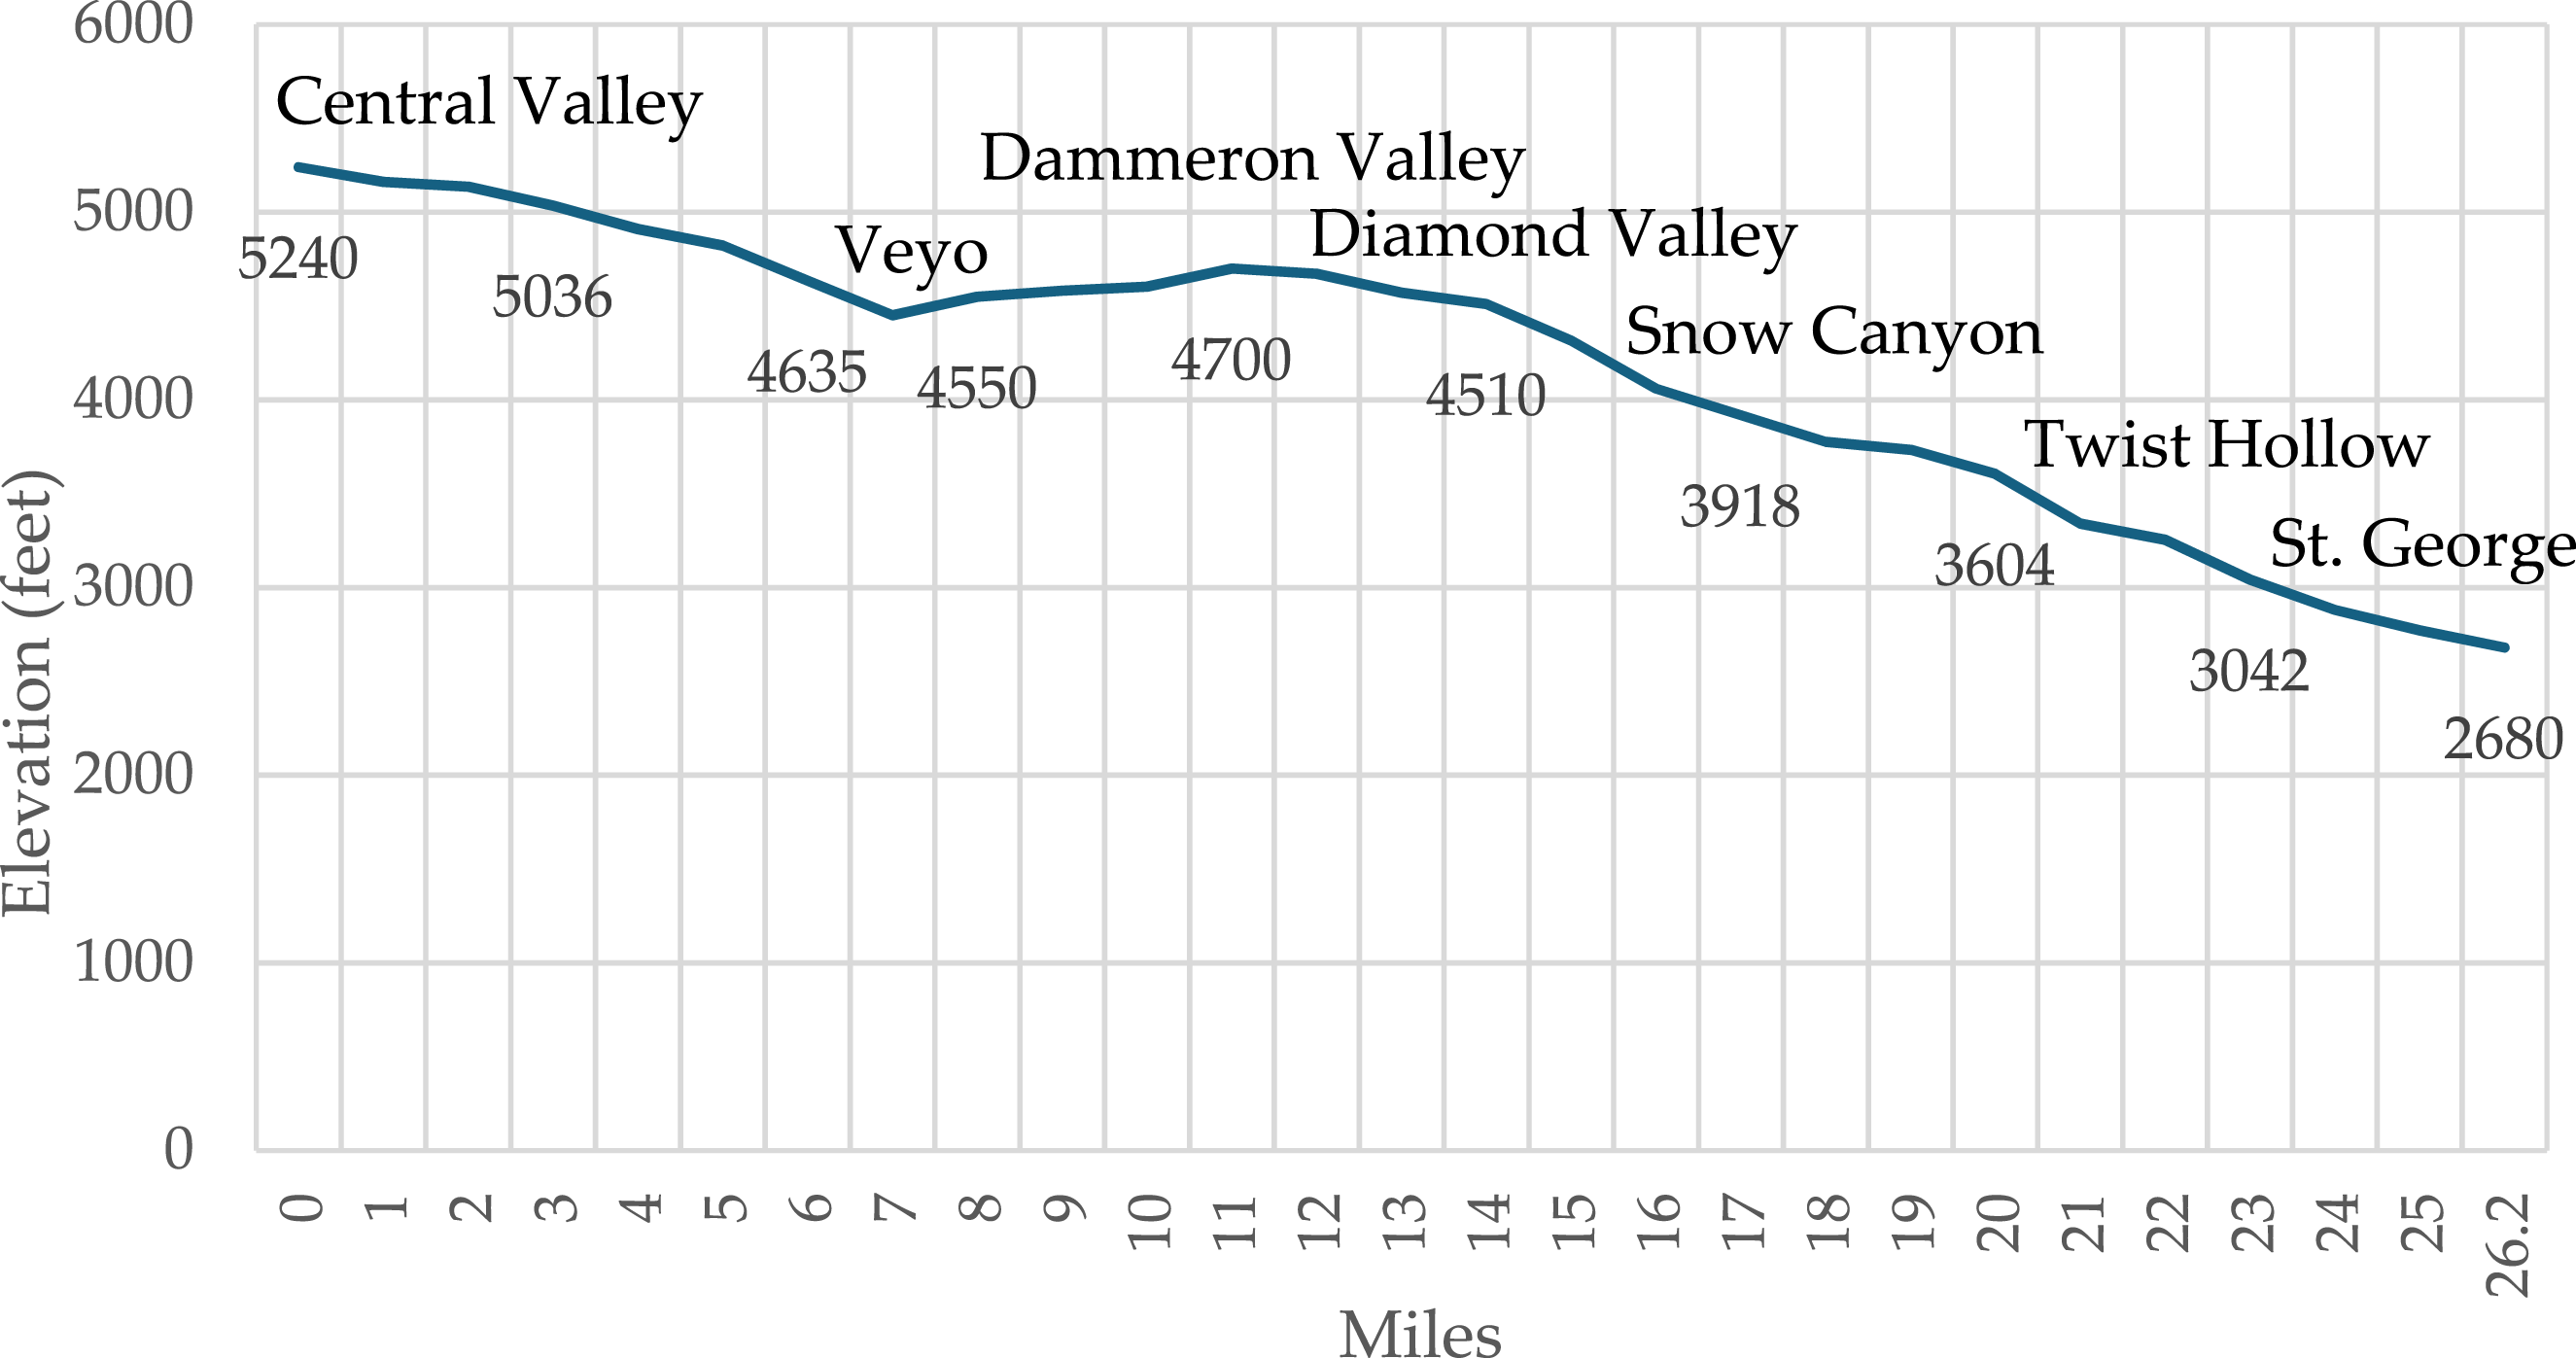
The study population included all finishers of the St. George Marathon in 2022. There were 2033 men and 1450 women who finished the race, but we removed 32 men and 18 women who ran more than 3 standard deviations slower the second half of the marathon versus the first half of the marathon. Therefore, the study was based on 2001 men and 1432 women. Running times at 3.1 (5 km), 6.2 (10 km), 13.1 (21.1 km), 18.6 (30 km), and 26.2 miles (42.2 km) were compared between men and women by place ranking and age. Times were expressed as hours, minutes, and seconds (0:00:00). Hypothesis 1. Multiple regression provided marathon time estimates for men and women, adjusted for age. Hypothesis 2. Regression models were used to estimate times according to sex, age, and a sex by age interaction. Hypothesis 3. Assessed by comparing the percentage change in mile pace at different distances traveled (vs. the first 3.1 mi [5km]) in the marathon. Hypothesis 4. Assessed by regressing the difference in average pace per mile between men women according to place ranking. Hypothesis 5. Regression models compared pace between later and earlier distances for men and women, adjusting for age. Also evaluated by comparing percent change in the second half versus first half times. Hypothesis 6. Assessed graphically.
Two-sided tests of significance were based on the 0.05 level against a null hypothesis of no association. Parameter estimates were evaluated for significance using the t test and reported with their standard error and differences in proportions were evaluated using the chi-square test. Data was evaluated using the Statistical Analysis System (SAS) softtware (Base SAS 9.4; SAS Institute, Inc, 2014).
Results
Marathon Times in Men and Women
Summary of Marathon Times by Sex and Age.
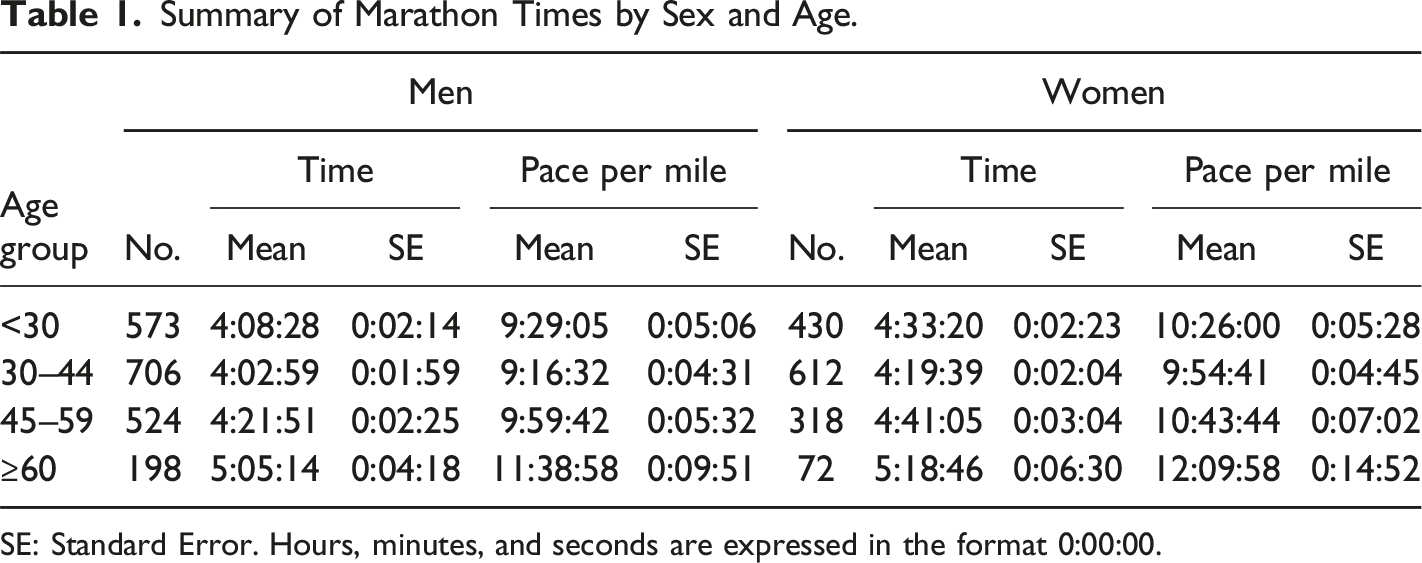
SE: Standard Error. Hours, minutes, and seconds are expressed in the format 0:00:00.
Regression Analysis of Overall Marathon Time and per Mile Pace by Sex and Age.
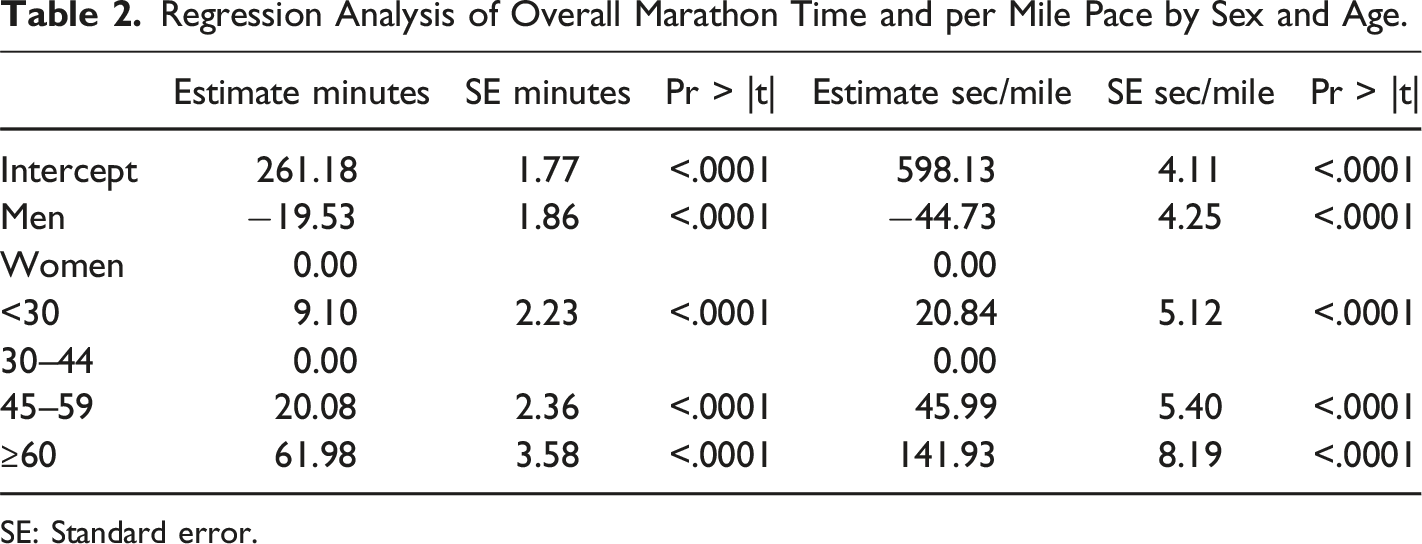
SE: Standard error.
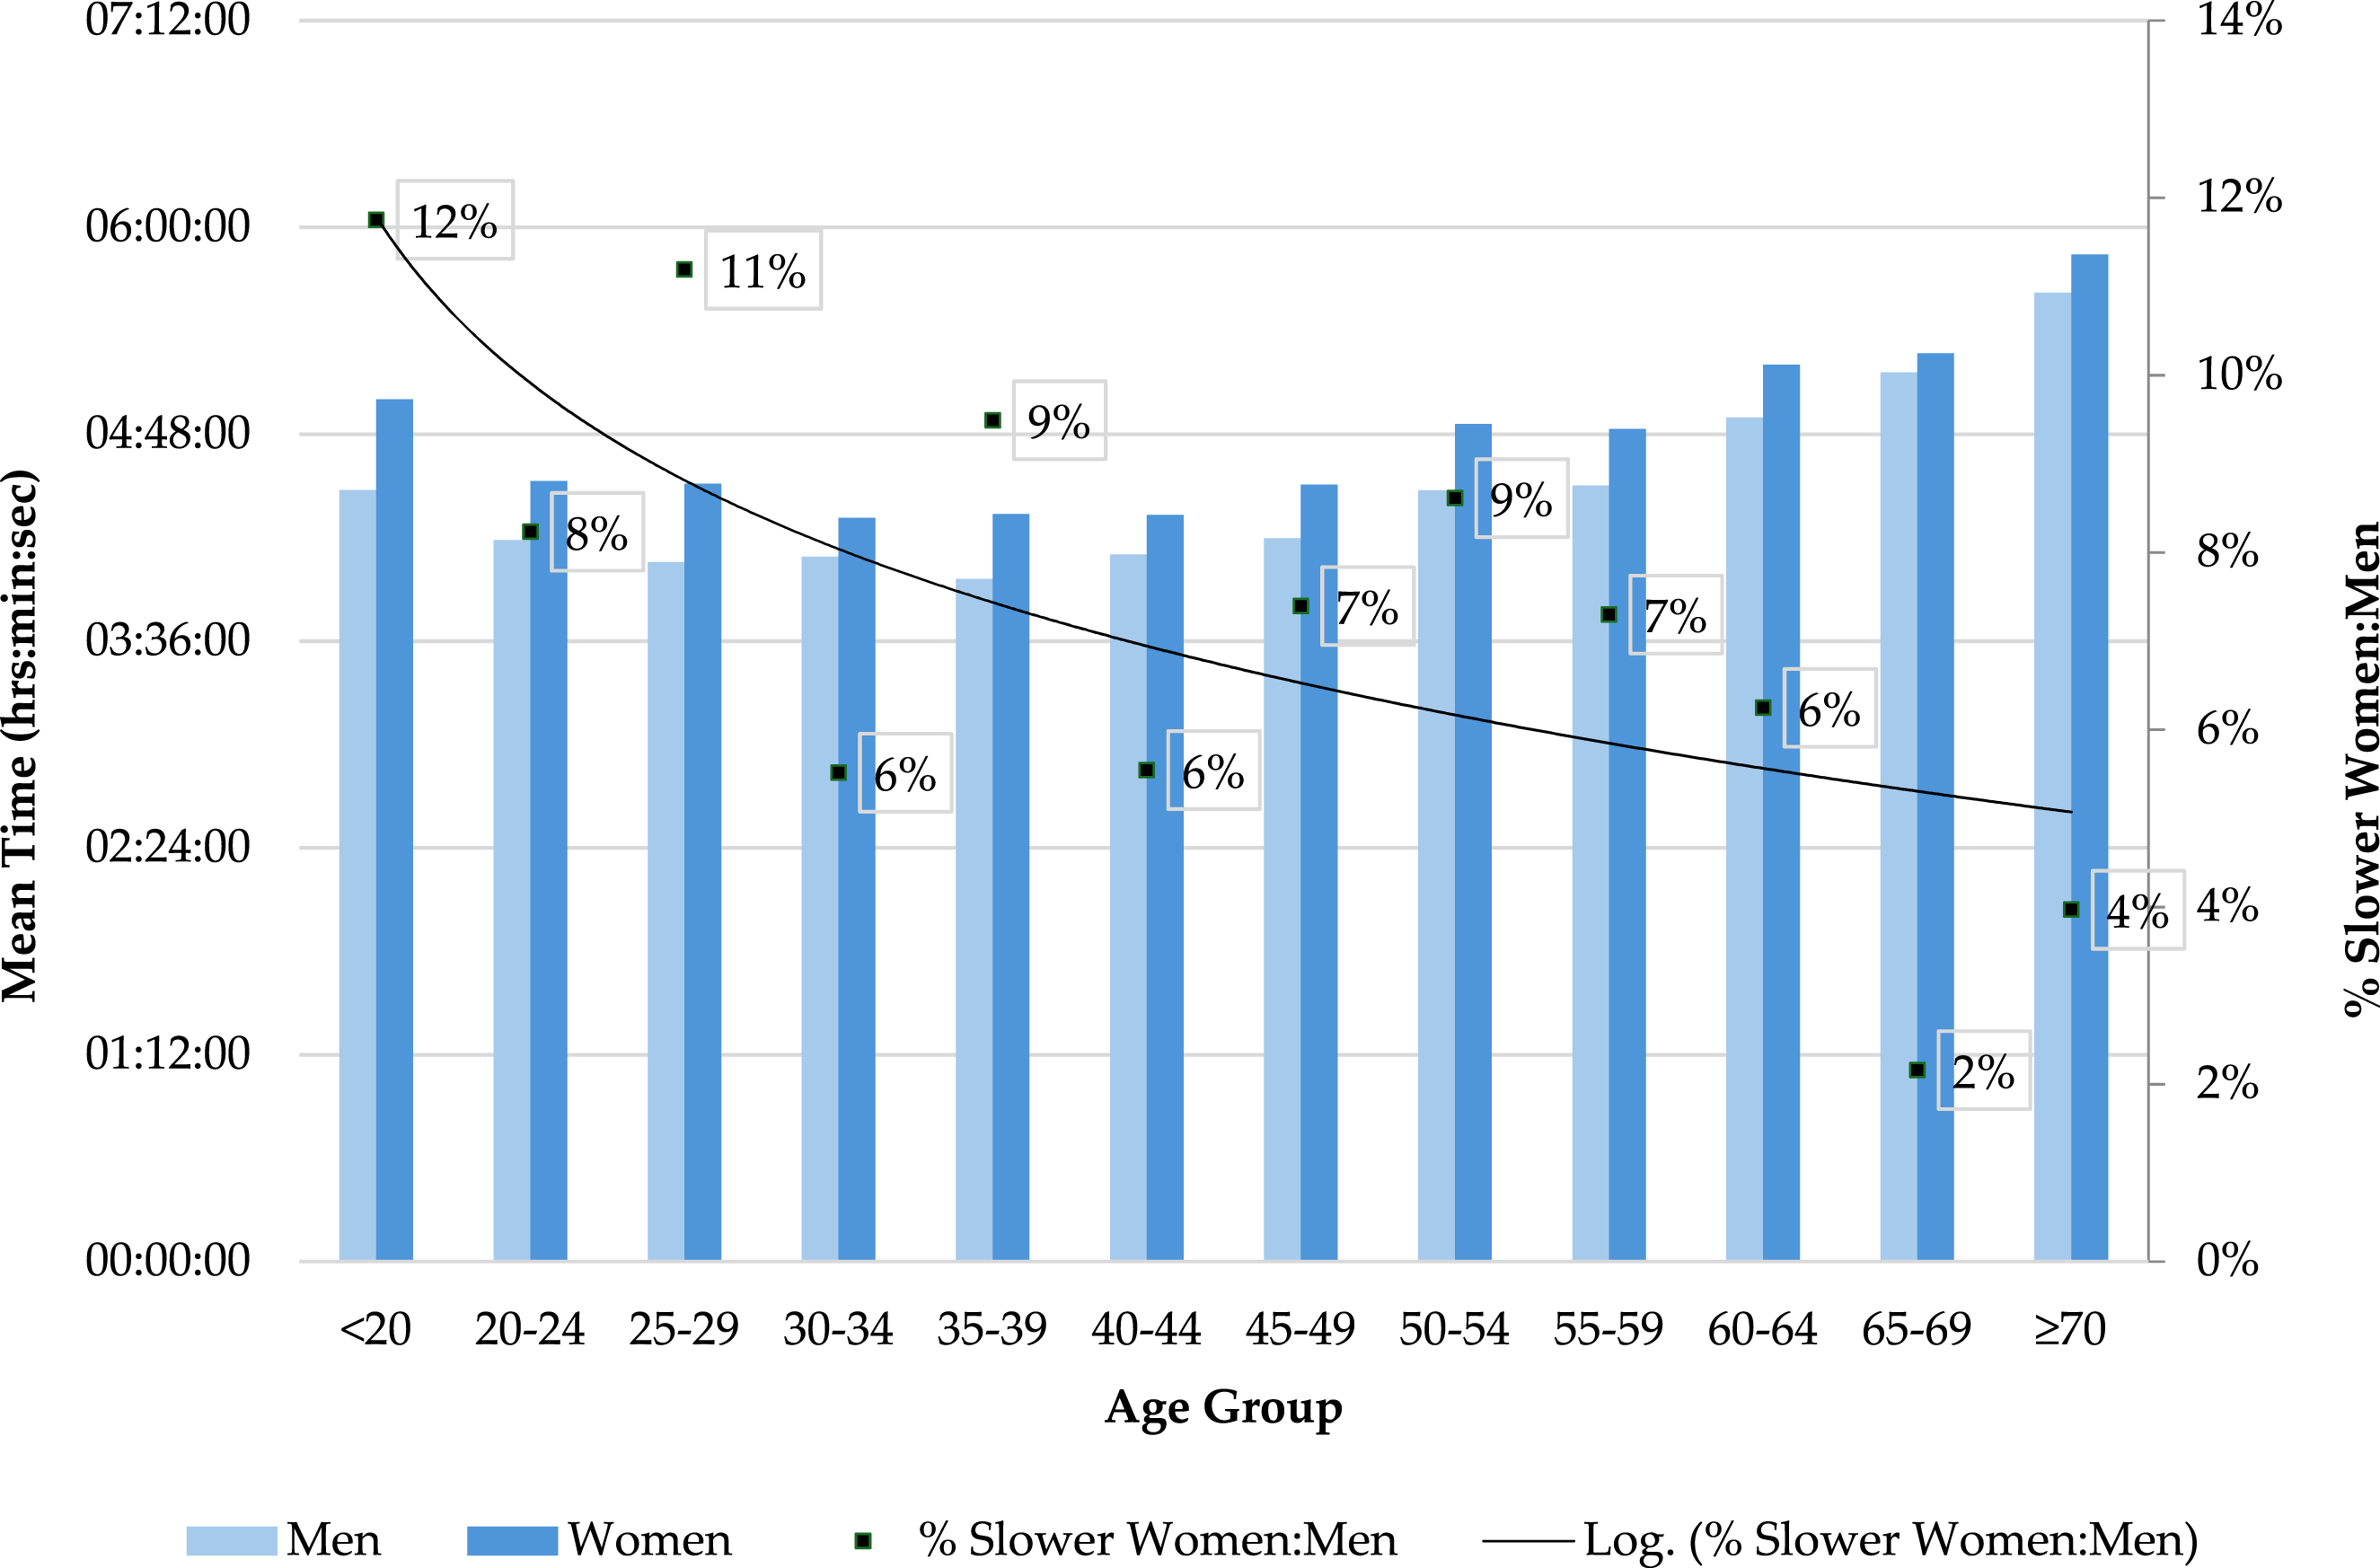
Marathon times for men and women by age.
Split-Time Pacing Differences
Average Time per Mile Through Specific Splits for Men and Women: All Runners and Top 25%.
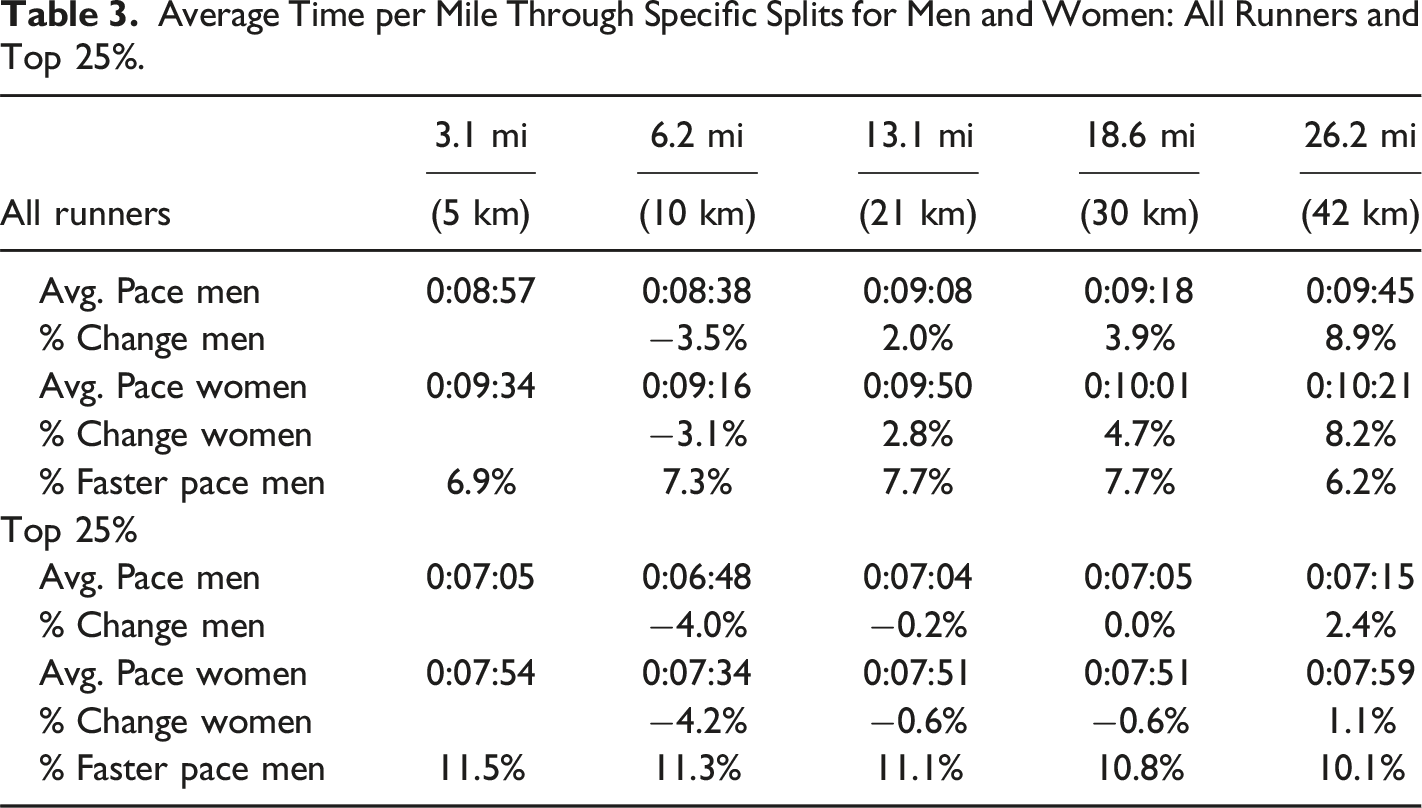
There was a larger gap in times between men and women in the top 25% of runners across all the distances than for all runners combined (10.1% for the top 25% and 6.2% for all runners, Table 3).
Place Ranking
Marathon times for men and women are shown by place ranking in Figure 3. The percent slower times in women than men become significantly smaller as we move to slower runners (t p < .0001). For example, women’s times are about 15% slower in the top runners, 6.5% in the middle runners, and so on. For the slowest 1% of men and 1% of women runners, men have slower average time than women. Marathon times for men and women by place.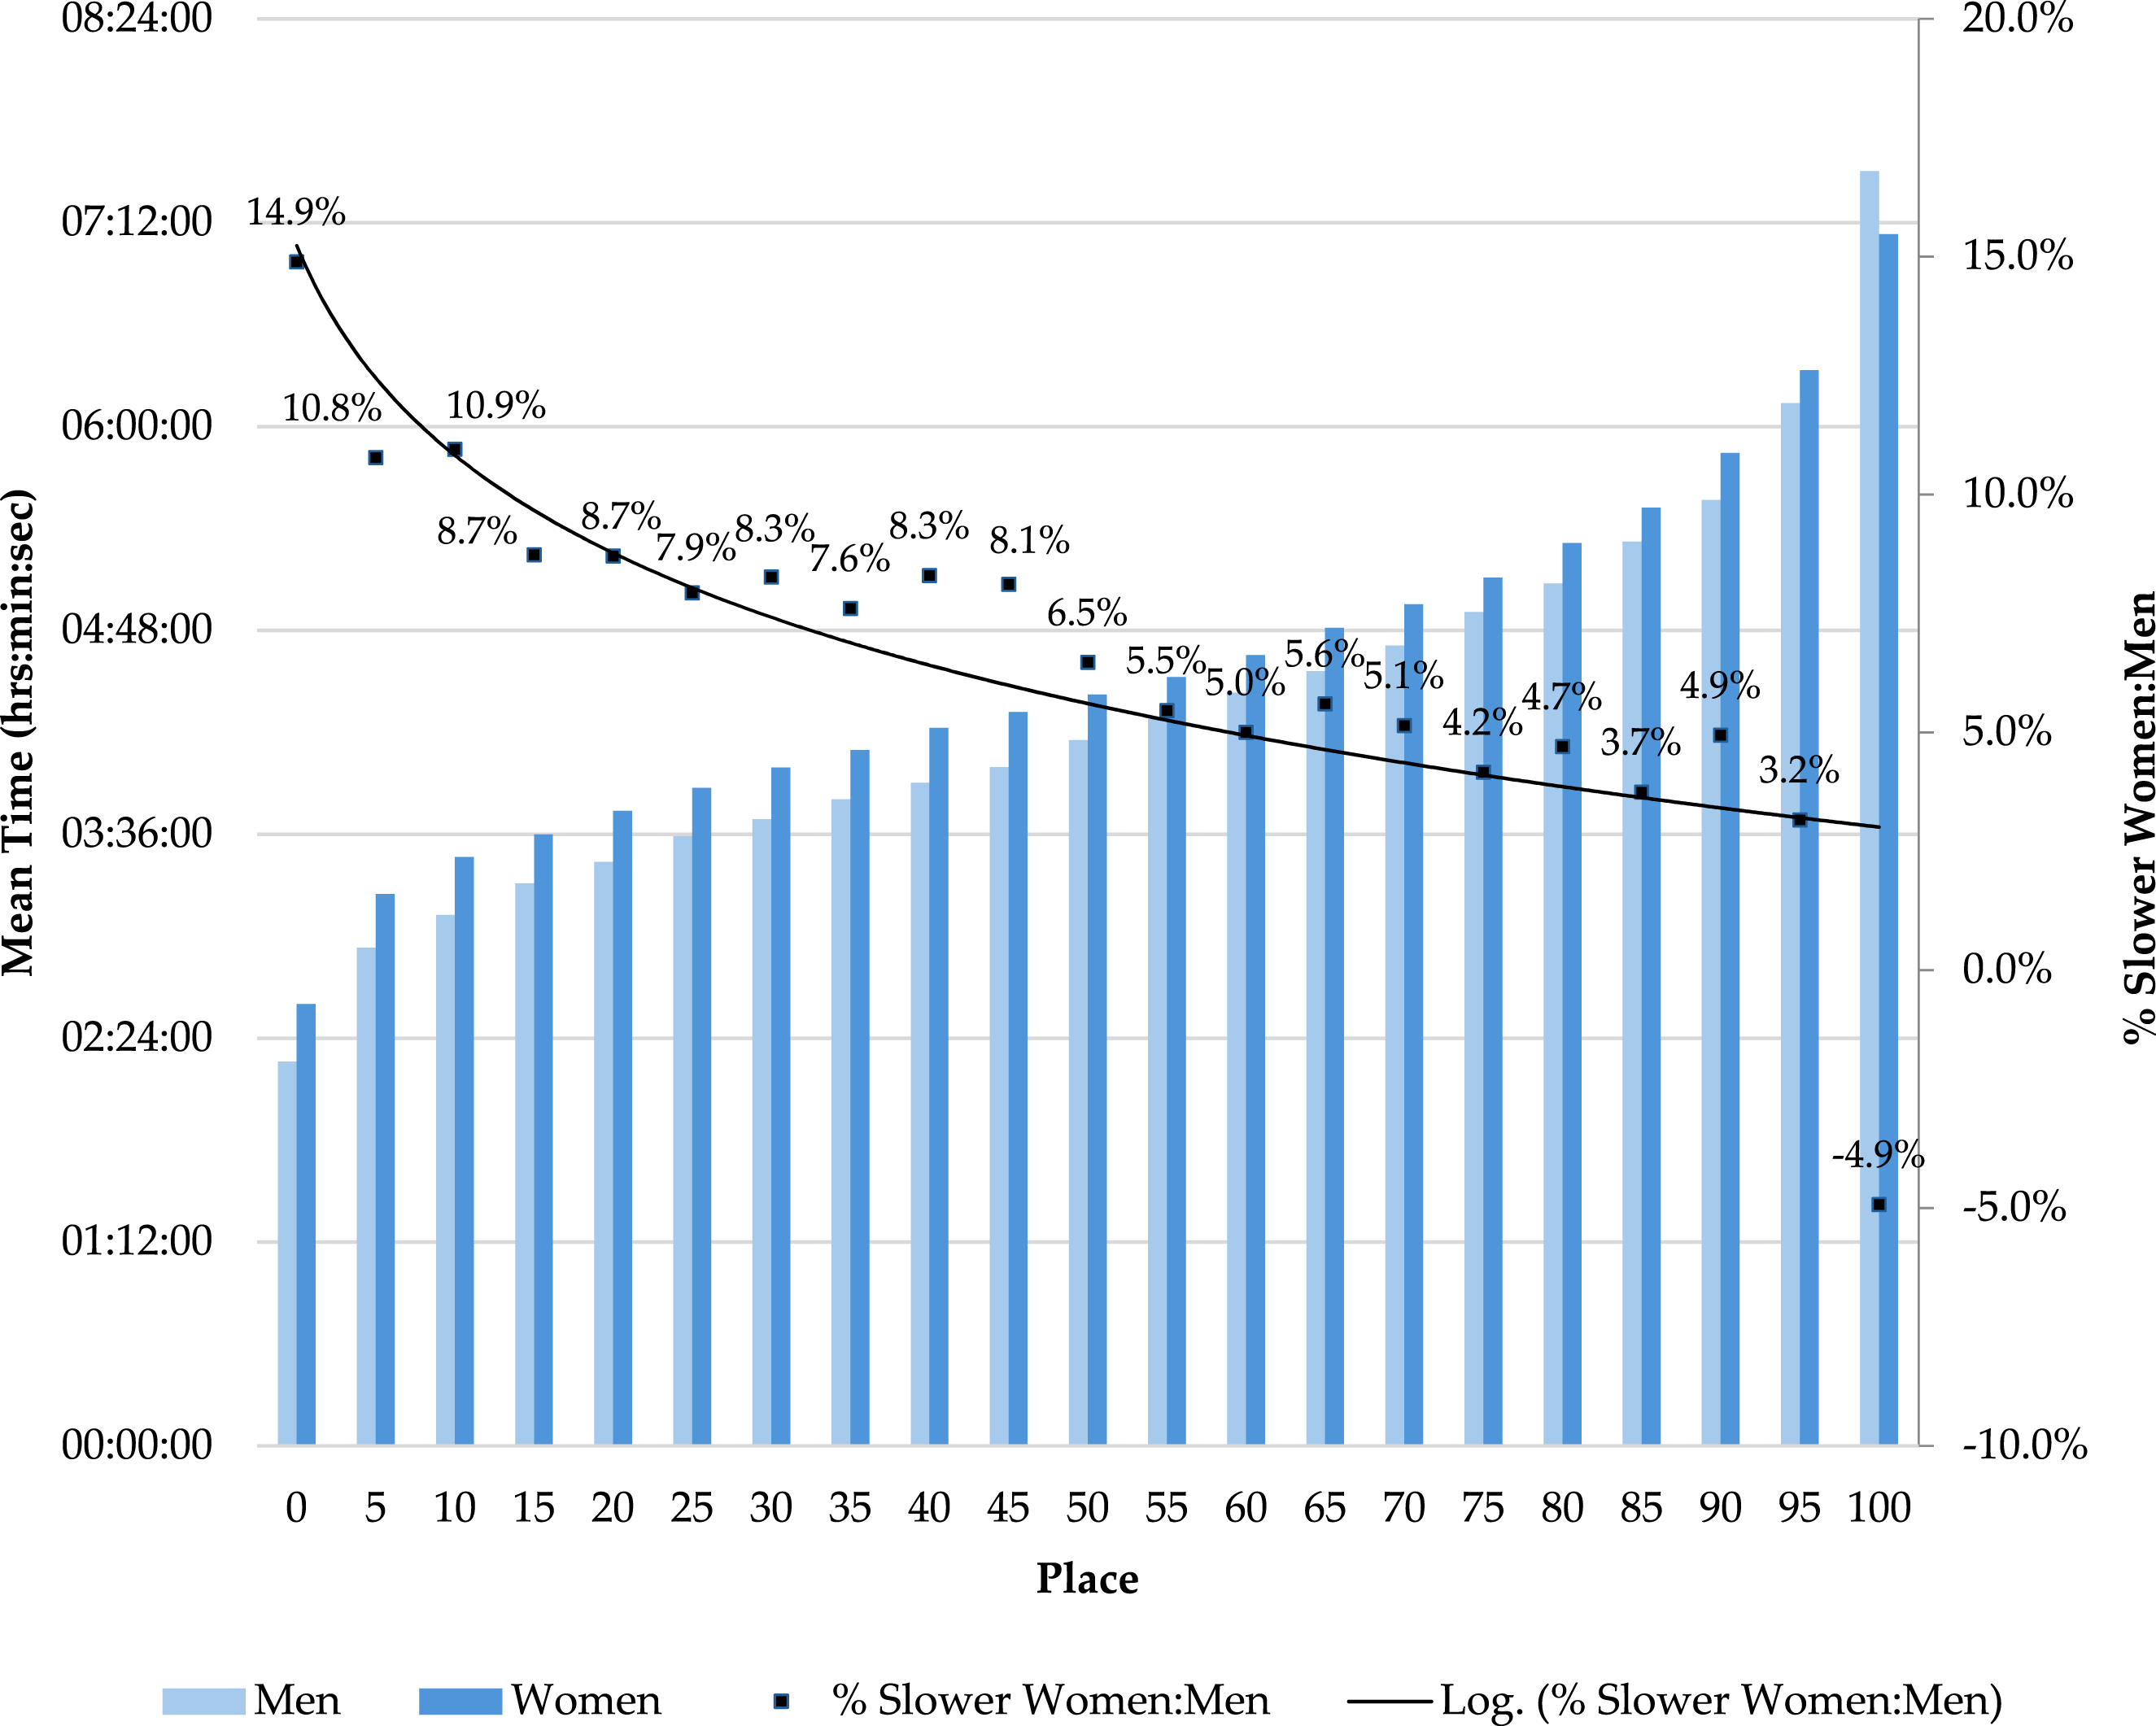
Pacing
About 18% of men and 20% of women ran the second half of the marathon faster than the first half (Chi-square p = .1779). Running a negative split occurred among 17.8% in ages <30, 23.2% in ages 30–44, 15.0% in age 45–59, and 13.1% in ages ≥60 (Chi-square p = .0122).
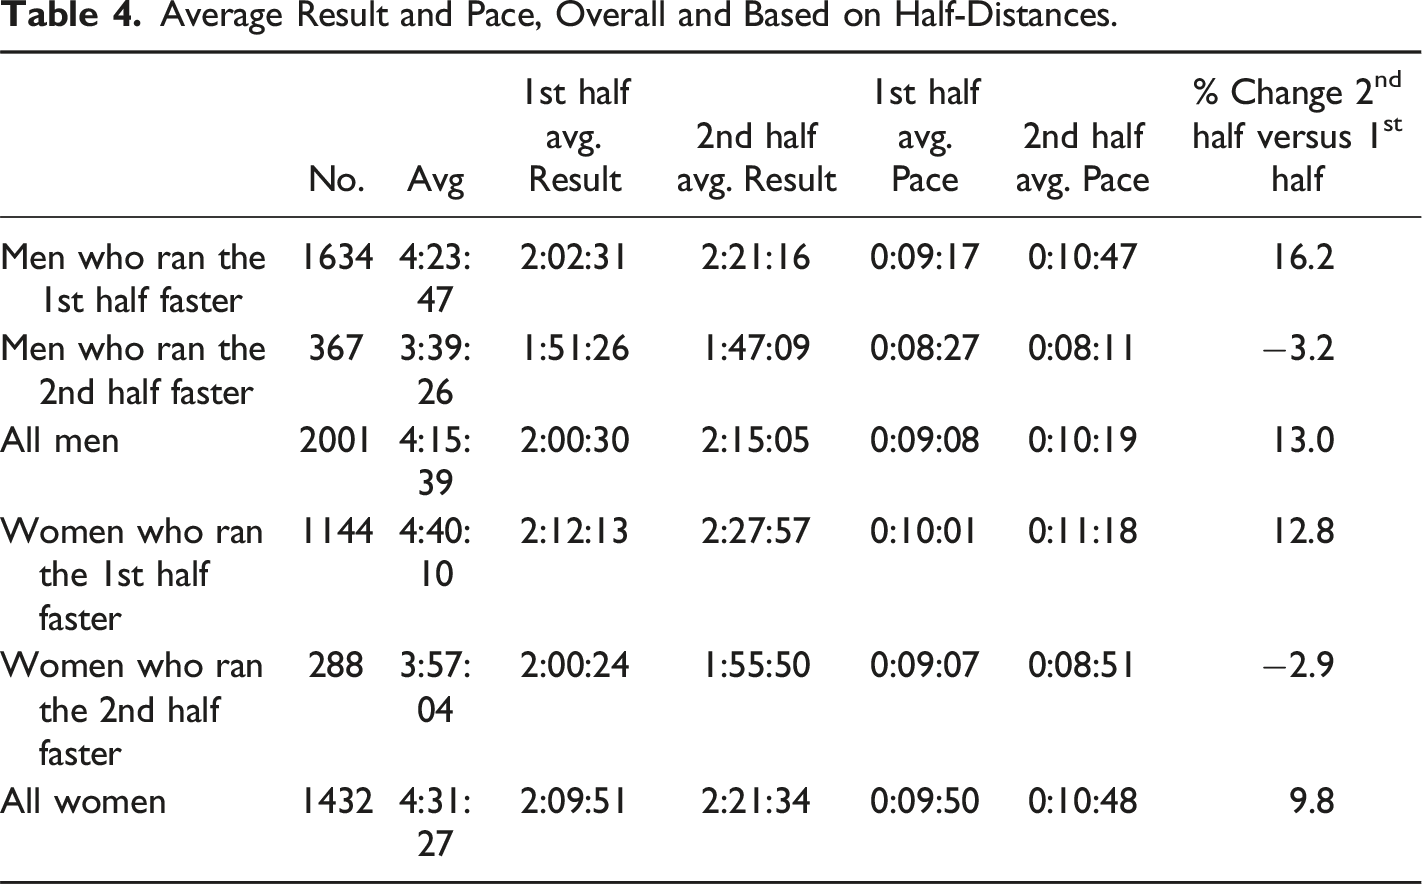
Average Result and Pace, Overall and Based on Half-Distances.
Comparing Pace Between Later and Earlier Distances by Sex and Age.
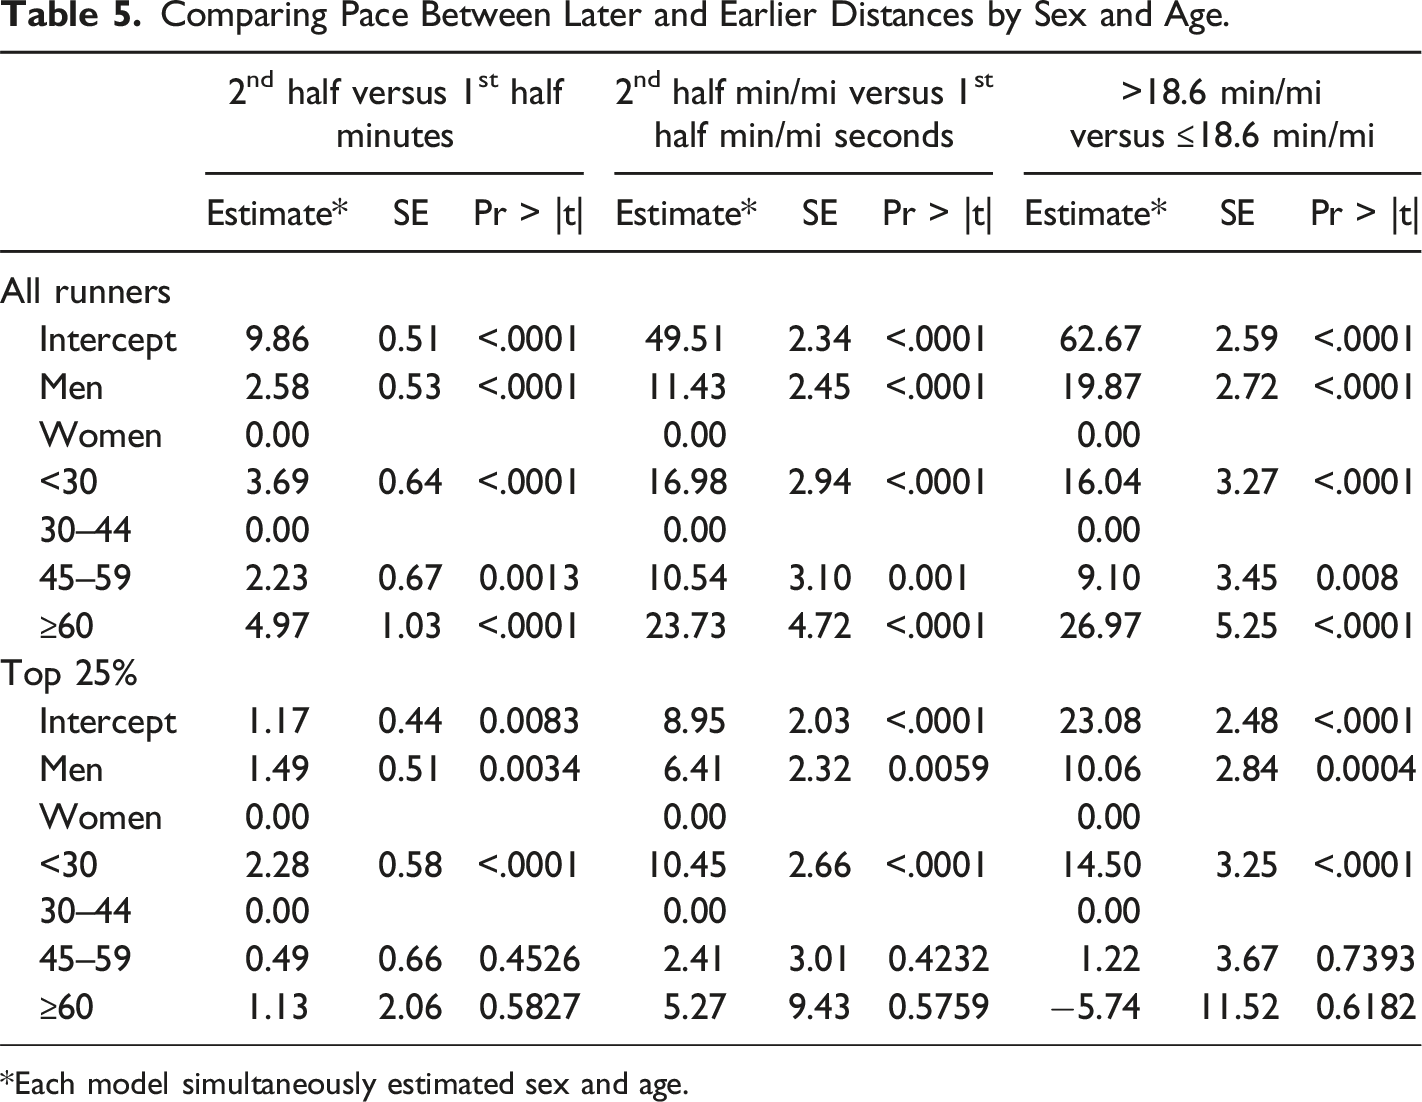
*Each model simultaneously estimated sex and age.
For the top 25% of runners, men compared with women ran an average of 1.49 minutes (6.41 sec/mi) slower the second half versus the first half of the marathon. They were an average of 10.06 sec/mi slower than women for the distance from 18.6 mi (30 km) to the end of the marathon versus the first 18.6 mi (30 km). Compared with those aged 30–44 years, the pace per mile for younger runners slowed significantly more in the latter part of the marathon. There were not significant interactions between sex and age in these models.
Pacing by Place Ranking
Percent Slower Second Half Times (vs. first Half Times) and Negative Splits for Men and Women According to Place Order.
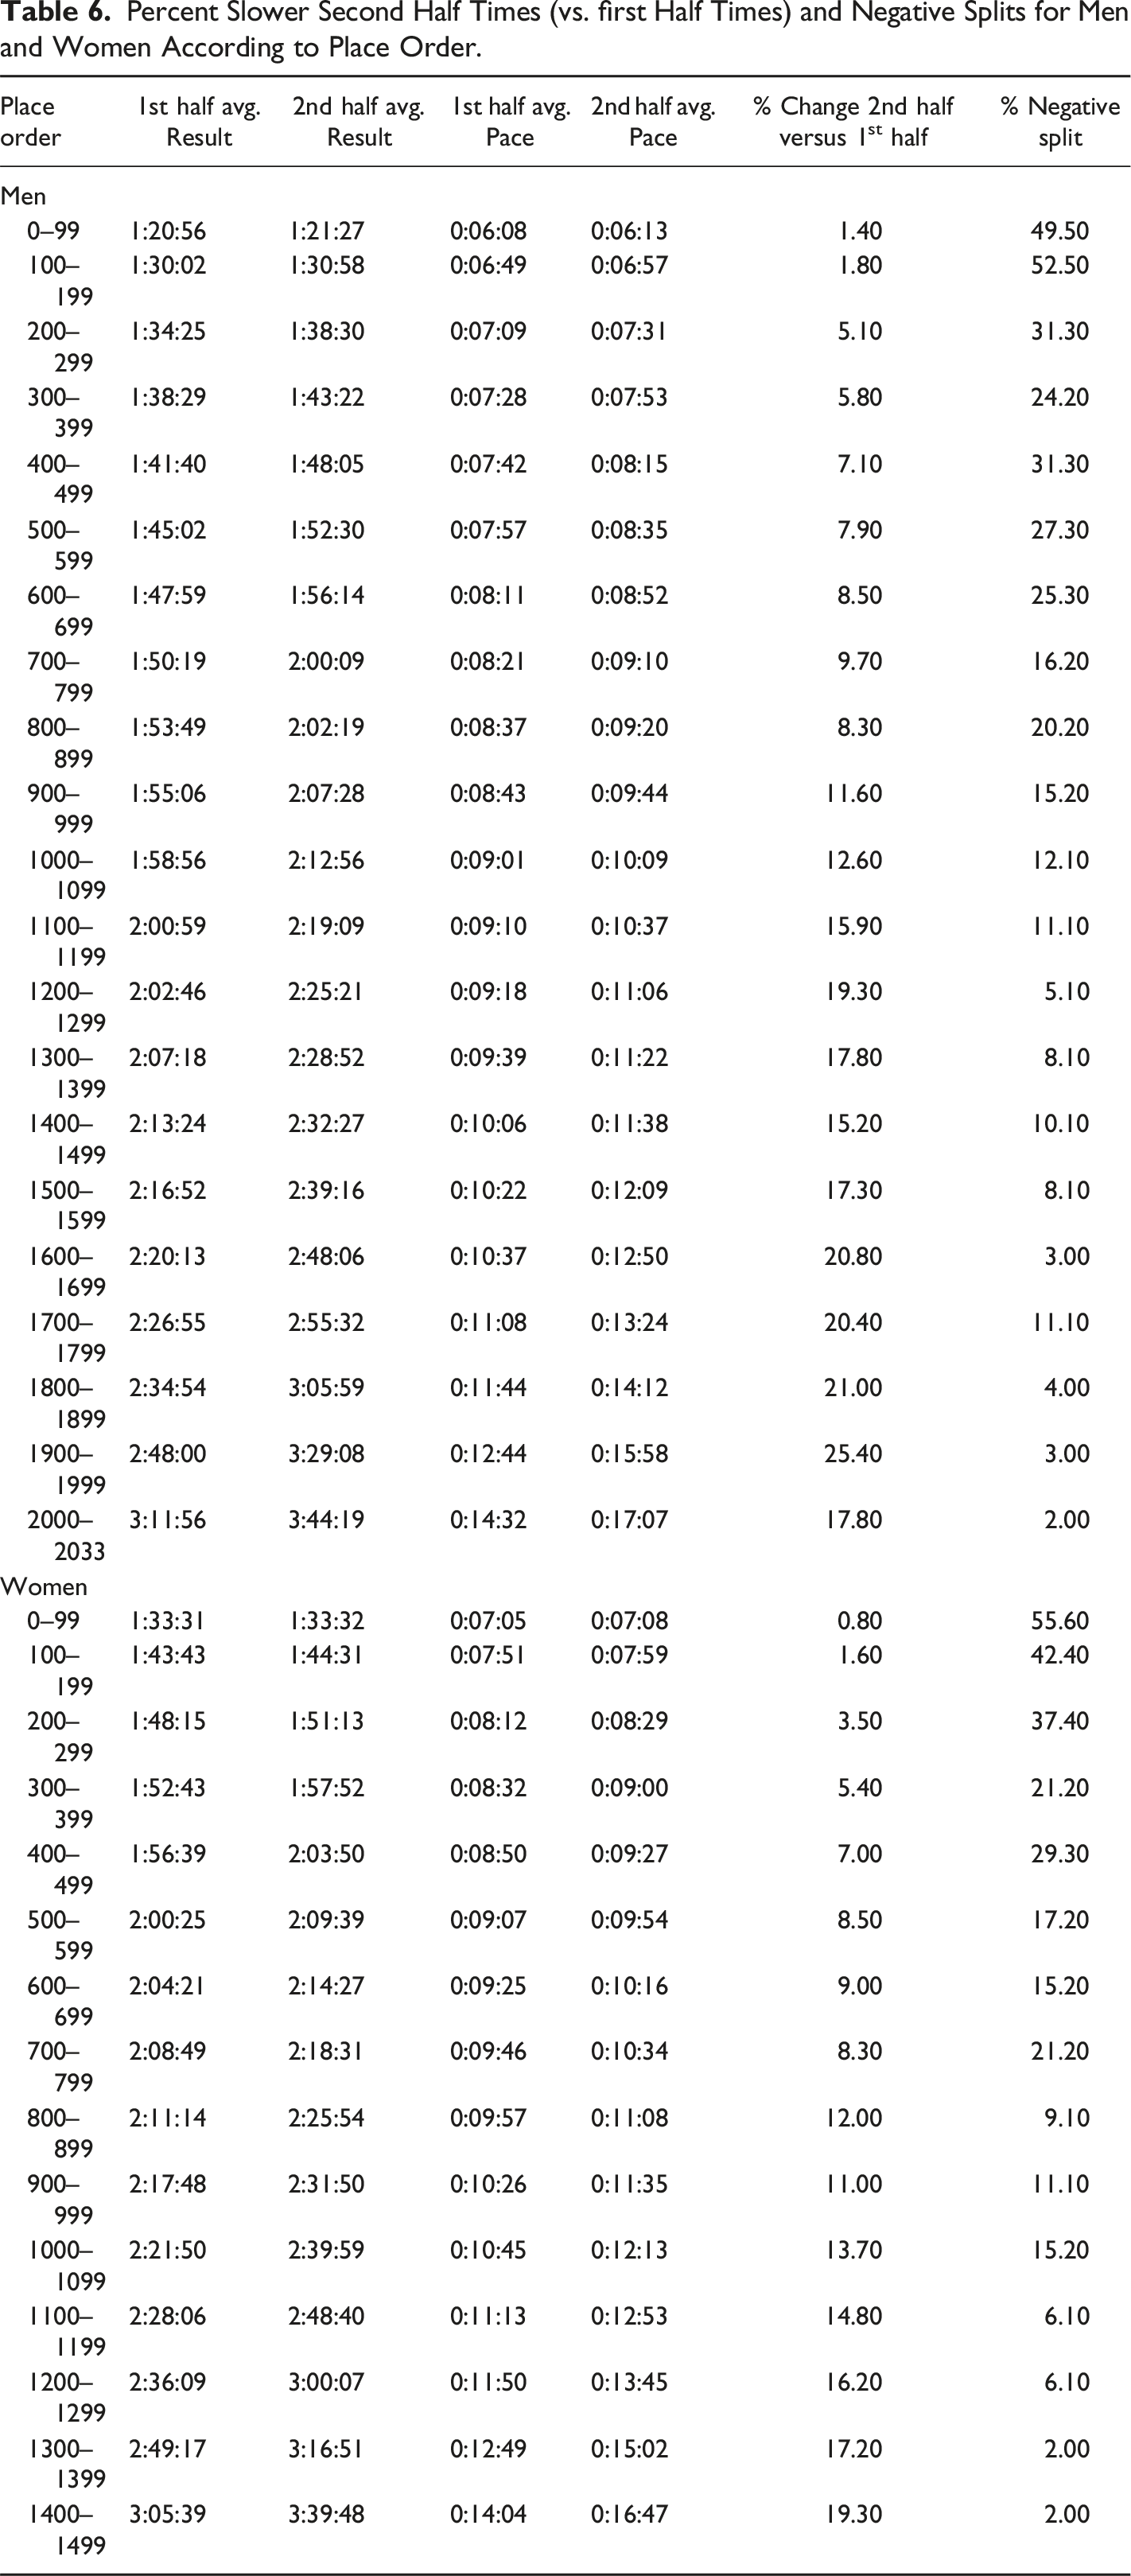
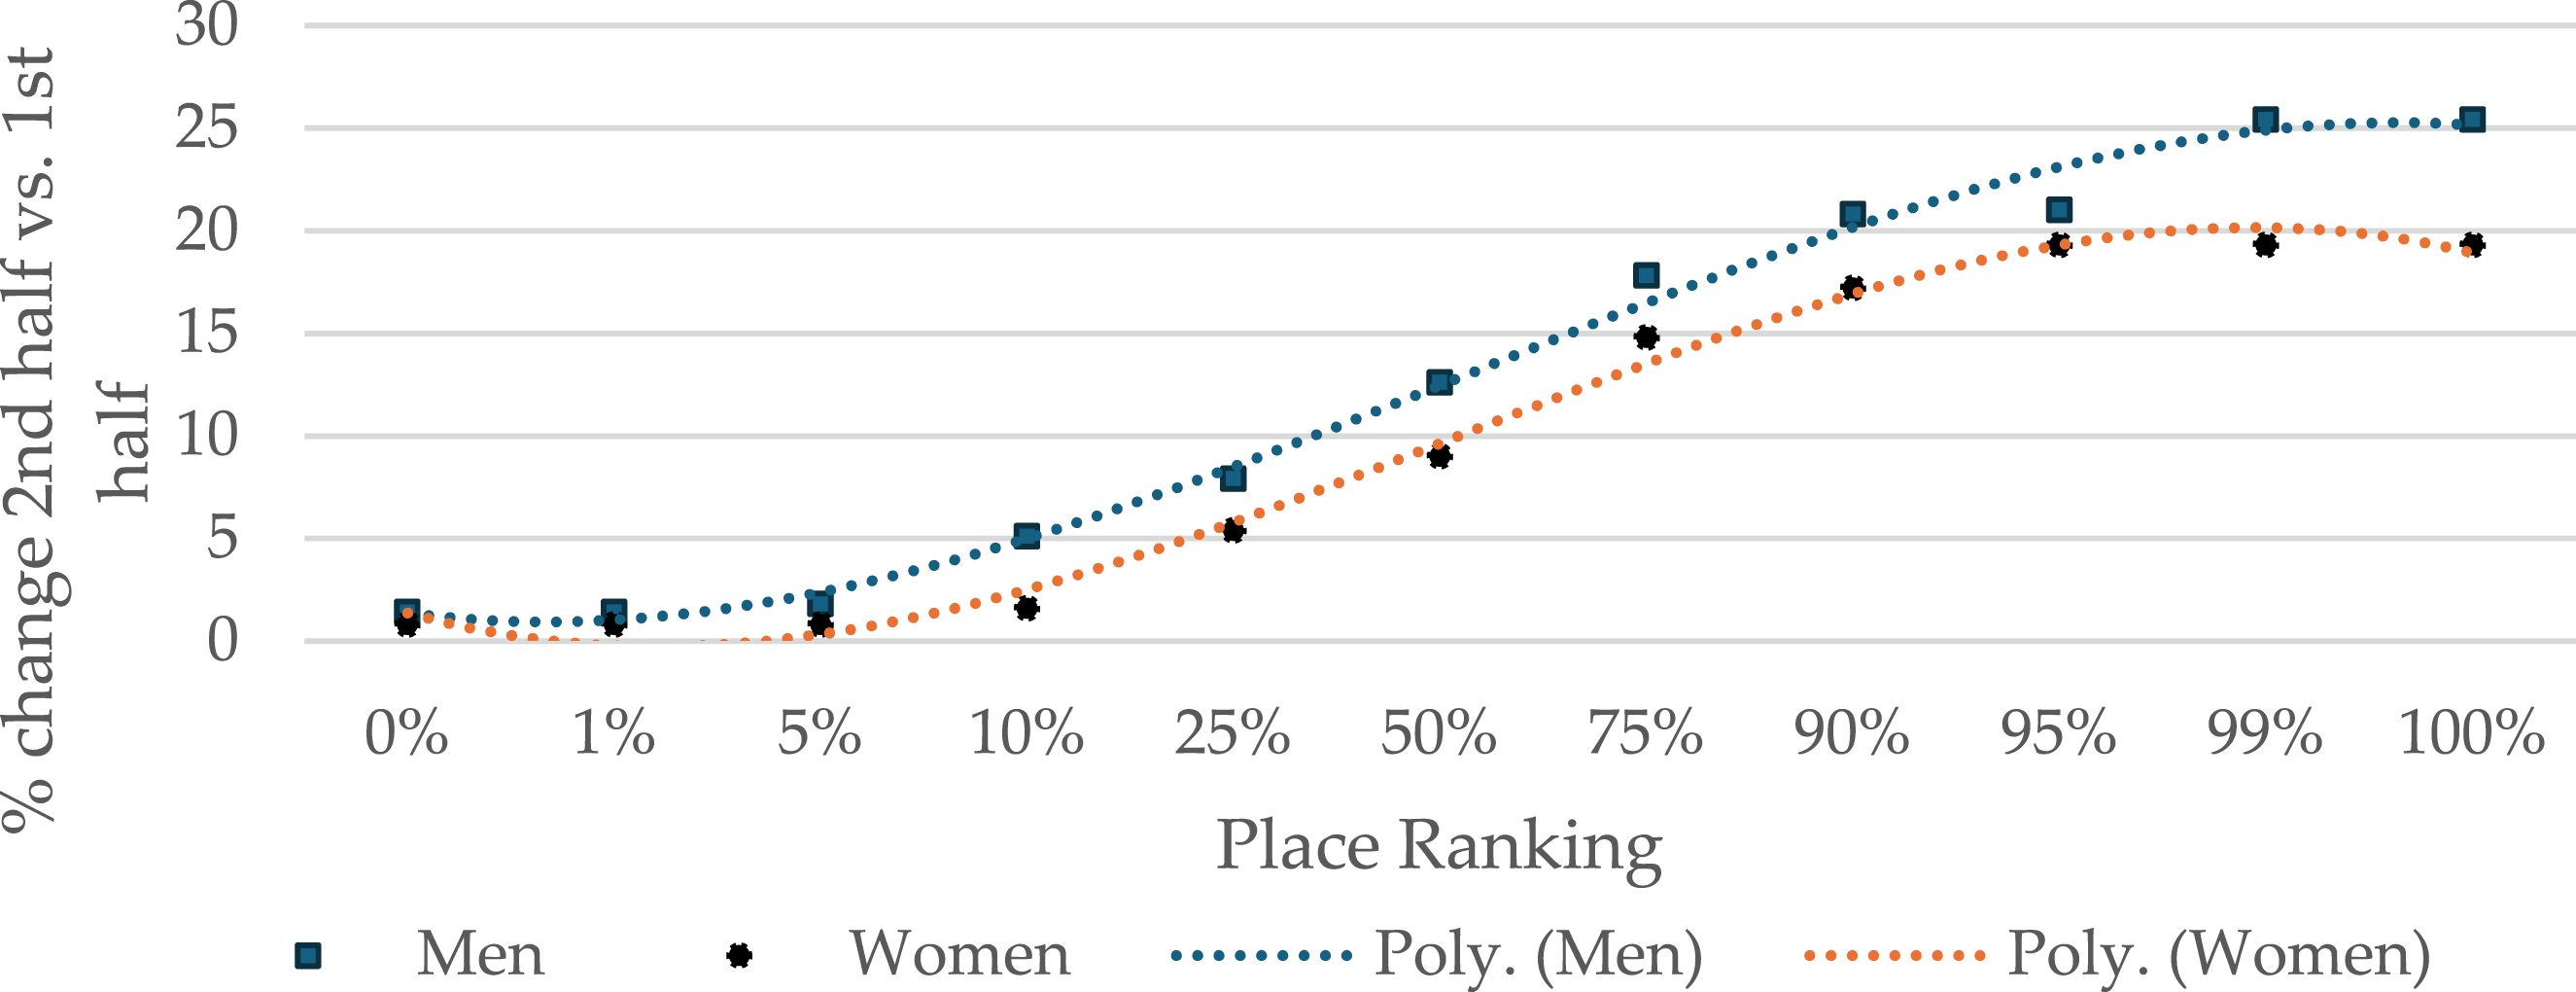
Percentage with a slower pace the second half versus first half of the marathon by sex and place ranking.
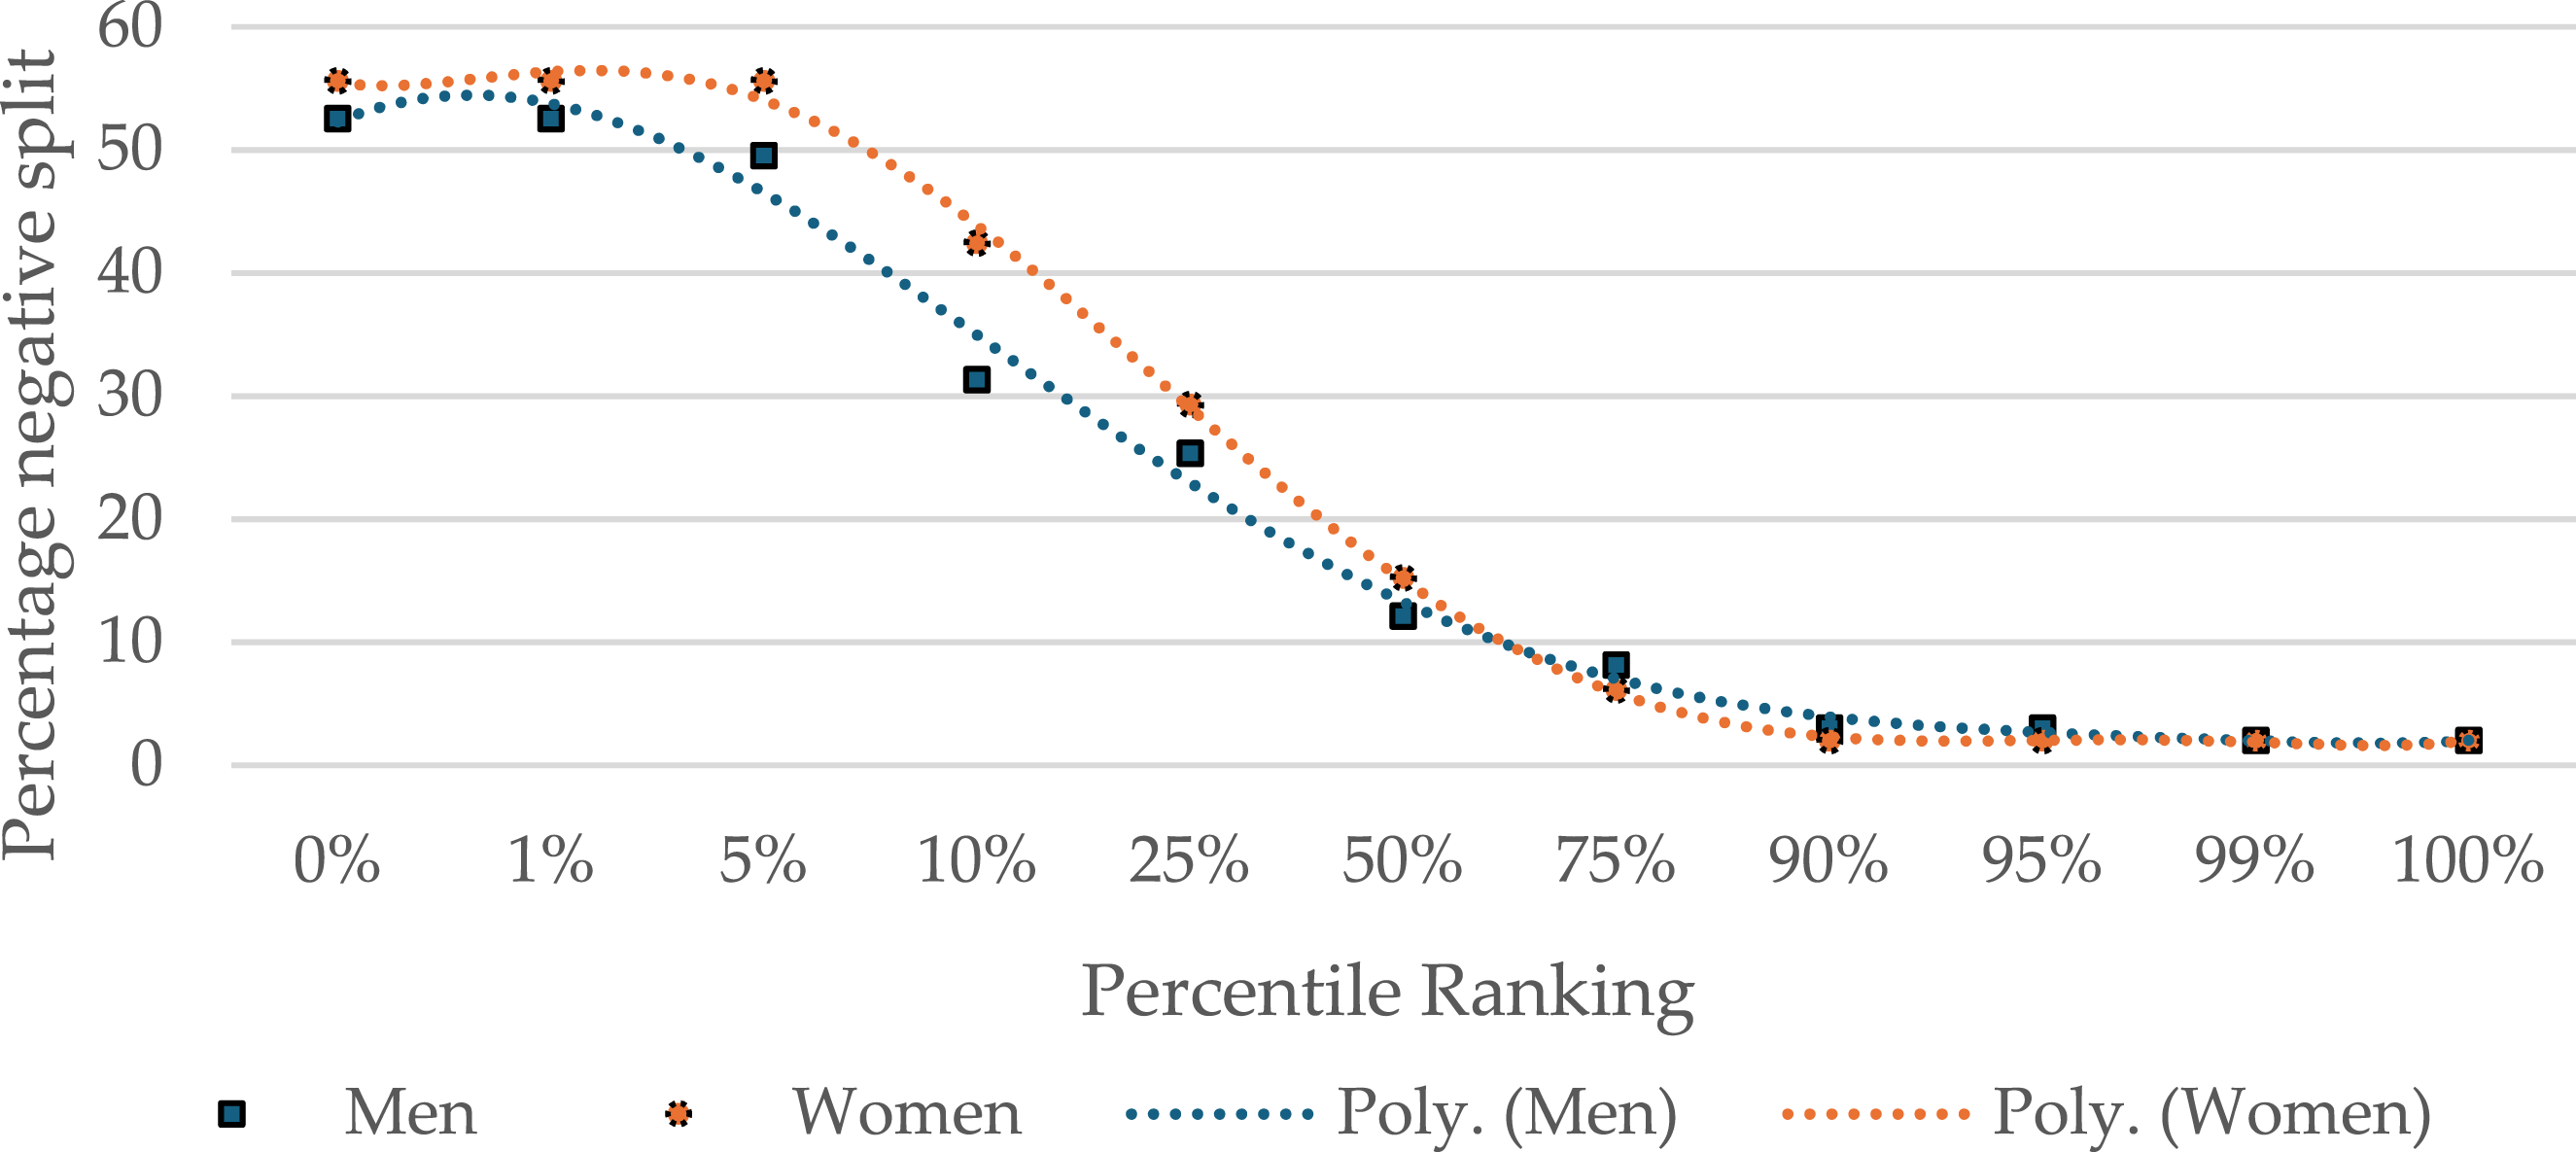
Percentage with a negative split by sex and place ranking.
Discussion
This study identified difference in times and pacing between men and women according to age, distance traveled, and place ranking. In support of the research hypotheses, faster marathon times in men than women were more pronounced after adjusting for differences in their age distributions. Difference in times narrowed with advancing age. Faster marathon times in men than women were greatest in the faster runners and lowest in the slower runners. Men slowed more than women over the marathon distance, except among the top 25% of runners, where their pace did not slow until 18.6 mi (30 km), but at a greater rate for men. In general, women pace the marathon more evenly than men, more so in the younger and older ages and within place rankings.
Faster Average Marathon Times in Men than Women
This study confirms previous research showing a U-shaped relationship between average marathon time and age. The fastest runners were in the age range 30–44 years. Runners in this age group paced the marathon more evenly and were most likely to have a negative split. Older runners were least likely to negatively split the marathon. A similar pattern in the U-shaped relationship appears for the world best times in the half and full marathon for men and women (World Age Group Records). A previous study of the top 10 men and top 10 women in the New York Marathon showed a similar relationship between marathon times and age (Lara et al., 2014). This may be due to more variable pacing and fewer years of quality training among younger runners (Cuk et al., 2019; Nikolaidis & Knechtle, 2017), and reduction in maximal oxygen uptake for those in the older age categories (Carrick-Ranson et al., 2013; Letnes et al., 2020).
The average age of men was significantly older than of women. This result is consistent with data showing that for 19.6 million runners from over 16 thousand marathon races, the average age was 37.91 for women and 41.05 for men (RunRepeat, 2023). The better times in men than women are more pronounced (i.e., 3 minutes and 50 seconds) after adjusting for age differences.
Difference in Marathon Times Between Men and Women Narrow with Age
While men had faster average marathon times than women, the decline in performance with age was more pronounced in men. Marathon performance time differences between men and women among individuals aged 54 and older disappeared in the Ljubljana Marathon, like the trend we observed (Nikolaidis et al., 2019). This narrowing of the performance gap in older ages is consistent with the faster rate of muscle loss in men compared with women as they age (Rivera et al., 2016). There are likely other reasons for this narrowing of performance between women and men across age, but further research is needed to help understand this observation.
Difference in Marathon Times Between Men and Women Narrow with Distance
Consistent with the current study, an analysis of race results from 941,851 men and 570,655 women who finished various marathons between 2009 and 2019 showed that men had a faster average pace for each 5 km segment of the marathon compared with women. However, the difference in times narrowed over the race distance (RunRepeat, 2024b). Other research and data have also found that the gap in times between men and women narrows with increasing distance, with women’s times even surpassing men’s in extreme ultramarathons (Le Mat et al., 2023; RunRepeat, 2024a).
Difference in Marathon Times Between Men and Women Greater in Faster Runners
Runners in the top quartile did not slow their pace until 18.6 mi (30 km), whereas the pace for all runners combined started slowing by the half marathon. From 18.6 mi (30 km) to the end the slower pace in men was greater than for women, even among those in the top quartile of runners. Another study found that men are more likely to hit the wall than women (45% vs. 37%) (Buman et al., 2008). It appears to occur most commonly around 18.6 mi (30 km). This result is consistent with another study that showed men pacing faster than women through 15.5 mi (25 km), but significantly slower after the 18.6 mi (30 km) mark (Hubble & Zhao, 2016).
The larger gap in times between men and women in the top quartile of runners versus all runners combined may be due to physiological differences (Besson et al., 2022) that are more pronounced in slower runners and/or that men are more likely to be overconfident and pace the first part of the marathon too quickly (Deaner et al., 2015).
One study found that men tended to overestimate their abilities, with the difference between their predicted and actual finishing times greater than that of women (Larumbe-Zabala et al., 2019). The study found no significant differences in age, running experience, or training volume between men and women. However, men had more competitive behavior and set more challenging goals, which led to their slowing down more than women in the latter part of the marathon. Other research also identified men to be more competitive than women in the marathon (Deaner et al., 2011; Ogles & Masters, 2003).
A study involving amateur marathon runners found that men were more motivated by personal achievement and competition and women were more motivated by psychological and emotional benefits of running (León-Guereño et al., 2020). The study found that younger runners (aged 19–25) placed more emphasis on competition and personal goal achievement, middle-aged runners (aged 36–50) had a higher concern for weight management, and older runners (aged 51–70) were more motivated by health and social factors. While these age categories are different than in our study, they provide potential reasons why different ages respond in a variety of ways. Another study found that women marathoners are more motivated by psychological coping and self-esteem issues compared with men (Ogles & Masters, 2003).
The difference in times between men and women narrow with slower place ranking. It is not clear why the physiological differences between men and women influence the race differently for faster versus slower runners. Although in general men have faster times than women because of physiological differences (Bellemare et al., 2023; Hallam & Amorim, 2022; Molina and DiMaio, 2012, 2015; Thibault et al., 2010; Waldvogel et al., 2019), women have physiological differences that appear to be an advantage to them in the longer distances (Ma et al., 2024; Mouser et al., 2016; Murphy, 2014). It is also not clear that women are less trained for the marathon than men. A few decades ago, women may have had less marathon experience and fewer years of running involvement compared with men (Ogles & Masters, 2003). However, more recent studies have shown that men and women tend to prepare similarly for marathons, averaging around 50 mi (80.5 km) per week (Larumbe-Zabala et al., 2019; Pierce et al., 1997). Women may also have greater exercise dependence (exercise addiction or compulsion) than men (Pierce et al., 1997). Hence, the narrowing of marathon times between men and women, especially in those with later placement, may be in part because of poorer pacing among men.
Women Pace the Marathon More Evenly than Men
Consistent with previous data (RunRepeat, 2024a, 2024b), women tended to pace the marathon more consistently than men. From 18.6 mi (30 km) to the end, slower pace was more pronounced in men by a small amount. This result is consistent with another study (Hubble & Zhao, 2016).
Approximately 18–20% ran a negative split. This percentage is much higher than the 1%–8% doing it in the New York, Boston, Marine Corps, Cal International, Portland, and Chicago marathons (Fraioli, 2023). This is largely due to the consistent elevation drop (1892 ft) in the second half of the St. George marathon compared with the first half (1892 ft [577 m] vs. 668 ft [204 m]). When a negative split occurred, men ran the second half about 3.2% faster and women about 2.9% faster. When a negative split did not occur, the percent of slowing was considerably greater for men than women across all age groups. Since the second half had a much larger drop in elevation, we expected more runners to utilize negative splits. Most runners seem to make a pacing mistake early in the race that leads to slower overall times than they were capable of running.
Faster Men and Women Pace the Marathon More Evenly
Poorer place order corresponds with a greater percentage of runners slowing the second half versus the first half of the marathon and a lower chance of having a negative split. In other words, poorer marathon times correspond with poorer pacing in both men and women, slightly more so for men. Some authors have suggested that poorer pacing among men than women is because of men’s overconfidence causing them to start the race too fast and women more accurately self-assessing their abilities (Hubble & Zhao, 2016).
The fastest men and women tend to be aged 30–44, which is also the group most likely to negative-split the marathon. A lack of experience may explain the comparatively high percentage of slowing the second half versus the first half of the marathon in younger runners. The comparatively high percentage of slowing in the older runners may be due to physiological differences or because of poorer pacing in men who are less willing to admit than women that they are slowing down. Although we saw significantly greater slowing in the marathon for both men and women in the younger and older age groups, another study of 17,465 participants in the Vienna City marathon only found this for men (Cuk et al., 2019). This result for women is unclear since age is related to marathon place ranking, and place ranking corresponds with even pacing.
Limitations
Utilizing only one year of the St. George Marathon limits us on understanding other race performance variability such as weather conditions. Future investigations will consider multiple years of the same race to determine this influence.
Practical Application
When planning to run the St. George Marathon or other long-distance races, care should be taken in determining the appropriate average pace for one's ability, then sticking to the right pacing strategy for the course, being especially careful not to start too quickly. When runners started too fast, it was typically the first 3.1 mi (5 km) where the mistake occurred, leading to a slower finish time than desired. Men were slightly more likely to make these pacing mistakes along with runners outside the 30–44 age range. Working with a training partner of similar abilities, who has run the race successfully to help plan the correct pace provides a great opportunity to determine how the paces through various sections of the course should be planned.
Conclusion
When overall average marathon times are compared between men and women, consideration of differences in the age distributions between the sexes can result in more meaningful comparisons. The fastest marathon times are in the age range 30–44 years for both men and women. Faster marathon times in men than women become less pronounced in older age, longer distances (mostly from 18.6 mi [30 km] to the end), and later place ranking, may be due to physiological differences and men starting the race too fast but women more accurately self-assessing their abilities. The larger gap in times between men and women in the top 25% of runners versus all runners combined is attributed to complex physiological and psychological differences. More consistent, even pacing corresponds with better marathon times for both men and women. Regardless of sex, the best pacers are aged 30–44 years.
Footnotes
Acknowledgements
The authors would like to acknowledge the athletes for their participation.
Author Contributions
RMM and IH both conceptualized the study and contributed to the study design, data interpretation, manuscript review, and approval of the final version of the manuscript for submission. RMM performed the data analysis.
Declaration of Conflicting Interests
The author(s) declared no potential conflicts of interest with respect to the research, authorship, and/or publication of this article.
Funding
The author(s) received no financial support for the research, authorship, and/or publication of this article.
Institutional Review Board Statement
Ethical review and approval were waived for this study due to the data being available in the public domain.