
Abstract
This study aimed to determine the peak locomotor match demands between starters and non-starting soccer players according to playing position and match outcome. Twenty-two young outfield soccer players were observed over 17 official matches. Locomotor performance during the matches was recorded per minute: total distance (TD), high-speed running distance (HSD, >19.8 km/h), sprint distance (SPD, >25.2 km/h), high metabolic load distance (HMLD, 25.5 W·kg−1), number of high-intensity accelerations (ACC, >3 m/s2) and decelerations (DCC, >-3 m/s2), and Player Load (PL). Rolling moving averages were used to calculate the peak match demands as worst-case scenarios (PMD) in 1 (PMD1m) and 3 (PMD3m) minutes. Players were classified based on their playing position, as well as the match outcome at the time of substitution. The results demonstrate that when the non-starter plays the same position, peak match demands are generally similar, except HSD and SPD in PMD1m, which are higher in starters. Position-based analysis shows that starting central defender and central midfielder cover a significantly longer TD during PMD1m and PMD3m compared to their respective non-starters. Moreover, starting players cover a greater TD, HSD, SPD, and HMLD in PMD1m when the substitution occurs while winning compared to their respective non-starting players.
Introduction
Soccer is a team sport where intermittent high-intensity efforts are combined with periods of low intensity (Bradley, 2024a; 2024b). During these efforts, players must perform technical and tactical actions within a chaotic and unpredictable environment, and do not usually occur during predetermined phases (Delaney et al., 2018). Hence, the outcome of a match hinges on both physical performance and the technical and tactical elements. In this regard, it is important to highlight that during crucial moments of a match, actions of high intensity, such as high-speed running, sprinting, and precise technical executions, are often involved. (Ade et al., 2016) Consequently, match analysis research that analyzed demands that are above average intensity is important for coaches, since the use of averages likely underestimates peak demands. (Cunningham et al., 2018) This knowledge allows coaches to better understand and prepare players for these challenges, enabling them to design training drills that replicate such scenarios effectively (Martin-Garcia et al., 2018; Oliva-Lozano et al., 2022, 2023).
Recently, during the FIFA World Cup in Qatar, there was a noticeable decrease in high-intensity distance (≥20 km/h) between halves for most playing positions (8%–10%) (Bradley, 2024a). This finding aligns with previous research consistently reporting a decline in high-intensity distance as minutes pass during matches (Bradley & Noakes, 2013; Mohr et al., 2003). While this decline is often attributed to the onset of fatigue (Mohr et al., 2003), linked to mechanisms such as muscle glycogen depletion and reduced creatine phosphate availability (Krustrup et al., 2006; Mohr et al., 2005), soccer’s inherent complexity demands a broader perspective. Indeed, second-half performance decrements are not solely a function of physiological fatigue; they are profoundly influenced by contextual variables (Bradley, 2024a). These factors, such as playing position, tactical approach, and match outcome, are often referred to as ‘contextual variables' can modulate a player’s physical output and are crucial for understanding the multifaceted nature of soccer performance. Recognizing this intricate interplay, strategic player substitutions between starters and non-starters emerge as a critical tactical decision for coaches (Castillo-Rodríguez et al., 2023), aiming to mitigate performance decrements and sustain high-level physical output throughout the entire match.
Non-starter players introduced during matches covered greater high-intensity distance relative to time metrics compared to players who either completed the entire match or were replaced (Bradley et al., 2014; Lorenzo-Martínez et al., 2021; Padrón-Cabo et al., 2018). However, Castillo-Rodríguez et al. (Castillo-Rodríguez et al., 2023) observed similar distances covered at high intensity between starters (4.3 ± 1.4 m/min) and non-starting players (4.0 ± 1.2 m/min). Overall, several studies have shown that using absolute and relative metrics may underestimate the most intense periods of match play experienced by players (Cunningham et al., 2018). For this reason, the analysis of the most demanding competition situations, such as fixed and rolling averages, has become increasingly common, aiming to gain a better understanding of the physical requirements of players (Fereday et al., 2020; Oliva-Lozano et al., 2021). In this context, ‘worst case scenarios' refer to the short (e.g., 1-, 3-, 5- or 10 min epochs) where players exhibit their maximum physical output within a match (i.e., high intensity distance covered) irrespective of the overall average demands (Oliva-Lozano et al., 2021). Analyzing these specific periods is crucial for understanding the peak stresses players endure. In this regard, it has been shown that non-starter players generating higher physical output in all metrics analyzed during the most demanding competition situations in 30 s epoch (Bortnik et al., 2023) and reduced high-intensity distance by substitutes introduced later, versus earlier, in a match (Hills et al., 2022).
Unfortunately, studies often overlook important factors such as playing position or match outcome, which could directly or indirectly influence a substitute’s post-pitch-entry demands (Hills et al., 2022). Since coaches may sometimes deploy a player in different playing positions and modify the style of play according to match outcome, and these decisions may affect peak match demands (Bortnik et al., 2023; Martin-Garcia et al., 2018), analyzing demands while considering these situational factors is important for coaches and practitioners. Despite the instability and difficulty in practical application (Novak et al., 2021), understanding the multifactorial nature of peak match demands may help inform the design of “top-upˮ conditioning sessions. These sessions aim to ensure that the limited match-play exposure of substitutes does not compromise ongoing loading patterns and adaptive responses. By investigating how peak match demands can be influenced by starting status and accounting for position specifics, we can offer insights to practitioners. This includes determining if training should be tailored per position, based in peak match demands, and also evaluating if substitutions can inject fresh dynamism into the match through enhanced physical readiness.
Therefore, this study aimed to determine the peak locomotor match demands between starters and non-starters semi-professional soccer players according to playing position and match outcome at the time of substitution. Furthermore, this study aims to analyze whether variability during peak match demands differs between starters and non-starters. Such information may help in designing “top-upˮ conditioning sessions to ensure that the limited match-play exposure of substitutes does not compromise ongoing loading patterns and adaptive responses.
Methods
Subjects
Twenty-two (n = 22) young outfield soccer players (21.2 ± 1.4 years; 175.2 ± 10.3 cm; 73.2 ± 6.7 kg) from Tier 3 (Highly Trained/National Level competitive) (McKay et al., 2022) participated in this study (goalkeeper excluded). The evaluated team finished among the top four in the league. Players were classified according to playing positions: central defenders (CD; n = 4), fullbacks (FB; n = 4), central midfielders (CM; n = 5), wide-midfielders (WM; n = 5), and forwards (FW; n = 4). According to the role, players were further categorized as starters (>60 min; n = 82 observations) and non-starters (<35 min; n = 82 observations) based on the minutes played during the match (Martin-Garcia et al., 2018). In all cases examined, the starting player initiated the match from the outset. The analysis of the match outcome was carried out with 11 substitutions losing, 20 drawing and 32 winning. During this period, players engaged in 4–5 training sessions per week (alongside 2 weekly gym sessions), in addition to the official competition match. Previously, during the preseason period (6 weeks) the players trained and played preparatory matches with the devices. The data collection was a requirement of the players’ employment, involving daily assessments, therefore no authorization was required from an institutional ethics committee (Carling et al., 2016; Martin-Garcia et al., 2018), Nonetheless, this study adhered to the principles of the Declaration of Helsinki.
Study Design
Over a four-month period, which encompassed the first half of the 2023–2024 championship season from September to December, a total of 17 official matches were registered (including all matches from the first round against each league opponent). Data was assessed both at home (n = 9) and away (n = 8). A total of n = 232 individual observations were extracted from all matches. Only comparisons between starters and their respective substitutes (i.e., non-starters) during the official match were conducted (n = 126 observations) according to playing positions and match outcome; however, all players of the team wore the Global Positioning System (GPS) device during the competition. The researchers did not manipulate the independent variable, and only the coach staff made decisions regarding substitutions based on the needs of the competition.
Procedure
The locomotor performance during the matches was recorded using portable global positioning system (GPS) devices (10 Hz GPS; 100 Hz accelerometer; Statsports, Northern Ireland). These devices exhibited high accuracy and reliability and small errors (<5%, good) were found for peak speed and distances (Beato et al., 2018) and has been previously used in studies that analyze peak match demands (Thoseby et al., 2022). The device was turned on and calibrated following the manufacturer’s instructions, and 15 min before the warm-up (to ensure acceptable satellite coverage), it was positioned on the participants’ backs (between the shoulder blades) using a vest provided by the manufacturer and adjusted to the player’s size. Each player wore the same device throughout the study to avoid interunit variation (Rodríguez-Fernández et al., 2023). The selected variables to determine locomotor performance were previously used by others (Gualtieri et al., 2023; Martin-Garcia et al., 2018) and represented the following metrics covered per minute: total distance (TD), high-speed running distance (HSD, >19.8 km/h), sprint distance (SPD, >25.2 km/h), high metabolic load distance (HMLD, 25.5 W·k−1), number of high-intensity accelerations (ACC, >3 m/s2) and decelerations (DDC, >-3 m/s2), and Player Load (√((acat = i + 1 – acat = i)2 + (aclt = i + 1 – aclt = i)2 + (acvt = i + 1 – acvt = i)2) (Bowen et al., 2017) where: acat = anteroposterior acceleration component; aclt = mediolateral acceleration component; acvt = vertical acceleration component; i = current time point i + 1 = subsequent time point. After the match concluded, the data were transferred to the manufacturer’s software package (Viper Statsports version 4.3.8). The software utilized rolling moving averages to calculate the peak match demands or worse case scenarios (PMD) in 1 (PMD1m) and 3 (PMD3m) minutes for each participant for total distance covered (m/min). The individual PMD for each player (both starters and non-starters) in every match were identified and extracted for subsequent analysis. To determine the PMD, a rolling average method was used by means of an algorithm that detected and calculated the PMD of each variable (e.g., total distance, sprint distance, high-speed running distance). This algorithm calculated the average value of each variable over a moving time window, identifying the periods of 1-min and 3 min durations where the player achieved their maximal output. For instance, in the case of total distance, the algorithm identified the specific 60 s and 180 s periods within the match where the player covered the greatest distance (Oliva-Lozano et al., 2021). All match time, excluding the halftime break between the two halves, was analyzed. Finally, the data were exported into Microsoft Excel (Microsoft Corporation, USA) for further processing and statistical analysis.
Statistical Analysis
A series of linear mixed models were conducted to examine differences in PMD metrics between starters and their respective substitutes under different contextual conditions. Each substitution pair (starter and substitute) was identified by a unique ID and included as a random effect to account for the dependency within matched pairs. Three separate models were performed (i) a model examining the effects of player role (starter vs. non-starter), playing position (central defender, central midfielder, wide midfielder, forward), and their interaction; (ii) a model assessing the influence of player role, positional congruence (same vs. different position), and their interaction; and (iii) a model evaluating the effects of player role, match score status at the time of substitution (winning, losing, drawing), and their interaction. In all models, the restricted maximum likelihood (REML) method was used to estimate parameters. Player role and contextual factors (position, positional congruence, or match score status) were included as fixed effects along with their two-way interactions. Estimated marginal means and 95% confidence intervals were calculated, and pairwise comparisons with Bonferroni adjustments were performed to explore group differences. Cohen’s d effect size (ES) for independent samples between starters and non-starters were calculated and interpreted as trivial (<0.20), small (0.21–0.50), moderate (0.51–0.80), and large (>0.80) (Cohen, 2013; Lakens, 2013). Model fit was evaluated using both marginal (R2m) and conditional (R2c) coefficients of determination to quantify the proportion of variance explained by fixed effects alone and by both fixed and random effects combined, respectively. Additionally, the intraclass correlation coefficient (ICC) was calculated to assess the proportion of total variance attributable to differences between substitution pairs. These metrics provided insight into the relative contributions of the fixed predictors and the random grouping structure to the variability observed in the PMD metrics. All analyses were performed using IBM SPSS Statistics (version 26.0; IBM Corp, Armonk, NY, USA), Jamovi (version 2.2.26.0; The Jamovi Project) and Microsoft Office Excel (Microsoft Corp, Redmond, Washington, DC, USA). Statistical significance was accepted at the p < .05 level.
Results
A total of 82 substitutions were analyzed, 3 for CD, 7 for FB, 13 for CM, 26 for WM and 24 for FW. Starter players played 69.6 [65.7–73.4] mins compared to 20.0 [16.6–23.2] min for non-starter (p = .000). The demands during PMD, depending on whether the playing position is the same (n = 61) or different (n = 12) in the substitution, are shown in Figure 1. Peak locomotor match demands (mean and 95%CI) in starters (S) and non-starters (NS) players in 1 (PMD1m) and 3 min (PMD3m) epochs according if the playing position during the substitution is the same or different. TD = total distance; HSD = high-speed running distance (>19.8 km/h); SPD = sprint distance (>25.2 km/h); ACC = high-intensity accelerations (>3 m/s2); DCC = high-intensity decelerations (>-3 m/s2); HMLD = high metabolic load distance; PL = Player Load. * Significant differences with starter player. Level of significance p < .05.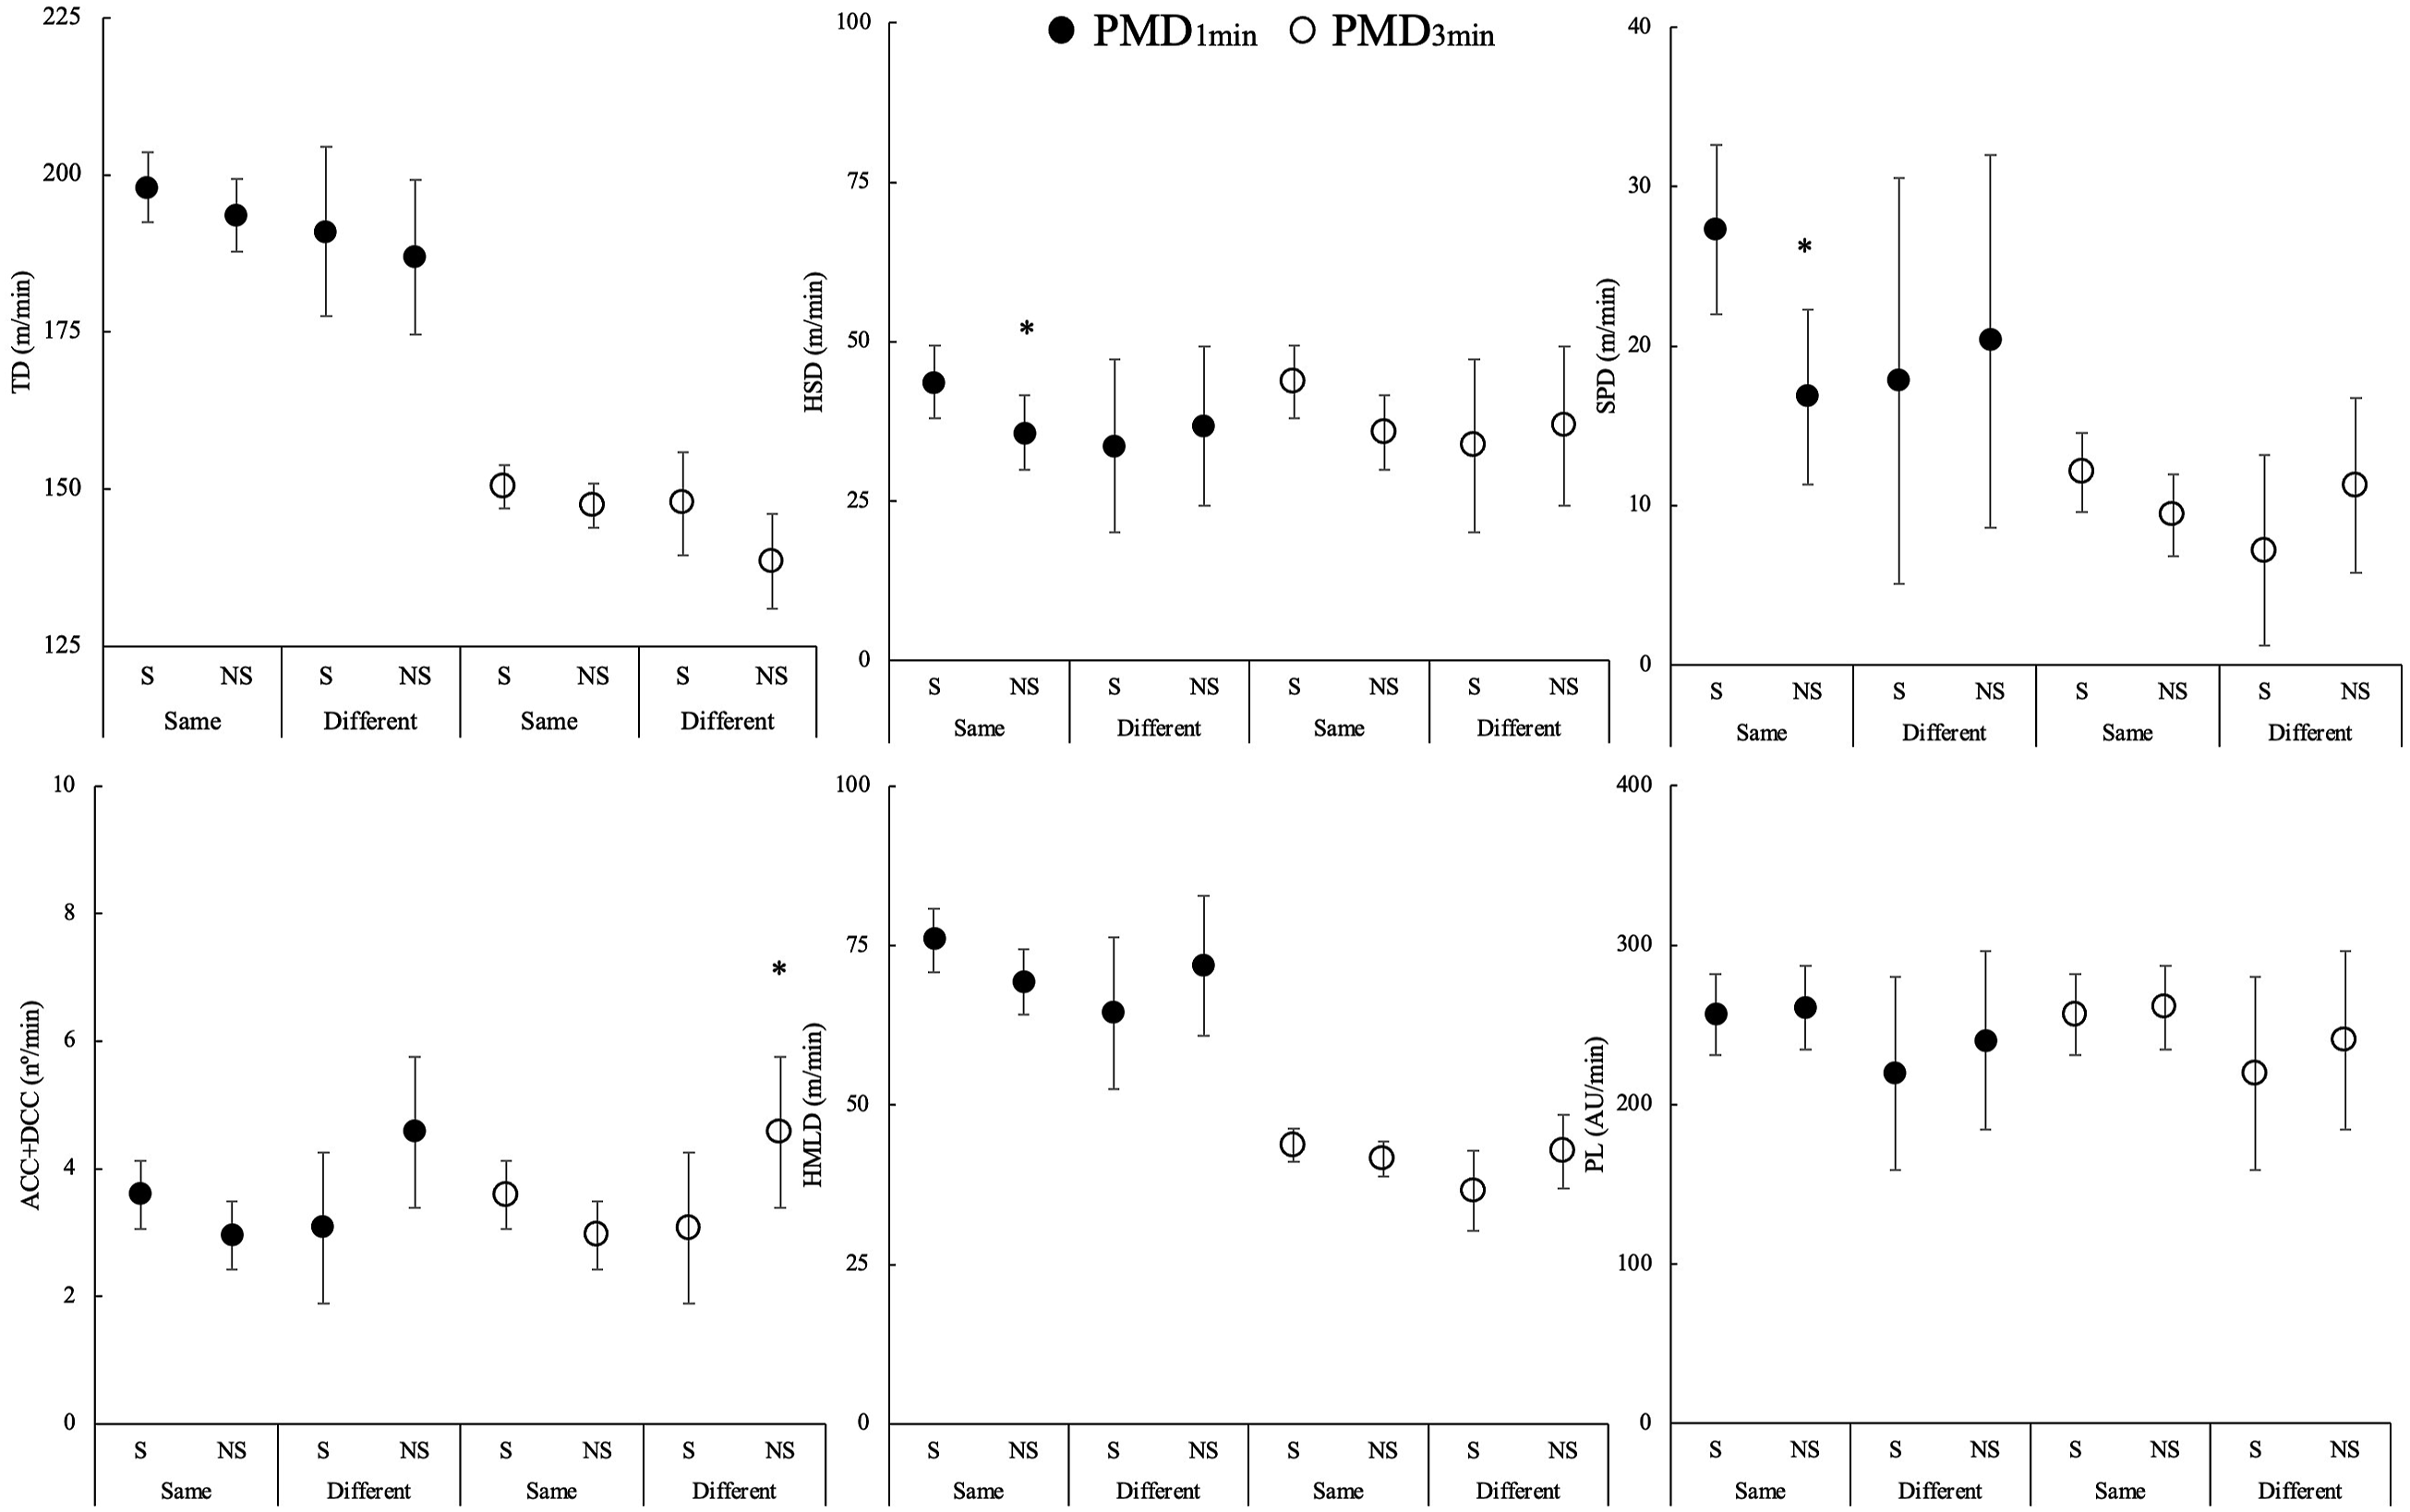
The linear mixed models revealed a significant interaction between player role and positional congruence for PMD1min demands in ACC + DCC (F = 5.281, p = .023). The model explained 4.3% of the variance through fixed effects (R2m = 0.043), and 4.3% when including random effects (R2c = 0.043). The ICC was 0.000, indicating that virtually no variance was attributable to differences between pairs. Specifically, the difference between starters and non-starters was influenced by whether the substitution involved players in the same or in different positions. However, no significant interaction effects were found for the other metrics, including TD (F = 0.002, p = .967), HSD (F = 1.424, p = .237), SPD (F = 1.851, p = .176), HMLD (F = 2.947, p = .090), and PL (F = 0.141, p = .708). Across these variables, R2m ranged from 0.012 to 0.052, while R2c ranged from 0.052 to 0.231 for these metrics. The ICC varied between 0.000 and 0.204, indicating a generally low to moderate contribution of differences between substitution pairs to the total variance. Box plot analysis (data distribution) and coefficient of variation of starters and non-starters players in peak locomotor match demands in 1 (PMD1m) and 3-min (PMD3m) epochs. TD = total distance; HSD = high-speed running distance (>19.8 km/h); SPD = sprint distance (>25.2 km/h); ACC = high-intensity accelerations (>3 m/s2); DCC = high-intensity decelerations (>–3 m/s2); HMLD = high metabolic load distance; PL = Player Load.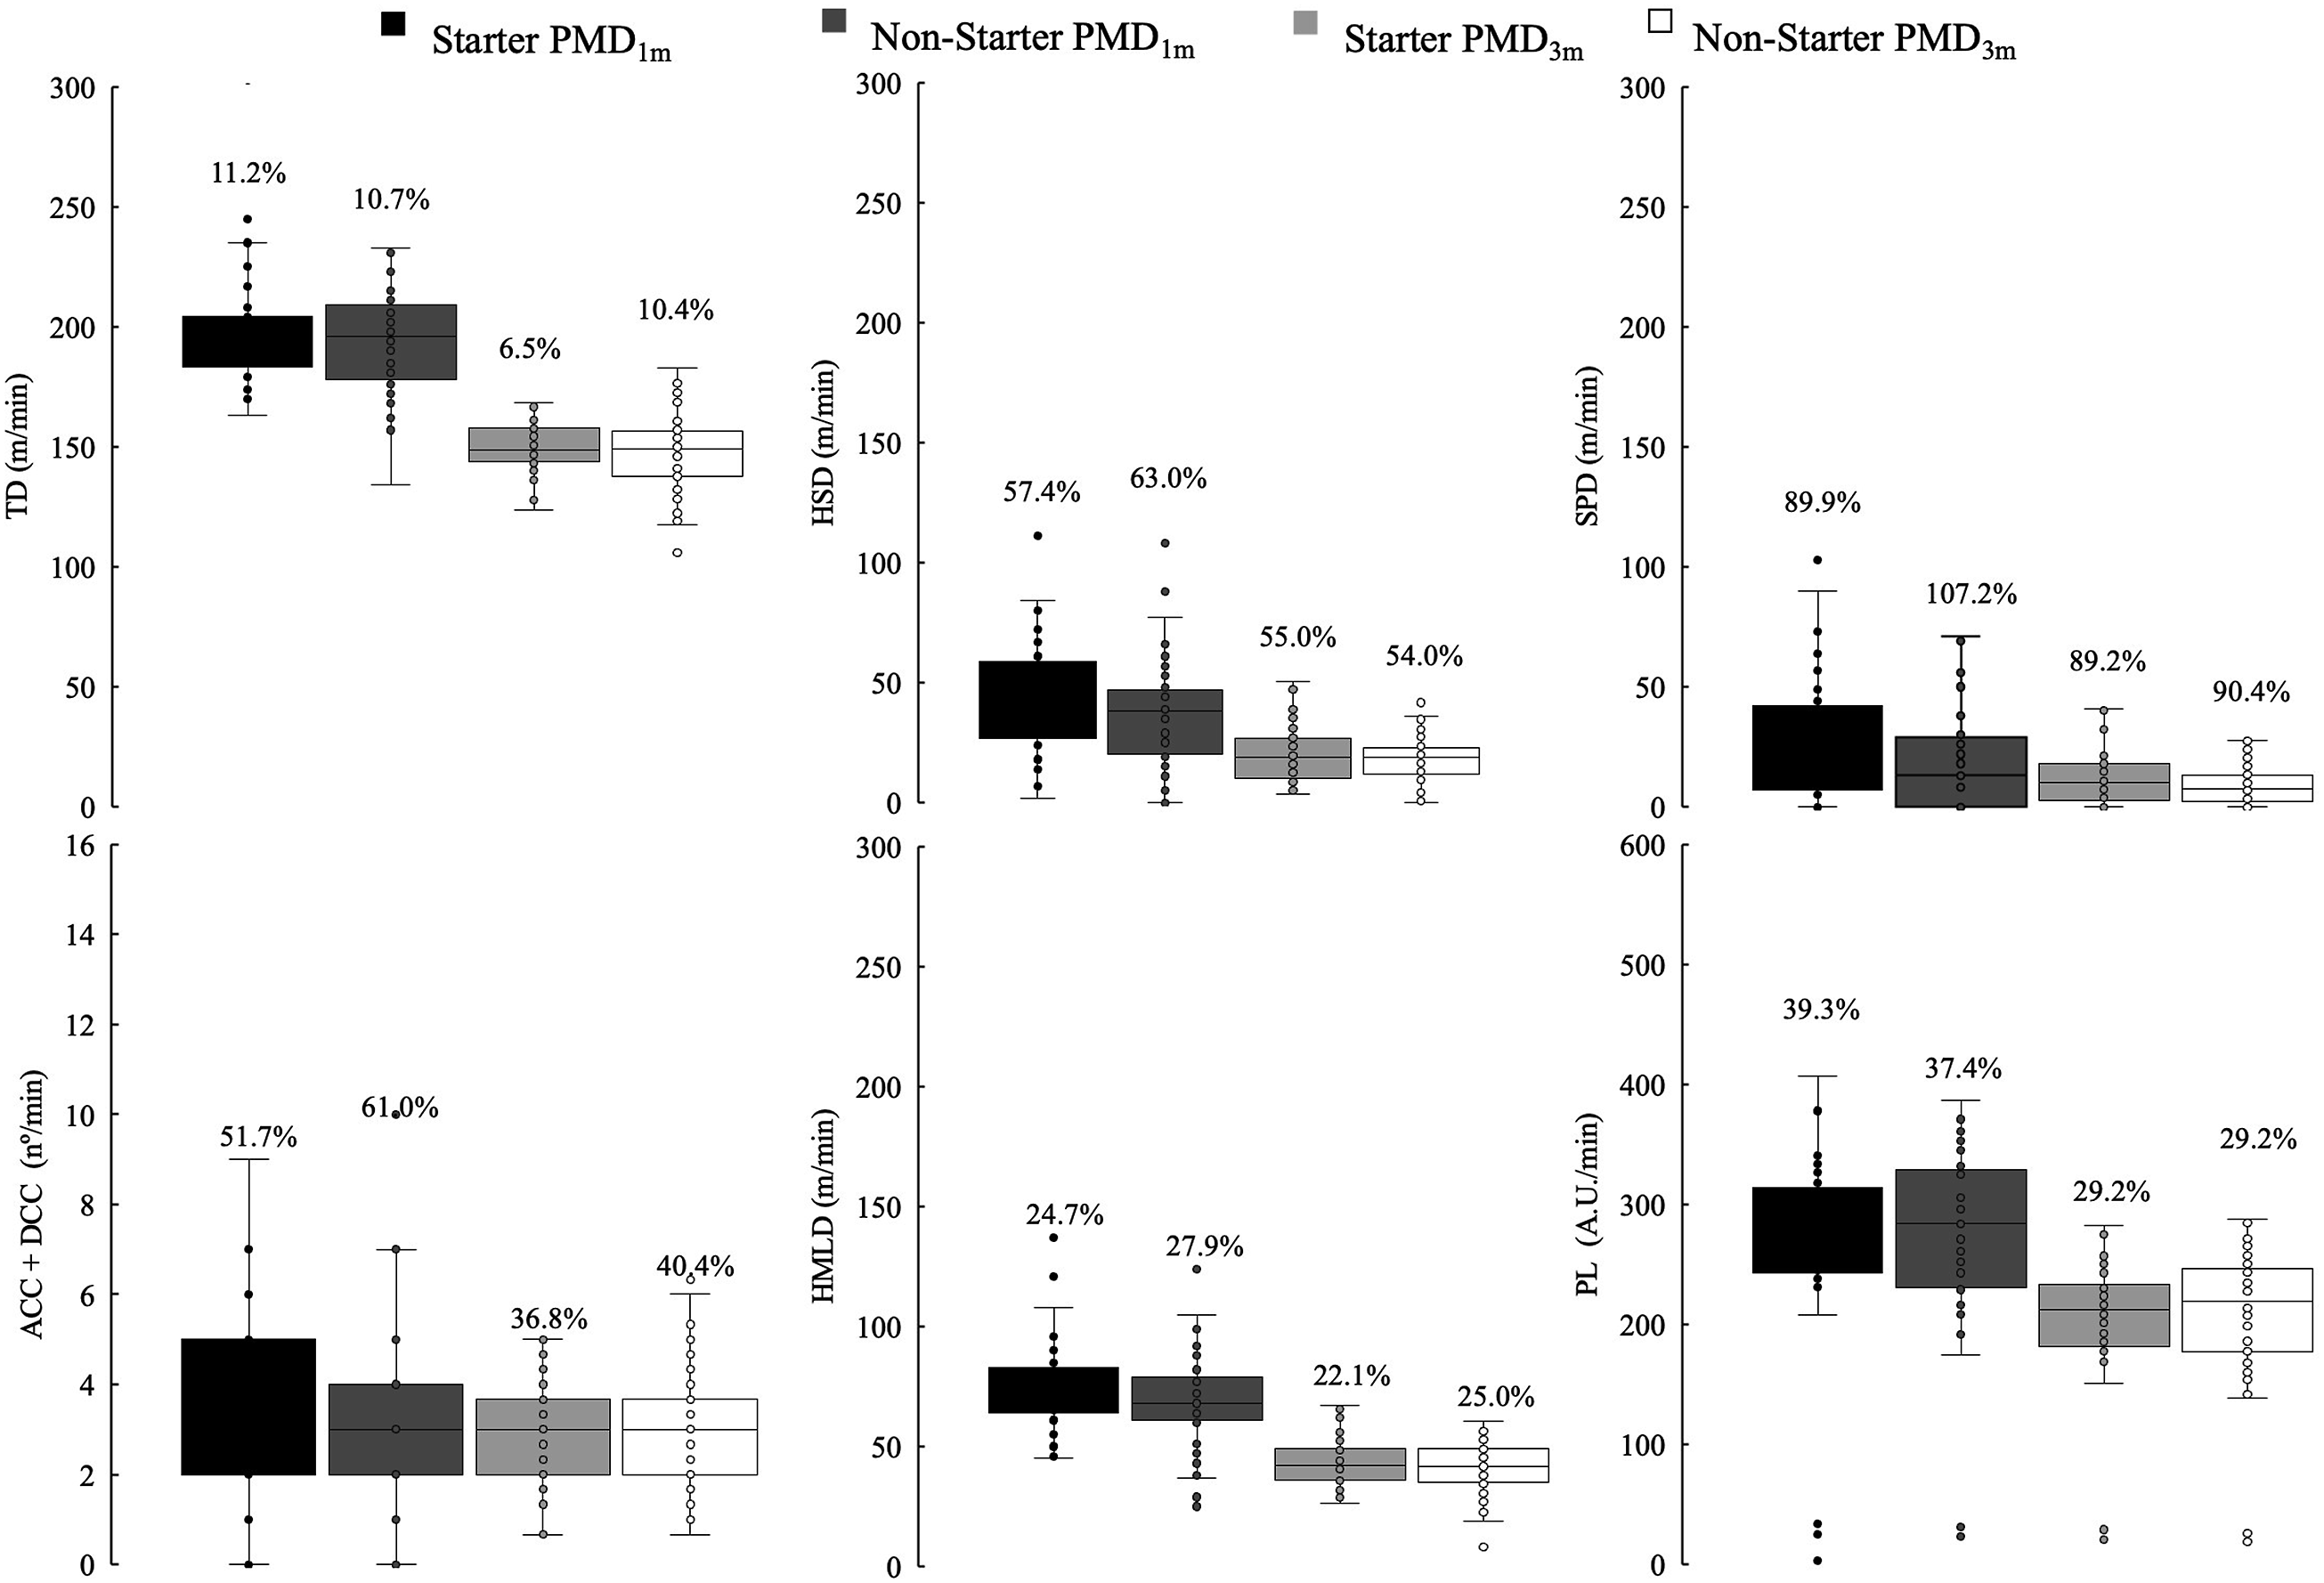
Similarly, for PMD3min a significant interaction effect was observed for ACC + DCC (F = 6.697, p = .011). The model explained 4.8% of the variance through fixed effects (R2m = 0.048), and 9.1% when including random effects (R2c = 0.091). The ICC was 0.044, suggesting a small proportion of variance attributable to differences between pairs. No significant interactions were detected for the remaining variables: TD (F = 1.109, p = .296), HSD (F = 2.194, p = .143), SPD (F = 2.277, p = .134), HMLD (F = 3.141, p = .080), and PL (F = 0.094, p = .759). Across these variables, R2m ranged from 0.005 to 0.054, while R2c ranged from 0.005 to 0.126, and the ICC from 0.000 to 0.075, indicating generally low model explanatory power and minimal between-pair variability.
Estimated Marginal Means [95% CI] of Peak Match Demands External Load Variables for Starters and Their Respective Non-starter According to Playing Position for 1 min Epoch.
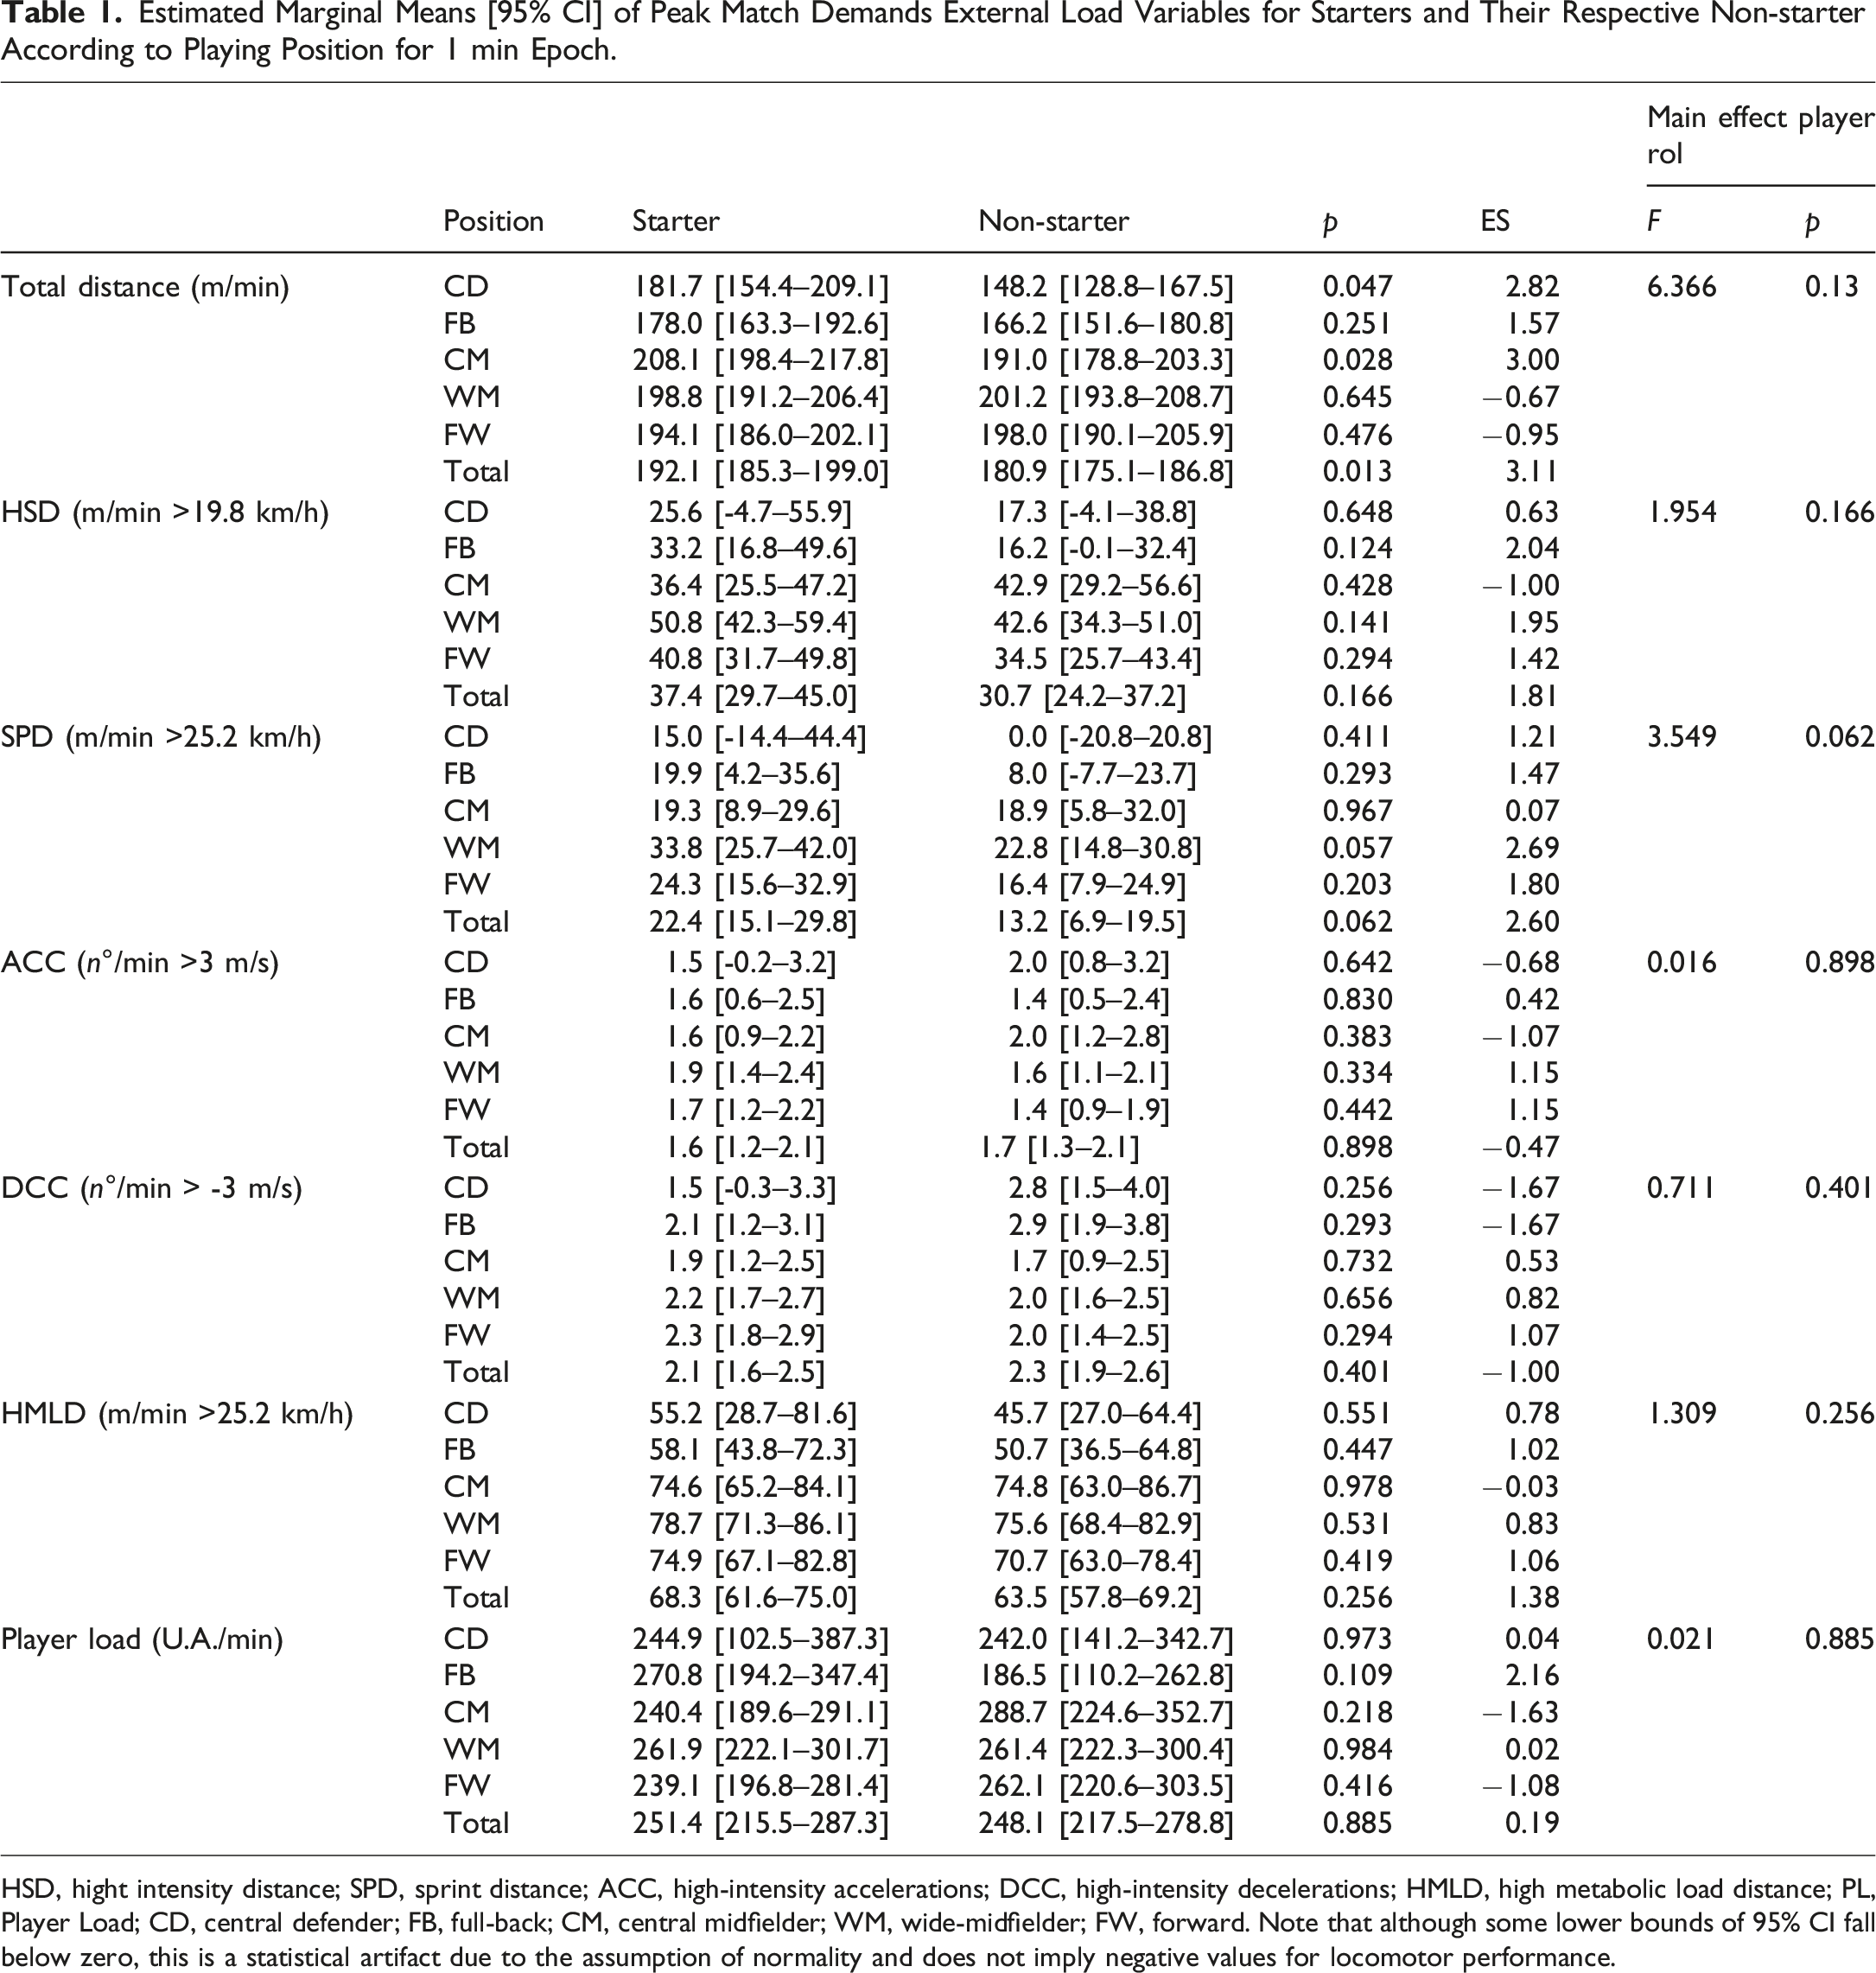
HSD, hight intensity distance; SPD, sprint distance; ACC, high-intensity accelerations; DCC, high-intensity decelerations; HMLD, high metabolic load distance; PL, Player Load; CD, central defender; FB, full-back; CM, central midfielder; WM, wide-midfielder; FW, forward. Note that although some lower bounds of 95% CI fall below zero, this is a statistical artifact due to the assumption of normality and does not imply negative values for locomotor performance.
Estimated Marginal Means [95% CI] of Peak Match Demands External Load Variables for Starters and Their Respective Non-starter According to Playing Position for 3-Min Epoch.
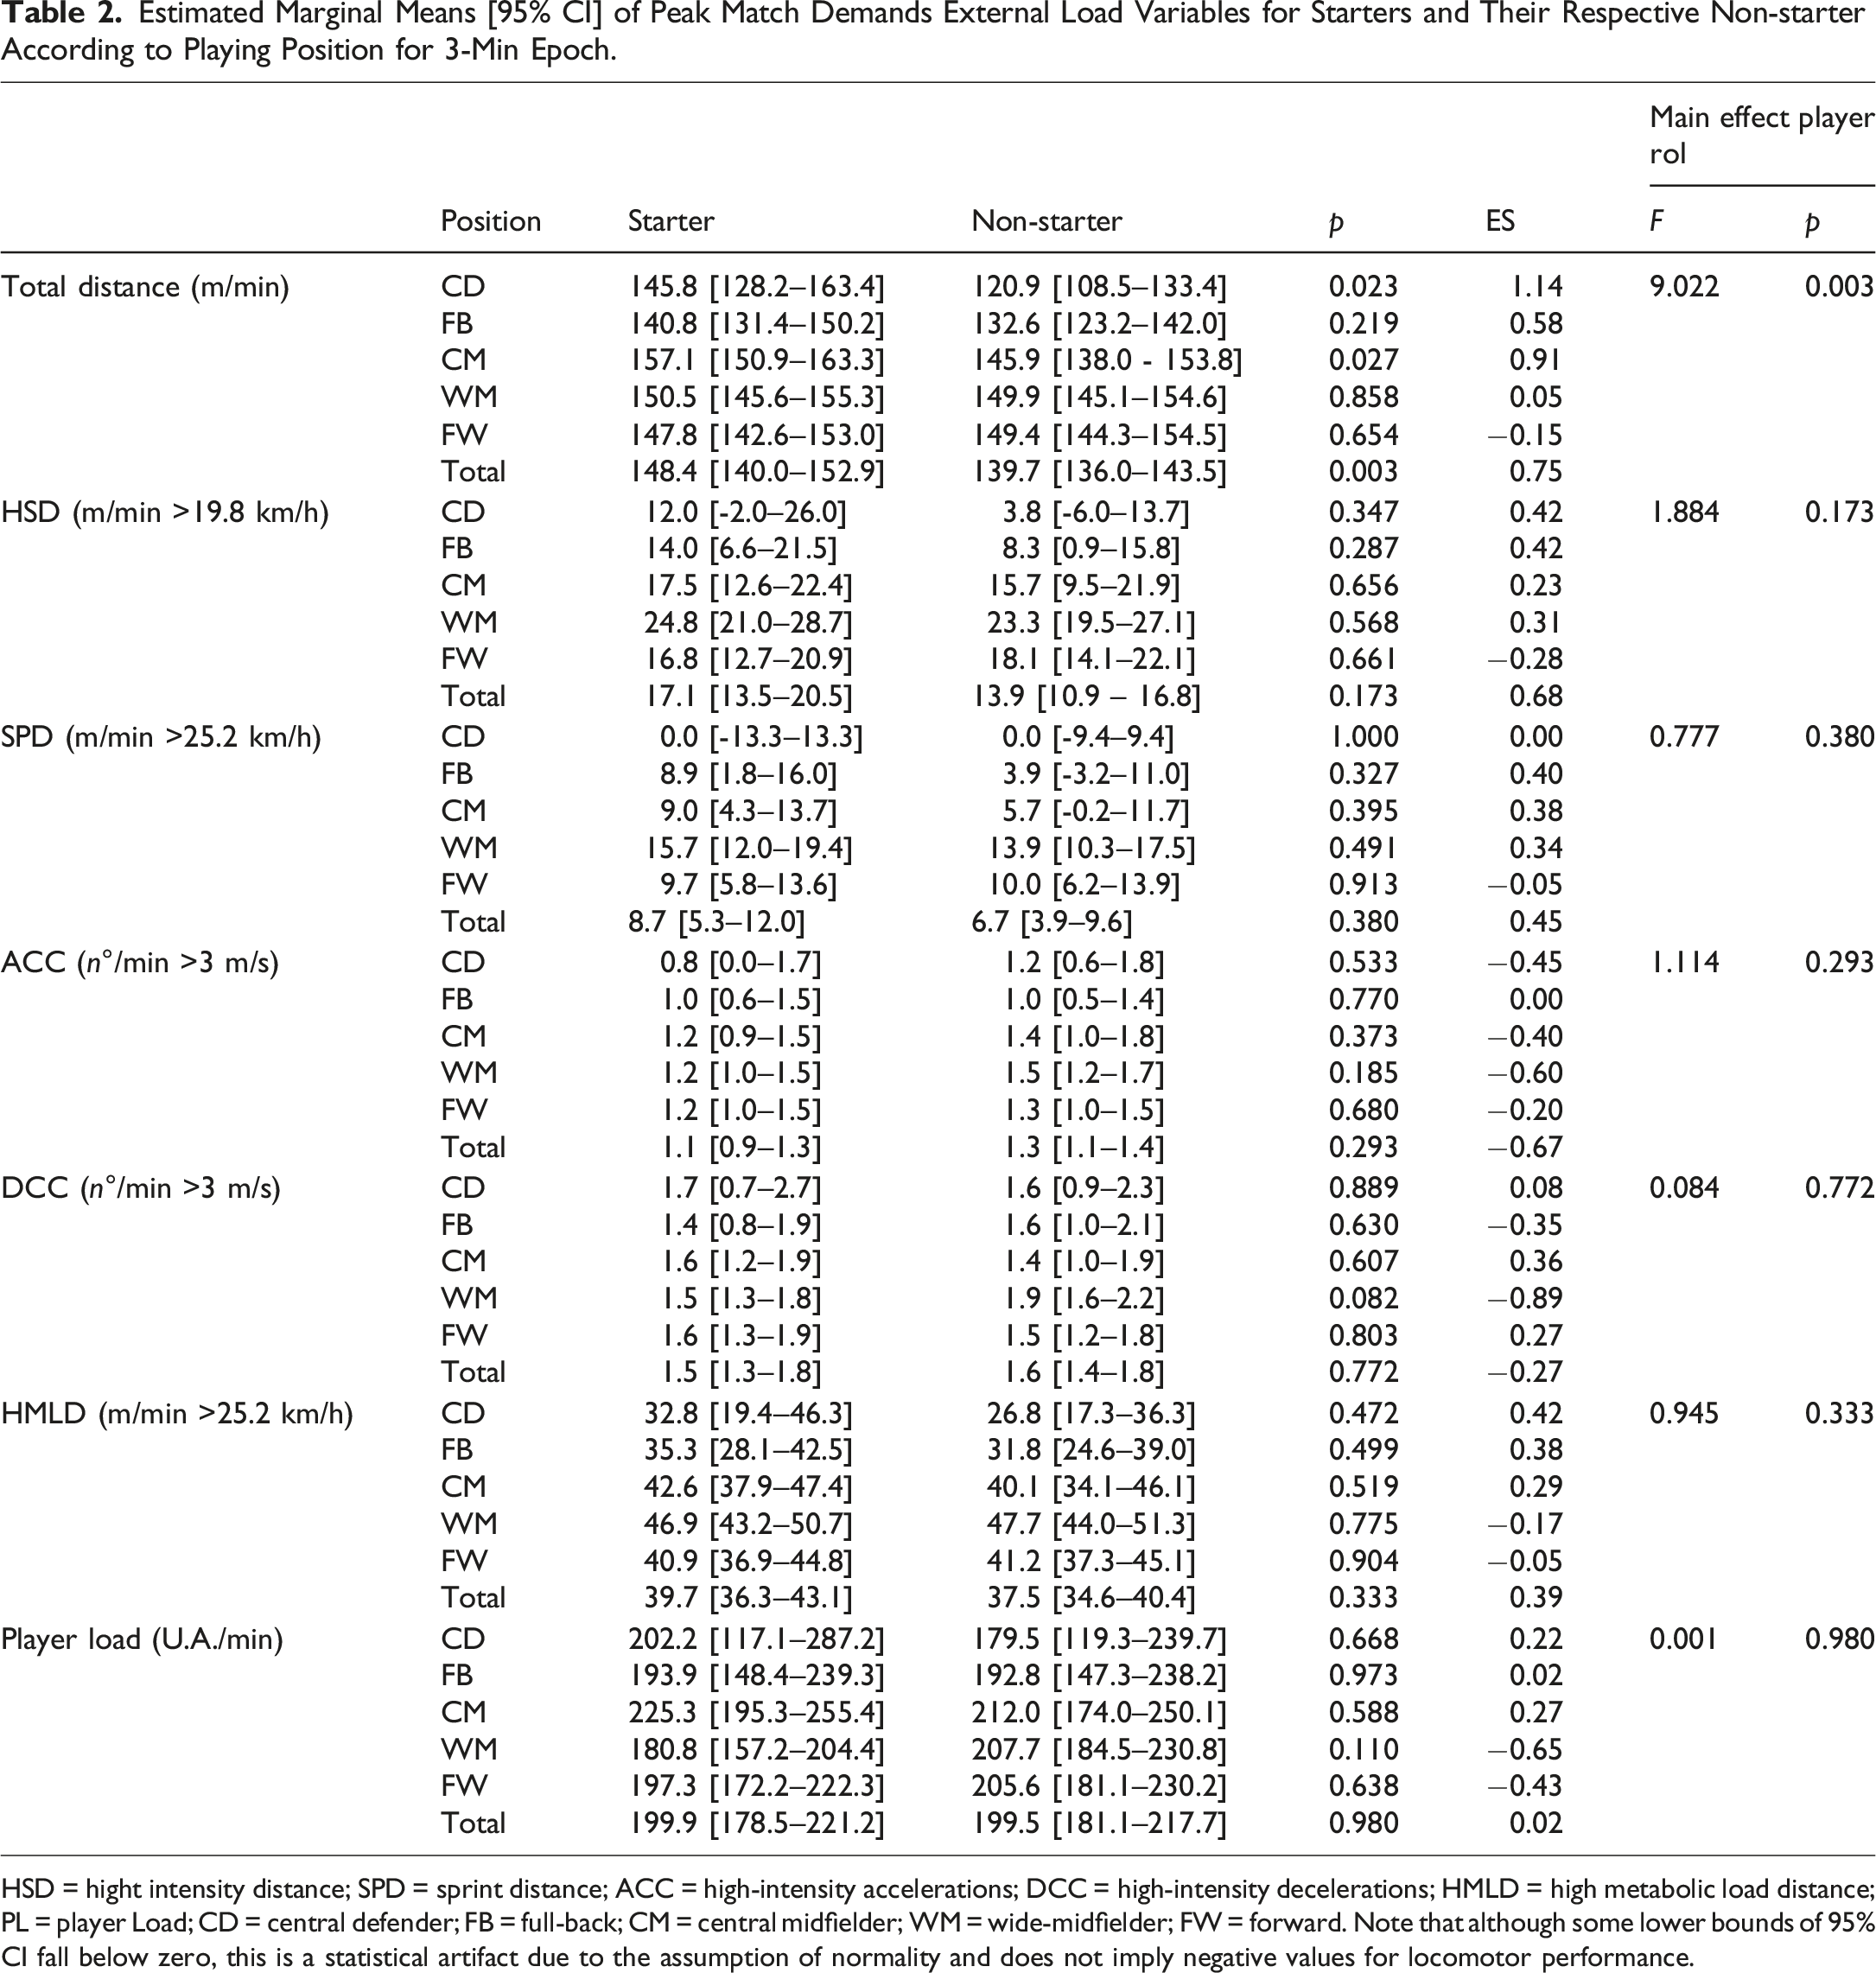
HSD = hight intensity distance; SPD = sprint distance; ACC = high-intensity accelerations; DCC = high-intensity decelerations; HMLD = high metabolic load distance; PL = player Load; CD = central defender; FB = full-back; CM = central midfielder; WM = wide-midfielder; FW = forward. Note that although some lower bounds of 95% CI fall below zero, this is a statistical artifact due to the assumption of normality and does not imply negative values for locomotor performance.
The between-players variability in the various metrics analyzed during peak match demands, based on the player’s role (starter and non-starter), are shown in Figure 2. Additionally, the interquartile range (box) and the expected variance of the data are shown.
The linear mixed model revealed a significant interaction effect between player role and match score status for HSD (F = 3.402, p = .039) in the PMD1min, with the model explaining 6.6% of the variance through fixed effects (R2m = 0.066) and 28.6% when including random effects (R2c = 0.286) (Figure 3). The ICC was 0.234, indicating a moderate proportion of variance attributable to differences between substitution pairs. Similarly, a significant interaction was found for SPD (F = 3.308, p = .042), with R2m = 0.083 and R2c = 0.097. The ICC was 0.014, reflecting minimal between-pair variability. These findings indicate that differences in external load between starters and substitutes varied depending on whether the substitution occurred while the team was winning, losing, or drawing. Specifically, starters covered greater HSD and SPD than their respective substitutes during PMD1min. No significant interaction effects were observed for TD (F = 1.508, p = .228), ACC + DCC (F = 1.189, p = .307), HMLD (F = 2.226, p = .115) and PL (F = 0.615, p = .544). Across these models, R2m ranged from 0.019 to 0.066, and R2c ranged from 0.019 to 0.250. The ICC values ranged from 0.000 to 0.197, indicating variability in the contribution of between-pair differences. Peak locomotor match demands (mean and 95%CI) in starters (S) and non-starters (NS) players in 1 (PMD1m) and 3-min (PMD3m) epochs according to match outcome at the moment of the substitution. TD = total distance; HSD = high-speed running distance (>19.8 km/h); SPD = sprint distance (>25.2 km/h); ACC + DCC = high-intensity accelerations (>3 m/s2) and decelerations (>-3 m/s2); HMLD = high metabolic load distance; PL = Player Load. * Significant differences with Starter. Level of significance p < .05.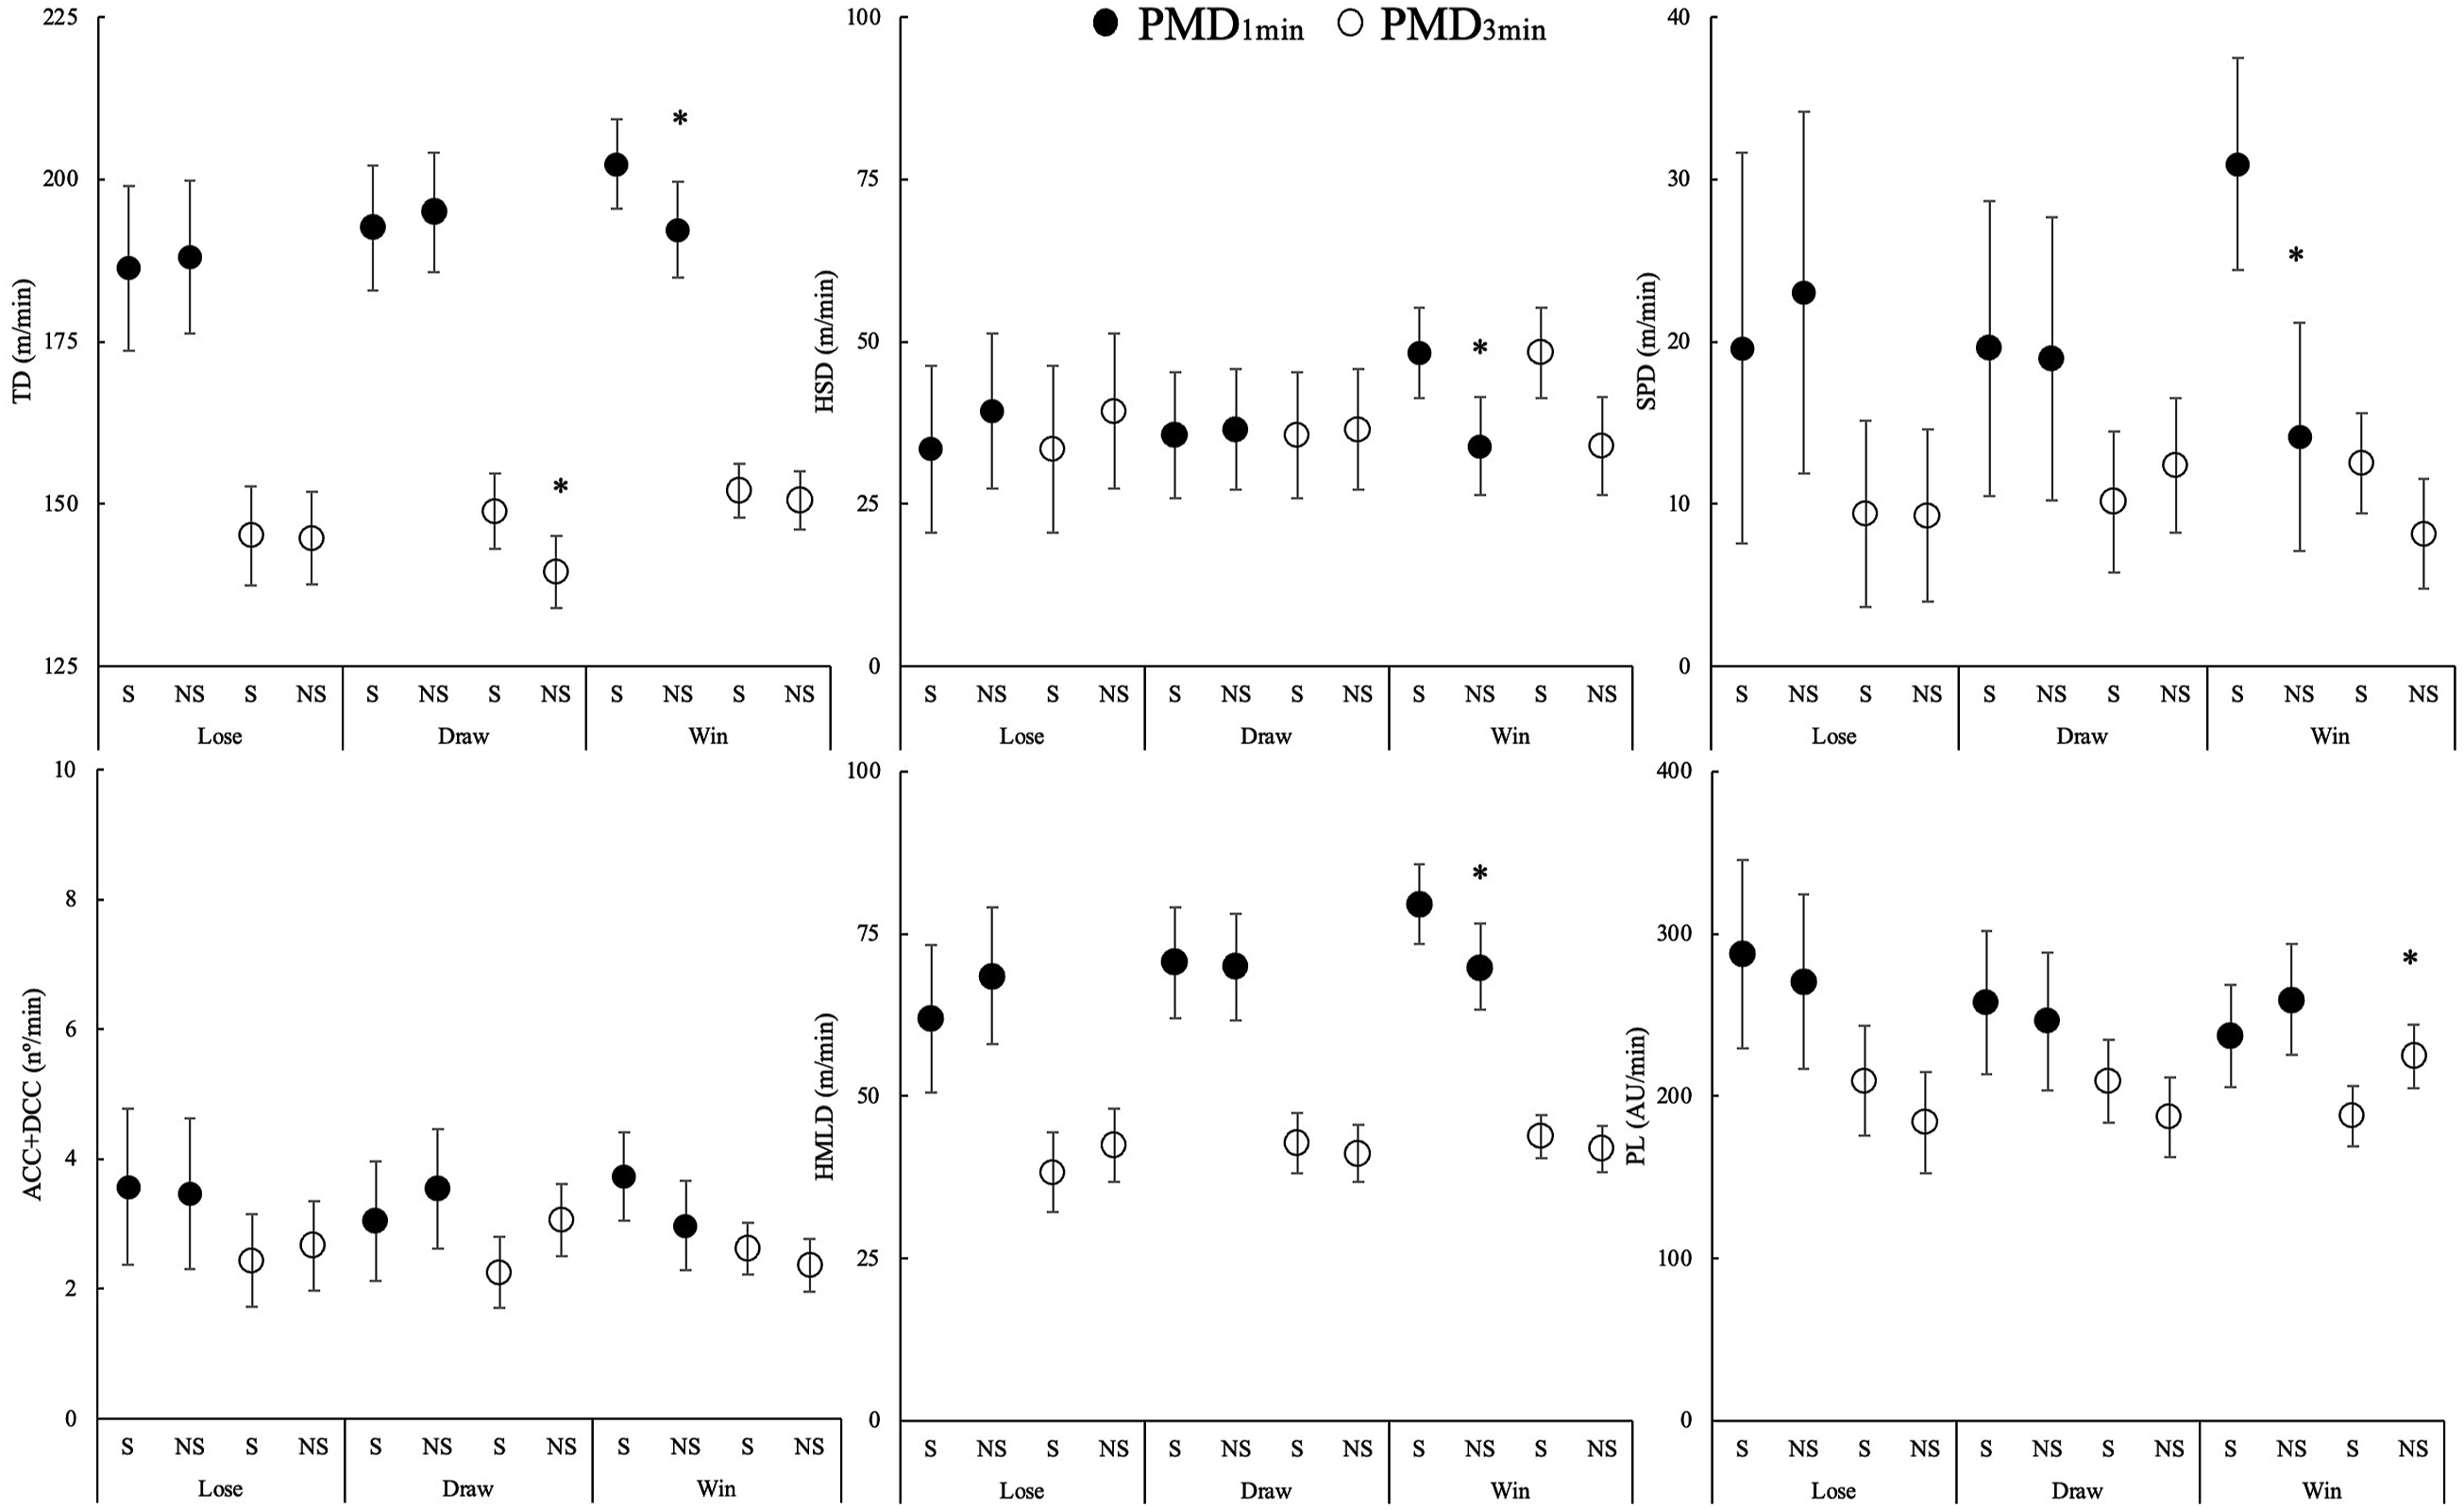
In contrast, during PMD3min, no interaction effects were identified for TD (F = 1.426, p = .247), HSD (F = 0.667, p = .512), SPR (F = 1.562, p = .213), ACC + DCC (F = 2.434, p = .094), HMLD (F = 0.844, p = .434), and PL (F = 0.454, p = .231). Across these models, the R2m ranged from 0.014 to 0.098, and R2c ranged from 0.031 to 0.108. The ICC values ranged from 0.000 to 0.067, indicating limited between-pair variability.
Discussion
The aim of this study was to explore the peak locomotor match demands between starters and non-starters soccer players according to playing position and match outcome. Additionally, to know whether variability during peak match demands differs between starters and non-starters. The main results demonstrated that when the playing position of the non-starting player is the same as the starting player, peak match demands are similar except for high-speed and sprint distance in PMD1m, which is higher in the starting players. The analysis based on player demarcation reveals that starting CD and CM cover a significantly greater total distance during PMD1m compared to their respective non-starter. Moreover, starting players cover a greater distance at high intensity, sprint, and high metabolic load distance in PMD1m when the substitution occurs while winning compared to their respective non-starter player. Finally, greater variability has been observed in the metrics related to high intensity (i.e., HSD or SPR) compared to TD, with similar values of between-players variability in starters and non-starters soccer players.
From the authors’ knowledge previous studies in soccer have compared mean full match demands between starting and non-starting players (Hills et al., 2022; Lorenzo-Martínez et al., 2021). Additionally, recent research has analyzed player status during peak match demands with differing results. Bortnik et al. (2023) showed that non-starters players generated higher physical output in all metrics analyzed during PMD compared to starting players. Possibly due to the self-pacing strategy adopted by starters to minimize physical exertion and preserve energy over the course of the match (Bradley & Noakes, 2013). In contrast, Sydney et al. (2023) demonstrated that non-starter players (fullback and midfielders) generally produced lower peak total distance and peak high-speed running distance compared to starting and full-match players. Our results show similar peak match demands between starting and non-starting players, except for TD in PMD1m and PMD3m which are higher in starting players. Typical match-day substitute warm-up protocols failed to maintain core body temperatures of substitute players before entering the pitch, subsequently impacting their physical performance upon entry (Hills et al., 2021). Consequently, the reduced peak high-speed running demonstrated by substitutes could be attributed to a lack of physical preparation prior to entering the pitch to meet the peak demands of match-play. In addition, soccer players decline in 50% the distance covered at submaximal and maximal intensities when winning suggests that players do not always use their maximal physical capacity (Lago et al., 2010). So, match outcome can be another reason for the differences between starting and non-starting players in HSD, SPD, and HMLD in PMD1m. Finally, soccer is a complex sport where tactical dynamics also play a significant role (Clemente et al., 2020). Changes in the match dynamics can cause different physical demands leaving us questioning why the dynamics of the game can explain the current time-motion profile of players.
Previous research has explored match outcomes (winning, drawing or losing) in relation to locomotor performance (Brito et al., 2016; Trewin et al., 2018). Lago et al. (2010) observed that during a match, the total distance covered at submaximal or maximal intensities (>19.1 km/h) decreased by 0.95 m for each minute leading. In our study, starting players covered more HSD, SDP, and HMLD in PMD1m when the team is winning. Similarly, Fereday et al. (2020) demonstrated that TD and HSD were greater in both wins and losses compared to draws, with TD during wins surpassing that of losses in professional soccer players. Match outcome played a significant role as a contextual variable, influencing 1-min and 3-min PMD, while no effect was observed on 5-min or 10-min PMD (Oliva-Lozano et al., 2020). These reduced demands exhibited by non-starter players when leading could be attributed to adopting conservative strategies or to the winning teams displaying superior technical-tactical skills, consequently requiring less distance covered than the losing teams (Di Salvo et al., 2009; Lago et al., 2010).
It has been reported that CM cover a greater TD compared to other playing position in mean match values (∼130 m/min) (Di Salvo et al., 2007, 2009) and PMD (∼126–200 m/min) (Martin-Garcia et al., 2018; Rico-González et al., 2022), like due to their pivotal linking role within the team, thus warranting special attention to this metric in this specific position. Our findings reveal that in PMD1m starting CM covered significantly more TD than non-starters. These results could explain why coaches favor certain players for starting roles over others. However, when examining SPD, a metric crucially associated with injury risk (Buchheit et al., 2023; Shah et al., 2022) and performance (Faude et al., 2012; Martínez-Hernández et al., 2023), our results diverge from those of Sydney et al. (2023) that demonstrated more aggressive pacing behavior, reflected in the increased relative high-speed running (>18 km/h) in non-starting players. Moreover, previous research has shown that WM performed more high-intensity actions than other positions in 1-min epoch (Martin-Garcia et al., 2018) our findings reveal that WM cover the most SPD in both PMD1m and PMD3m. Furthermore, non-starting wide-midfielders covered significantly less SPD in PMD1m (p = .048; ES = 0.62), a trend consistent across the entire sample (p = .021; ES = 0.46). Recent investigations have also indicated no playing positions’ differences in HSD (>19.8 km/h) (p = .07) or SPD (>25.2 km/h) in 1-min PMD (p = .09) suggesting that achieving positional distinctions in competitive match play PMD becomes more challenging as the speed threshold increases. Nonetheless, the employed playing system or team level may have influenced these outcomes.
It is clear that coaches use the substitutions not only to prevent the effects of fatigue but also as a key mechanism to counteract the effects of the game, (Hills et al., 2022; Mohr et al., 2005) specially related to tactical movements or player profile (more defensive or offensive). Thus, it is not unusual to substitute one player with another from other position. Our results linked to that aspect have shown that starters PMD1m TD and SPD and PMD3m ACC + DCC were only significantly lower if the substitute played in the same position, highlighting the importance of examining this situational factor before comparing starters versus non-starters.
Match-to-match variability of locomotor metrics has been extensively analysed (CV ∼ 20%–30%) (Bush et al., 2015; Carling et al., 2016). In terms of peak match demands, between-match variability of relative TD was low (CV: 6.8%–7.3%) but higher in HSD (CV: 20.6%–29.8%) (Thoseby et al., 2022). Our results exhibit higher CV, particularly in HSD (CV: 54.0%–63.0%) and SPD (CV: 89.2%–107.2%) for both starting and non-starting players, yet align with findings reported by other studies (CV: 9.2%–65.8%). (Bortnik et al., 2023) Additionally, similar CV values were observed in PMD1m and PMD3m for all metrics. Previous studies have noted that variability gradually increases with longer epoch durations; however, the shorter durations utilized in this study (1- and 3-min) may contribute to higher unpredictability in match play compared to longer epochs (Bortnik et al., 2023). Analysis based on player role reveals similar CV for all metrics and time epochs. Hence, the lack of differentiation between starters and substitutes in PMD variability in our study could be attributed to the inherent unpredictability of shorter epoch durations and the consistent variability across player roles. Our findings suggest that PMD variability appears comparable between starting and substitute players, despite differences in absolute values.
Our findings indicate that PMD are similar between starter and non-starter soccer players, except for TD in PMD1m. These results suggest the potential need for strategies (e.g., tailored warm-ups or specific training drills) that could adequately prepare substitutes to confidently face such scenarios upon entering the competition. However, as an observational study, our data do not directly test the efficacy of specific interventions; rather, they provide insights into current demands that can inform future experimental research on optimal preparation strategies. In turn, this readiness may ensure that substitute players are primed to excel in pivotal moments, offering them an edge over the opposition. However, starting players, particularly CD and CM for TD, demonstrate higher peak match values, underscoring the importance of preparing starting players for these situations. Furthermore, the data presented in this study reveal that when substitutions occur with a favorable match outcome, non-starter players exhibit lower peak match demands. Hence, our findings suggest that consideration of both the match outcome and player condition (such as fitness level or injury recovery) may be important in player selection decisions.
However, caution is warranted when interpreting these findings, and several limitations need to be acknowledged. Firstly, despite collecting data throughout an entire half season (match in front of all teams) only one substitution for the CD has been analyzed. Furthermore, future studies should aim to analyze a greater number of substitutions across this and other playing positions. Secondly, although matches both home and away have been included, no analysis has been conducted on matches against the same team in both scenarios. Therefore, future studies should examine this situation. Finally, it is possible that the PMD of starting and non-starting players occurs under a different match outcome than what is recorded at the moment of substitution, thus future studies could link PMD to the actual match outcome at the time of occurrence.
Conclusions
In conclusion, our study highlights similarities in peak locomotor match demands between starting and non-starting soccer players, except for TD in PMD1m and PMD3m which was higher in starting players. Notably, starting players exhibited greater high-intensity efforts (HSD, SPD and HMLD) in PMD1m, when substitutions occurred while winning. The examination based on player positions shows that starting CB and CM covered more TD during PMD1m compared to their respective non-starters. While previous studies have shown variability in match demands, our findings align with some and diverge from others, emphasizing the complexity of player performance dynamics. Strategies to adequately prepare substitutes for match scenarios are crucial, considering factors such as playing position, match outcome, and individual player condition. However, further research is needed to comprehensively understand the factors influencing player performance and substitutions in soccer matches.
Footnotes
Acknowledgements
The authors would like to acknowledge to Andrés Pérez Barrero for her assistance with the data analysis.
Ethics Approval
This study was performed in line with the principles of the Declaration of Helsinki and was approved by University of León Ethical Committee.
Funding
The authors received no financial support for the research, authorship, and/or publication of this article.
Declaration of Conflicting Interests
The authors declared no potential conflicts of interest with respect to the research, authorship, and/or publication of this article.
Data Availability Statement
The data will be sent after a justified request.