






Abstract
Accurate judgements of others’ actions are essential during time-constrained interactions, but deceptive signals often make this difficult. Traditional analyses of deception rely on separate measures of response accuracy for genuine and deceptive trials, with researchers often making inferences from accuracy on deceptive trials alone. This approach is limited in that it does not directly measure the ability to differentiate between deceptive and genuine actions nor the possibility that expertise effects are confounded by differences in response bias. Signal detection analysis provides two key indices: discriminability (d′), reflecting the ability to differentiate genuine from deceptive actions, and bias (c), indicating tendencies toward judging actions as genuine or deceptive. This article outlines the conceptual advantages of signal detection analysis over conventional methods and provides practical guidance for calculating discriminability and bias, including corrections for extreme values, with a worked example for a repeated-measures ANOVA. By adopting signal detection analysis, researchers can better capture the perceptual and cognitive processes underlying perception of deception, quantifying susceptibility to, and detection of deception, as well as exploring contextual influences such as prior expectations. This approach offers a more comprehensive understanding of expertise effects and opens new avenues for training and perceptual research.
Perceptual anticipation is an important skill in everyday life that enables individuals to interpret their environment and respond appropriately. Across many forms of human interaction, the ability to interpret others’ intentions is fundamental for success, but when signals are deceptive this process is significantly more difficult. This challenge is exaggerated in sporting duels, where it plays a crucial role in determining the result for a team or individual. Be that a penalty kick in association football, a one-on-one duel in rugby, or a ground stroke in tennis (the list could go on); all these time-constrained interactions have the potential to determine the outcome of a competition. Central to this challenge is the ability to judge whether the intent conveyed by an opponent is genuine or fake, and it is of little surprise that experts are considered to predict (anticipate) the actions of an opponent more effectively than their less skilled counterparts (Güldenpenning et al., 2013; Mann et al., 2007).
This methodological guide is intended for researchers and students who have a working understanding of experimental design and statistical analysis, but are unfamiliar with Signal Detection Theory and its application to perceptual judgements of deception in sport. We provide an overview of the use of signal detection analysis for scenarios in which an individual must judge whether an action is genuine or deceptive. While further reading will be required for a comprehensive understanding of this topic, after completing this article the reader should be able to describe the differences between traditional and Signal Detection Theory analysis of perceptual judgements, understand how to interpret indices of discriminability and bias, and be able to conduct an analysis of signal detection data with repeated measures.
A search of the Web of Science database reveals that more than 1000 studies have been published on anticipation and deception in sport. The term ‘anticipation’ implies the ability to use, or be attuned to, information from before the point at which veridical information becomes available to the observer. Across many time-constrained skills in individual and team sports, higher-skilled players are shown to have an advantage over lesser-skilled players in anticipation (Abernethy et al., 2007; Müller & Abernethy, 2012; Murphy et al., 2019) and judgement of deceptive actions (Jackson et al., 2006; Jackson & Cañal-Bruland, 2019). Two meta-analyses showed that the expertise effect for response accuracy was larger when researchers used more representative field-based or ‘in situ’ study designs than for studies that used static images or video-based stimuli research designs (Mann et al., 2007; Travassos et al., 2013). Nonetheless, expertise effects are also present in the most common experimental designs in which researchers systematically manipulate the time at which video stimuli are occluded (temporal occlusion) or the sources of information available to the participant (spatial occlusion). In these studies, researchers usually measure response accuracy as their primary dependent variable. In video-based designs without temporal occlusion, researchers typically report response accuracy and response time to show that (hopefully!) any observed effects are not confounded by speed-accuracy trade-offs (Abernethy et al., 2012; Loffing et al., 2015).
Signal Detection Analysis
Use of response accuracy as the dependent variable in video-based, temporal occlusion experiments has served researchers well. It has allowed us to control and manipulate the test video clips, identify how response accuracy changes as the action unfolds, and to see how responses to these manipulations are moderated by sport expertise. This enables researchers to specify the time window(s) in which expertise effects are most prominent and to link these to the available visual information (Abernethy et al., 2008; Brault et al., 2012; Smeeton & Williams, 2012). In the case of deceptive actions, it has allowed us to identify the time windows in which observers first become deceived then the point at which they detect deception (Warren-West & Jackson, 2020; Warren-Westgate et al., 2021). However, there is a key limitation, and this is particularly important for studies of deception. In these studies, we usually set up video cameras to record footage of skilled players executing ‘genuine’ and ‘deceptive’ actions. For example, a soccer player might run with the ball towards the camera then take the ball to one side, or execute a step-over to fake taking the ball to one side before taking it to the other side. We edit this footage to create a test video of trials occluded at several time points relative to an appropriate reference point to find out how well players can judge an action outcome at different times of occlusion. The problem with using only response accuracy for deceptive trials to make inferences about susceptibility to, and detection of, deception is that players might have a bias in favour of judging actions to be deceptive or genuine (Cañal-Bruland & Schmidt, 2009). In the extreme case, a performer might achieve 100% accuracy on deceptive trials because they judge every trial to be deceptive. Of course, this means they will score 0% on the genuine trials so we clearly need a measure that accounts for response accuracy on both genuine and deceptive trials to capture task performance. Conceptually, this makes perfect sense. We want to know how well a player can discriminate between a genuine and a deceptive action, regardless of any inherent or transient bias. Early in the action sequence, the genuine action to take the football to the left will look very similar to the deceptive step-over action in which the player moves their foot in front of or over the ball before taking it in the opposite direction. The task for the defensive player is to discriminate between these two actions.
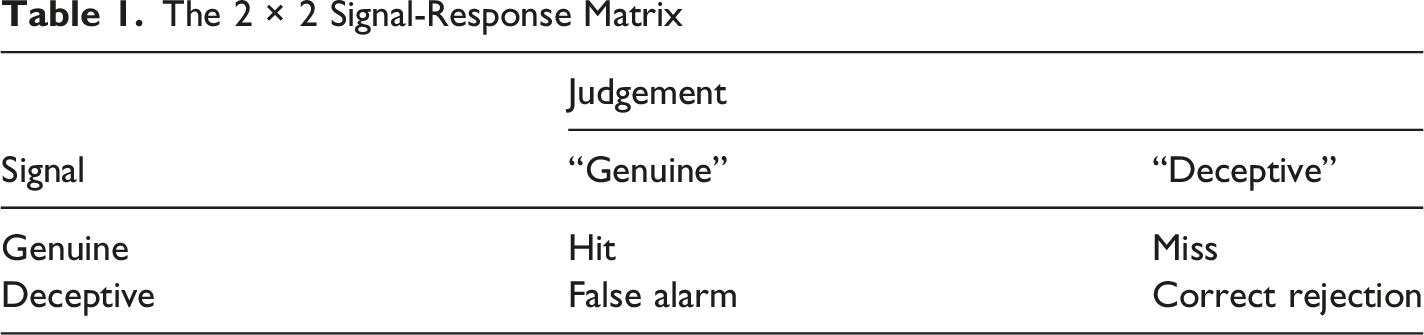
The 2 × 2 Signal-Response Matrix
Signal Response Matrix Examples
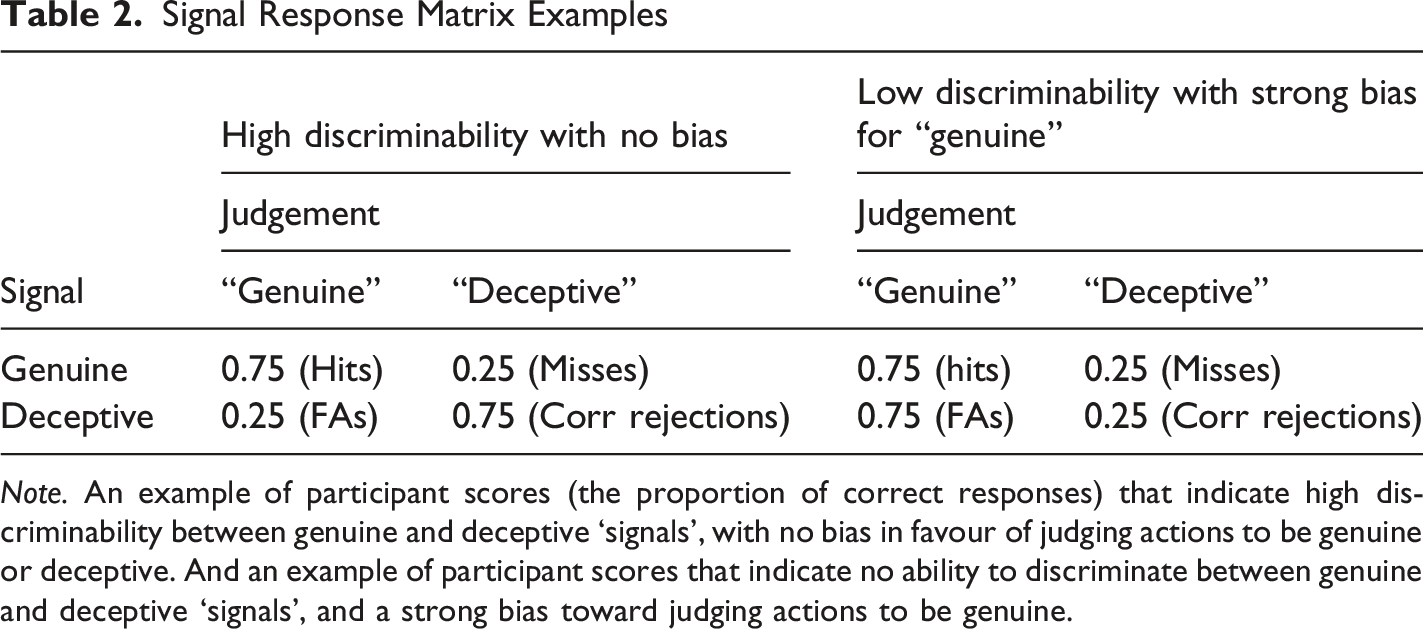
Note. An example of participant scores (the proportion of correct responses) that indicate high discriminability between genuine and deceptive ‘signals’, with no bias in favour of judging actions to be genuine or deceptive. And an example of participant scores that indicate no ability to discriminate between genuine and deceptive ‘signals’, and a strong bias toward judging actions to be genuine.
From Table 2 we can see that a bias in favour of judging trials to be genuine will result in a high proportion of ‘hits’ (and low proportion of ‘misses’) and a high proportion of ‘false alarms’ (and low proportion of ‘correct rejections’). Conversely, a bias in favour of judging actions to be deceptive will result in higher proportions of ‘correct rejections’ on deceptive trials but a high number of ‘misses’ on genuine trials.
Signal detection analysis has been used in studies of deception in several domains, such as deception training for real and fake personal injury narratives (Porter et al., 2010), evaluations of the veracity of suspect interviews (Meissner & Kassin, 2002), eye-witness identification (Wixted & Mickes, 2014), and in sporting duels and outcome judgements (Cañal-Bruland et al., 2015; Güldenpenning et al., 2015). The first use of signal detection analysis in sport research was a study of handball goalkeepers’ ability to discriminate between genuine and deceptive penalty throws (Cañal-Bruland & Schmidt, 2009). Interestingly, this study showed that skilled handball goalkeepers and outfield players were equally good at discriminating between real and fake throws; however, the goalkeepers saved more of the deceptive penalties and fewer of the genuine throws. In other words, the most notable difference was that experts had a stronger bias toward judging throws to be deceptive.
The source of response bias may be cognitive (e.g., through prior knowledge) or perceptual (e.g., the illusory nature of deceptive actions; Witt et al., 2015). One advantage of the temporal occlusion paradigm is that prior knowledge remains constant across times of occlusion so changes in bias are likely to be perceptual. Specifically, we would expect that the window in which a player becomes deceived to be characterized by strengthening of response bias caused by an increase in ‘genuine’ judgements to both genuine and deceptive actions. This is because the initial intent conveyed by a genuine action and its deceptive equivalent is the same. For example, if a rugby player initiates a genuine move to my left, I would increasingly respond “left” as the action unfolds. I would do the same as the player initiates a deceptive sidestep to the left up to the point at which I detect deception. Bias should then rapidly reduce toward zero (or baseline) as the true intent of both actions becomes clear. Evidence of an initial increase in bias toward judging actions to be genuine as the action unfolds has been shown in both high-skilled and low-skilled soccer and rugby players. In addition, these studies showed a clear expertise effect for differentiation of genuine and deceptive actions (Jackson et al., 2018; Warren-West & Jackson, 2020; Wright et al., 2013).
The output from signal detection analysis can also provide useful insights into expectation bias to address questions such as ‘How are defensive football player responses affected by their knowledge of the opponent’s action preferences?’, or in the case of deceptive actions, ‘Does prior knowledge make players more vulnerable or less vulnerable to ‘biting’ on the fake?’. To answer these questions, Jackson et al. (2020) presented football players with prior information about the likelihood of their opponent taking the ball to the left and right. Values were 50-50 (no preference), 67-33, and 83-17. On half of the trials, the player in the video ran towards the camera then changed direction to the left or right (genuine) as if attempting to evade the defender. On the deceptive trials, the player faked taking the ball to one side before taking it in the other direction by executing a stepover action. To compare how outcome expectations influenced high-skilled and low-skilled players, the analysis was set up to examine response bias for each of the five possible outcome probability values. The significant effect of expertise and its interaction with outcome probability revealed that expectations more strongly influenced the responses of low-skilled players than high-skilled players. Discriminability across the five probability values revealed that high-skilled players maintained a consistent advantage over low-skilled players across all outcome probability values. In a second set of analyses, the researchers compared response bias in each group when viewing genuine and deceptive actions across the three outcome probability conditions (50-50; 67-33; 83-17). In this analysis, ‘hits’ were defined as correct judgements when the player took the ball in the expected direction (higher probability side) and ‘false alarms’ were incorrect responses when the player took the ball in the unexpected direction (lower probability side). Relative to the 50-50 condition (in which there can be no probability bias by definition) the analysis showed that (a) bias was stronger in the low-skilled group than the high-skilled group, and (b) bias was stronger for deceptive actions than for genuine actions. This is a particularly important finding because it suggests that defenders may be particularly vulnerable to an opponent who fakes to do the expected but then does the unexpected. Indeed, the researchers found that, overall, the defending players performed better when there was no outcome expectation (the 50-50 condition) than when they knew the attacking player’s preference.
In this section we have outlined some of the benefits of using signal detection analysis in studies of anticipation and deception. First, the index of discriminability provides a single measure that is conceptually well-aligned with the central aim of deception tasks, which is to discriminate between genuine and deceptive actions. Second, the response criterion can be used to measure changes in perceptual bias over time as actions unfold, and to measure how outcome expectations influence player responses. The latter potentially provides a method for examining how an array of contextual factors influence decision making (Levi & Jackson, 2018). In the next section, we give a practical example of how SDT measures of discriminability (e.g., d’) and response bias or criterion for responding (e.g., c) are calculated and the information they yielded in our study to examine the ‘bigger picture’ of deception.
Although signal detection analysis provides a clear and interpretable framework for separating discriminability and response bias, it is not the only approach available for analysing responses in deception tasks. Alternative statistical approaches, such as logistic regression or mixed-effects modelling, can analyse responses jointly across trial types and may be particularly useful when modelling trial-level data or incorporating additional predictors. Other approaches extend classical SDT using hierarchical and Bayesian methods, which estimate sensitivity and bias parameters within a unified modelling framework and can better accommodate small sample sizes or extreme response rates (Paulewicz & Blaut, 2020; Rouder & Lu, 2005). In the present tutorial, we focus on classical SDT indices due to their conceptual interpretability, widespread use in perceptual research, and suitability for illustrating the core principles underlying the analysis of deception.
Research Example
Before demonstrating the calculation of these indices, it is important to note that the interpretation of signal detection theory measures is based on several assumptions. The calculation and interpretation of classical SDT indices (d’ and c) assume that the internal response distributions for signal and noise are approximately normally distributed and have equal variance. Furthermore, reliable estimates of hit and false alarm rates require a sufficient number of trials in each condition, with the assumption that observations are independent (Green & Swets, 1966; Hautus et al., 2021). When these assumptions are violated, estimates of discriminability and bias may be less accurate and better interpreted as an index of sensitivity rather than a precise measure of distributional separation. Nevertheless, this approach provides a useful and interpretable summary of performance for perceptual research.
In this research example, we use data from a study by Warren-West and Jackson (2020) which investigated high-skilled and low-skilled rugby players’ susceptibility to, and detection of, deception. To do so, the authors measured judgements of deceptive and genuine actions at eight times of occlusion (Figure 1). Experimental Times of Occlusions.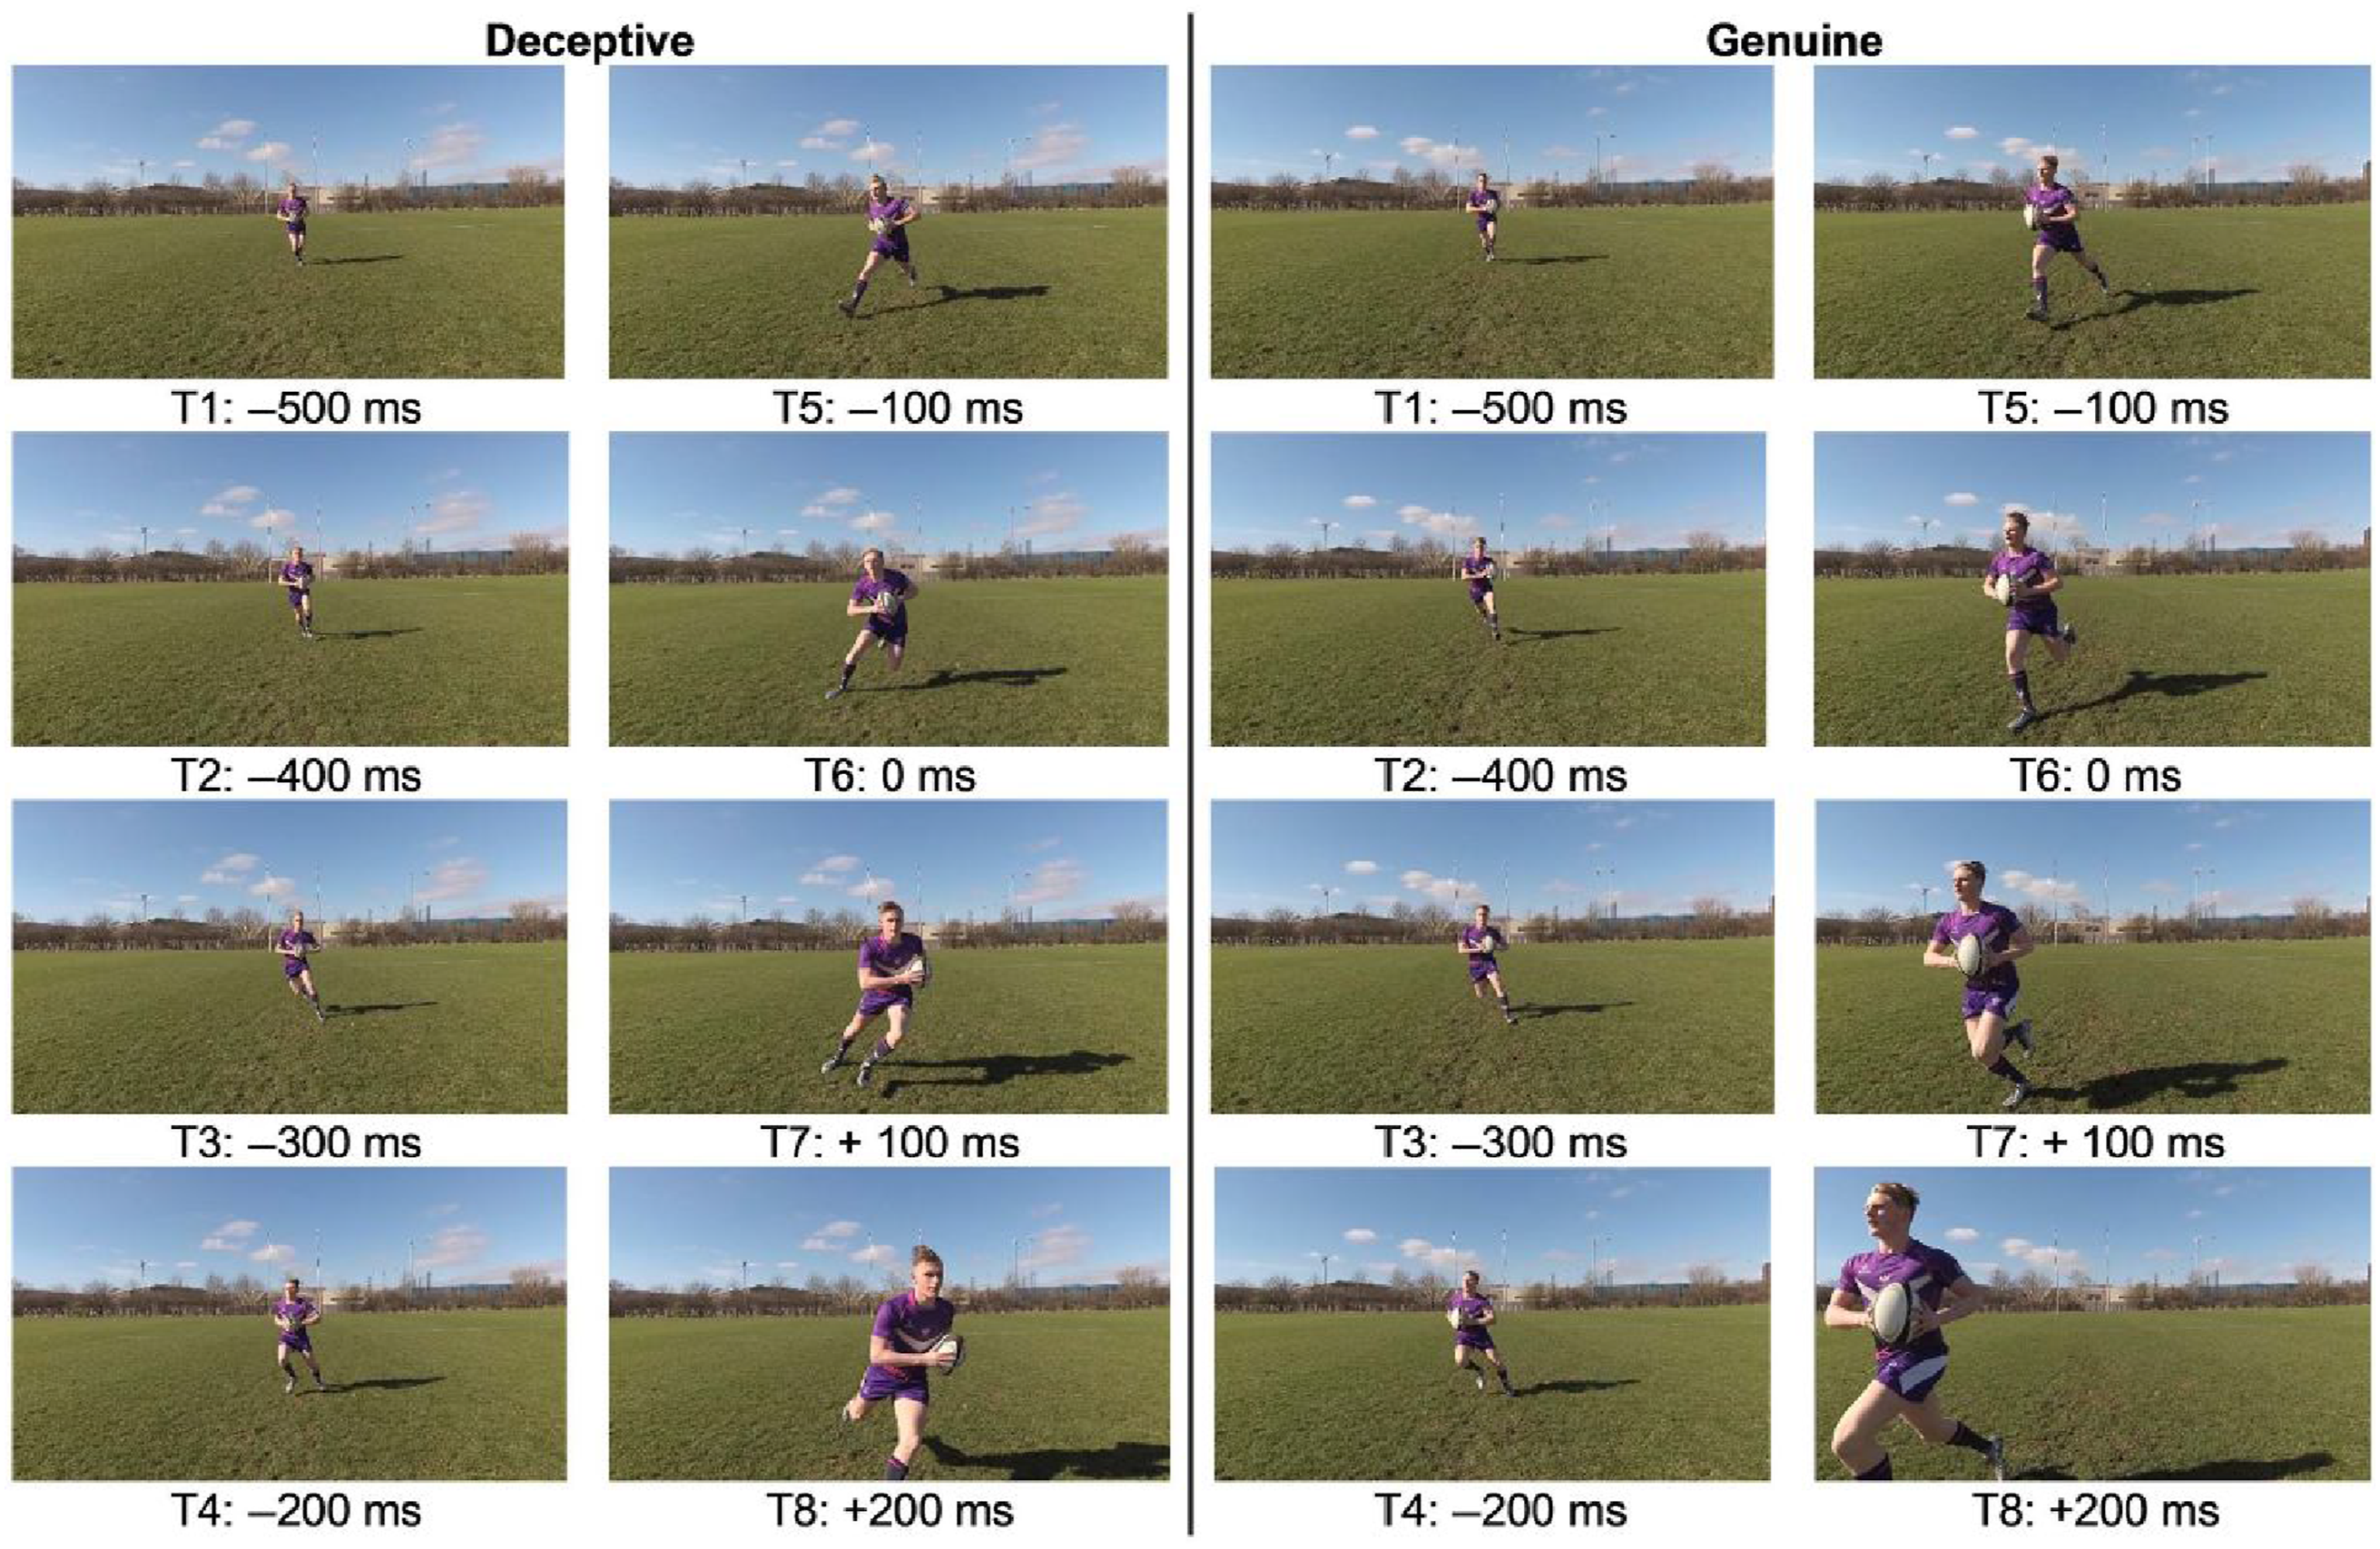
Response Accuracy, Hit and False Alarm Rate
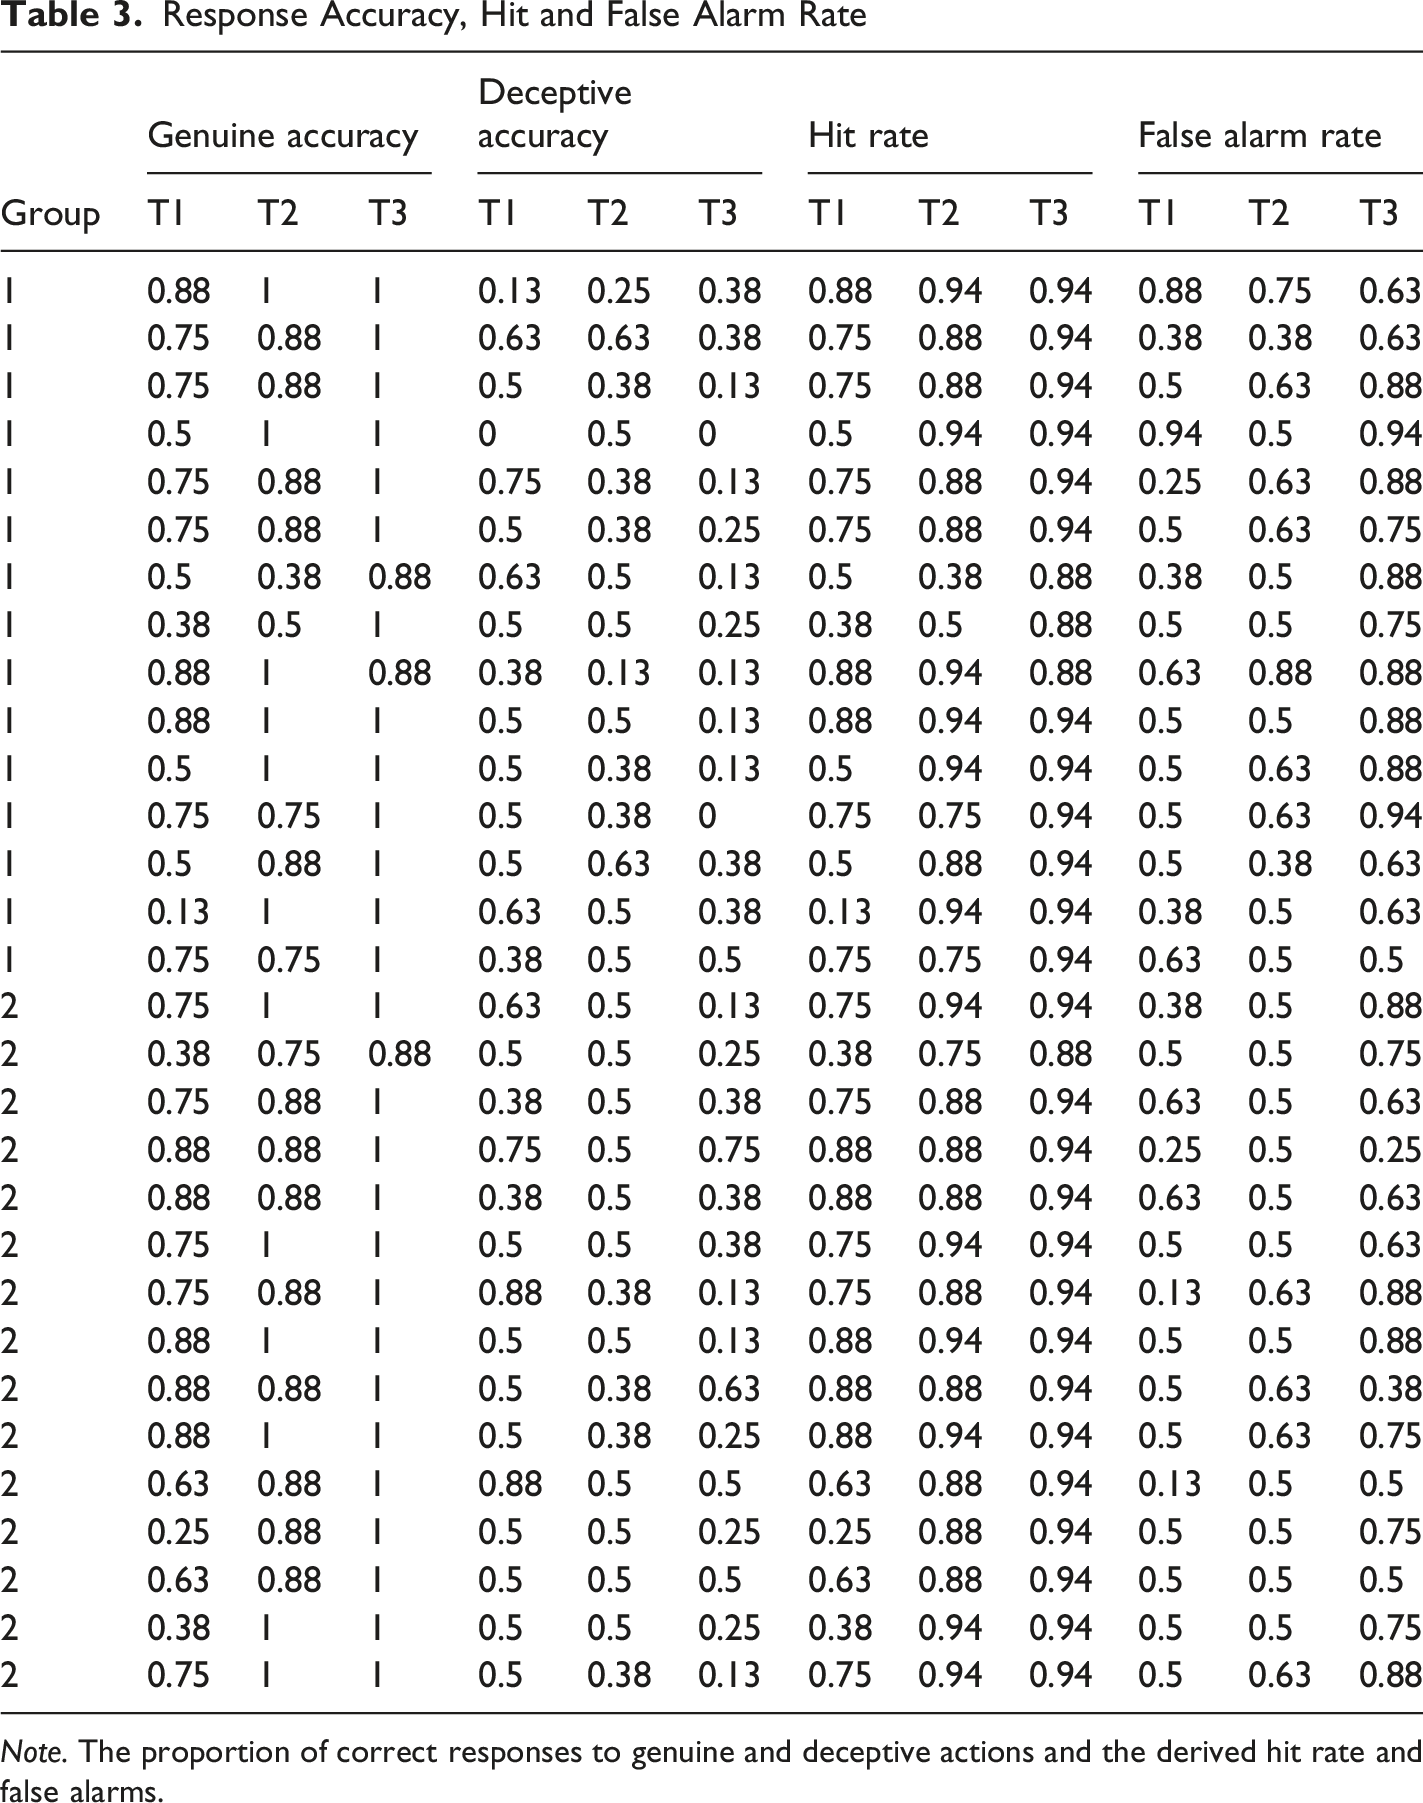
Note. The proportion of correct responses to genuine and deceptive actions and the derived hit rate and false alarms.
The first step is to convert the response data to hit rate (proportion of corrected response to genuine trials), and false alarms (proportion of incorrect responses to deceptive trials). For hit rate, this is simple as they remain unchanged. For false alarm rate, however, the proportion of correct response to deceptive trials needs to be inverted. So, as we are using proportions (/1), you subtract the deceptive response accuracy value from 1 to give you the false alarm rate (e.g., 0.75 becomes 0.25). The next step is to check for any hit or false alarm rates of 0 or 1, as you will need to do a standard correction on those. If no correction is applied, the z-values for 0 and 1 are infinite. Here is how you would do this. Let’s say that N is the maximum number of false alarms (i.e., the number of deceptive trials at each time of occlusion) – in the present example, N = 8. Not counting 0, the smallest false alarm rate you have is 1/N. If you have a false alarm rate of 0, you know that the true false alarm rate falls somewhere between 0 and 1/N. To correct this, one recommended approach (Stanislaw & Todorov, 1999) is to just use 1/(2N) instead of zero (which is the same as half a false alarm response). So, if you have a false alarm rate of 0, and N = 8, use 1/16 (0.063) instead. The same reasoning applies to a hit rate of 1.0. Instead of using 1.0, use 1−1/(2N), where N is now the number of targets (i.e., the number of genuine trials at each time of occlusion); which again, in the present example N = 8. In this instance, 1−1/(2N) gives you a value of 0.94 to use instead. Corrected hit rate and false alarm rates for the example data set can be seen in Table 3.
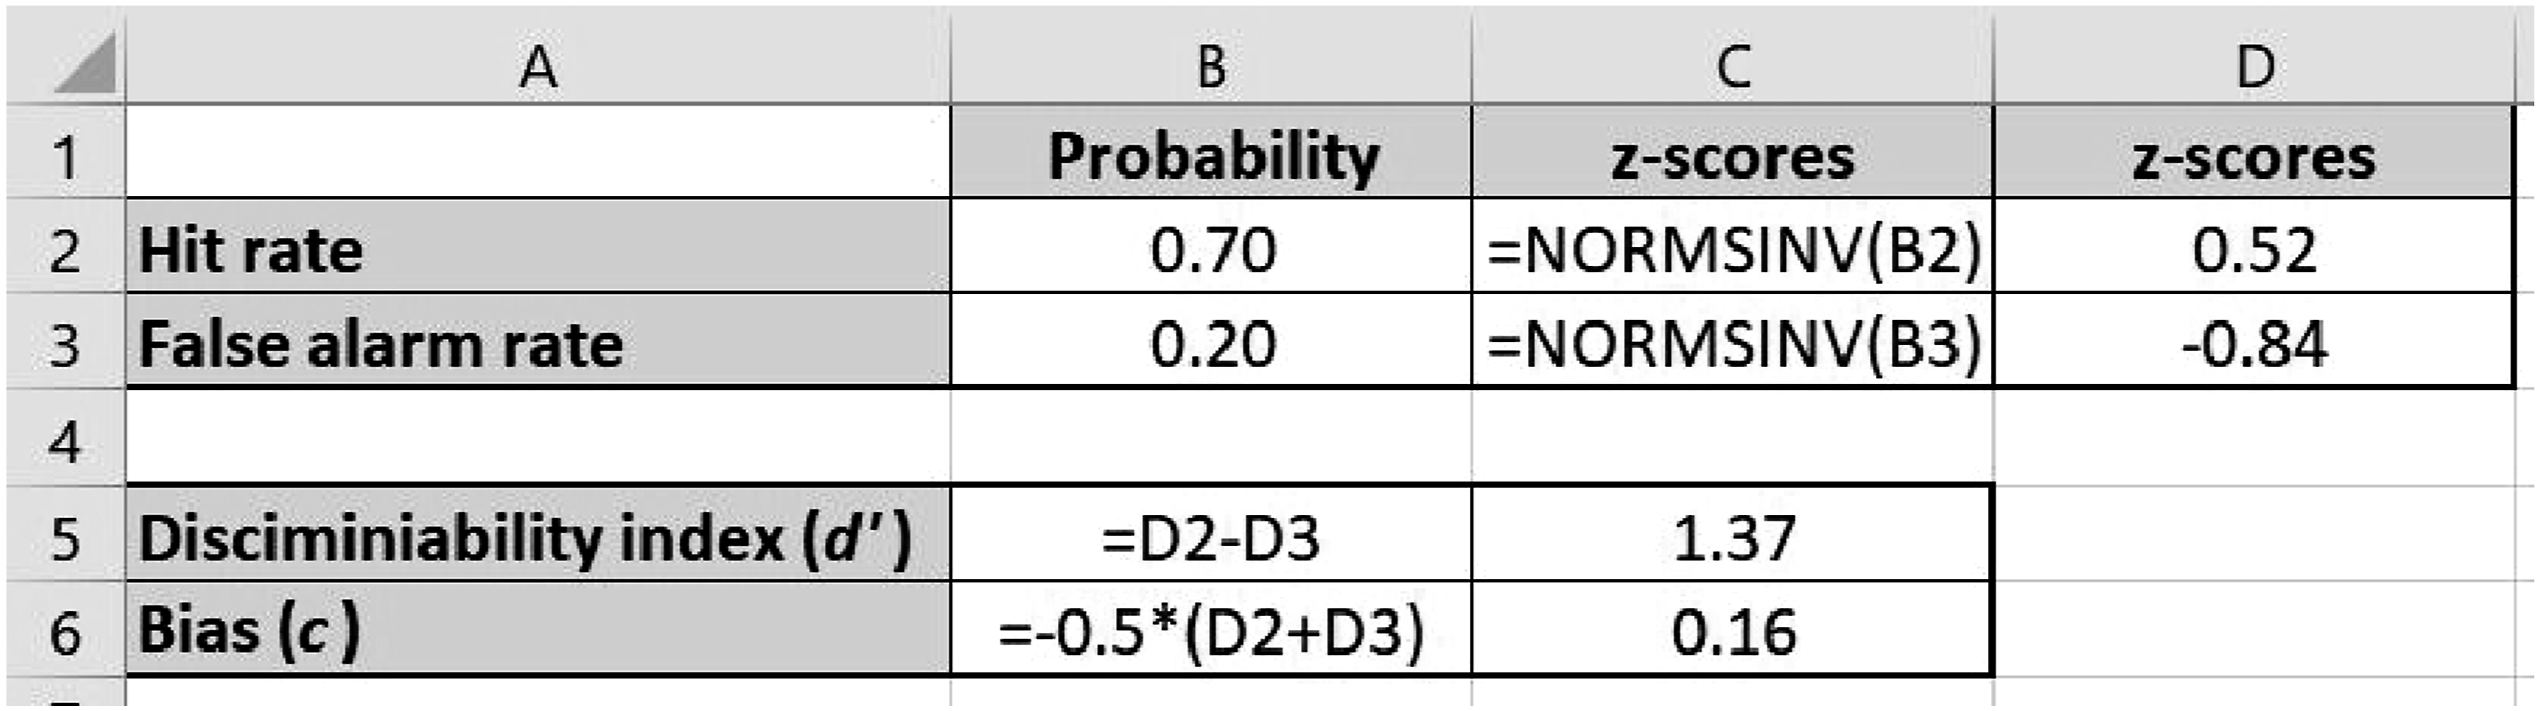
Once you have adjusted the scores of 1 and 0, you can then calculate discriminability and bias. A key conceptual step in signal detection analysis is the conversion of hit and false alarm rates to z-scores. This reflects the assumption that responses to “signal present” and “signal absent” trials are from overlapping internal response distributions. Converting these proportions to z-scores expresses these probabilities on a standard normal scale (Hautus et al., 2021). Discriminability is then calculated by as the difference between these z-scores (subtracting the z-score for the false alarm rate from the z-score for the hit rate), which represents the standardized distance between signal and noise distributions. Bias is calculated by multiplying the sum of the corresponding z-values for hit and false alarm rate by −0.5. This can be completed in Microsoft Excel (or other spreadsheet software) using the function NORMSINV. Alternatively, you can calculate these indices in single steps which can be applied to entire columns. For example, using the cell values in Figure 2: • Discriminability = NORMSINV(B2) − NORMSINV(B3) • Bias = −0.5 × (NORMSINV(B2) + NORMSINV(B3)). Example of How to Calculate z-scores, d’ and c in Microsoft Excel
Discriminability and Bias Scores
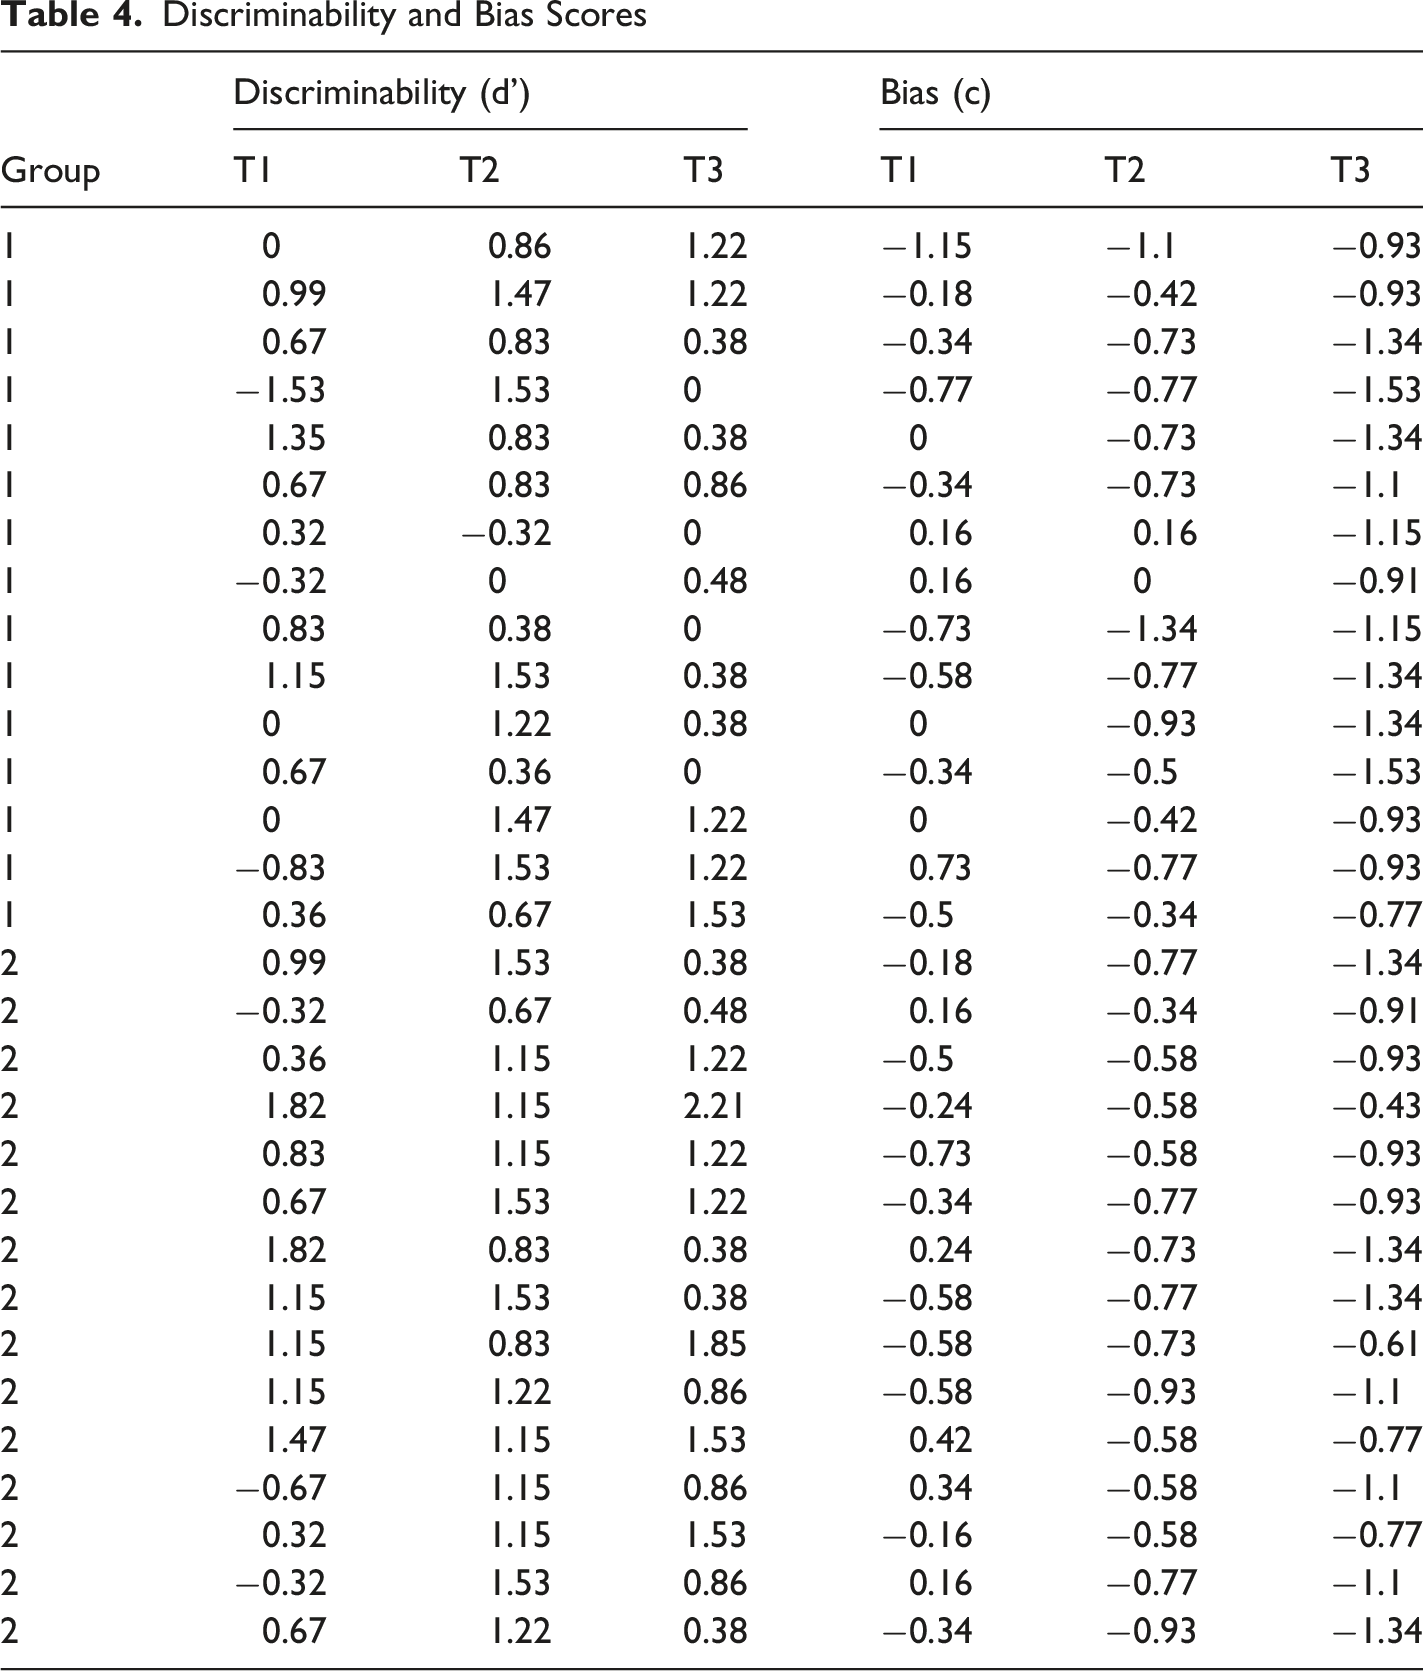
The data are now ready to import into a statistical analysis package (e.g., IBM SPSS Statistics). This will allow you to run separate 2 (group/expertise: Low-skill, High-skilled) × 3 (Time of occlusion; T1, T2, T3) analysis of variance (ANOVA) with repeated measure on time of occlusion, for discriminability and bias. In our worked example, available in the Supplemental Material, we use SPSS Statistics, but you can also do the same analysis using an alternative statistical analysis package.
The quotes below demonstrate how this data was reported in this research example (please note that the figure numbers have been altered to correspond with the present text).
“The HS players (d' = 0.98, SD = 0.59) were better than LS players (d' = 0.60, SD = 0.67) at discriminating between genuine and deceptive actions, F(1, 28) = 8.47, p = .01, Mean Discriminability and Bias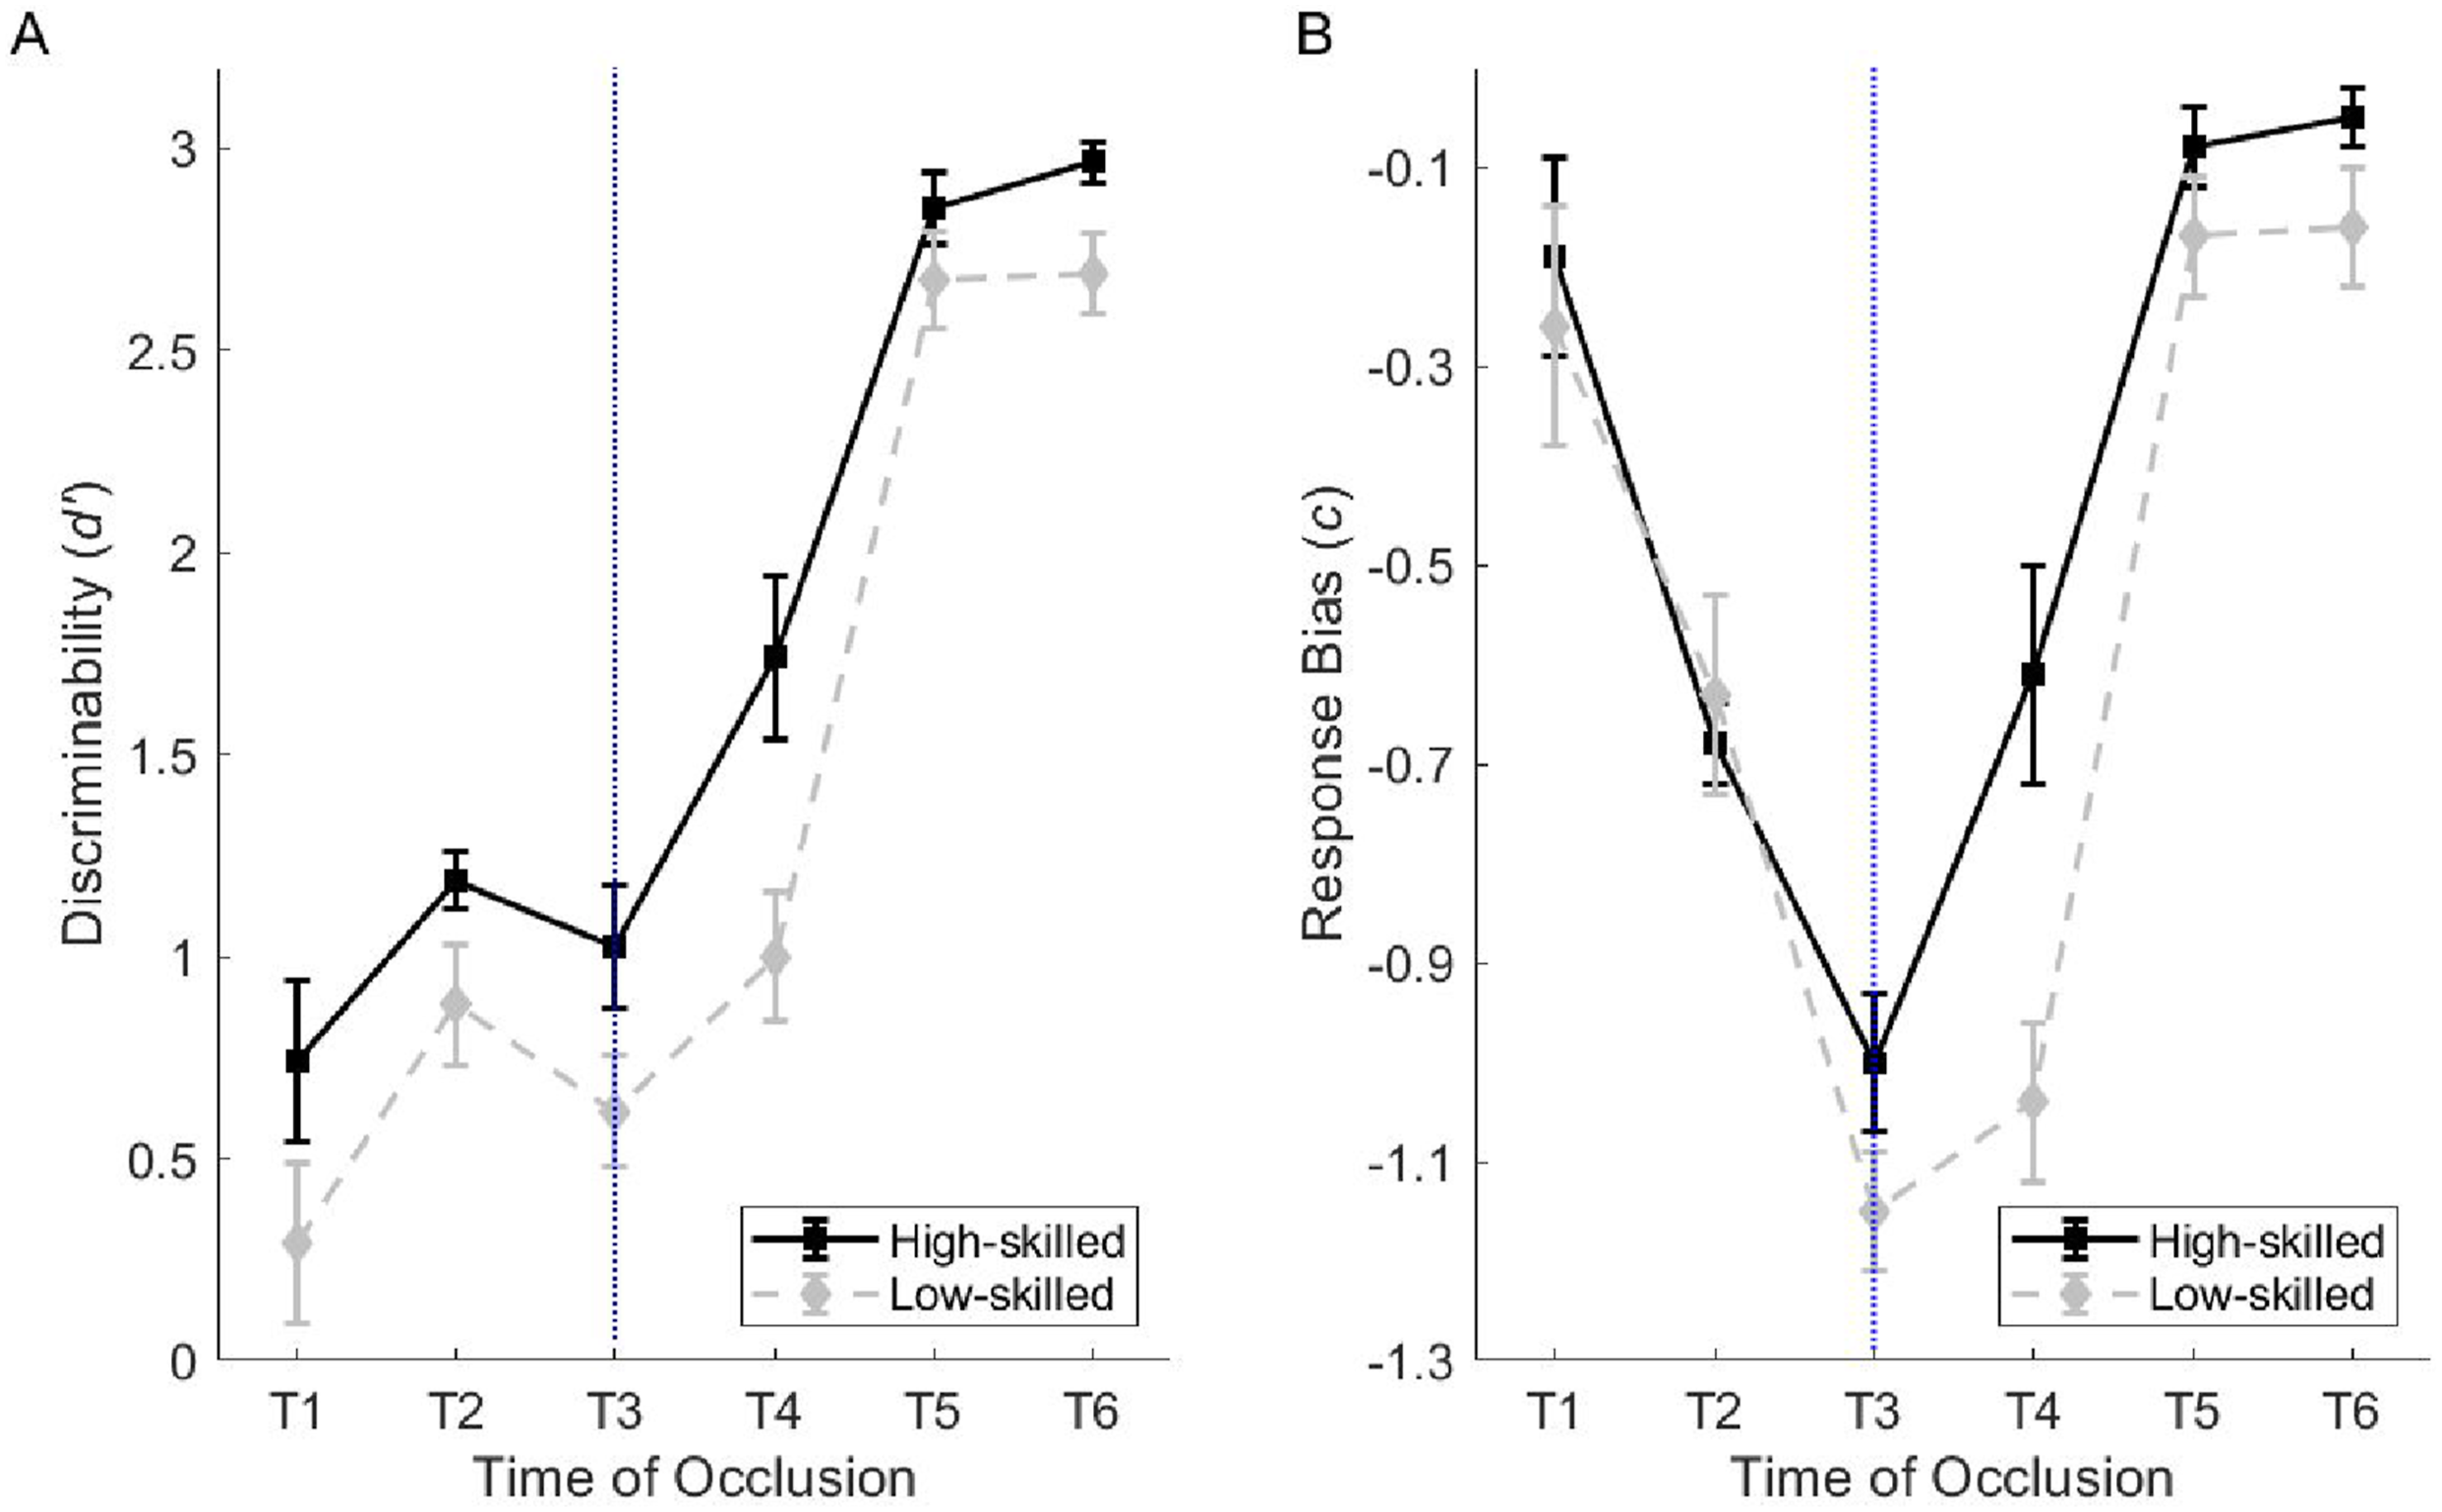
“As actions unfolded from T1 to T3, susceptibility to deception in both groups was characterized by an increased bias toward judging actions to be genuine, reflected in response bias values becoming significantly more negative, F(2, 56) = 64.75, p < .001,
In the present example we opted for a minimalist approach based on the descriptive data – shown in Figure 3 – when reporting the significant interactions for Expertise × Time of Occlusion. A significant interaction involves contributions from all the relevant data points, so it is not always necessary or helpful to conduct follow-up comparisons across data points. Another approach when dealing with significant interactions for a repeated measure is to tie down the effects more closely using follow-up tests, such as Bonferonni contrast tests and pairwise comparisons to identify where the individual significant differences were located. Because all data points contribute to a significant interaction, individual pairwise comparisons will have lower statistical power, so we tend to prefer descriptive interpretations of the interaction that highlight the main source(s) of the effect. Ultimately, this choice should be determined by the experimental design and research hypotheses.
Future Directions and Summary
In this growing area of research, there are many possible recommendations for future research. One recommendation is the use of realistic displays and responses, such as full body movements with measures of force and displacement, as these may provide more sensitive measures of expertise (Mann et al., 2010; Warren-West & Jackson, 2020). A second recommendation is to further examine how prior contextual information (performer expectations) and the observed kinematic information are processed to inform judgements as an action unfolds (Helm et al., 2020; Jackson et al., 2020) as well as how the manipulation of postural cues influences susceptibility to deception (Smeeton & Williams, 2012). Finally, based on the existing body of published research, there is significant scope for researchers to conduct training studies to determine whether susceptibility to deception, or detection of deception, can be improved in a way that creates a significant performance advantage (e.g., Alsharji & Wade, 2016; Ryu et al., 2018).
Until recently, the vast majority of deception researchers made conclusions around the relative effects of expertise based on separate analysis of genuine and deceptive trials. While this presented important information concerning responses to individual trial types, it was limited in the sense that it did not capture the key element of the task, which is to judge whether the intent conveyed by an opponent is genuine or fake. Indeed, skilled-based differences in response accuracy may be the result of differences in bias, meaning individuals may do well on one type of trial, and not very well on the other. The solution proposed in this article recommends the use of signal detection analysis, which combines responses to genuine and deceptive actions, to provide measures of discriminability and response bias. The literature discussed, along with the research example provided, offer useful insight on how readers should interpret indices of discriminability and bias in deception studies using signal detection analysis, as well as how they may conduct this style of analysis in their own research.
• Anticipation – The ability to use early or advance information to predict a task relevant action outcome. The nature of the information may be visual, auditory, or contextual and is often considered in relation to a key event such as when ball flight becomes available. • Bias – In signal detection analysis, a measure of the tendency to make more responses of one category than another when attempting to discriminate between the two, calculated by considering the responses to both types of stimuli. • Deception – The act of conveying a false intention to mislead the observer about one’s true intention. • Discriminability – A measure of the ability to differentiate or discriminate between types of related stimuli, such as a genuine and deceptive action, by considering the proportion of correct responses to both types of stimuli. • Expertise – Skill or knowledge in a particular field. • Field-based – Experiments that take place in the natural setting for the task in which researchers usually attempt to recreate as many aspects of the task as possible, such as the natural coupling between perception and action. • Lab-based – Experiments that take place away from the natural setting, usually involving representative tasks, and tight manipulation and control of experimental stimuli. • Spatial Occlusion – Selective masking or removal of visual sources from test stimuli, usually to establish the source(s) of information linked to anticipation, deception detection, and associated expertise effects. • Temporal Occlusion – Manipulation of the point at which visual information becomes occluded, usually to establish the time window in which performers can anticipate, are vulnerable to deception, or detect deception, and associated expertise.Key Terms
Supplemental Material
Supplemental Material - Methodological Guide: Signal Detection Analysis for Perceptual Judgements of Deceptive and Genuine Actions
Supplemental Material for Methodological Guide: Signal Detection Analysis for Perceptual Judgements of Deceptive and Genuine Actions by Laurence S. Warren-Westgate, Robin C. Jackson in Perceptual and Motor Skills
Footnotes

Ethical Considerations
Approval was obtained from the ethics committee of Loughborough University. The procedures used in this study adhere to the tenets of the Declaration of Helsinki.
Consent to Participate
Informed consent was obtained from all individual participants included in the study.
Consent for Publication
Participants signed informed consent regarding publishing their data and photographs.
Author Contributions
All authors contributed equally to this work.
Funding
The authors received no financial support for the research, authorship, and/or publication of this article.
Declaration of Conflicting Interests
The authors declared no potential conflicts of interest with respect to the research, authorship, and/or publication of this article.
Data Availability Statement
All data supporting the findings of this study are available within the paper and its Supplementary Information.
Declarations
The manuscript was not preregistered.
Supplemental Material
Supplemental material for this article is available online.
Author Biographies
References
Supplementary Material
Please find the following supplemental material available below.
For Open Access articles published under a Creative Commons License, all supplemental material carries the same license as the article it is associated with.
For non-Open Access articles published, all supplemental material carries a non-exclusive license, and permission requests for re-use of supplemental material or any part of supplemental material shall be sent directly to the copyright owner as specified in the copyright notice associated with the article.
