
Abstract
This study examines the spatiotemporal distribution of police use-of-force (UoF) incidents reported by the San Francisco Police Department. Drawing on geocoded incident data, we analyse the concentration of UoF across space, time, and officers, and assess whether UoF hotspots correspond to areas with higher proportions of racial and ethnic minority residents. Findings reveal marked concentration: UoF incidents cluster in specific locations and time periods, and a disproportionate share of incidents involve a subset of officers. Multi-officer encounters were associated with a significantly elevated probability of suspect and officer injury. Notably, spatial analysis revealed no over-representation of UoF hotspots in predominantly minority neighbourhoods, suggesting that the geographic distribution of force is not systematically tied to the racial composition of the areas in which it occurs.
Introduction
The use of force (UoF) is integral to police work, as apprehending suspects and disarming offenders may require physical coercion (Cowell et al., 2021; Longridge et al., 2023). However, when officers apply excessive or unwarranted force—particularly in incidents with racial dimensions—the consequences can include widespread public outcry and lasting damage to police legitimacy (Fryer, 2019; Ouellet et al., 2019; Smith et al., 2022). UoF encounters also carry risk of serious injury to both officers and suspects (Alpert and Dunham, 1998; Henriksen and Kruke, 2020). Understanding when, where, and under what circumstances force occurs is therefore essential—not only to reduce harm, but to preserve the institutional legitimacy upon which effective policing depends.
Research on police UoF has examined a range of explanatory factors, yet most yield inconsistent results in predicting the occurrence of force (Adams and Alpert, 2023; Bolger, 2015; Cojean et al., 2020; Cowell et al., 2021; Klahm and Tillyer, 2010). Some situational patterns are nonetheless evident. The likelihood of UoF is elevated during nighttime hours, particularly in late-night and early-morning periods (Henriksen and Kruke, 2020; Hickman et al., 2015; Piza et al., 2023). It also increases when additional officers are present at the scene (Bolger, 2015; Henriksen and Kruke, 2020) and when the encounter is officer-initiated (proactive policing) rather than dispatched in response to a call (Assaraf et al., 2024; Terrill et al., 2023). These findings, however, remain largely confined to the behavioural and situational context of individual encounters. What has received far less attention is the geographic setting in which force occurs—a limitation identified nearly 50 years ago that largely persists today (Sherman, 1980).
This gap is all the more striking given the parallel development of place-based approaches in policing. Hotspot policing, the most extensively developed ecological strategy, is premised on the well-established spatial concentration of crime (Weisburd, 2015), directing police resources toward the small number of places that account for a disproportionate share of offending (Braga et al., 2019a, 2019b; Weisburd et al., 2024). Beyond the spatial dimension, temporal analyses have further elucidated the geographic dynamics of crime activity (Ariel and Partridge, 2017; Piza and O’Hara, 2014; Santos and Santos, 2015). Aligning available police resources with the right places at the right times is what renders place-based strategies effective (Braga et al., 2014, 2019a, 2019b; Braga and Weisburd, 2022; Smith et al., 2024; Weisburd et al., 2024; Weisburd and Telep, 2014). Yet this body of research has concentrated almost exclusively on reported crime (Ariel et al., 2016b, 2024; Gill et al., 2017; Schnell and McManus, 2022), calls for service (Ariel et al., 2016b; Braga and Bond, 2008), index offences (Braga et al., 2011), and arrests (MacDonald et al., 2016; Santos and Santos, 2016). Police UoF—despite its operational and legitimacy implications—has remained at the margins of place-based inquiry.
The result is two largely disconnected literatures: one examining the correlates of UoF without attending to place, and another examining place-based crime dynamics without attending to force. Although research on the micro-geographic and temporal concentration of police UoF has expanded in recent decades, important gaps remain. This study responds to calls to examine force concentration independently of crime events (Sorg et al., 2021), providing both geographic and temporal analysis of police UoF at the micro-level (census block) as reported by the San Francisco Police Department (SFPD). It further investigates encounter characteristics associated with officer or suspect injury and hands-off force. By integrating spatiotemporal analysis with injury prediction, this study bridges these two bodies of scholarship and offers a more comprehensive account of UoF dynamics.
Identifying concentrations of police UoF can inform deployment strategies by highlighting areas with elevated incident frequencies. This knowledge can guide targeted intervention and resource allocation. Moreover, understanding how and where UoF incidents cluster provides a foundation for analysing injury predictors: locations and times with elevated UoF frequencies may pose greater risks of harm to both officers and suspects. By directing efforts toward places where UoF is most prevalent, agencies may reduce incident rates in these hotspots and, in turn, mitigate associated injury risks—potentially improving citywide UoF outcomes (Weisburd et al., 2017). Such reductions could enhance public trust and bolster perceptions of police legitimacy (Ouellet et al., 2019).
Literature review
Use of force
The use of force in police-public encounters has been a focal point of research in policing scholarship. This sustained interest reflects the commitment of practitioners and policymakers to understanding how law enforcement agencies exercise their authority and to identifying effective means of regulating this power (Ariel et al., 2015; Assaraf et al., 2024, 2026). Although definitional boundaries remain contested, UoF is generally understood as the direct or indirect application of physical coercion by a police officer toward a member of the public (Hine et al., 2018) or as “effort required by police to compel compliance by an unwilling subject” (International Association of the Chiefs of Police, 2001). Officers may resort to force when there is an immediate threat to public or officer safety, or when an encounter otherwise necessitates physical intervention (Longridge et al., 2023). The public broadly expects police to use force when necessary and proportionate to achieve legitimate objectives (Alpert and Smith, 1994). In practice, however, some officers apply excessive force that is unwarranted given the circumstances, or fail to respond proportionately to tense encounters. Conversely, some individuals act verbally or physically aggressively toward officers. These dynamics can escalate to forceful arrests and the deployment of police force in response to civilian behaviour (Ariel et al., 2016a).
Although UoF is an extraordinarily rare event, its consequences extend far beyond the individual encounter (Hickman et al., 2015). Force incidents can erode public trust in the police, undermine perceptions of legitimacy, reduce willingness to cooperate, and impair agencies’ capacity to perform their duties effectively (Adams and Alpert, 2023; Ouellet et al., 2019). Excessive force can also damage institutional reputation (Tuch and Weitzer, 1997) and, more immediately, result in injuries or fatalities involving officers or suspects (Alpert and Dunham, 1998; Henriksen and Kruke, 2020).
Research on police UoF has concentrated on officer characteristics (Brandl and Stroshine, 2013; Jain et al., 2022), suspect characteristics (Smith et al., 2022), and encounter-level factors (Bolger, 2015; Tillyer, 2022). Prior work demonstrates that situational and behavioural variables play a central role in shaping UoF outcomes. Specifically, encounters involving more serious offences are 1.46 times more likely to result in force; encounters with resistant suspects are 2.97 times more likely to involve force; and suspects who are arrested are 4.34 times more likely to experience force (see Bolger 2015 meta-analysis). A key variable in suspect-focused research is race—both the suspect’s race and the neighbourhood’s ethnic composition. Studies consistently show that minority groups, and communities with high concentrations of minority residents, face a significantly elevated risk of UoF, rather than being randomly distributed across the city (Lautenschlager and Omori, 2019; Lersch et al., 2008; Smith et al., 2022). Additionally, lethal UoF by police—incidents resulting in civilian fatalities—occurs more frequently in neighbourhoods with higher percentages of Hispanic and Black residents (Durán and Loza, 2017; Holmes et al., 2019).
Alongside suspect-related factors, encounter characteristics provide crucial context for understanding police UoF. These include day of the week, time of day, whether the encounter was officer-initiated or dispatched, whether an arrest was made, the presence of additional officers or civilians, and whether the encounter occurred in a public or private setting (Bolger, 2015; Cojean et al., 2020; Henriksen and Kruke, 2020; Klahm and Tillyer, 2010; Tillyer, 2022). Research indicates that the likelihood of UoF is elevated during dusk, late-night, and early-morning hours (Henriksen and Kruke, 2020; Hickman et al., 2015; Piza et al., 2023); when additional officers are present (Bolger, 2015; Henriksen and Kruke, 2020); and when the encounter is officer-initiated (proactive policing) rather than dispatched in response to an emergency call (reactive policing; Assaraf et al., 2024; Terrill et al., 2023). Recently, Sorg et al. (2021) demonstrated that police UoF incidents concentrate at a small percentage of subway stations in Philadelphia—a finding consistent with the “law of crime concentration,” which holds that crime and related incidents cluster in specific locations.
Law of crime concentration and hotspots
A growing body of literature has demonstrated that crime is not evenly distributed across urban landscapes but instead concentrates in a small number of geographic units that account for a disproportionate share of criminal incidents (Ariel and Partridge, 2017; Braga et al., 2019a, 2019b; Sherman et al., 1989; Sherman and Weisburd, 1995; Smith et al., 2024; Weisburd, 2015, 2018; Weisburd et al., 2009a, 2012, 2024). The consistency of these findings has led Weisburd and colleagues to characterise this pattern as the “law of concentration of crime in place” (Weisburd, 2015; Weisburd et al., 2012). Today, the focus on geography, terrain, and spatial mapping in the study of crime patterns is more firmly established than ever as a foundational component of criminological theory (Sampson, 2013; Short et al., 2010; Weisburd et al., 2012; Wortley and Mazerolle, 2008). Nearly all human activity is tied to place, and crime is no exception: offending must occur somewhere within the spatiotemporal spectrum. This “crime and place” perspective has signalled to criminologists that analysis should concentrate at the micro level—commonly operationalised as “hotspots of crime” (Sherman et al., 1989).
Beyond spatial concentration, research has revealed that crime hotspots also exhibit temporal variation, with elevated activity during particular hours, days, and months (Johnson et al., 2008; Ratcliffe, 2004; Townsley, 2008). Studies have further examined hotspot stability, finding that micro-geographic crime concentrations often display significant persistence over time (Braga et al., 2011; Groff et al., 2010; Schnell and McManus, 2022; Weisburd, 2015; Weisburd et al., 2009b, 2012). For example, Weisburd et al. (2004) demonstrated that crime-prone street segments in Seattle maintained their hotspot status for 14 years—a stability attributed to the continued availability of criminal opportunities at these locations (Kumar et al., 2024; Weinborn et al., 2017). However, other research indicates that some hotspots are “hot” only during specific periods (Lersch, 2022; Santos and Santos, 2015). A recent study found that hotspots exhibited temporal instability, with locations shifting in and out of hotspot classification over time (Lersch, 2022). These mixed findings suggest the presence of both “chronic” and “temporary” hotspots (Gorr and Lee, 2012). Understanding the temporal and spatial dynamics of hotspots is therefore crucial for developing effective crime prevention strategies.
The present study
Examinations of the geographic distribution of policing activity and its outcomes remain scarce. To our knowledge, aside from Sorg et al. (2021), no existing research has explicitly linked hotspot frameworks to police UoF. This study responds to calls for further investigation of UoF concentration, offering both geographic and temporal analysis of police UoF at the micro level (census block), alongside examination of encounter characteristics associated with officer or suspect injury and hands-off force. Our two central questions are: (1) How concentrated are UoF incidents across time, place, and officers? (2) What encounter characteristics elevate the risk of injury and hands-off UoF during police encounters? To address these questions, we analyse the geographic and temporal distribution of UoF incidents reported by the SFPD.
This study makes two key contributions. First, we provide a geographic exploration at the micro level (census blocks), including spatial concentration analysis and precise mapping of UoF clusters. We also examine the concentration of force among officers and suspects, distinguishing between spatial and agent-level concentration. Second, given inconsistent findings regarding whether hotspots are “hot” only during specific periods (Lersch, 2022; Santos and Santos, 2015) or remain stable over time (Weisburd et al., 2004, 2009b), we accord equal attention to the temporal dimension alongside the spatial.
Methods
Study area
San Francisco is located in Northern California and has a population of 808,988 (United States Census Bureau, 2023). The city consistently ranks among the highest in the nation for per capita income, with a reported per capita personal income of $155,819 (FRED, 2023). The most prevalent crime types are larceny-theft, burglary, and motor vehicle theft. The San Francisco Police Department (SFPD) operates 10 district police stations across the city (SFPD, 2024b) and employed 1203 patrol officers in 2021 (SFPD, 2022a).
The most appropriate unit of analysis for micro-geographic research in this context is the census block. 1 Census blocks differ slightly from street blocks: whereas a street block is typically defined as a single block face delimited by four intersections, census blocks can encompass larger areas. In San Francisco, most census blocks coincide with street blocks, except in coastal areas and less residentially developed zones. At this level of analysis, we investigate whether police UoF concentrations align with the law of crime concentration and the bandwidth established by Weisburd (2015). We further test the influence of officer proactivity and multi-officer incidents on the prevalence of police UoF. Specifically, we ask: where does UoF concentrate, and what factors are associated with a lower risk of police UoF?
Data
The police UoF data were retrieved digitally from the SFPD for the years 2017 and 2018, with each row in the raw dataset representing one officer involved in a reported incident. However, because multiple officers and force techniques may be recorded within a single encounter, several administrative UoF records may correspond to a single incident. To analyse UoF events effectively, the data were transformed to represent individual UoF incidents. Records referring to the same encounter were merged into a single incident record, while retaining a count of the number of officers involved. When multiple force techniques were reported within the same encounter, the highest recorded force severity was retained for classification according to the SFPD (2022b).
Type of use-of-force incidents reported by the SFPD.
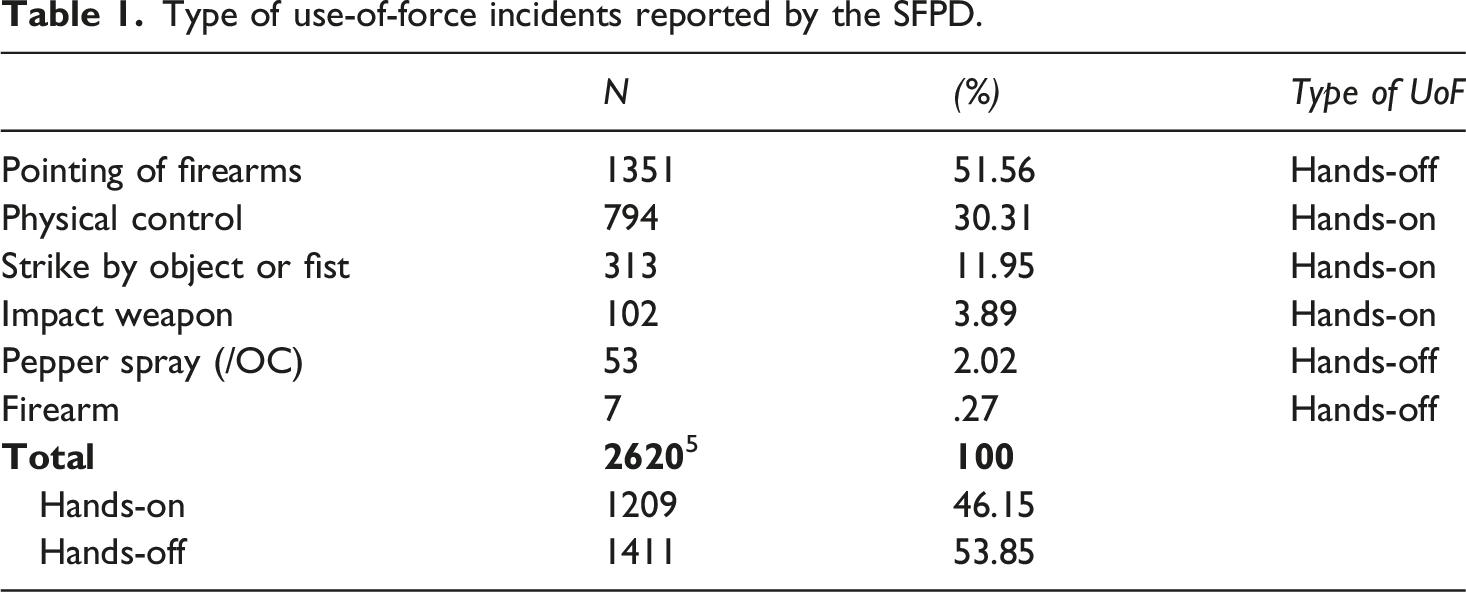
Geocoding of all UoF incident addresses was performed using the tidygeocoder package v. 1.0.5 in R and the ArcGIS geocoding API (Cambon et al., 2022). Five incidents with missing address information were excluded from the analysis. The minimum level of geoinformation precision was the intersection level (e.g. Lincoln Ave/9th Ave); therefore, entries with only district-level geolocation were also removed. The final dataset achieved a geocoding hit rate of 99.47%.
Geocoded incidents were matched to the census block level using publicly available block geodata from https://DataSF.org (United States Census Bureau, 2024). After manually tidying the geospatial data, the final dataset included 5966 census blocks. Additional demographics from the United States Census Bureau (2020) were merged with the UoF data for descriptive analysis.
Measures and analysis
Spatial concentration and agent concentration
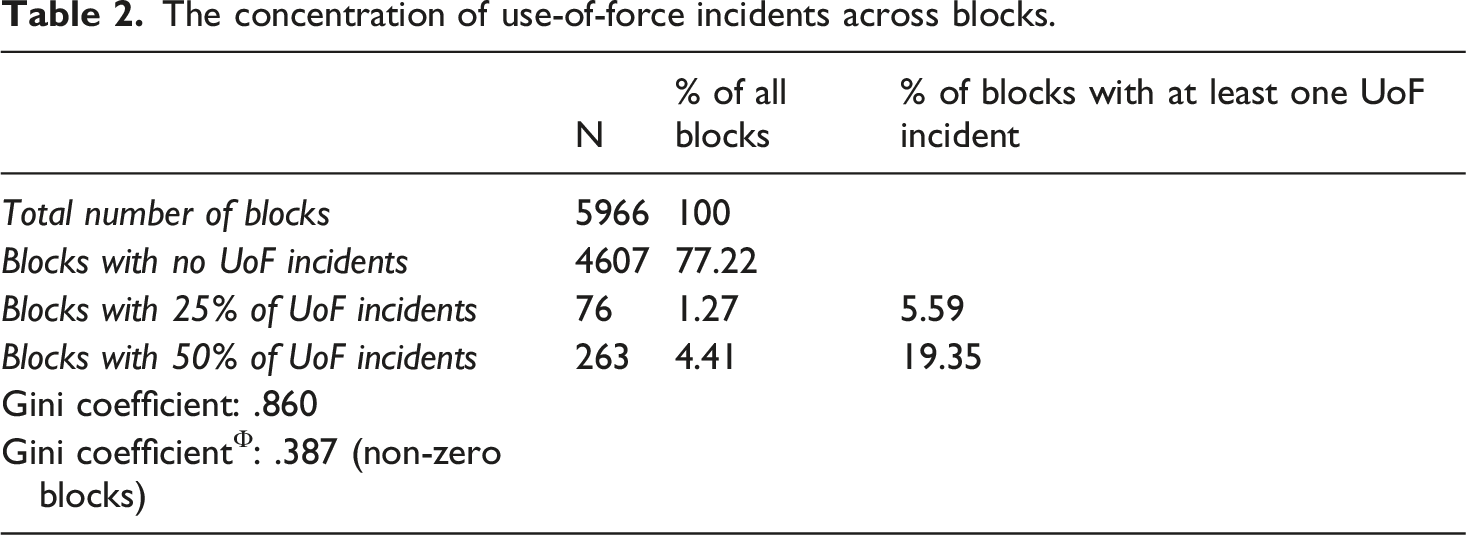
To evaluate the concentration of UoF on census blocks, police officers, and suspects, we calculated cumulative percentages and the Gini coefficient. As spatial research is often confronted with larger sample sizes of spatial units than event data, we calculated the Gini coefficient for all units and for all units with at least one reported incident. The Gini coefficient measures the distribution of variables across the population, with a coefficient of zero indicating a perfectly equal distribution while a value of 1 indicates complete concentration, where all the variables are concentrated in a single unit.
Temporal stability and concentration
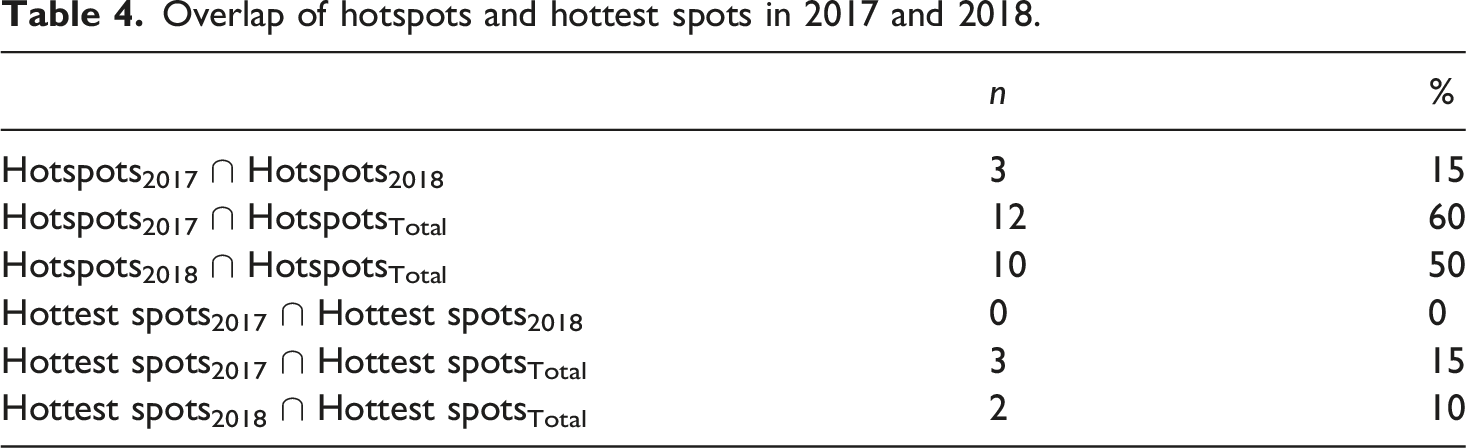
The temporal stability of the spatial concentration of police UoF was assessed by examining the overlap of hotspots (defined as 10 or more UoF incidents) and hottest spots (15 or more UoF incidents). 3 This analysis aimed to identify stable areas of high UoF concentration over time. Additionally, we analysed the temporal concentration of hotspots across different times of day.
Multi-officer and proactive vs reactive policing
To assess the outcomes of UoF incidents, we also examined the influence of multi-officer involvement – incidents involving more than one officer (Henriksen and Kruke, 2020) and proactive policing, where the officer initiated the encounter without a dispatch order versus reactive policing (for a review of proactive versus reactive policing, see Weisburd and Majimundar, 2018). Chi-square tests and odds ratios were calculated to assess the following outcomes: (1) the occurrence of officer injury, (2) the occurrence of suspect injury, and, (3) hands-off force by police officers. Notably, injuries were obtained directly from the SFPD UoF reporting system and recorded as binary indicators (injury vs no injury), regardless of injury type or severity 4 , as coded in the original dataset.
Minority concentration vs UoF concentration
Given the frequent examination of racial factors and potential biases concerning the prevalence of police stops and UoF incidents (Smith et al., 2022), we mapped population data to census blocks in San Francisco. This mapping aimed to visually explore the geographic concentration of minority groups compared to the concentration of UoF, focusing on Black and Asian residents. To identify minority neighbourhoods or census blocks, they were classified into four different categories, emphasising blocks and clusters where the majority of the population is either Black or Asian, with proportions ranging from 50% to over 75%.
Results
Spatial, agent, and temporal concentrations
The concentration of use-of-force incidents across blocks.
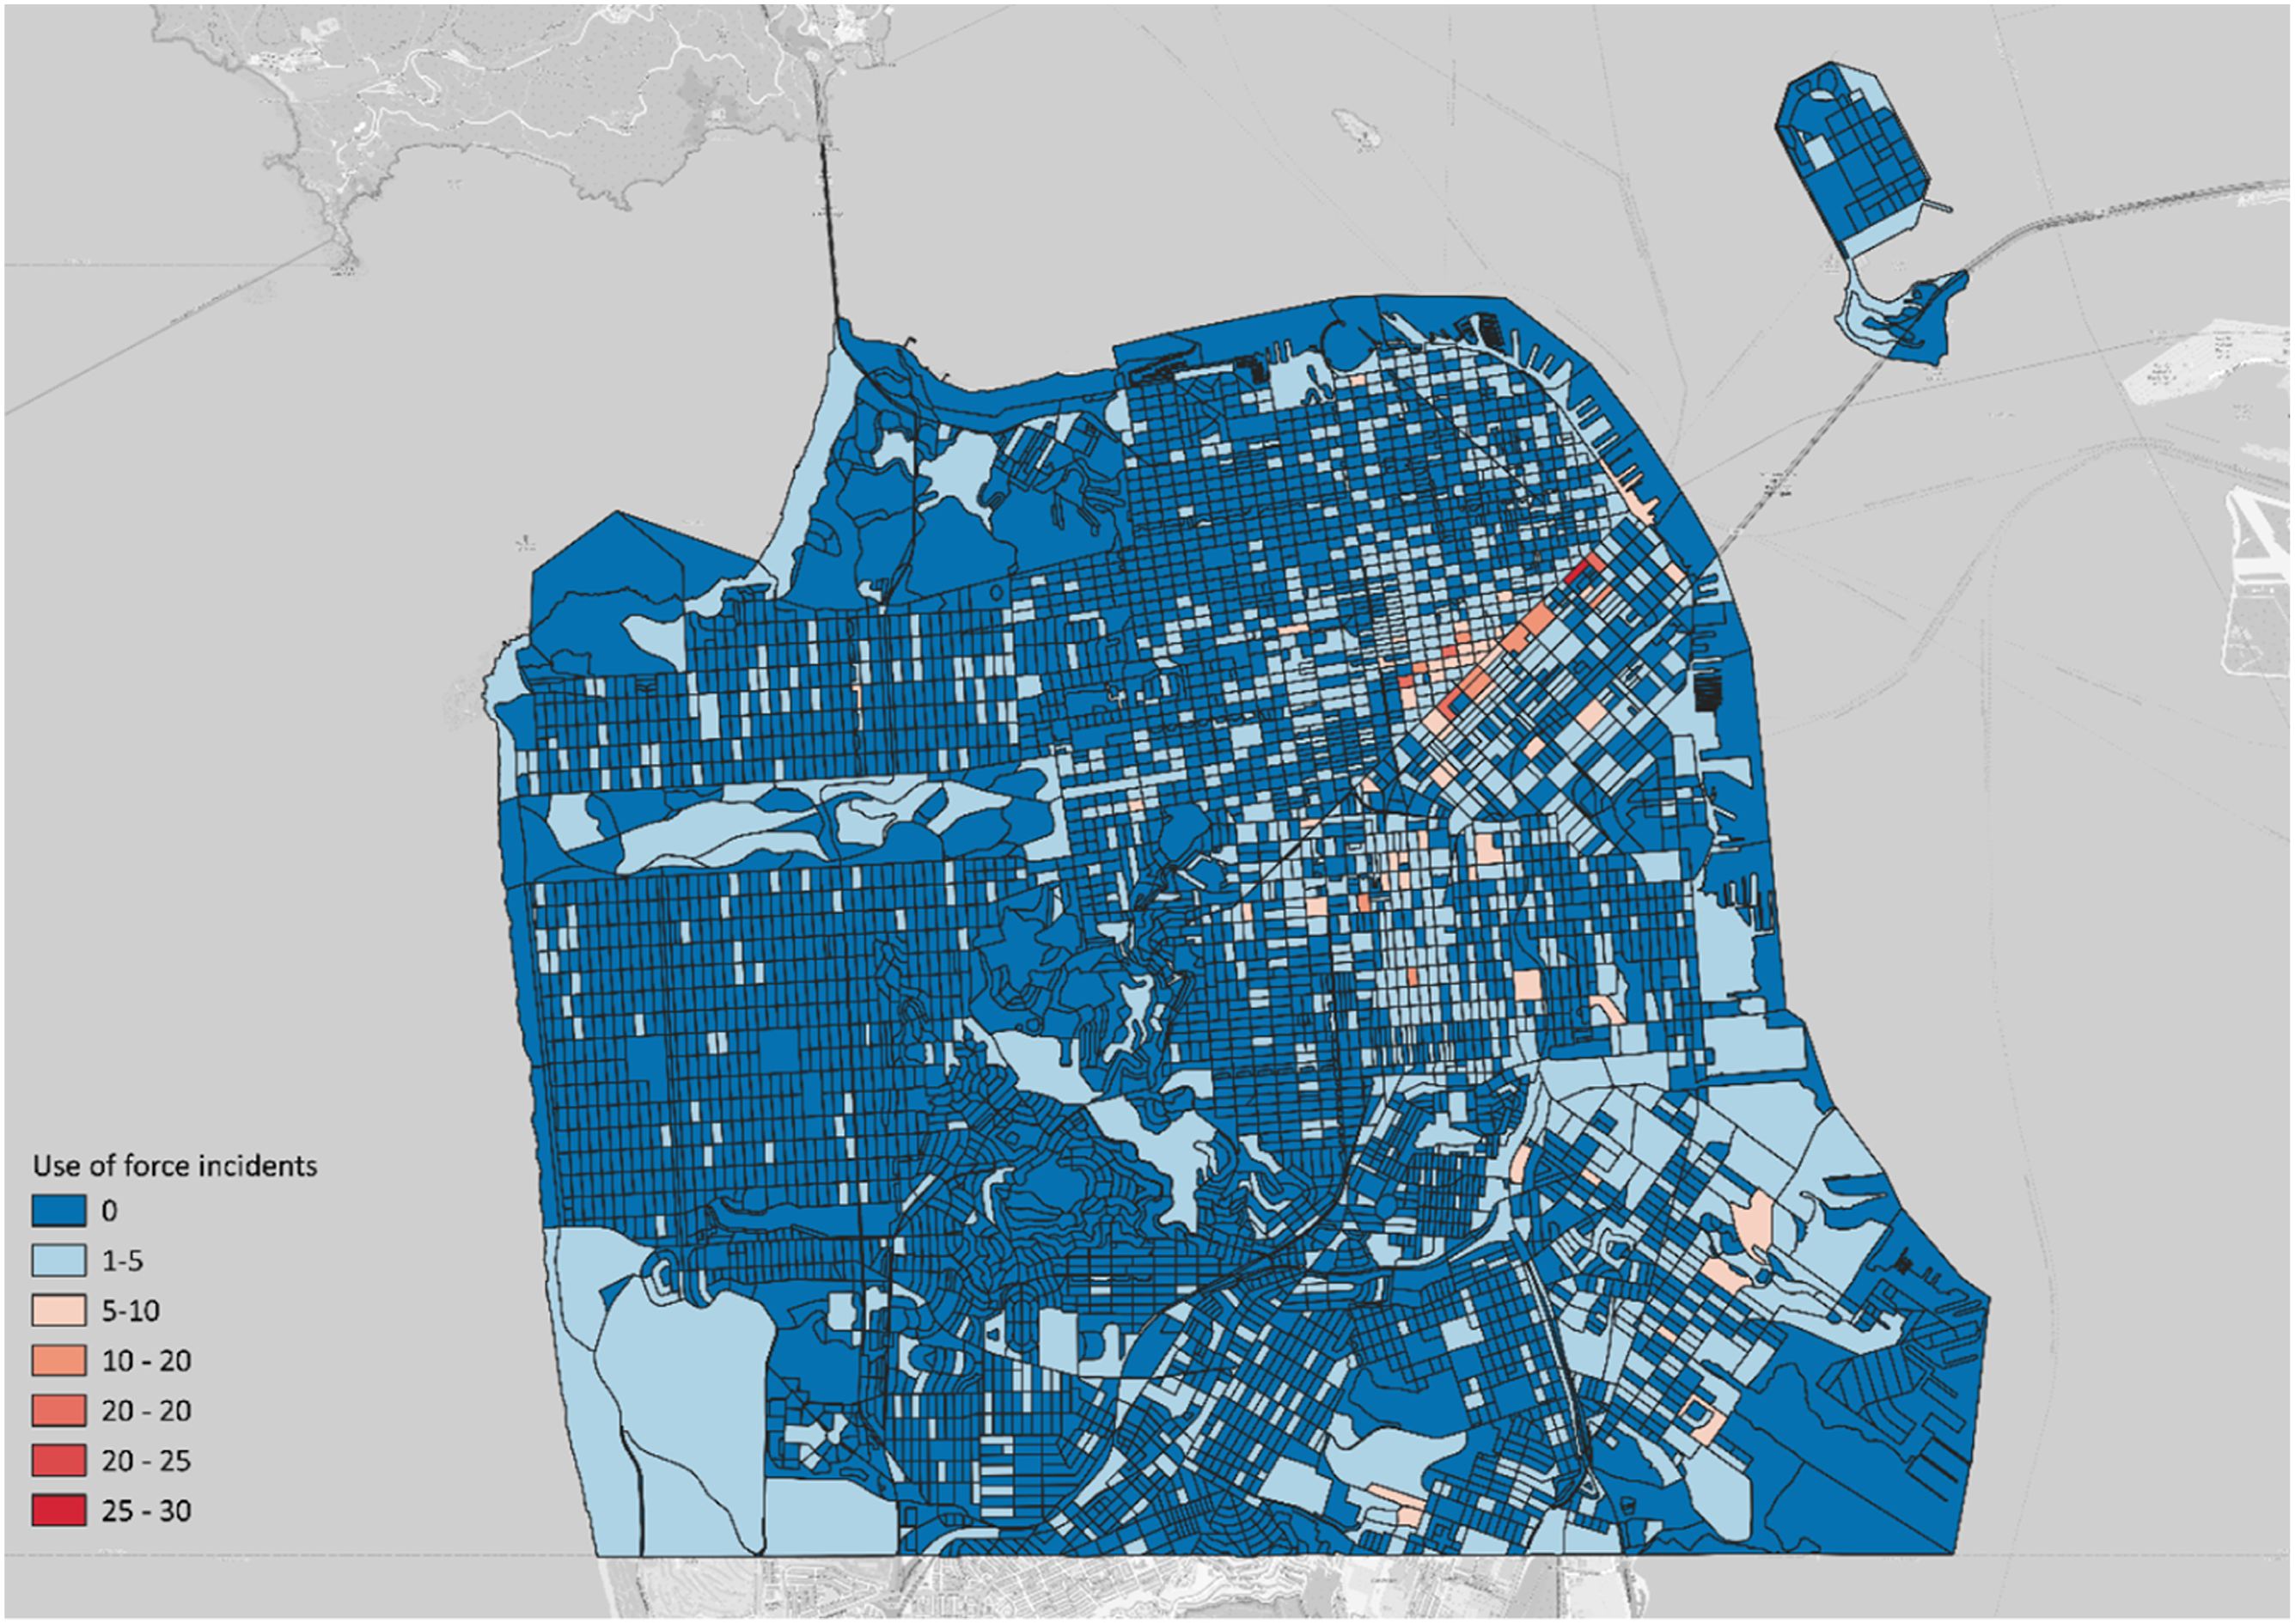
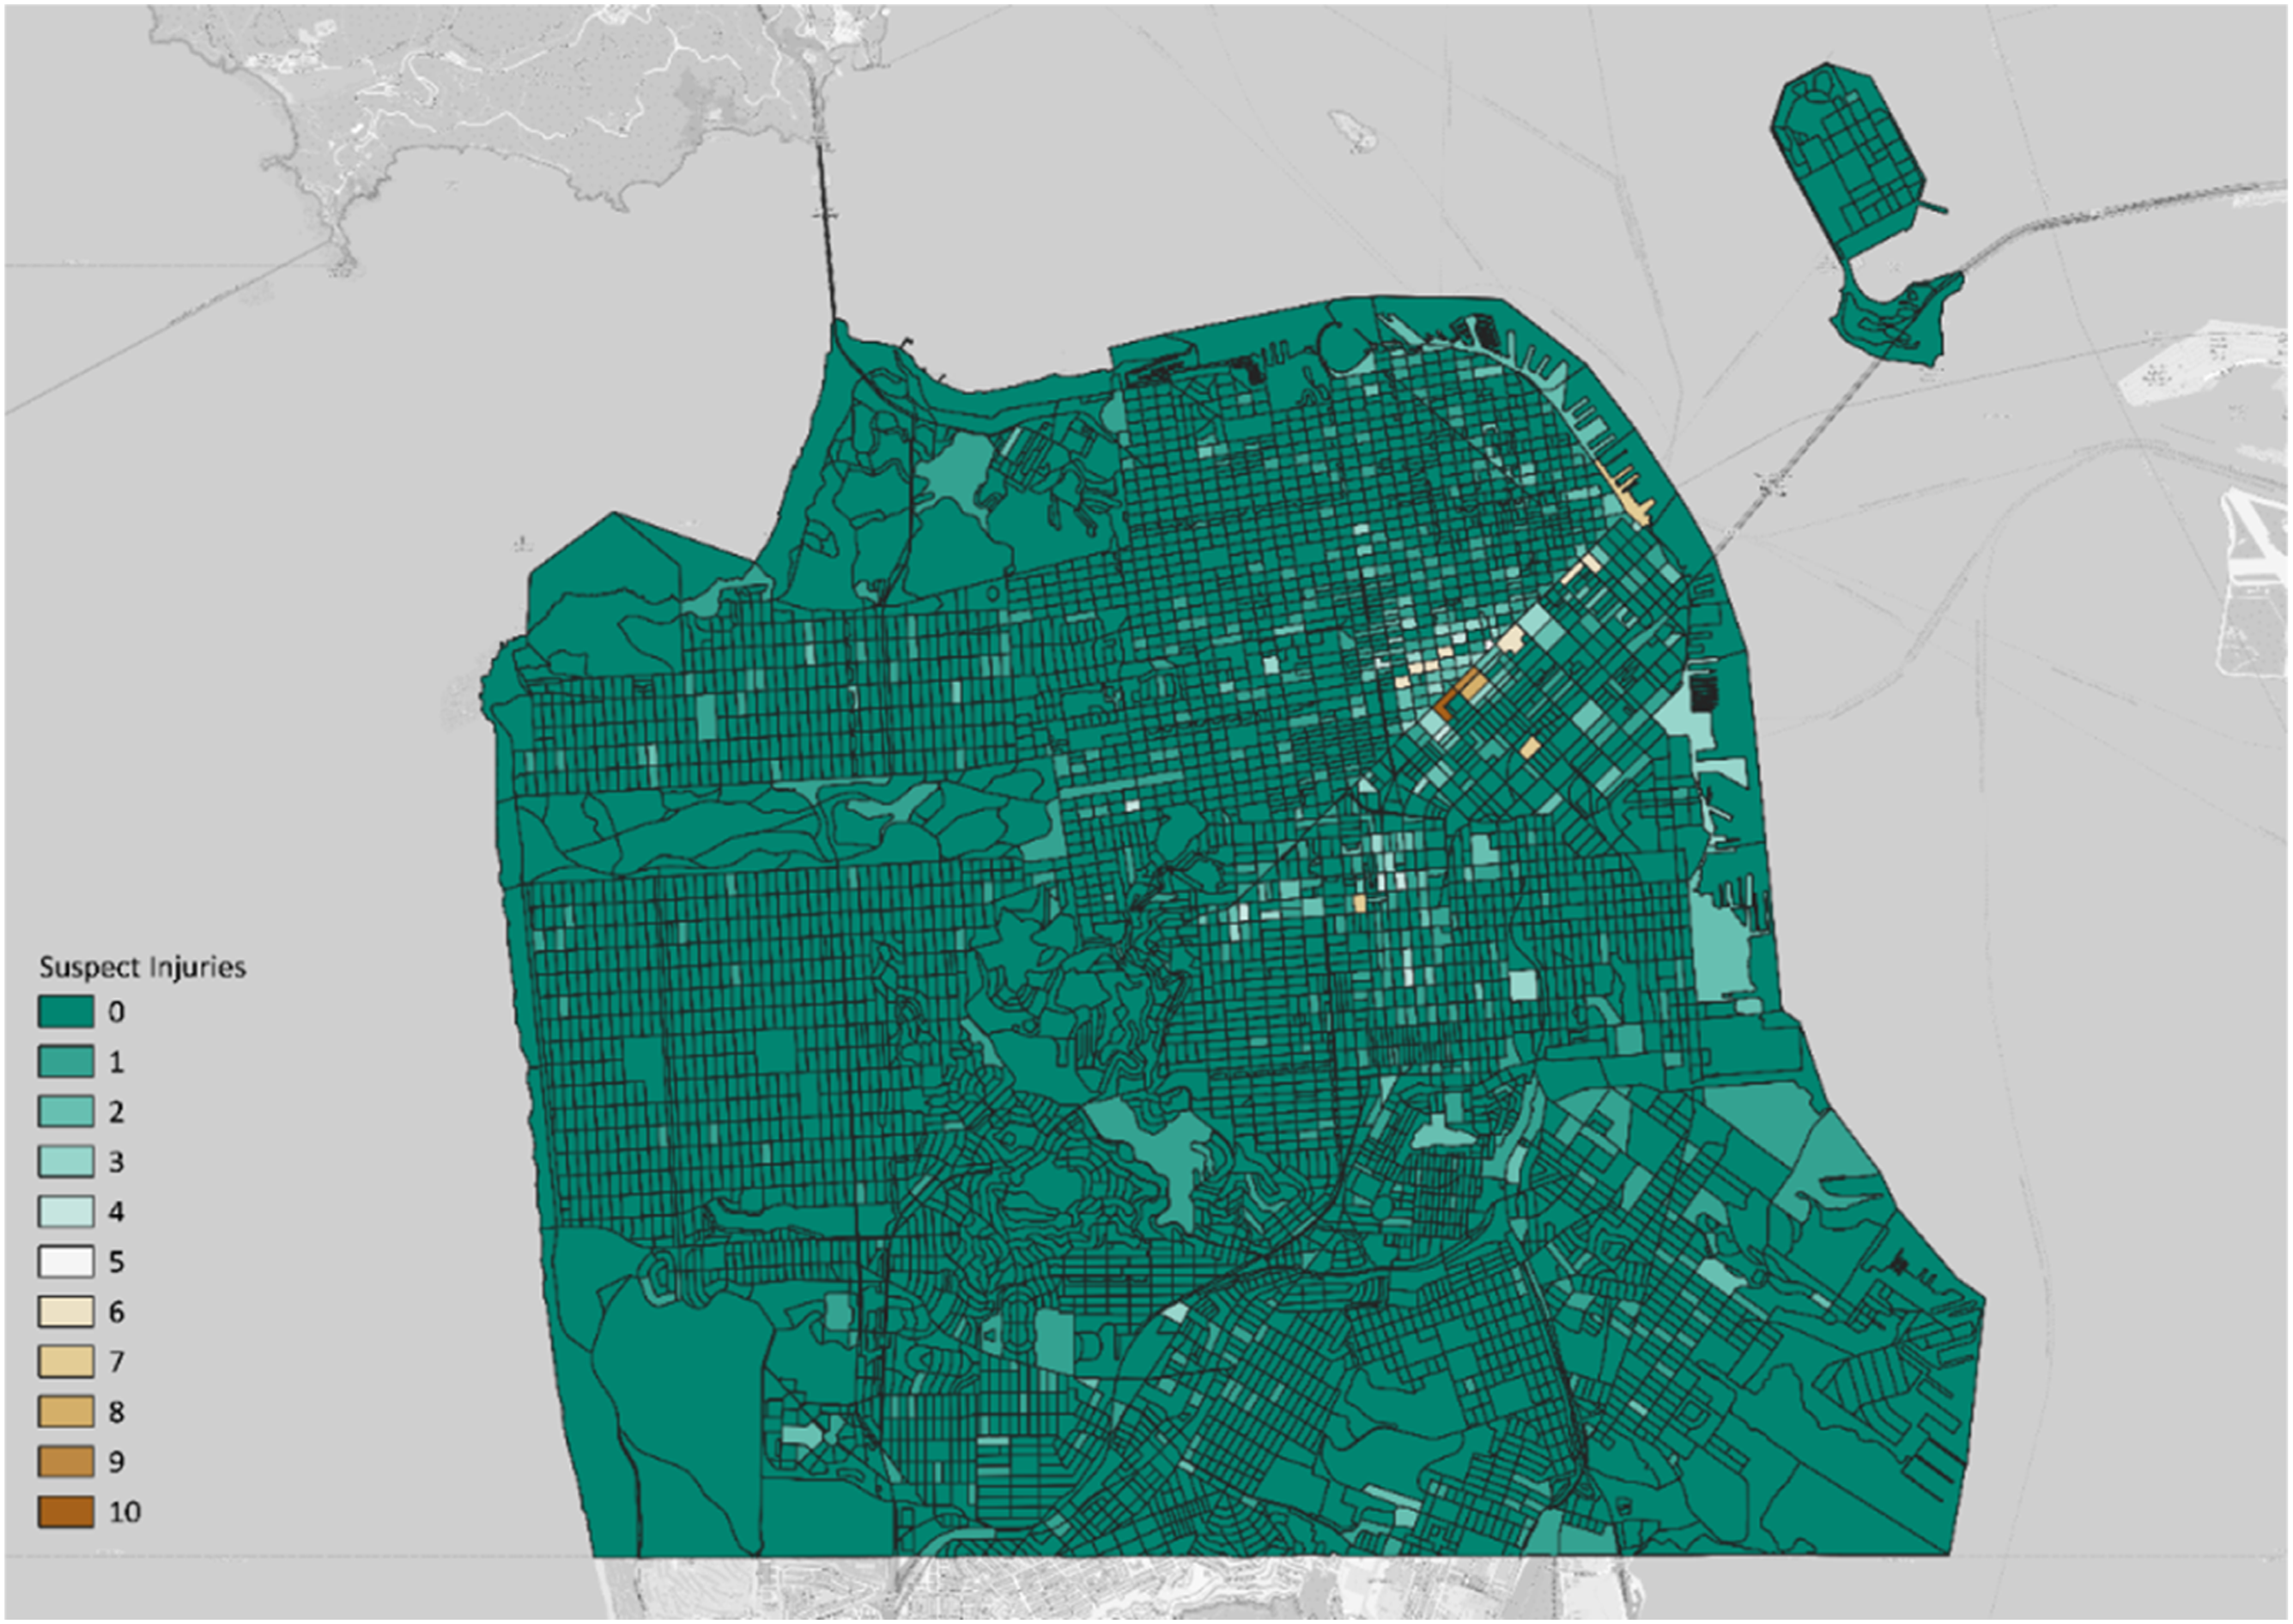
Use-of-force incidents per census block in San Francisco for the years 2017 and 2018.
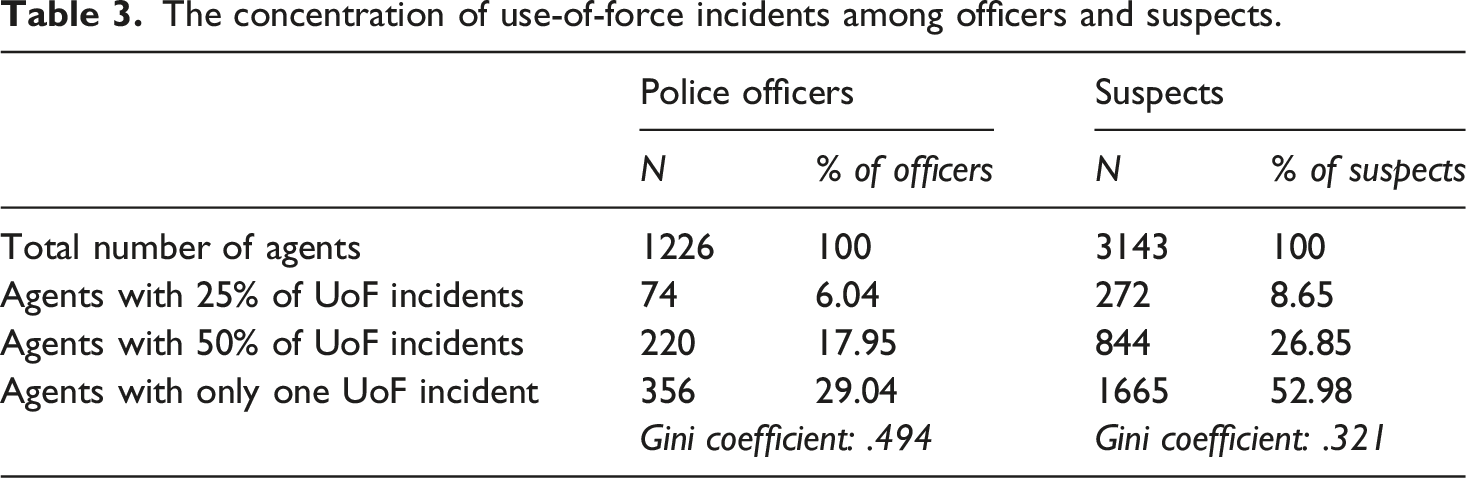
The concentration of use-of-force incidents among officers and suspects.
Temporally, the probability of UoF occurrence follows a bimodal distribution, peaking at 4 pm and 11 pm. However, these peaks vary by spatial concentration level (see Figure 2). In hotspots (10 UoF incidents), the highest probabilities occur at 1 pm and 3 pm; in the hottest spots (15 or more incidents), they shift to 4 pm and 8 pm. Across all categories, UoF probability is lowest between 5 am and 9 am. Probability of use-of-force occurrence by hour across all places, hotspots, and hottest spots.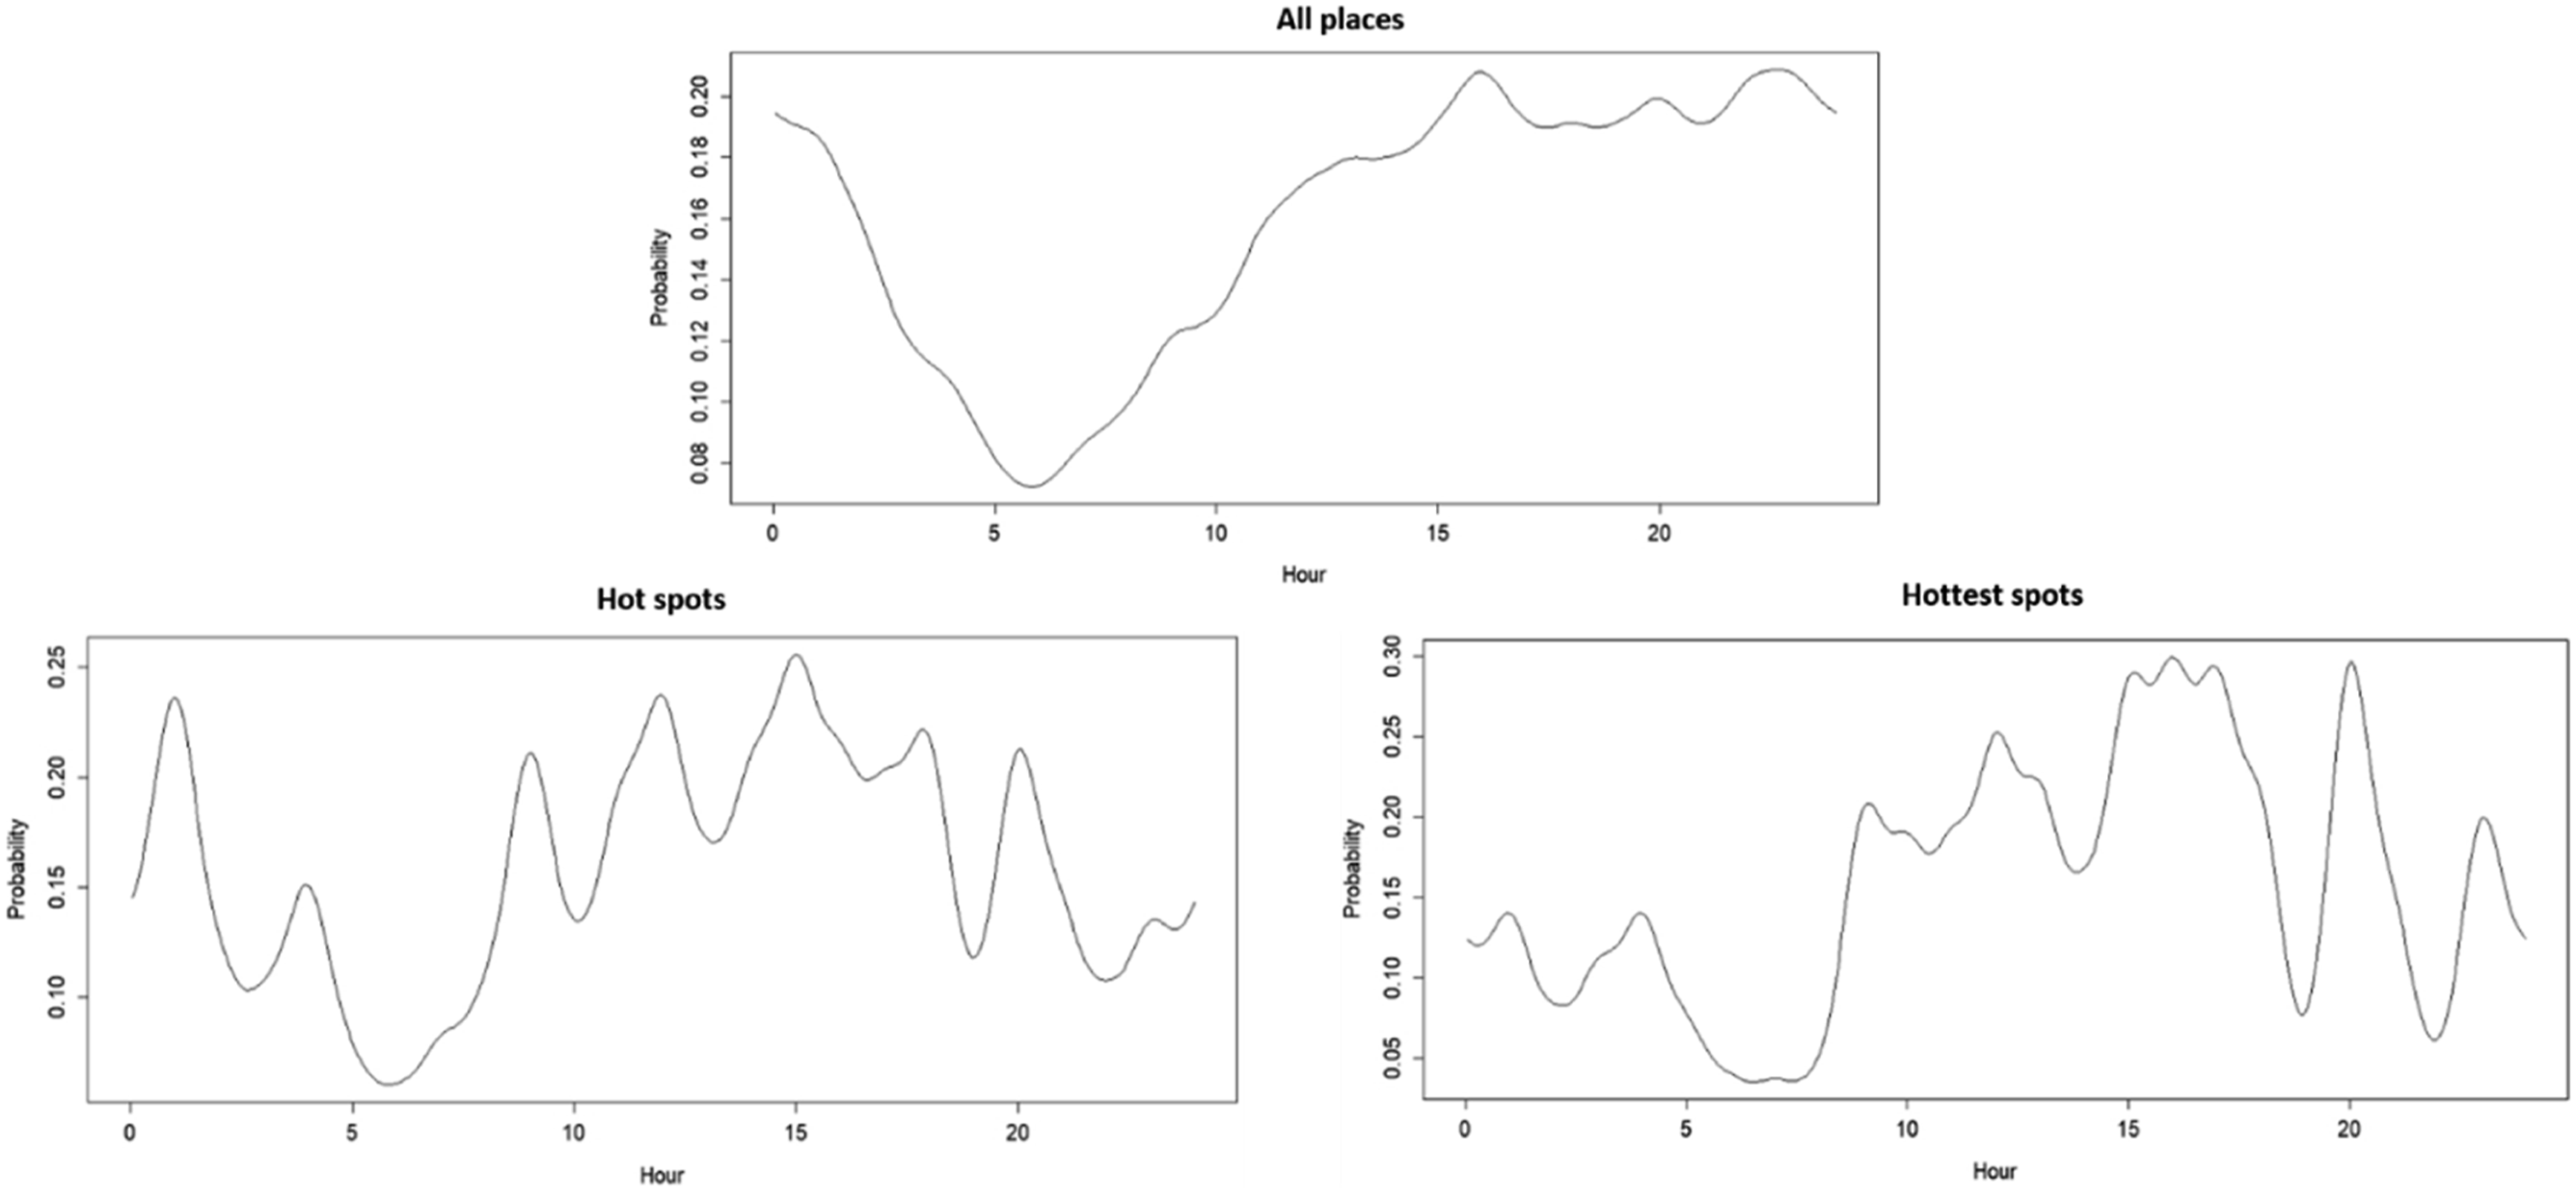
Overlap of hotspots and hottest spots in 2017 and 2018.
The geography of UoF
We mapped the census block, which was identified as the UoF hotspots and hottest spots for 2017 and 2018 in San Francisco. All spots were clustered around or in close proximity to Market Street, which dissects the northeastern part of San Francisco, with some hotspots being dispersed south of the avenue. Twelve hotspots were identified in 2017 and 13 in 2018 (see Figure 3). Five unique hottest spots were identified in 2017 and four in 2018. One hotspot from 2017 turned into the hottest spot in 2018. The hottest spots during both years show a more robust spatial clustering along the central avenue than the hotspots. Hotspots and hottest spots in San Francisco for the years 2017 and 2018.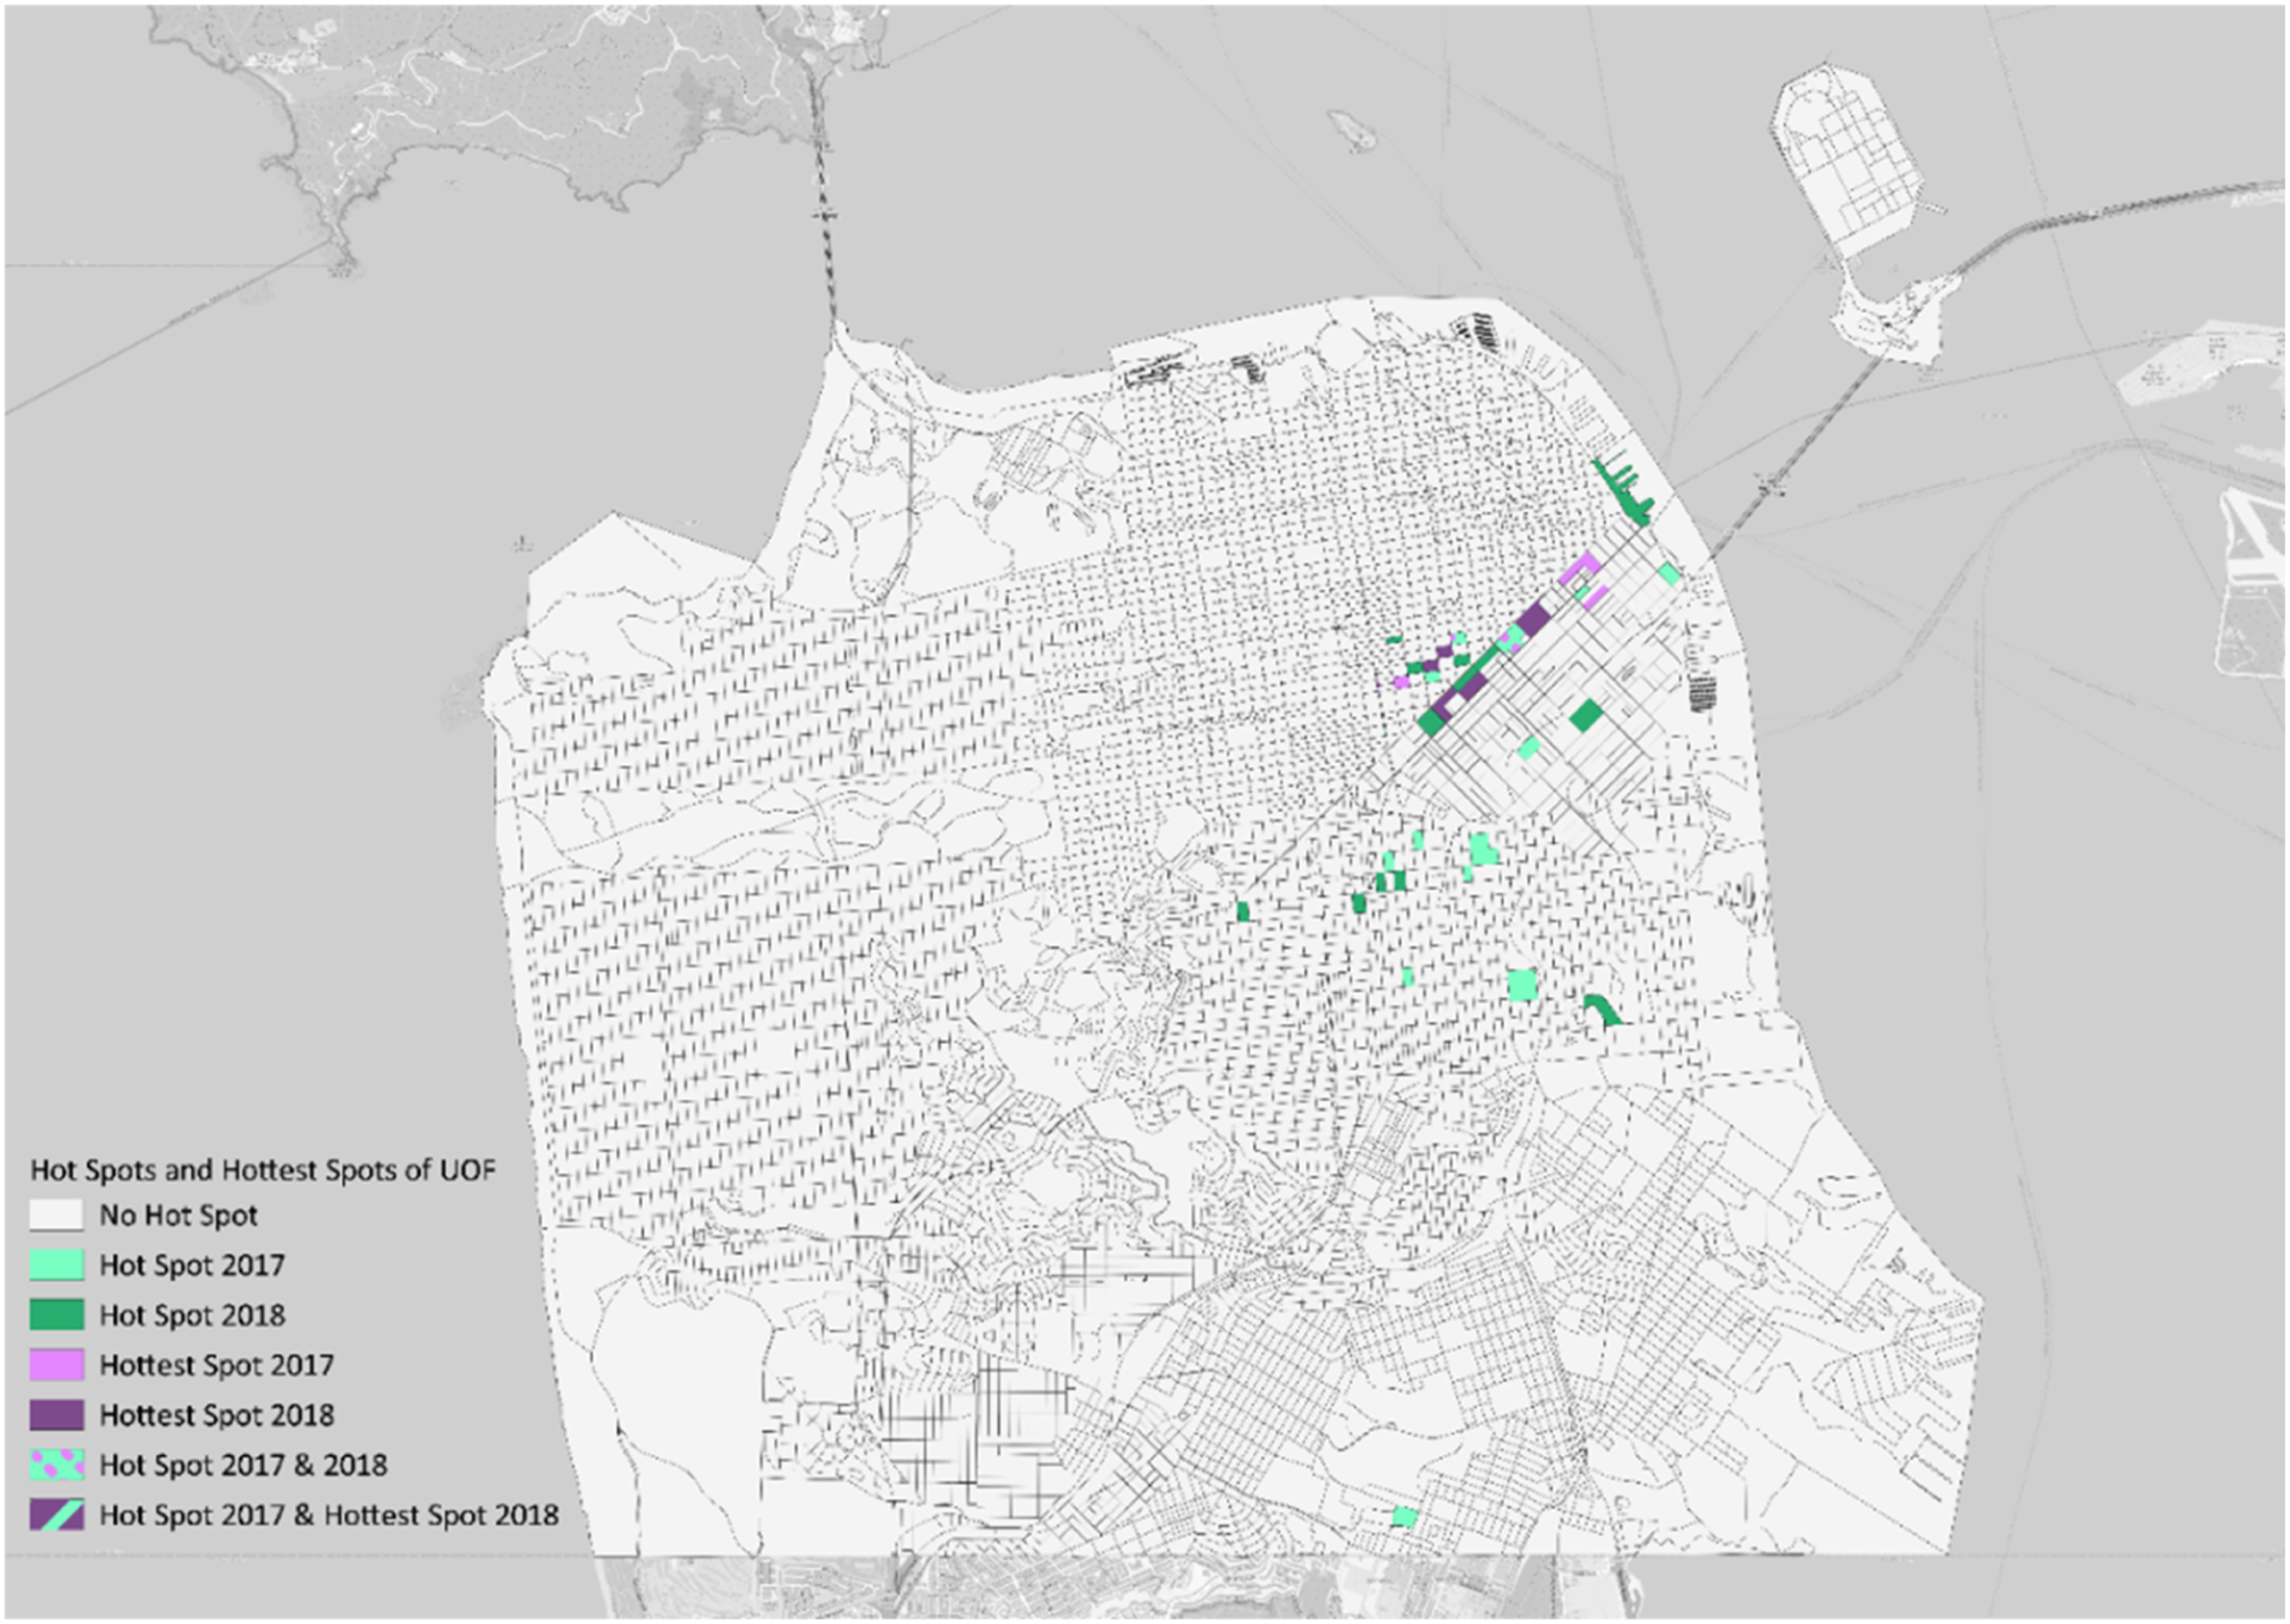
In addition to the occurrence of UoF, we mapped the outcomes of UoF in terms of injuries sustained by police officers and suspects during UoF incidents. During 2017 and 2018, police officers were injured in 9.6% of UoF incidents (n = 253), while suspects were injured in 32.7% of incidents (n = 858). Census blocks with a high number of UoF incidents also exhibited a high number of officer injuries, particularly on the east side of Market Street—a major avenue in the northeast of San Francisco. Clusters of officer injuries were evident across the city’s downtown districts (see Figure 4). Meanwhile, suspect injuries demonstrated a more pronounced clustering effect along the avenue and in the Mission District, with stronger clustering than officer injuries (see Figure 5). The block with the highest number of reported suspect injuries recorded 10 incidents during the study period. This difference in clustering is partly due to the larger sample size of suspect injuries, which is more than three times that of police officer injuries. Officer injuries per census block in San Francisco for the years 2017 and 2018. Suspect injuries per census block in San Francisco for the years 2017 and 2018.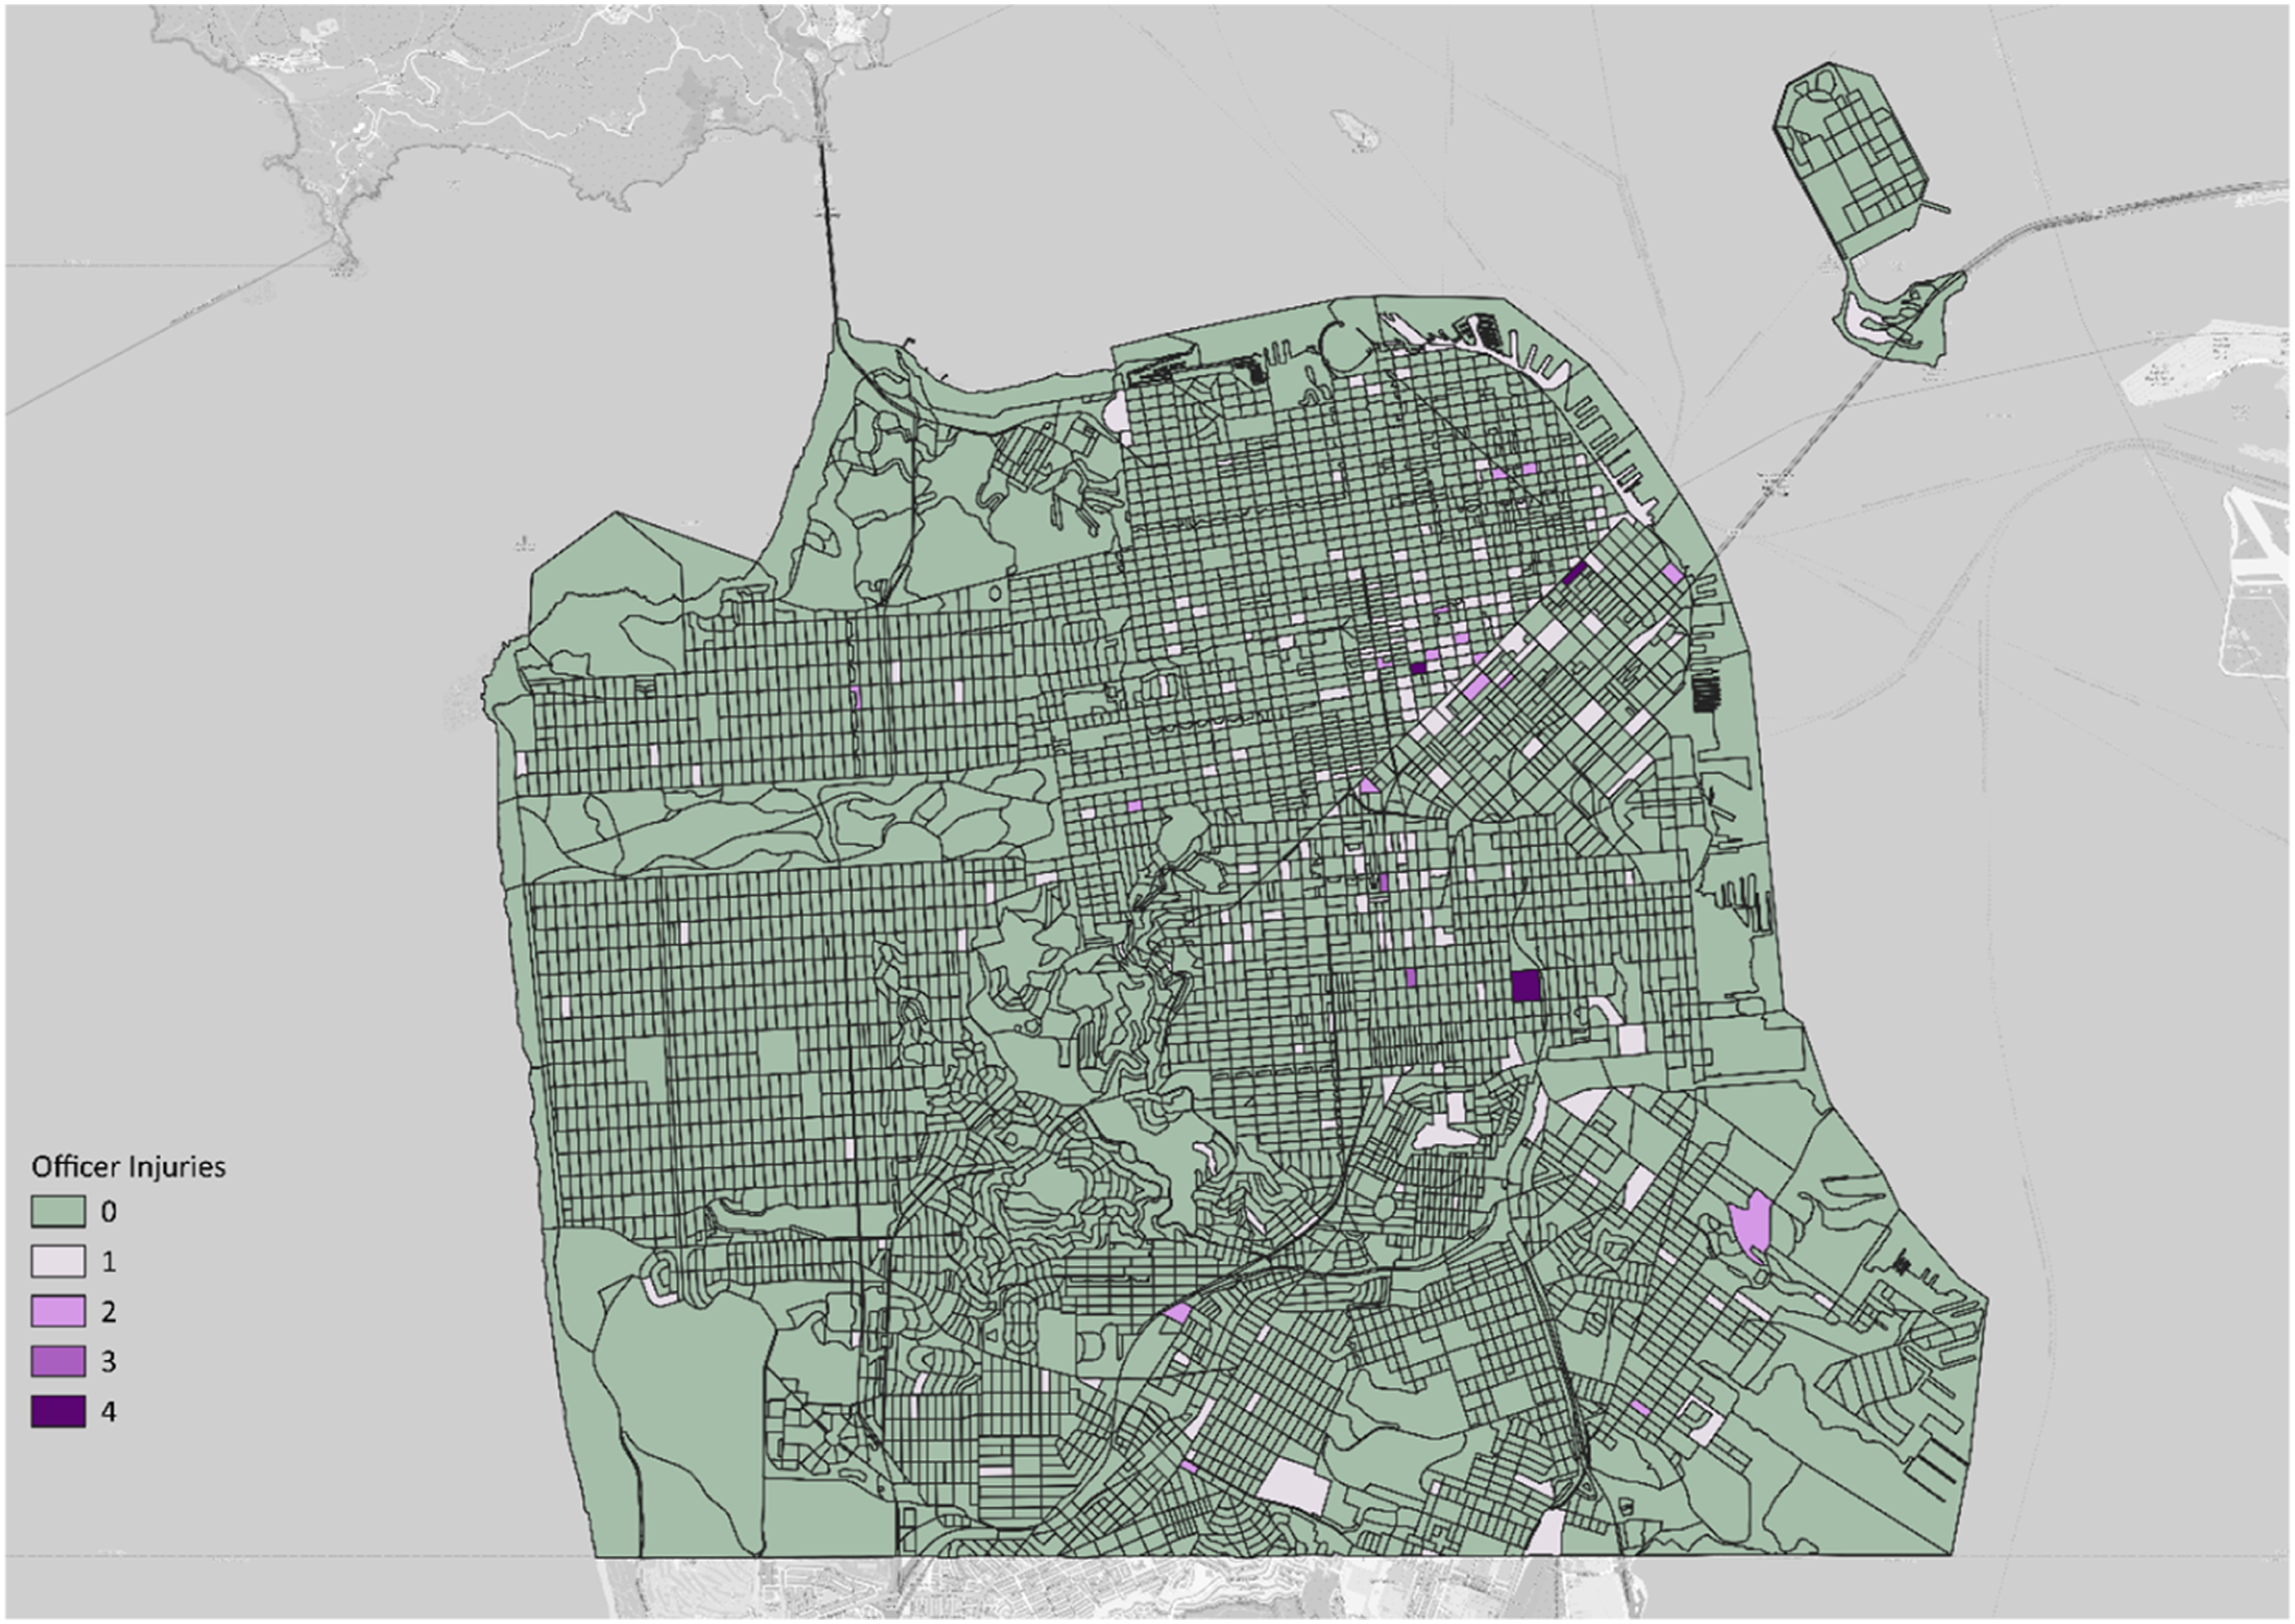
Effects of multi-officer and proactive policing on UoF
Chi-square test for comparing single and multiple-officer involvement in use-of-force Incidents.
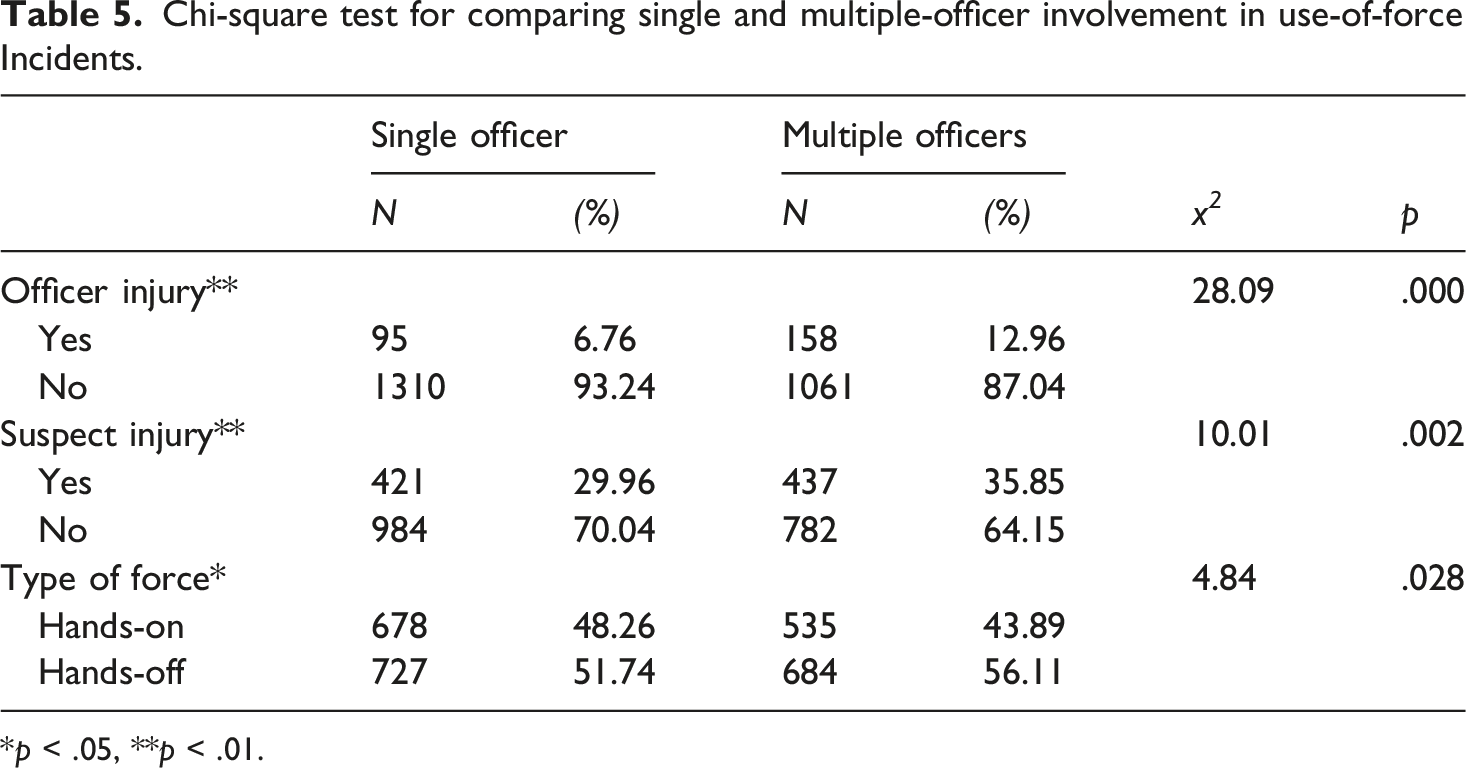
*p < .05, **p < .01.
Odds ratio estimates on the difference between single and multi-officer involvement on the risk of officer injury, suspect injury, and the type of force used.
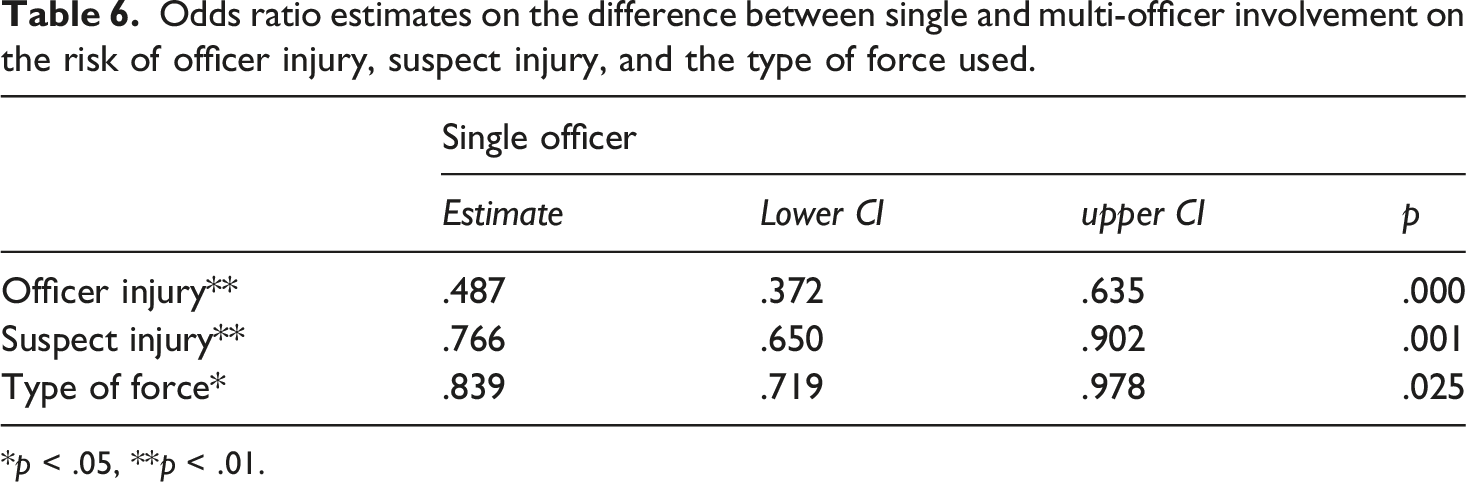
*p < .05, **p < .01.
Chi-square test for comparing proactive and reactive policing in use-of-force incidents.
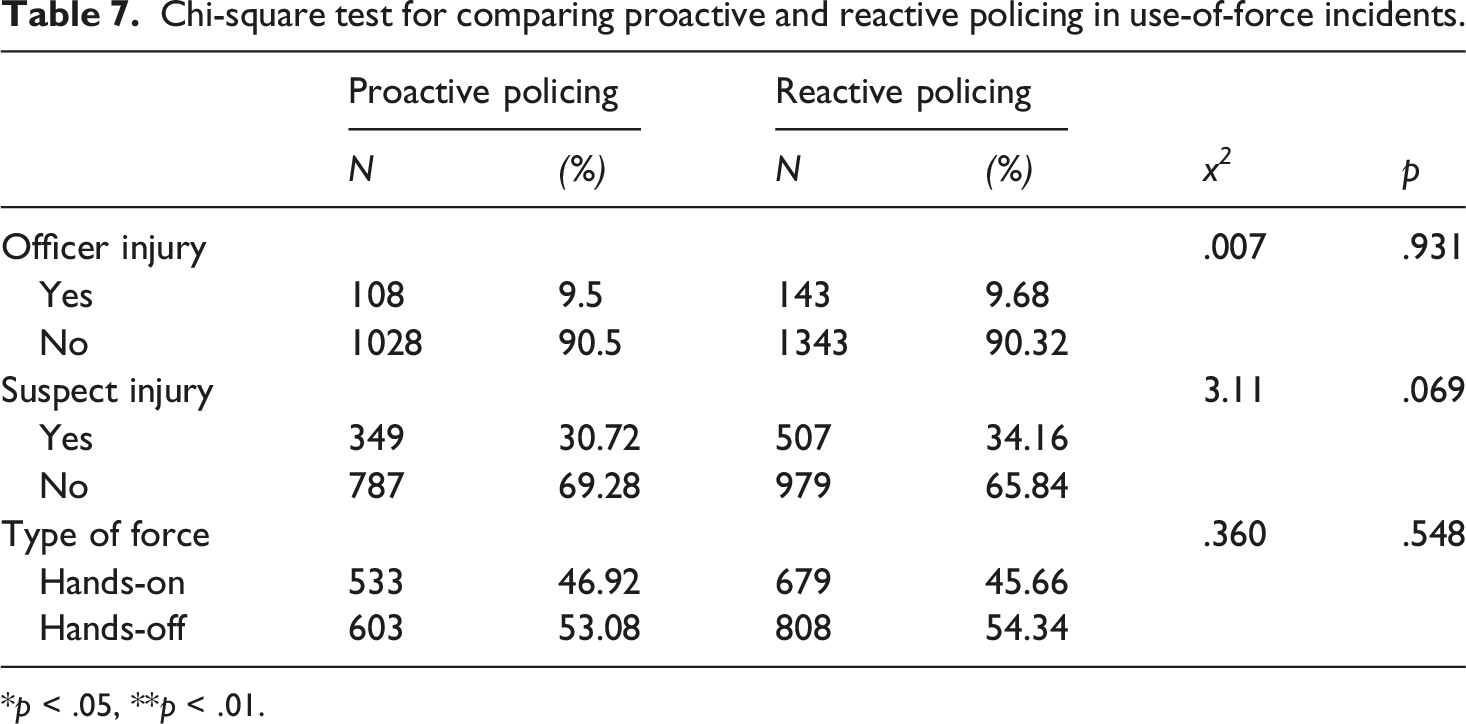
*p < .05, **p < .01.
Odds ratio estimates of the difference between proactive and reactive policing on the risk of officer injury, suspect injury, and the type of force used.
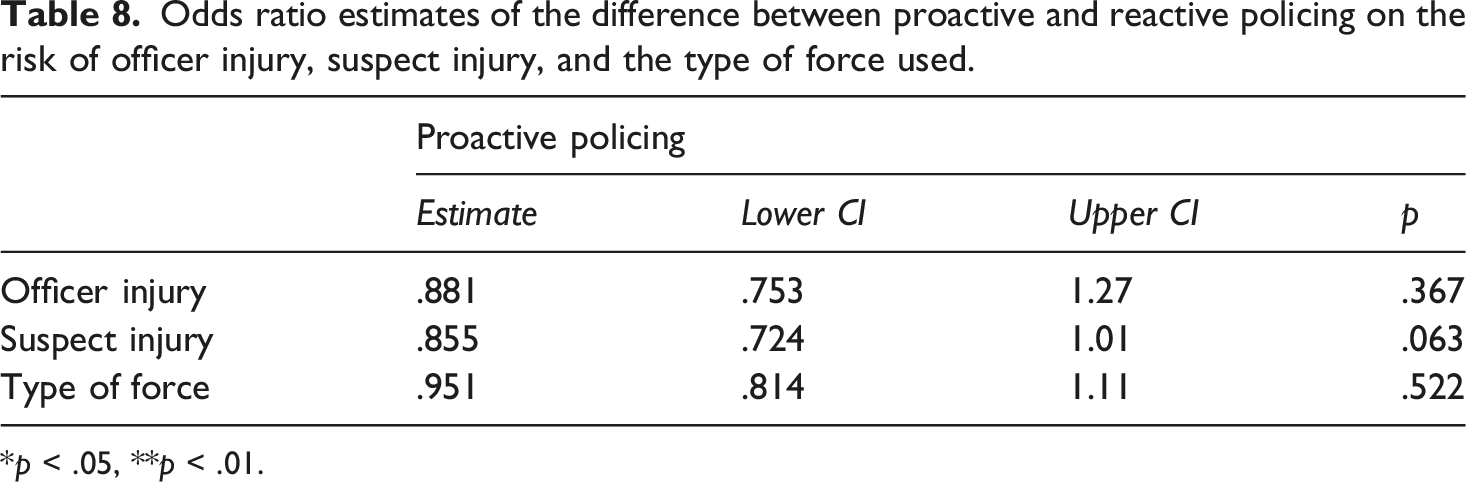
*p < .05, **p < .01.
Geographic interdependence of UoF and the minority population
We also examined the geographic concentration of minority groups in relation to UoF incidents. As shown in Figure 6, census blocks with a majority Black population are sparse and dispersed, with only 5–10 individual blocks containing more than 50% Black residents, located primarily in the northeastern and southeastern parts of the city. The only visible cluster appears around the Hunter Point district. Comparing Figures 1 and 3 with Figure 6 reveals that census blocks with high proportions of Black residents (>50%) do not overlap with those identified as UoF hotspots or hottest spots (0% overlap). Proportion of black population per census block in San Francisco for the years 2017 and 2018.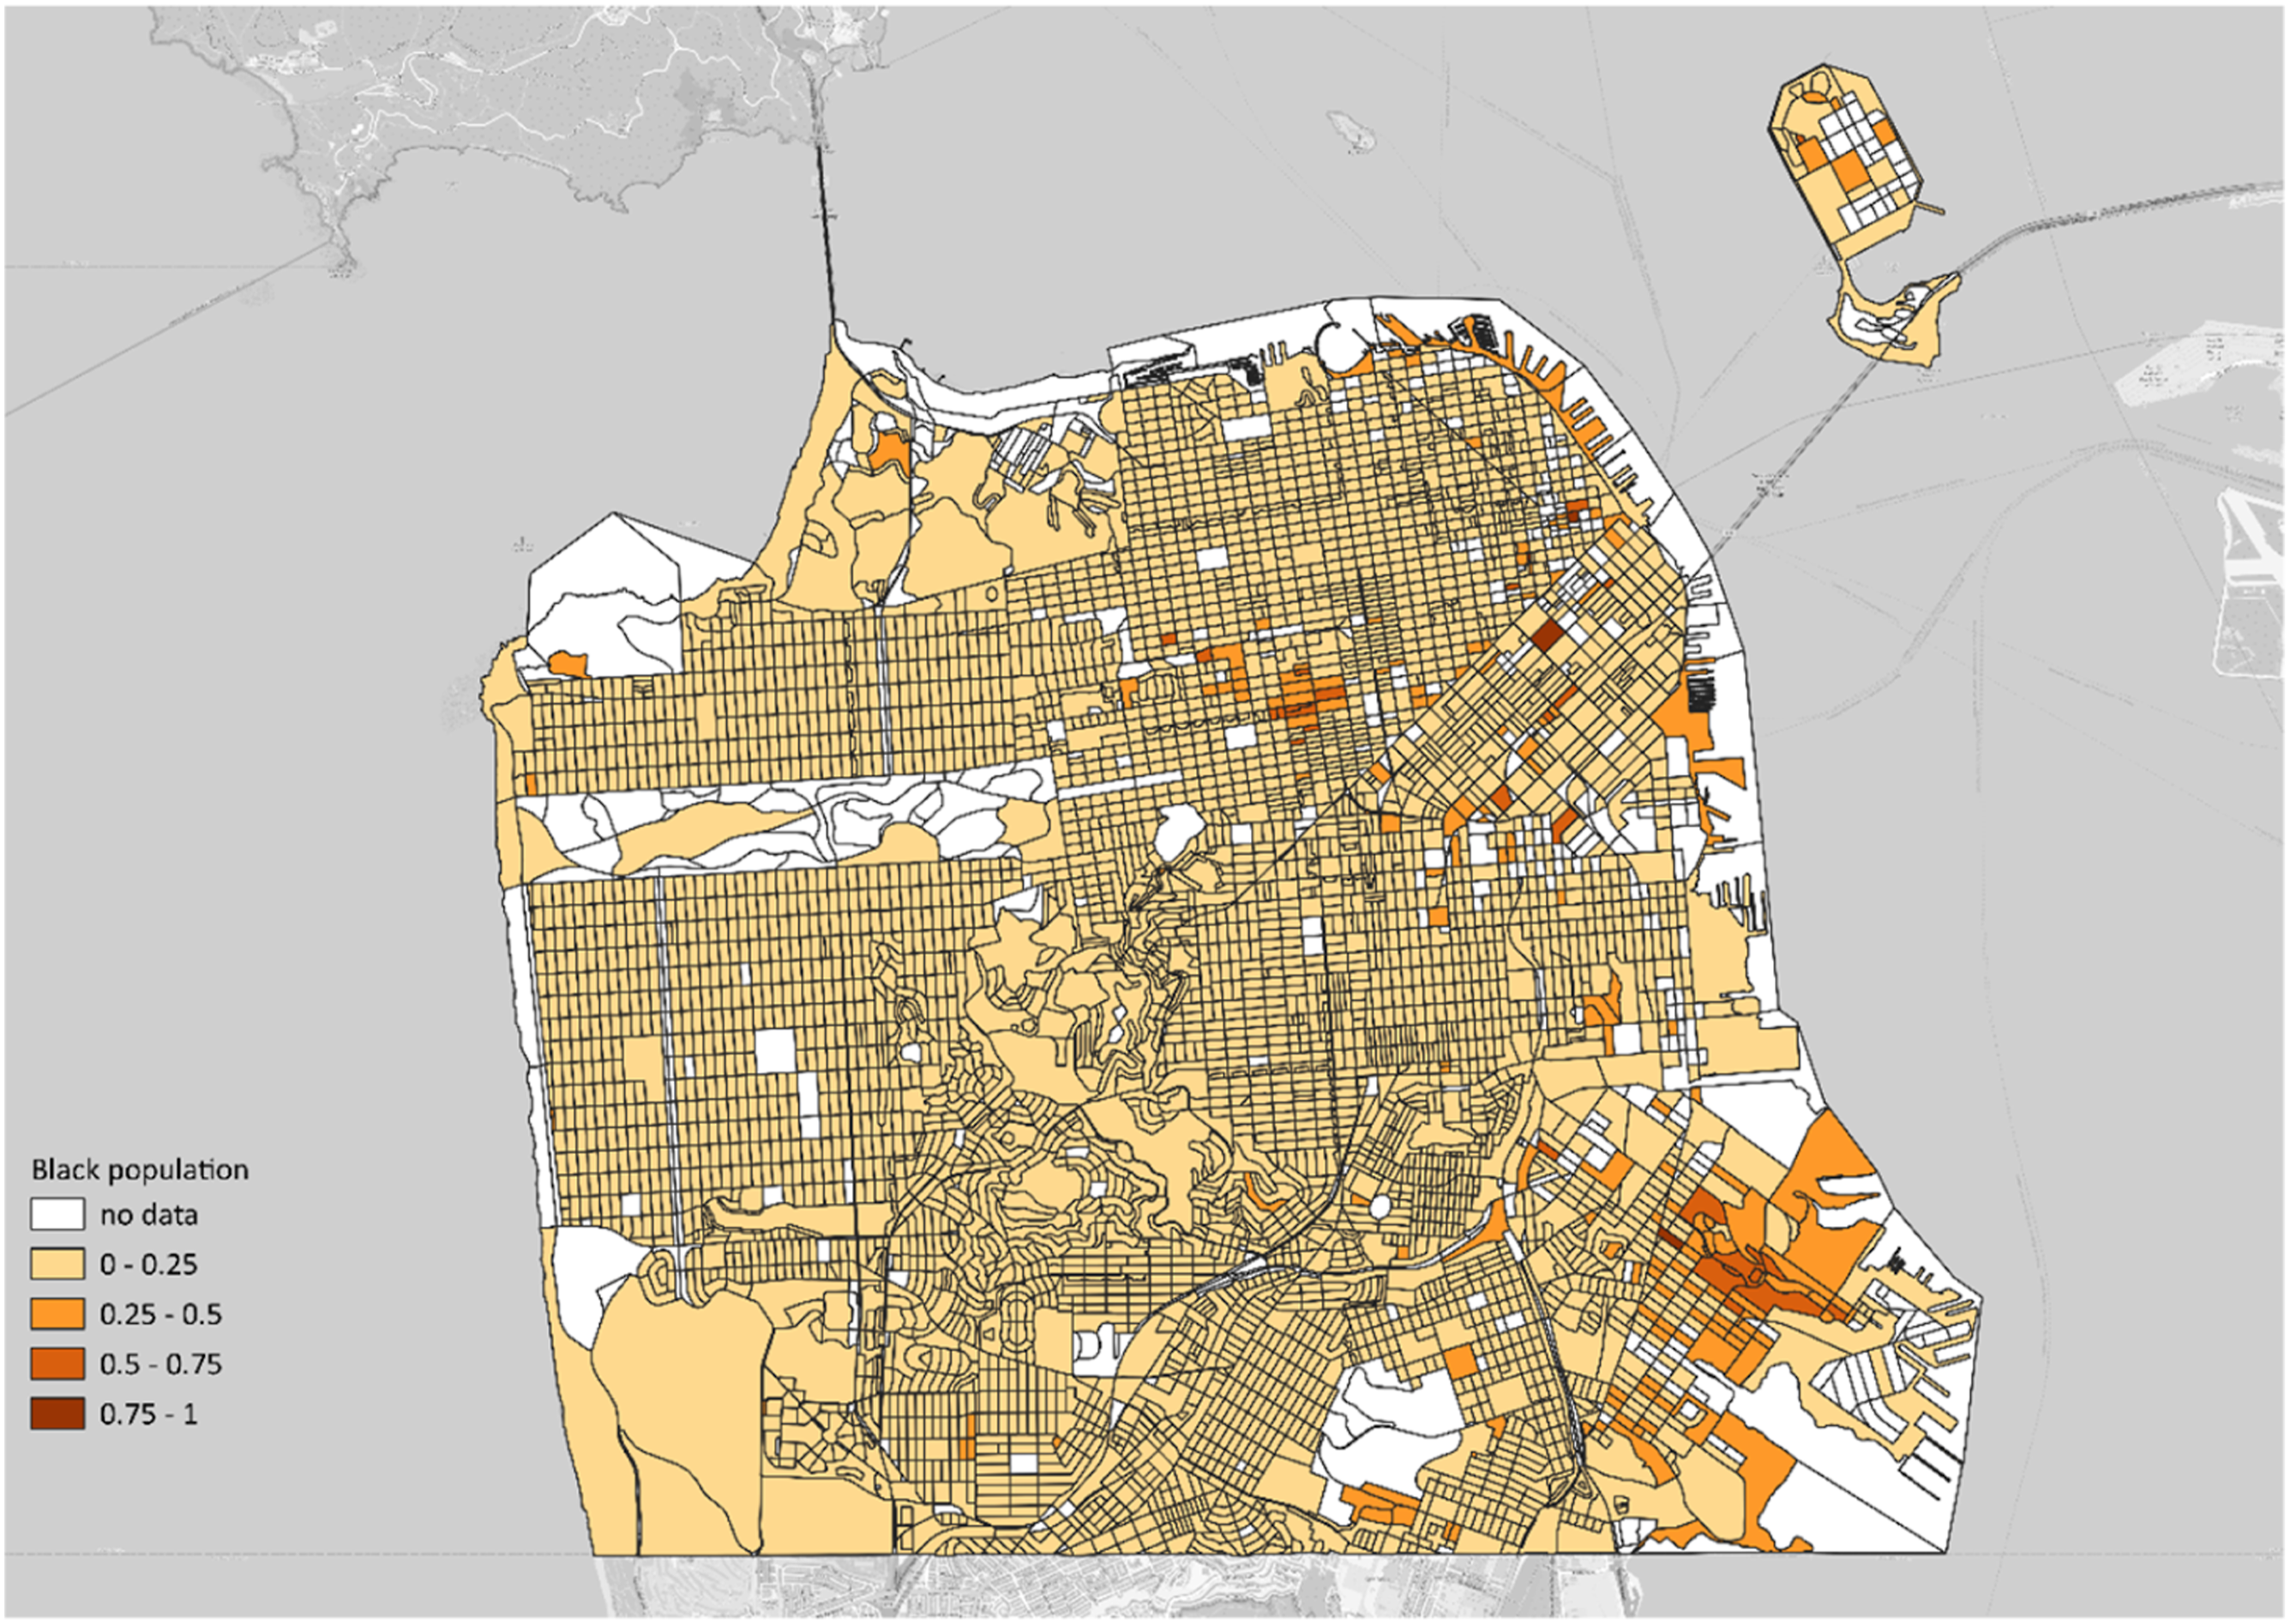
As shown in Figure 7, a substantial number of census blocks (approximately 100–150) have more than 50% Asian residents, with some exceeding 75%. The strongest cluster is located, as expected, in Chinatown at the northeastern edge of the city, with another significant cluster in the southeast near the Silver Terrace area. As with the Black population, comparing Figures 1 and 3 with Figure 7 reveals that census blocks with a majority Asian population (>50%) do not overlap with those identified as UoF hotspots or hottest spots (0% overlap). Proportion of Asian population per census block in San Francisco for the years 2017 and 2018.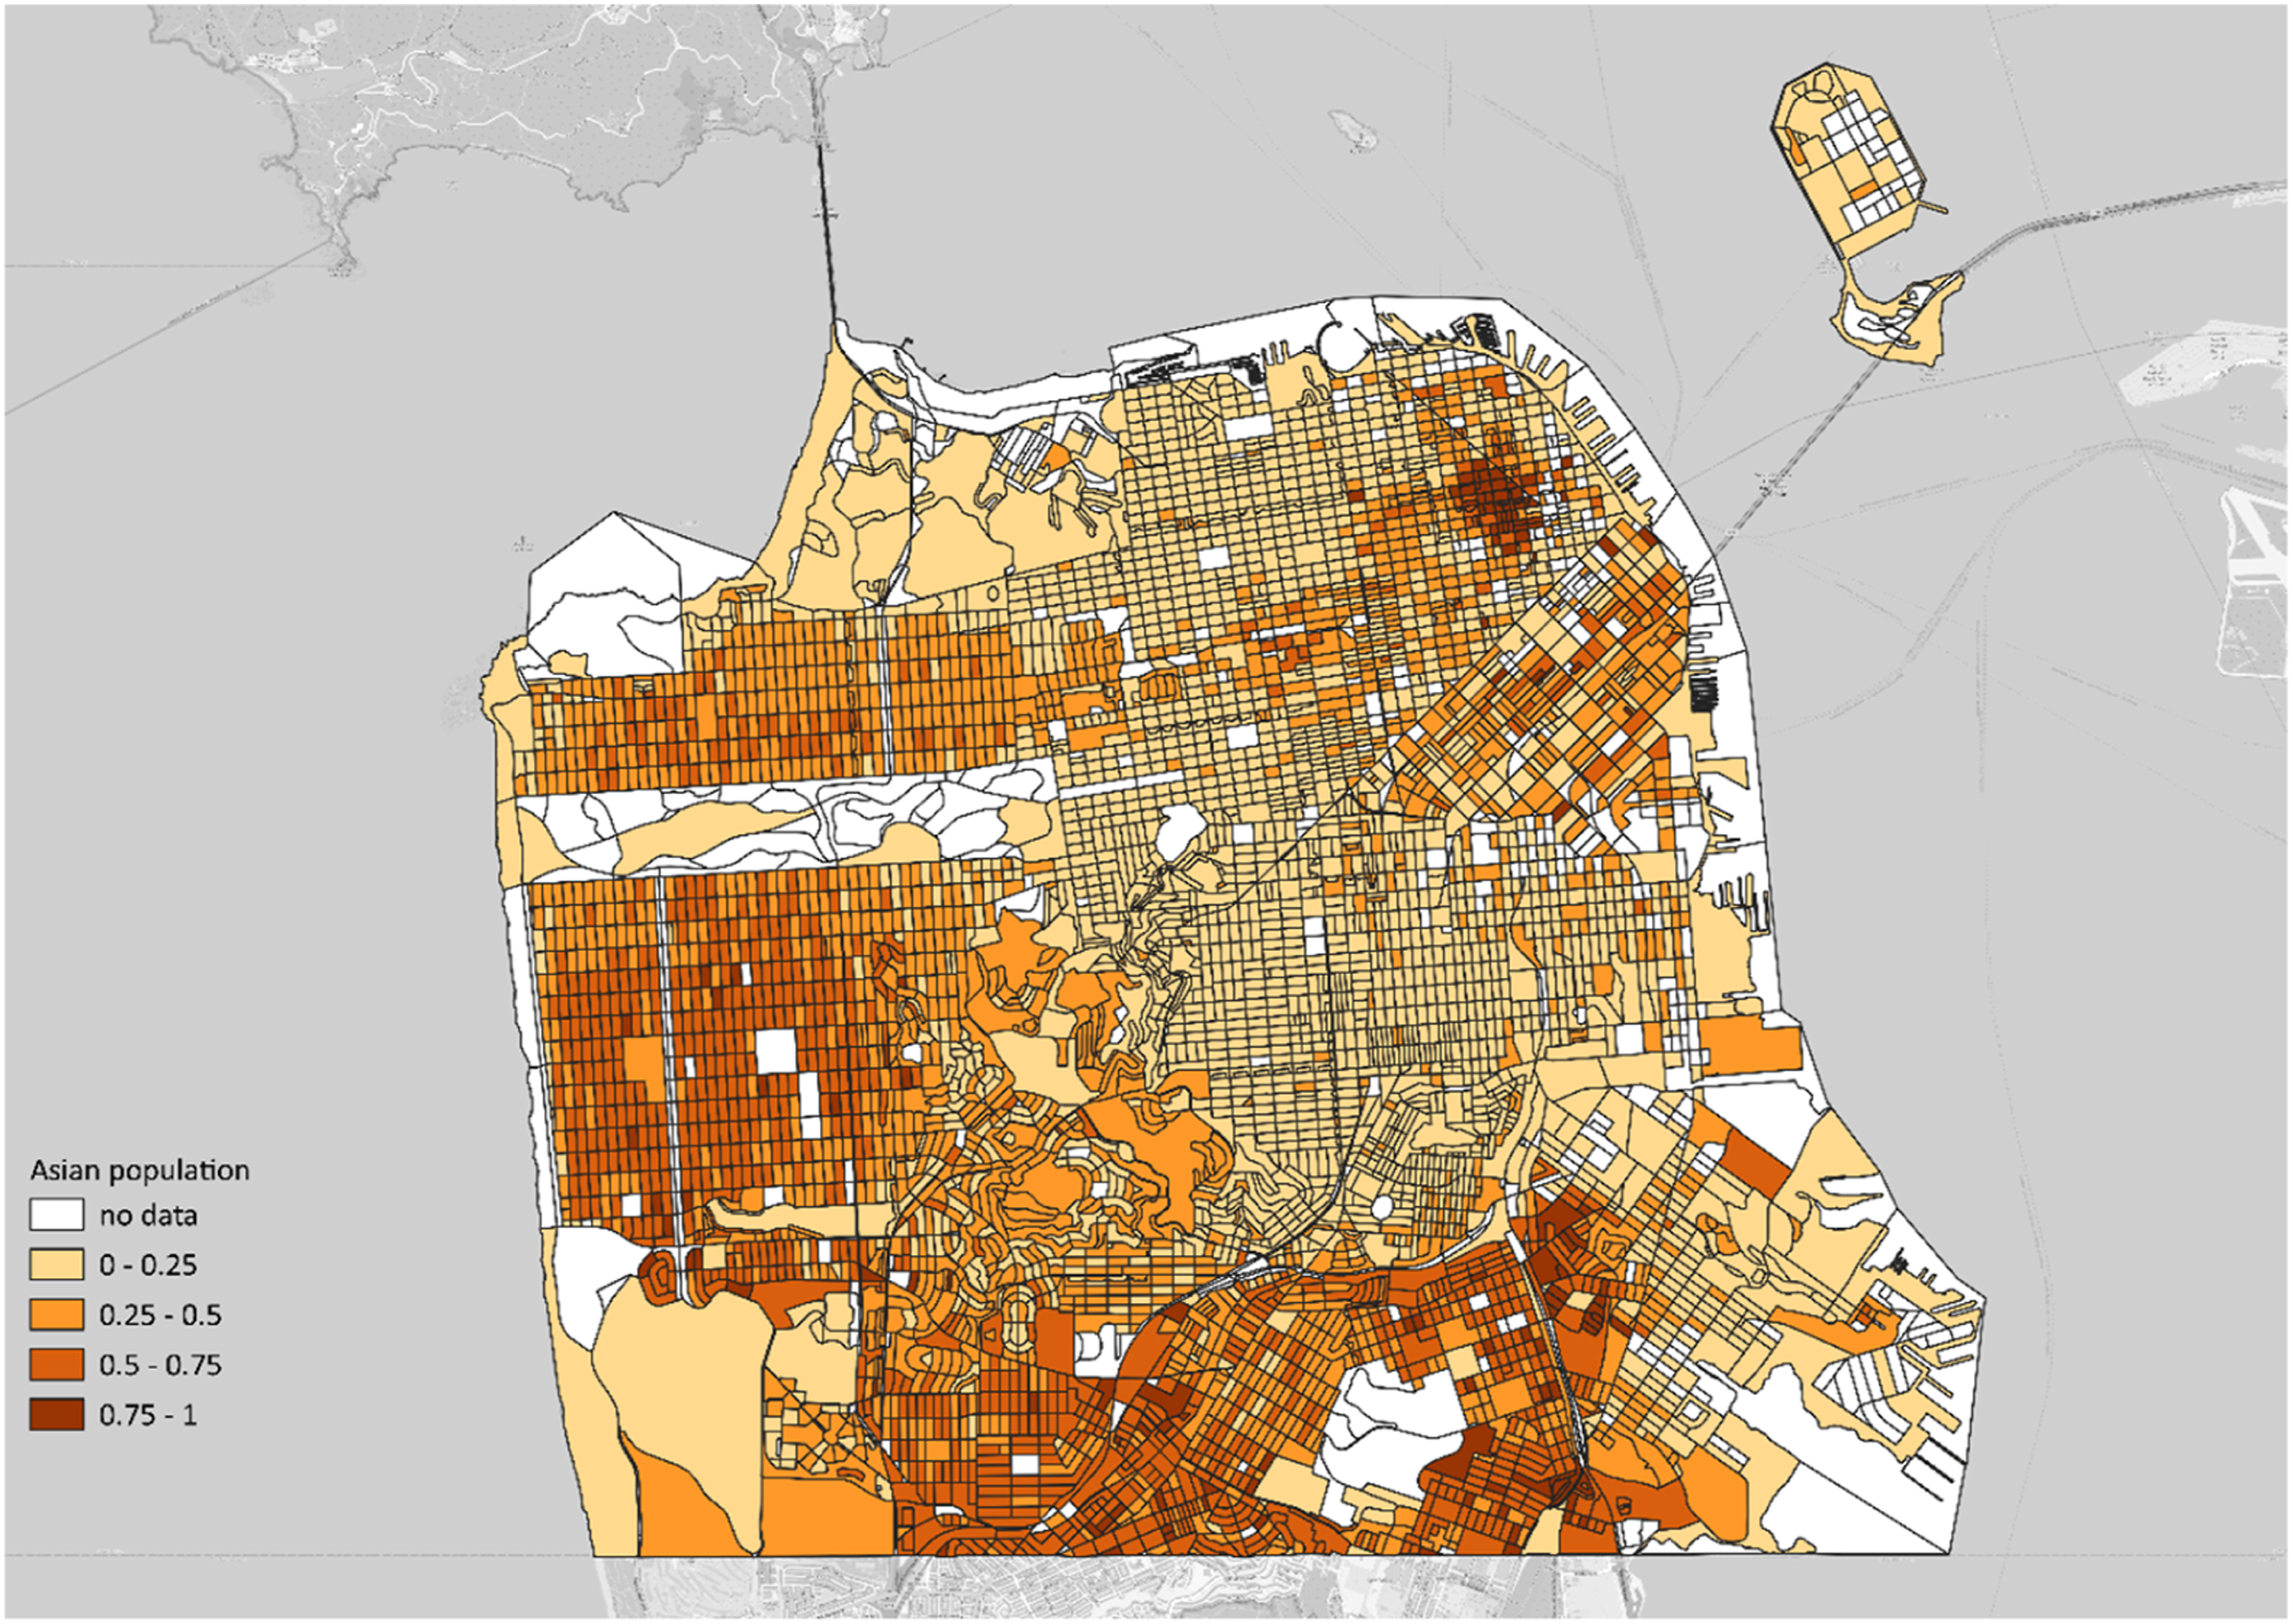
Discussion
This study provides the first combined geographic and temporal analysis of police use of force at the micro-level. It examines the characteristics of police encounters that result in officer or suspect injuries or hands-off force. Compared to other research (Braga and Bond, 2008; Braga et al., 2011; Taylor et al., 2011, 2024), the concentration in this study was not limited to spatial dimensions but also included temporal and agent-based dimensions. Our findings reveal that police UoF is highly concentrated at the micro-geographic level. While the concentration among officers and suspects is less pronounced than the spatial concentration within census blocks, they still demonstrated a meaningful level of concentration. Additionally, the frequency of use-of-force incidents varies throughout the day, with a significant temporal concentration during certain hours, while the spatial hotspots show instability, with little to no overlap between 2017 and 2018. We also observed that both police officers and suspects sustained injuries during these incidents, but suspect injuries were more numerous and clustered.
Following Sorg et al. (2021), UoF incidents exhibit a similar spatial concentration as crime. Similar levels of spatial concentration might be partly a natural consequence of spatial overlap between crime and police UoF. Places with high levels of crime due to certain crime attractors (Kinney et al., 2008; Weisburd et al., 2016: p. 48) tend to attract more potential offenders, which, in turn, may lead to increased police encounters within these places, which might result in a higher prevalence of police UoF.
Beyond the prevailing focus on offenders and, lately, increasingly on places, this study identified a notable concentration of UoF incidents among officers. This pattern reflects a broader principle of distributional inequality observed in crime analysis, where a minority of units (officers, places, or offenders) generate the majority of outcomes. The spatial concentration of UoF may be influenced by the deployment of high-use officers in specific areas, highlighting the need for future research to examine the extent to which UoF patterns are shaped by officer deployment, individual officer behaviour, or a combination of both.
Furthermore, we found that encounters with individual officers were associated with lower risks of injury and hands-off force than incidents involving multiple officers. This association may, in part, reflect that multi-officer encounters are more likely to occur in complex or higher-risk situations, where the probability of injury is already elevated. At the same time, prior research has suggested that the likelihood of UoF increases with the presence of more officers (Bolger, 2015; Henriksen and Kruke, 2020). As Paoline (2003) argued, the perception of the officers’ work environment and tasks as dangerous and threatening may unite officers, reinforcing a cultural mandate of loyalty that drives them to support one another both physically and emotionally. This culture, characterised by widely shared attitudes, values, and norms, helps manage the strains of police work and punitive management practices. However, it often involves distrust and suspicion of citizens, a focus on maintaining authority, a ‘us versus them’ mentality, and intense loyalty to peers. Such an environment, which fosters a collective response, may escalate the use of force when additional officers are involved.
Similarly, identifying hotspots of police use of force and concentrating resources, such as increased supervision and oversight, in these areas could help manage the risk of UoF and potentially reduce the frequency of UoF. By targeting efforts at locations where police UoF is most prevalent, it is possible to manage and reduce UoF in these hotspots, thereby helping control citywide UoF (Weisburd et al., 2017). This targeted strategy aligns with the broader ‘hot spots policing’ approach, which emphasises concentrating resources in high-activity areas to achieve effective results (Braga et al., 2014, 2019a, 2019b; Braga and Weisburd, 2022; Weisburd et al., 2024; Weisburd and Telep, 2014).
Geographic mapping precision and overlap
Compared to crime, the spatial geographies of the police UoF remain very much underexplored. Interestingly, fundamental mapping of hotspots is not a common practice in research on policing and its effects. Understanding the spatial concentration of any phenomenon represents the first step in investigating the factors associated with its (re)occurrence. This study has shown that hotspots and hottest spots of UoF are concentrated in a few census blocks. Mapping the specific locations where police use of force occurs can help guide specially trained personnel to these locations to better respond to place-based risk and prevent UoF.
Moreover, focusing on the highest spatial resolution should become the default in place-based research. This also includes basic maps of the phenomenon of interest. There are two reasons for this. First, collecting data at the most precise level (i.e., street segments or blocks) allows aggregation to any lower spatial resolution (i.e., neighbourhood or city level). Second, determining the precise locations where police UoF occurs offers practical insights to police chiefs and strategists to better guide patrol officers and analyse place-based differences.
Limitations
This study examines reported UoF incidents in the SFPD during 2017–2018 and therefore reflects a single organisational and temporal context. As such, the findings have limited generalisability, but the exploratory design offers a framework that may support future comparative and cumulative research. Second, the analysis relies on census-based residential population data, but residential location may be a poor proxy for the places in which offenders conduct their routine activities (see also Basta et al., 2010; Colburn et al., 2020; Jones and Pebley, 2014). Mobility-based measures could better capture the geographic overlap between police activity and the presence of different racial groups. Relatedly, while the study benchmarks UoF outcomes directly against census populations and examines encounter-level reactivity by comparing proactive and reactive encounters, it does not incorporate earlier stages in the police–citizen process (e.g., who is reported to the police, calls for service, stops, arrests), where disparities may already emerge and shape exposure to encounters in which UoF may occur. Future research could address these limitations by incorporating mobility-based population measures and earlier stages of police–citizen interaction, and by applying bivariate spatial visualisations to further examine potential spatial co-occurrence.
Third, while “non-conforming” handcuffs are generally considered a step on the continuum of force (Henstock and Ariel, 2017), our study did not include handcuffing in the measurement of UoF. This decision was based on the data provided by SFPD, which did not categorise handcuffing as part of UoF in their reporting structure (For a discussion on the inconsistency in how handcuffing is treated across different departments, see Henstock and Ariel, 2017). Although our approach aligns with previous studies that exclude handcuffs (e.g., Assaraf et al., 2024) and offers a consistent, comparable measure, excluding handcuffs may lead to an underestimation of UoF incidents.
Finally, injury outcomes were examined at the incident level, reporting overall proportions and spatial concentrations of injury rather than block-specific injury probabilities. Future research should model block-level injury rates to identify places where the likelihood of injury is disproportionately high relative to incident volume. In addition, future studies should account for the type of offence that led to the encounter, as different encounter contexts may differentially shape both the likelihood of UoF and the probability of injury.
Conclusions
This study demonstrates that police use of force is highly concentrated in specific places, times, and among certain officers. The place-based nature of UoF offers new perspectives and actionable insights for researchers and practitioners seeking to evaluate and design hotspot policing programmes. By combining place-based frameworks (focusing on where UoF occurs) with agent-based approaches (focusing on who is involved), police departments can identify high-risk locations and officers, enabling targeted interventions in areas where the likelihood of force is elevated. Understanding the temporal and spatial distribution of UoF incidents can also inform decisions regarding officer deployment and the allocation of training resources. To operationalise these insights sustainably, data collection and analysis should extend beyond spatial factors to incorporate information on the when, where, and who of policing activities. This triangulation enables a more comprehensive understanding of policing outcomes in specific local contexts. Finally, this study provides the first detailed geographic mapping of UoF incidents and recommends integrating richer data sources—such as mobility data—to enhance future analyses.
Footnotes
Acknowledgements
We would like to express our sincere gratitude to Principal Analyst Dae Son and Deputy Chief Peter D. Walsh from the San Francisco Police Department for providing the data and facilitating the data-sharing process that made this research possible.
Funding
The authors received no financial support for the research, authorship, and/or publication of this article.
Declaration of conflicting interests
The authors declared no potential conflicts of interest with respect to the research, authorship, and/or publication of this article.