
Abstract
This paper investigates gender differences in voting for the two major parties (Labour and National) and the two main small parties (Green and New Zealand First) at the 2011 New Zealand general election. In contrast to the gender gap found in many post-industrial societies with women being more likely to lean towards the left than men, this study reveals limited differences in party preferences among men and women in New Zealand. The only substantial gender difference is found in relation to voting for New Zealand First, with women being substantially less supportive of the populist party than men. This gap is robust and remains substantial even when gender differences in socioeconomic characteristics and issue positions related to the role of government, the welfare state and the presence of immigrants are taken into account. Interestingly, while no gender gap occurs at first sight in support for the mainstream right-wing party National, a gap does arise once gender differences in policy issue positions are controlled for, with women being more likely to support National than men.
Introduction
Research on gender and voting behaviour across Western post-industrialized nations has found that women have turned towards the left since the 1980s. 1 Women’s increasing rates of labour force participation and their positive attitudes towards social service spending have been presented as major forces for the development of a so-called modern gender gap, with women being substantially more likely to vote for left-wing parties than their male counterparts. Surprisingly little empirical work is available on possible gender differences in voting behaviour in New Zealand. Looking at New Zealand and comparing the 1963, 1981 and 1990 elections, Vowles concluded that whereas women were more supportive of National and less supportive of Labour than men in 1963, no substantial differences in party preference existed in 1981 and 1990. 2 Yet, looking at the 1996 elections but not focusing on gender specifically, the analyses of Denemark and Bowler and Banducci and Karp 3 revealed that women were more likely to vote Labour than National. This finding was not replicated in McAllister’s study on the 2002 election. 4 His analysis only demonstrated a substantial gender difference in the likelihood of voting for Labour instead of New Zealand First, with women being significantly less likely to support the populist right-wing party New Zealand First than their male counterparts. Similarly, Banducci and Karp showed that smaller parties at the centre and on the right (including New Zealand First) attracted more male than female voters. 5 In other words, whereas a major gender gap has been suggested in post-industrialized Western democracies like the United States, with women being more likely to lean leftwards than men, a gender gap in mainstream left vs. right voting has not been consistently found in the available empirical research on electoral behaviour in New Zealand.
The aim of this paper is to add to and update the current knowledge about the gender gap in party choice among New Zealand voters by assessing the evidence for the presence of a gender gap and looking for explanations for the presence or absence of such a gap at the 2011 general election. Further knowledge of the gender gap through case studies, in this case focusing on New Zealand, is important. Comparative studies 6 have found substantial cross-national differences in the extent of and explanations for the gender gap, making detailed country-specific studies highly relevant. A New Zealand-specific study also enables to offer further theoretical insights into gendered voting patterns and reasons for such patterns in the New Zealand context. Such patterns matter for the conduct of political parties and outcomes of elections, and thus have the potential to influence and structure policymaking. 7
Two related research questions motivate the current study. The first is descriptive and aims to answer to what extent women and men had a different party preference at the 2011 New Zealand general election. In particular, I will consider support for the two major parties (Labour and National) and the two largest minor parties (Green and New Zealand First). Combined, these four parties gained 92.5 per cent of the party votes at the 2011 election. 8 The second is explanatory and will test to what extent gender differences in structural socioeconomic characteristics and political issue positions may explain potential gender gaps in party choice. To answer these research questions, I will perform logistic regression analyses and utilize data from the 2011 New Zealand Election Study (NZES). Before turning to a description of the data and measurements, I shall introduce relevant theories in the next section.
A modern gender gap in party choice
Whereas women were known to disproportionately support conservative parties in the period after enfranchisement, empirical evidence has highlighted a move towards the left since the 1980s and a growing gender gap in vote choice, with women being more supportive of left-wing parties than their male counterparts. 9 While cross-national differences in the extent and direction of gendered voting patterns exist, women’s greater likelihood of favouring left-wing parties is considered a pervasive feature of the political landscape in many post-industrialized democracies, including the United States. 10 A wide variety of explanations have been suggested for what Inglehart and Norris refer to as the modern gender gap. 11 Here I focus on two broad categories of frequently offered explanations for the gender gap and which form the main elements of the socio-psychological model of voting behaviour: 12 structural socioeconomic characteristics and issue positions. Whereas voters’ socioeconomic position was traditionally seen as the main explanation for voting behaviour, its influence as an explanation has decreased as traditional group alignments have weakened over the last decades, while issue positions gained more importance. 13 Yet both correlate. As will be seen below, social positions often shape issue positions.
A first structural characteristic that has been suggested as a principal correlate of the modern gender gap is women’s participation in the paid labour force. Manza and Brooks’ empirical study on the origins and development of the gender gap in the United States, 14 as well as Giger’s comparative research on the emergence of a modern gender gap in Europe, 15 reveal women’s changing rates of participation in the labour force as the main explanation of the gender gap. Being active in the paid workforce exposes women to gender (pay) inequalities and provides them with life experiences that they are less likely to experience as homemakers; experiences which make women more inclined to lean towards the left. Working women are also expected to be more likely to support public spending on child and elderly care, duties which were traditionally done by unpaid female work. 16 Manza and Brooks confirm that attitudes towards social service spending indeed ‘mediate the interrelationship of women’s labour force participation and vote choice’. 17 Furthermore, the greater likelihood that women will work in the public sector makes them more dependent on the expansion of the welfare state and thus more likely to be supportive of left-wing parties. 18
Further structural explanations and related policy positions that have been suggested for the move towards the gender gap in party choice are the growth of women’s educational opportunities, the break-up of the traditional family unit, and increasing levels of poverty among women. Women’s growing educational opportunities have encouraged more liberal attitudes, which increase the likelihood that they will lean leftwards politically. 19 Single and divorced women, who are increasing in number, are said to have different material interests from married women. 20 Rising levels of poverty among women, partly as a result of increasing levels of divorce and with women facing more economic decline after divorce than men, 21 make women also more inclined to be dependent on and thus more supportive of the welfare state. Such support encourages voting for left-wing parties who typically advocate greater governmental responsibility for citizens’ welfare than right-wing parties. Women’s greater parental responsibilities and their socialization into valuing nurturing activities have also been linked to support for a greater governmental role in ensuring citizens’ welfare. 22
Finally, women’s higher levels of religiosity 23 has traditionally explained their greater support for conservative and religious parties than men. 24 Yet the process of secularization has eroded the link between church and party, which increased women’s likelihood to vote for parties other than religious and conservative ones, including left-wing parties.
In sum, the theoretical insights and empirical research briefly presented here suggest that gender differences in structural characteristics (including employment status, sector of employment, level of education and marital status) and related political issue positions (including those related to the welfare state and the role of government) explain a move towards a modern gender gap in voting behaviour. Even though some of the presented research has been mainly concerned with explaining changes over time whereas this study is interested in explaining the possible gender gap in one election, it offers an indication of the relevant intervening structural characteristics and policy positions between gender and party choice. Before describing and explaining the gender gap, and thus exploring the extent to which the characteristics presented here are relevant in the case of the 2011 New Zealand general election, I first briefly present the parties that will be included in my study and describe the 2011 political context in New Zealand, as it is suggested that the country-specific pattern of party competition and issue agenda may influence the extent of the gender gap. 25
New Zealand and the 2011 general election
The 2011 general election took place on 26 November, shortly after the finals of the Rugby World Cup, hosted and won by New Zealand. The organization and intense media coverage of such a big sporting event meant that the election campaign was limited to a four-week period. 26 National, New Zealand’s mainstream right-wing party, was led by the incumbent Prime Minister John Key. During his first term (2008−11) after the removal of Labour from office in 2008, Key had been faced with a range of economic challenges, including the global financial crisis, 27 and the focus of National’s 2011 campaign was the economy (in addition to rebuilding Christchurch which had been hit by a severe earthquake in February 2011, killing 185 people and causing widespread damage across the city). 28 With the slogan ‘Building a Brighter Future’, National’s campaign included a focus on tax and welfare incentives for work, and an increase in exports and real jobs. Encouraging a more competitive economy had been a central policy issue during Key’s first term, and according to Johansson and Levine, 29 voters generally felt that New Zealand was doing reasonably well given the circumstances, and that the government’s effort to protect the country from the worst effects of the global economic crisis were generally in line with their expectations. National eventually received 47.3 per cent of the party vote on election day, the highest percentage of any party in the six MMP (Mixed Member Proportional electoral system) elections held in the country thus far. 30
National’s main competitor and chief opposition party during Key’s first term, the mainstream left-wing party Labour, did not enter the campaign in a good position. 31 After Labour was defeated by National in the 2008 election, Helen Clark stepped down as party leader after nine years as Prime Minister, and Phil Goff, a former cabinet minister, led Labour’s 2011 election campaign. While he had extensive political experience, his party sometimes seemed to lack confidence in its own leader’s personal appeal. 32 Economic issues were the main topics in Labour’s campaign, as they were for National. Policies Labour said they would pursue if elected included a capital gains tax, tax cuts for lower earners, and a gradual increase in the age of eligibility (from 65 to 67) for the state’s national superannuation policy. 33 Labour also promised to keep New Zealand assets like power companies in public ownership, whereas National considered state asset sales ‘essential to the country’s economic prospects’. 34 On election day, Labour received 27.5 per cent of the votes, its worst result since the 1920s. 35
Labour and National have traditionally dominated the New Zealand party system, opposing one another on the traditional left/right scale. Yet it is relevant to note that it was Labour that introduced a programme of economic liberalization when governing between 1984 and 1993, 36 and was a classic example of the Third Way under its Fifth Labour governments (1999−2008). 37 National, in its turn, contains members and MPs with socially and culturally liberal tendencies (which James suggests may include the current leader John Key), and when entering office in 2008, National accepted most of the policies introduced by the post-1999 Labour-led governments. 38 As The New York Times foreign affairs columnist Friedman put it 39 when describing his impressions of New Zealand: ‘There is a place in the world where moderate Republicans still exist.’
While still often presented as an example of a two-party system, minor parties also play an important role in the New Zealand political system, in particular since MMP was introduced in 1996. 40 The Green Party, which has changed from a radical movement of political outsiders to a ‘more conventional, moderate and professional party’ 41 since its foundation in 1990, has had a consistent parliamentary presence since 1996. 42 Realizing that the economy was going to be the main topic of the campaign, the two leaders of the Greens, Russell Norman (co-leader since 2006) and Metiria Turei (co-leader since 2009), organized a campaign in which post-materialist issues (in particular the environment), which had always been the core of the party’s platform, were combined with economic issues. 43 The party’s campaign slogan ‘For a richer New Zealand’ brought together the promise of an improved quality of life and a prosperous economy, emphasizing the party’s economic aptitude. Their suggested economic policies were summarized as a ‘smart, green economy’ and included the creation of 100,000 ‘green jobs’. 44 The final election result for the Greens was 11.1 per cent, its largest success ever, mainly at the expense of Labour.
Another important minor party on the New Zealand political scene is New Zealand First. While its electoral success has been less consistent than the success of the Greens, it has played an important role on different occasions since its foundation: for example, by supporting the Clark-led government from 2005 to 2008. New Zealand First, commonly labelled ‘populist’, 45 was formed in 1993 by former National member of parliament Winston Peters. Peters is still the party leader today. It opposes free market economics and advocates economic protectionist measures. 46 For example, one of its fundamental principles in its 2011 election platform was ‘to cease strategic state asset sales’. These economic nationalist stances are combined with a discourse favouring tougher law and order and more restrictive immigration policies, including a plan in its 2011 election programme to drastically reduce the inflow of migrants. New Zealand First’s message and slogan ‘For a Fair Go’ appealed to 6.6 per cent of the votes at the 2011 election and the party re-entered parliament after an absence between 2008 and 2011.
In brief, the 2011 elections focused on the economy with the two main political parties adopting distinctive positions. For example, as well as opposing policies on asset sales, Labour advocated an increase in the minimum wage, whereas National defended policies Key’s first government had introduced, including cutting resources for three social policies: Working for Families (which offers financial support to families to make it easier to work and raise a family); KiwiSaver (a retirement saving system); and student loans. 47 At the same time, and in addition to policies which had a distinctive National tone such as the reduction of taxes and a greater involvement of the private sector in governmental activities, National continued most of the re-regulation introduced by the post-1999 Labour-led governments. 48 According to Johansson and Levine, voters also seemed to appreciate the way National had handled the financial crisis and the economy more generally and thus entered the campaign as the obvious and expected winner. 49
Having briefly described the political scene at the 2011 general election, I now move on to the empirical part of this study and describe the data and measurements in the next section.
Data and measurements
To answer my research questions, I utilize data from the 2011 New Zealand Election Study (NZES). 50 The NZES was organized by post among a representative sample of New Zealand voters. Detailed information about the survey and data are available on the survey’s website: www.nzes.org.
Prior to dropping missing values the sample size is 3,101. The final sample size is 1,956. It includes only those respondents who were eligible to vote, who said they had voted at the last election, and who voted for a particular party (thus excluding those who did not remember which party they had voted for). 51
Dependent variables
The dependent variable, party preference, is based on the question ‘If you cast a party vote, which party did you vote for in the 2010 election?’ 52 Four different dependent variables were operationalized: voting for Labour, National, the Greens and New Zealand First. Each variable has two categories: whether the respondent voted for the party or for any other party. 53
Independent variables
The main focus of my study, gender, is a dichotomous variable with the value 0 for male and 1 for female respondents.
My analyses include a variety of structural socioeconomic characteristics that are expected to exert an influence on the gender gap in voting behaviour, as discussed in the theoretical section above. First, the level of education is represented in four categories. It takes value 1 for respondents whose highest level of educational attainment is primary school or lower (primary school); 2 for secondary education to school certificate, national certificate, university entrance, bursary, higher school or higher leaving certificate (secondary school); 3 for non-degree professional trade, technical tertiary qualification or incomplete university degree (non-university post-secondary education); and 4 for university degree. Holding a university degree is the reference category in the analyses below. Occupational status has three categories, white collar, blue collar and self-employed, and refers to the current or last occupation of the respondent. White collar is the reference category. The analyses below also include a dichotomous variable to measure whether or not the respondent is employed in the public sector. It is coded 1 for employment in public sector and 0 for other employment. In addition to occupational status and sector of employment, I also include a dichotomous variable referring the respondents’ current employment status with the value 0 for currently not employed and 1 for currently employed. Furthermore, I introduce a measure that indicates the respondent’s wealth and assets. The question asks: ‘Do you or does a member of your family own any of the following?’ Two assets are considered: ‘a residence: your home, house or apartment’ and ‘any savings’. Answering categories are 1 (‘yes’) or 2 (‘no’) but were recoded into dichotomous 0/1 variables in which the value 1 refers to ownership. The two items were summed up into a scale (correlation = .423) which refers to possession of assets. Only respondents missing on both items were deleted from the analyses. For all other respondents, the sum scale of the two items was divided by the number of valid responses (i.e. 1 or 2). Marital status is coded in three categories: married or widowed, divorced, and single. The first category is the reference category. A further measure of household composition is whether or not the respondent has children. Those without children are the reference category. Furthermore, religion is measured by a dichotomous variable indicating whether the respondent is (0) religious or (1) not religious.
In addition to those structural characteristics that I expect to influence the potential gender gap in voting behaviour, I also include two socioeconomic control variables known to exert an influence on party preference. First, ethnicity is a dichotomous variable distinguishing respondents who consider themselves to be New Zealand European (Pākehā) from those who do not. Those who do not consider themselves to be New Zealand European, or in other words who do not identify with the majority group in New Zealand, are the reference category. The second control variable is age, which is a continuous variable.
Below I also assess the impact of different issue positions on the gender gap in voting behaviour. In particular, I look at attitudes towards the welfare state, government responsibility, government regulation of companies or industries, and the presence of immigrants. 54 The first three relate directly to the government’s role in society and the organization and importance of the welfare state. As indicated in the theoretical section, women are expected to be more supportive of a stronger government role in society and the welfare state. Given that New Zealand is a country that receives significant numbers of migrants, and that migration policy is thus an important topic in the New Zealand context, I also include a measure on attitudes towards immigrants. Previous research on the gender gap in populist radical right-wing voting in Europe (with women being substantially less likely to support populist radical right-wing parties) has also suggested that opinions about the presence of immigrants may explain this gap (with women in general expected to be more positive towards immigrants than men). 55 And while New Zealand First does not fit the profile of most European radical right-wing parties, it can be classified as a populist party because of its focus on New Zealand’s own culture, economy and identity, making attitudes towards immigrants important to include in the current study. 56 Attitudes towards the welfare state are measured through six items: ‘with lower welfare benefits, people would learn to stand on their own two feet’, ‘unemployed people should have to work for their benefits’, ‘cutting welfare benefits would damage too many people’s lives’, ‘many people who get welfare benefits don’t really deserve any help’, ‘the creation of the welfare state is one of New Zealand’s proudest achievements’, and ‘welfare benefits make people lazy and dependent’ (Cronbach’s α = .806). Answering categories for each statement range between 1 (‘strongly agree’) and 5 (‘strongly disagree’). Some items were recoded so that the scale measures positive attitudes towards the welfare state. The indicator of attitudes towards government’s responsibility adds six items measuring whether respondents consider these issues to be a responsibility for the government: ‘a job for everyone who wants one’, ‘decent living standards for all old people’, ‘decent living standards for the unemployed’, ‘decent housing for those who can’t afford it’, ‘free health care for everyone’, and ‘free education from pre-school through to tertiary and university’ (Cronbach’s α = .792). The possible answers range from 1 (‘definitely should’) to 4 (‘definitely should not’). All answers have been reversed so that higher values refer to more support for government responsibility. The scale of attitudes towards government regulation of companies and industries combines support for ownership or regulation by the government of six companies or industries: Kiwibank, Air New Zealand, Kiwirail, TVNZ, New Zealand Post, and Mighty River, Meridian, Genesis (energy companies) (Cronbach’s α = .910). Possible responses are: 1 (‘fully own’), 2 (‘partly own’), 3 (‘not own but regulate’), or 4 (‘not own or regulate’). Answering categories have been recoded so that a higher value of the sum scale refers to more support for ownership. Finally, attitudes towards the presence of immigrants are measured through five items. The first asks ‘do you think the number of immigrants allowed into New Zealand nowadays should be …?’ Answering categories range between 1 (‘increased a lot’) and 5 (‘reduced a lot’). The other four items measure agreement or disagreement with the following statements: ‘New Zealand needs more people to grow its economy’, ‘a bigger New Zealand population would overstress our natural environment’, ‘New Zealand needs to import more skilled workers’, and ‘immigration threatens the uniqueness of our culture and society’. The possible answers range between 1 (‘strongly agree’) to 5 (‘strongly disagree’). Items have been recoded so that the scale refers to opposing increases in migrant intake (Cronbach’s α = .761). For all scales, respondents missing on three or more items were deleted. For all other respondents, the scales were divided by the total number of valid responses.
Descriptive statistics, broken down by gender, for all variables included in my analyses are available in the Appendix, Table A. For ease of comparability, all independent variables have been recoded to range between 0 and 1.
Analytic strategy
As mentioned before, the main aim of this study is to explore whether a gender gap in voting behaviour existed at the 2011 general election in New Zealand and to investigate to what extent socioeconomic characteristics and policy issue positions may influence potential gender gaps. To achieve this aim, three subsequent models, each adding new variables, will be presented. The first model only includes the effect of gender and describes the presence of a gender gap in New Zealand. The second adds the structural, socioeconomic characteristics. This model assesses to what extent gender differences in socioeconomic position can explain a possible gender gap in voting behaviour. The policy issue positions are introduced in the third and final models. These models look at the extent to which dissimilar issue positions between men and women impact a gap in their voting behaviour.
Given that the dependent variables are dichotomous variables, I performed binary logistic analyses.
Results
Gender models
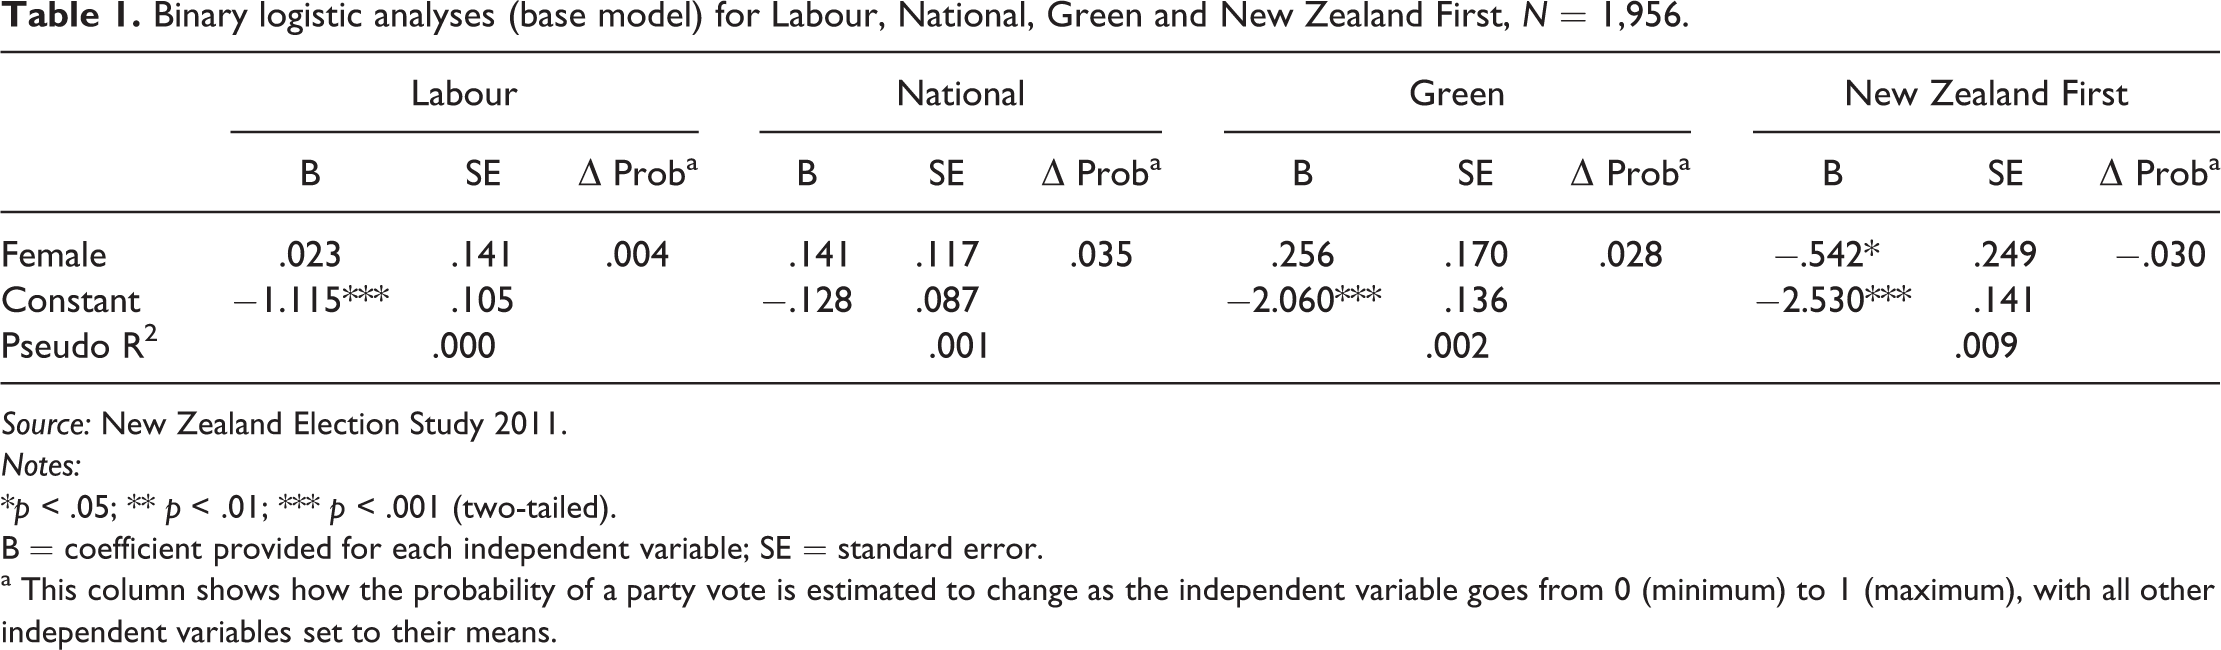
Starting with the base analyses (Table 1) only including the effect of gender, the results reveal only one substantial gender gap, namely in voting for New Zealand First, with men being substantially more likely to support New Zealand First than women. The probability of casting a vote for New Zealand First is 3.0 points lower for women than men. For all other New Zealand parties considered in this study, the effect of gender is not statistically significant. In other words, women and men seem to have voted to the same extent for Labour, National or the Green Party at the 2011 New Zealand general election.
Binary logistic analyses (base model) for Labour, National, Green and New Zealand First, N = 1,956.
Source: New Zealand Election Study 2011.
Notes:
*p < .05; ** p < .01; *** p < .001 (two-tailed).
B = coefficient provided for each independent variable; SE = standard error.
a This column shows how the probability of a party vote is estimated to change as the independent variable goes from 0 (minimum) to 1 (maximum), with all other independent variables set to their means.
Models including socioeconomic characteristics
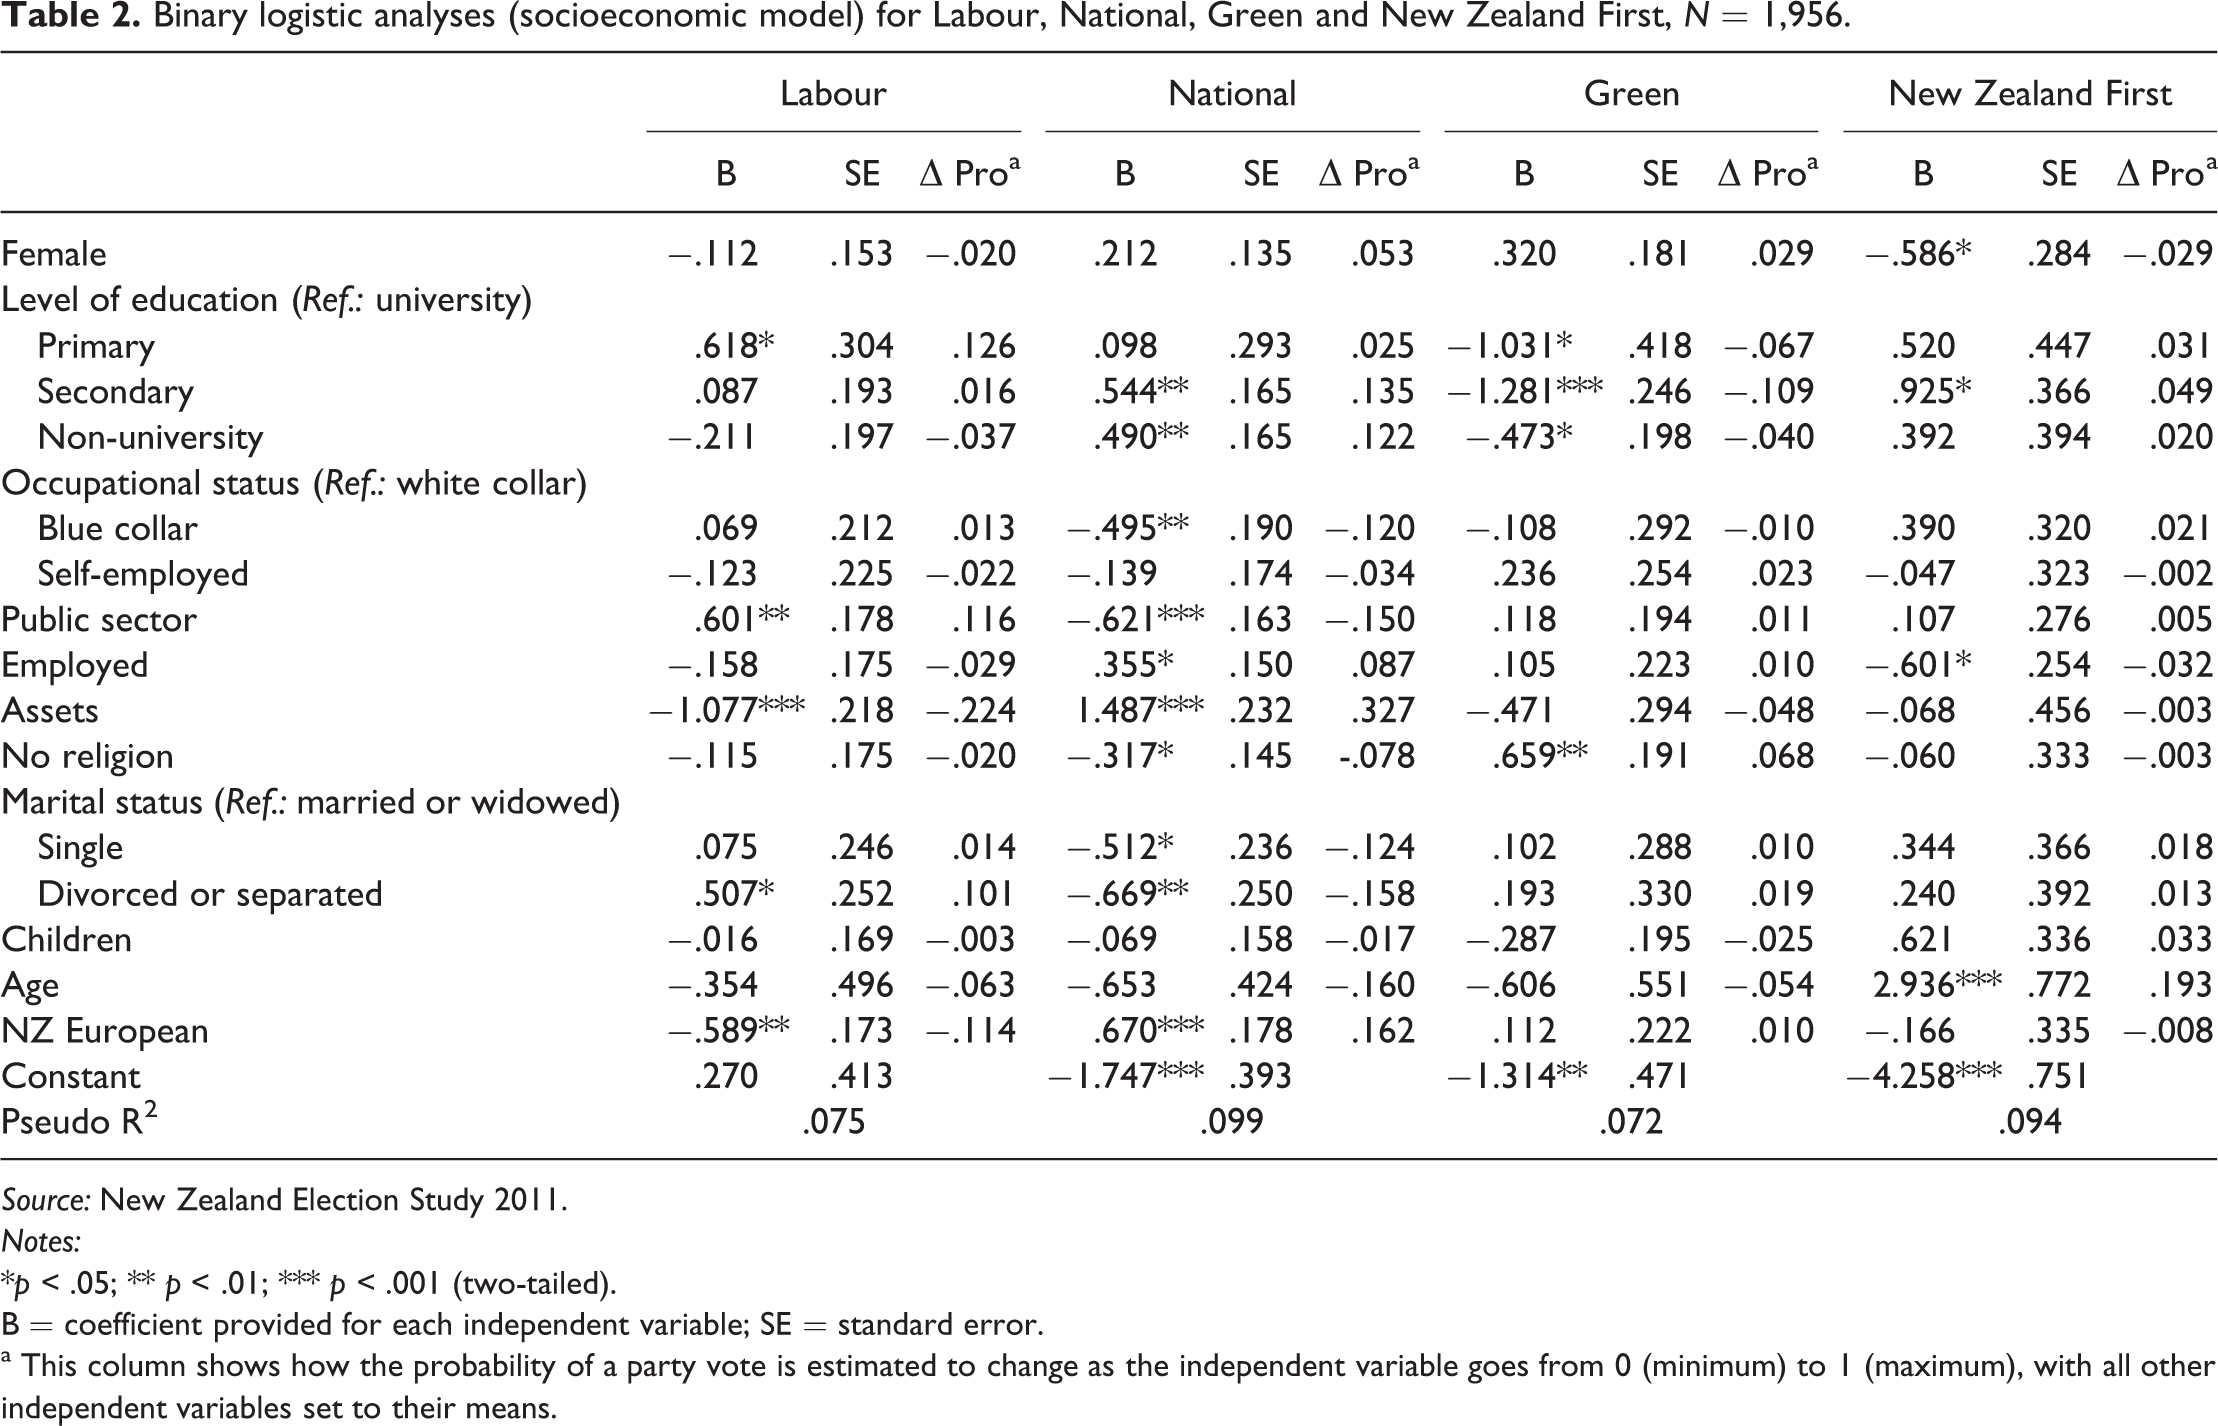
We now turn to the models including socioeconomic characteristics (Table 2), which aimed to explore the extent to which gender differences in socioeconomic position may explain a gender gap in voting behaviour. Since I only found a significant gender gap for New Zealand First, this aim obviously only holds for the gap found in relation to support for New Zealand First. I will, however, also present the models including the socioeconomic characteristics (and the subsequent models including policy issue positions) for the other parties included in my study. Despite not finding the kind of gender gaps that were anticipated, socioeconomic characteristics may still influence the extent and direction of the effect of gender (even though it was non-significant at the start) on party choice. The analyses indicate that the gender gap in voting for New Zealand First is robust and remains appreciable, even once gender differences in socioeconomic characteristics are taken into account (prob Δ = −.029). For all other parties, and similar to the bivariate analyses presented in Table 1, the effect of gender is not statistically significant.
Binary logistic analyses (socioeconomic model) for Labour, National, Green and New Zealand First, N = 1,956.
Source: New Zealand Election Study 2011.
Notes:
*p < .05; ** p < .01; *** p < .001 (two-tailed).
B = coefficient provided for each independent variable; SE = standard error.
a This column shows how the probability of a party vote is estimated to change as the independent variable goes from 0 (minimum) to 1 (maximum), with all other independent variables set to their means.
Before moving on to the models that include policy positions, it is worth noting that I explored whether the socioeconomic characteristics introduced in the models have the same effect for women and men. Although I only found limited gender variation in party choice, there may be a difference in what explains women’s and men’s voting decisions. Put differently, the socioeconomic characteristics that influence men’s and women’s party choice may differ. The analyses including interaction terms between gender and the socioeconomic characteristics only revealed two significant (p < .05) interaction terms. Possessing personal assets has a noticeably more negative effect among women than among men on the likelihood of voting for New Zealand First. Being single affects the likelihood of voting National more negatively among men than among women. None of the other interactions between being female and the socioeconomic characteristics were significant for any of the parties. Hence, not only are the gender gaps in voting behaviour small in New Zealand (as suggested in Table 2) women’s and men’s voting patterns can in general also be explained in similar ways.
Models including policy issue positions
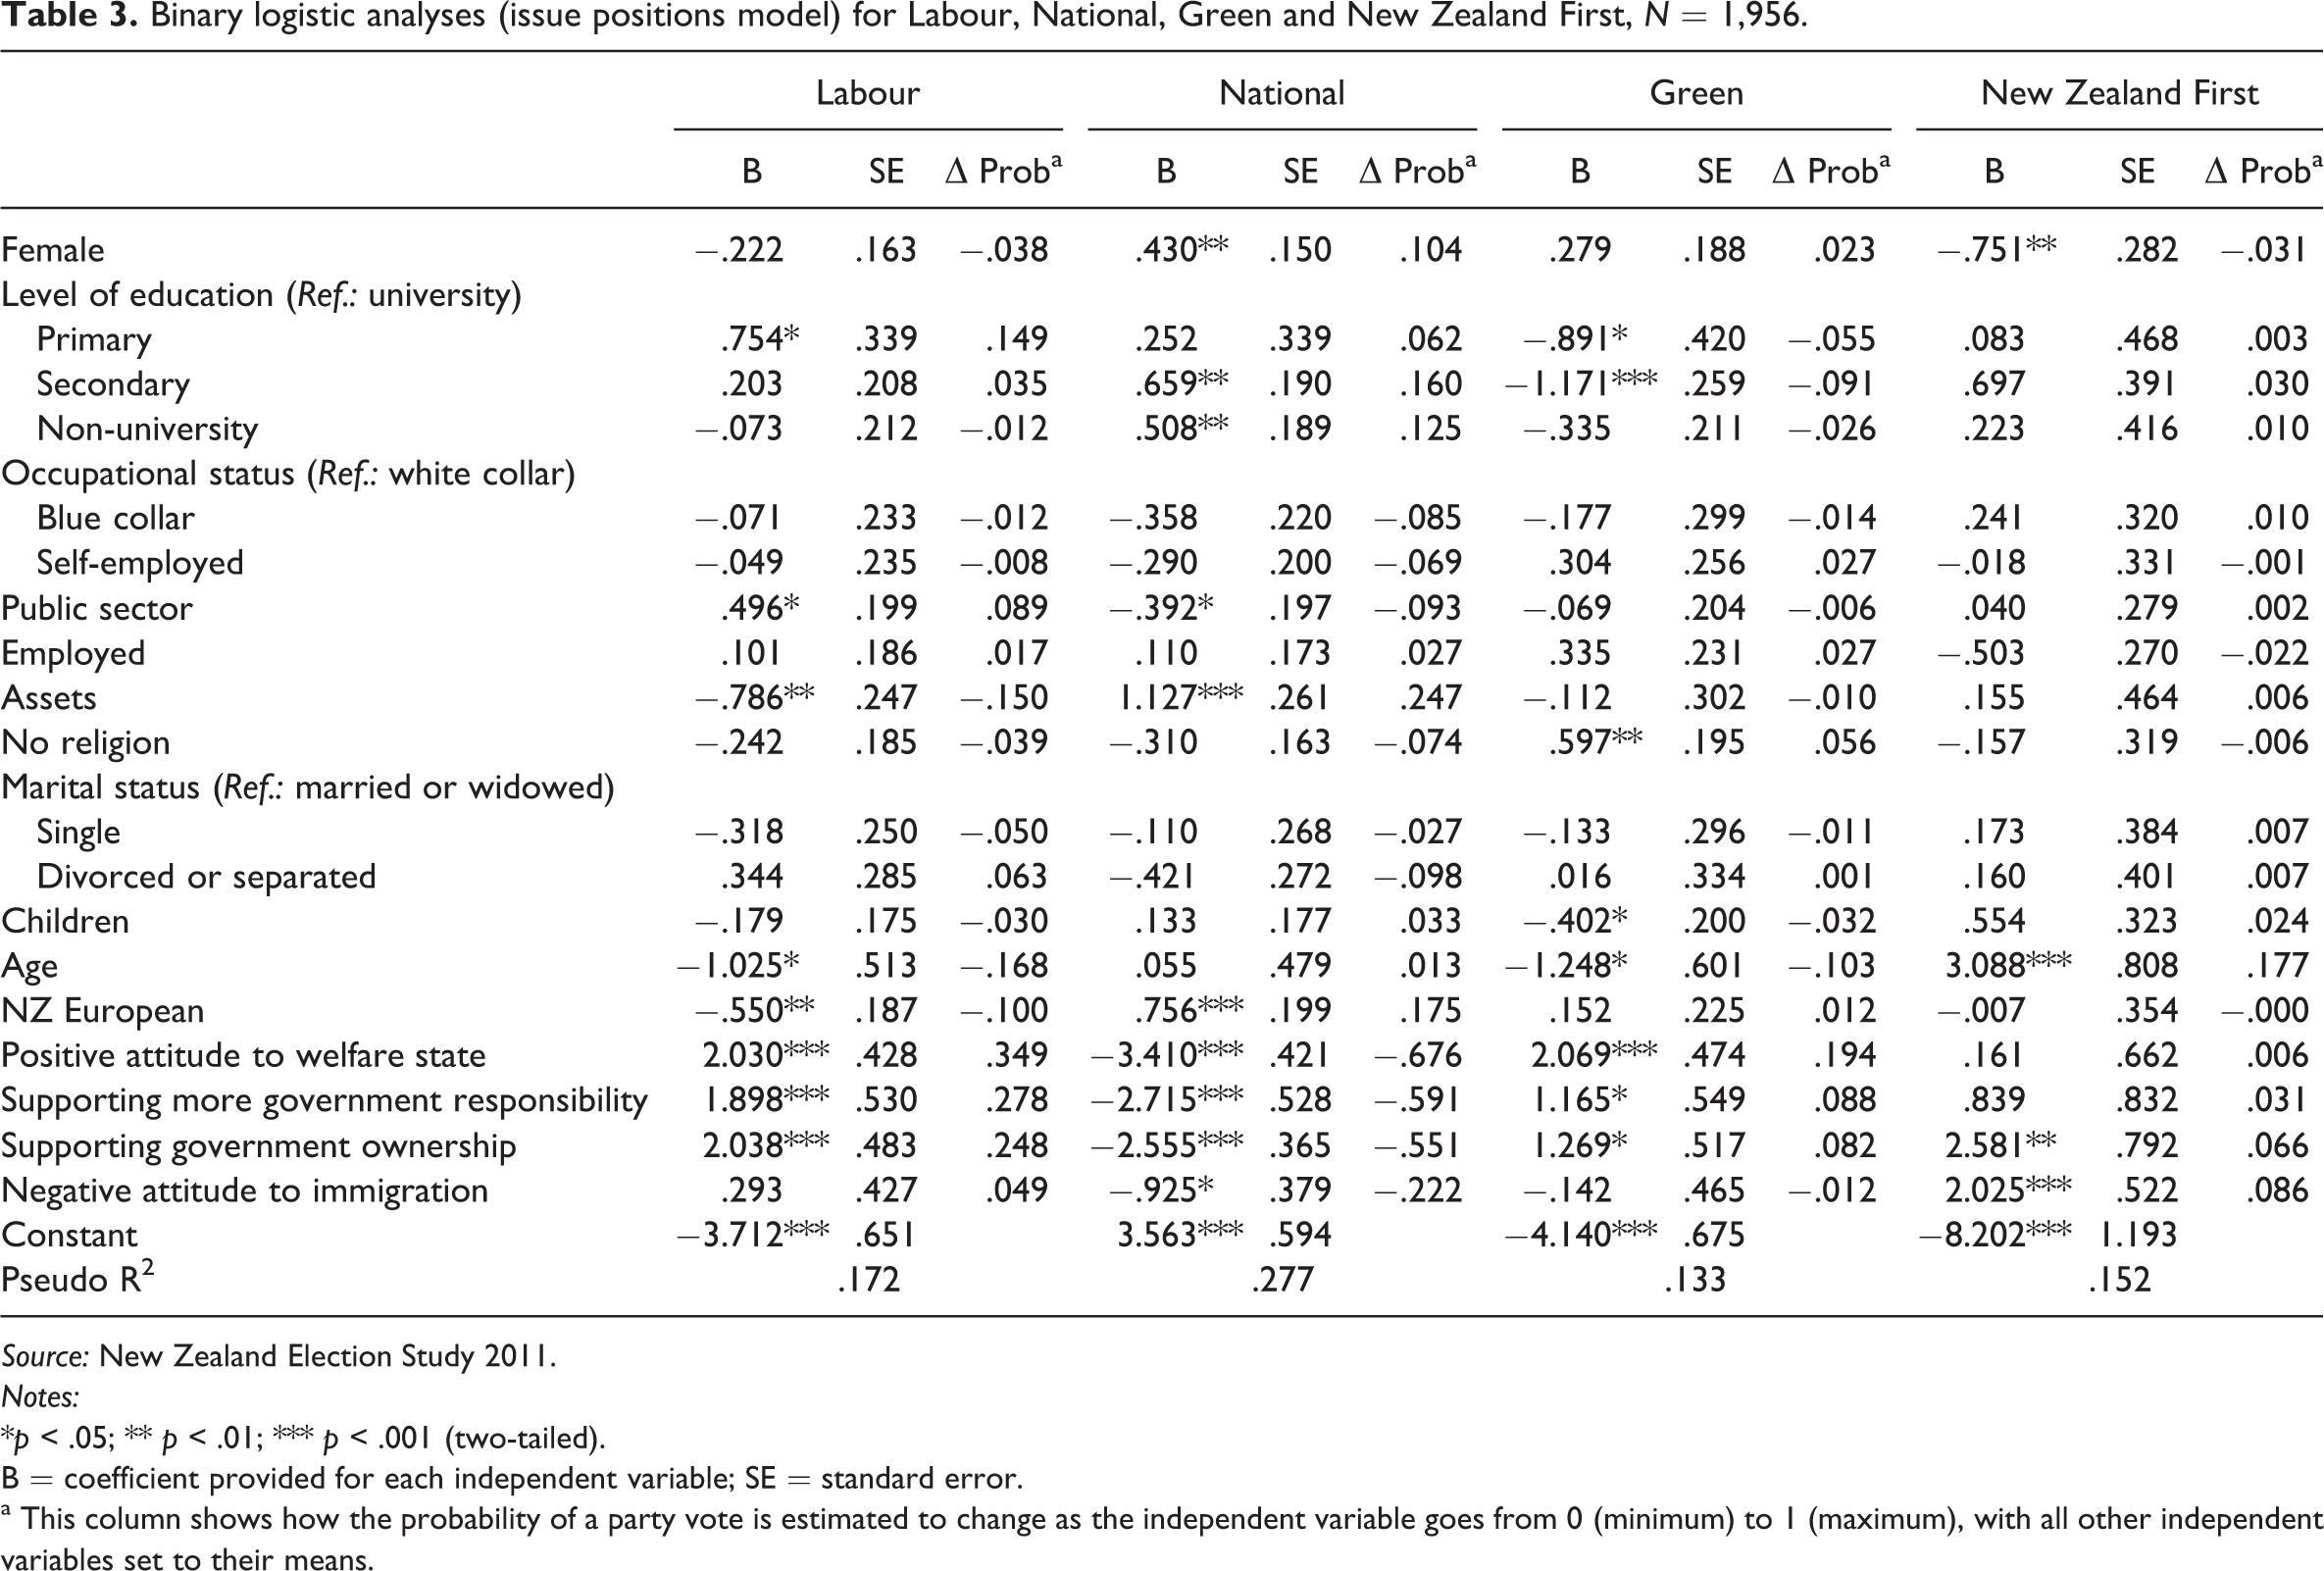
Turning to the models which include issue positions (Table 3), the analyses still demonstrate a significant effect of gender on support for New Zealand First. Thus even when gender differences in issue positions are considered, men are still more likely to vote for New Zealand First than women. Interestingly, a gender gap in voting for National becomes visible and significant once gender differences in policy positions are taken into account, with women being significantly more likely to vote for National than men (prob Δ = .104). In other words, if men were as supportive of more government responsibility, the welfare state and the government owning companies as women, and were less supportive of the presence of immigrants, they would be significantly less likely to support National than women.
Binary logistic analyses (issue positions model) for Labour, National, Green and New Zealand First, N = 1,956.
Source: New Zealand Election Study 2011.
Notes:
*p < .05; ** p < .01; *** p < .001 (two-tailed).
B = coefficient provided for each independent variable; SE = standard error.
a This column shows how the probability of a party vote is estimated to change as the independent variable goes from 0 (minimum) to 1 (maximum), with all other independent variables set to their means.
As for the socioeconomic characteristics, I investigated whether the effects of political attitudes on voting behaviour were similar between women and men. Models including gender interaction terms can be easily summarized: none of the interactions are significant. In other words, the motives for voting for a party seem to be similar between women and men.
An additional model for voting National
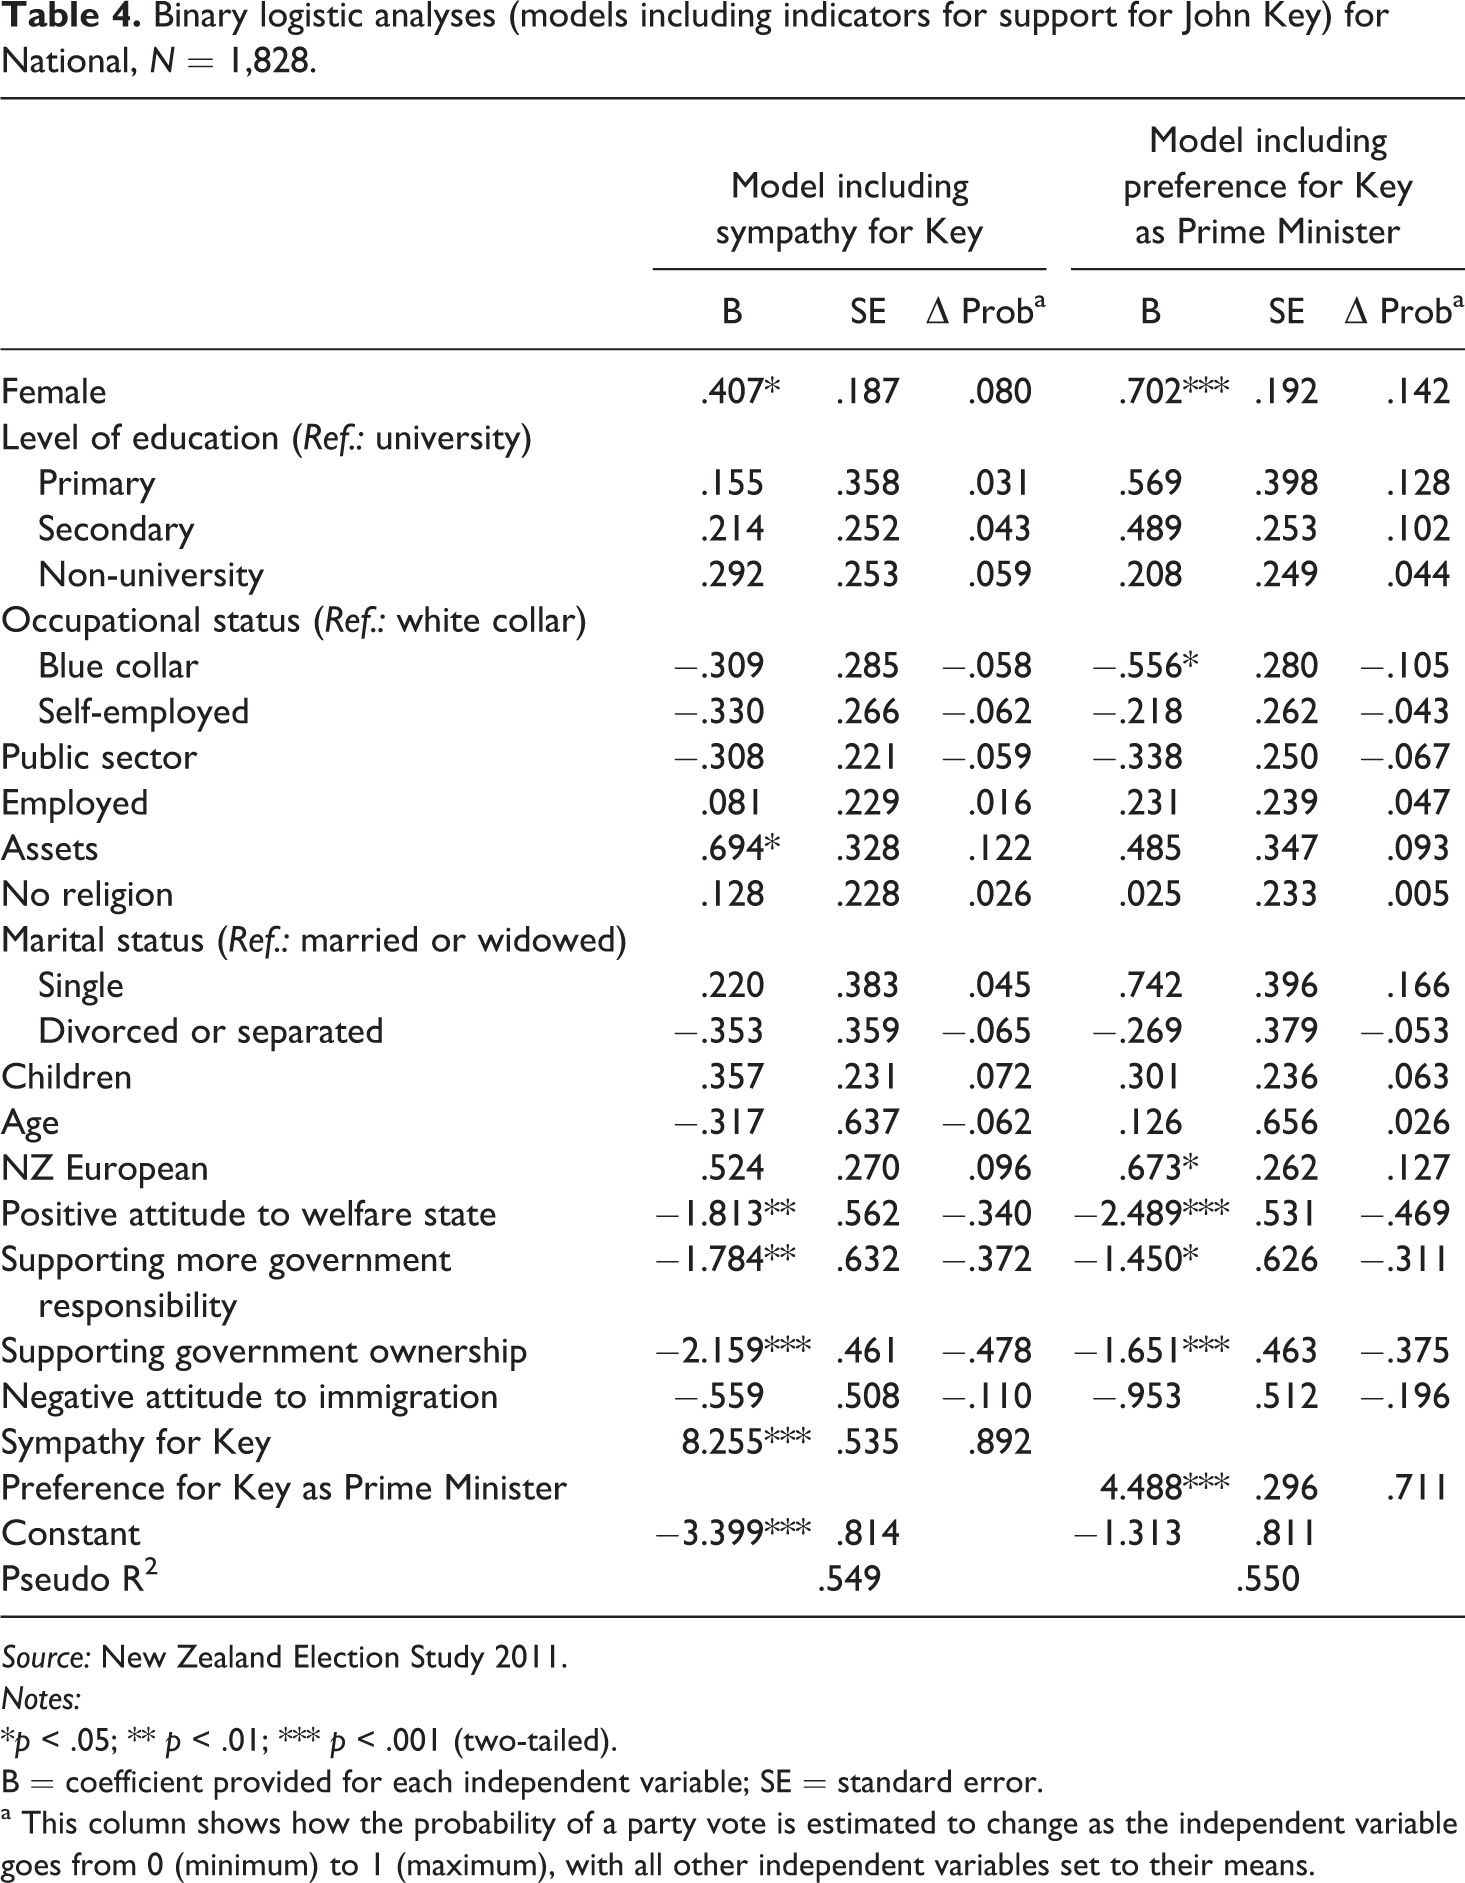
Before summarizing the main findings of the analyses in the concluding section, I take my analyses for voting National one step further, as the previous model left us with a fascinating puzzle. In particular, if women and men were to take similar positions related to the role of the government, the welfare state and migration, women would be more inclined to vote National than men. This leaves us with the question: Why would women be more likely to support National than men if they held similar stances on salient policy issues? The literature on the personalization of politics and political leadership suggests a potential explanation which is worth exploring: support and sympathy for the party leader. This literature (including studies on New Zealand) advocates and confirms empirically a substantial impact of the party leader and candidate preference on party choice. 57 As discussed above, some scholars 58 have suggested that voters were generally satisfied with the performance of the National leader John Key during his first term, but we do not know whether there is a gender difference in this support. Yet if women were more supportive of Key than men, this could potentially explain why they would be more inclined to prefer National than men once policy issue positions are taken into account. In that case, the effect of being female would again become insignificant once support for Key is introduced. To investigate a potential Key effect on the gender gap that occurred for voting National after policy issue positions were taken into account, I ran two additional analyses (Table 4): one including to what extent respondents like John Key (on a scale from 0 (‘strongly dislike’) to 10 (‘strongly like’)), and one including a dummy variable measuring John Key as the preferred Prime Minister. 59
Binary logistic analyses (models including indicators for support for John Key) for National, N = 1,828.
Source: New Zealand Election Study 2011.
Notes:
*p < .05; ** p < .01; *** p < .001 (two-tailed).
B = coefficient provided for each independent variable; SE = standard error.
a This column shows how the probability of a party vote is estimated to change as the independent variable goes from 0 (minimum) to 1 (maximum), with all other independent variables set to their means.
As can be seen from Table 4, 60 support for Key and a preference for Key as next Prime Minister have a massive positive effect on voting National. However, they do not affect the influence of being female and voting National. The negative effect of being female on the likelihood of voting National remains appreciable even when sympathy for Key or a preference for Key as next Prime Minister is controlled for. Hence, support for Key cannot explain the gender gap that occurs once the policy issue positions are taken into account. On the contrary, there is a minor increase in the magnitude of the effect of gender on voting National once a preference for Key as Prime Minister is taken into account. In other words, if women and men preferred Key as Prime Minister to the same extent, women would be even more likely to support National than men. Hence the driver of women’s greater tendency to vote National than men, if men and women held similar policy positions, does not seem to be women’s higher preference for Key.
Finally, I ran analyses including interaction terms between being female and sympathy for Key and a preference for Key as Prime Minister to examine whether the impact of the variables referring to support for Key on voting National is similar for women and men. The interactions were not significant, indicating that support for Key predicts voting National similarly among men and women.
Conclusion
The aim of this study was to look at the 2011 New Zealand general election using a gendered lens to discover whether a modern gender gap as found in different post-industrial societies is also present in the current New Zealand political context. Overall, the analyses suggest limited gender differences in party choice. Furthermore, my analyses revealed that the explanations for party preferences were similar for men and women. In other words, the same motives account for women’s and men’s party choice. The most consistent finding is the gender gap in support for New Zealand First. The party’s support base contains substantially more men than women, and this preponderance of New Zealand First voting among men is robust and cannot be explained by gender differences in socioeconomic characteristics and related issue positions. For the two major parties Labour and National, as well as for the Green Party, no significant gender differences in voting patterns were found. Yet if women and men were to take similar positions related to the role of the government, the welfare state and migration, women would be more inclined to vote National than men. This gap cannot be explained by differences in sympathy and support for National’s leader John Key.
In sum, then, whereas women were found to be more likely to vote for left-wing parties in a variety of post-modern societies, this modern gender gap is not visible when studying the 2011 New Zealand general election. Men and women chose and behaved in mostly similar ways. This finding obviously calls for longitudinal research. Is this finding characteristic only of the 2011 election or can it be generalized to previous (and future) elections in New Zealand? Despite the economy being the major focus of the election campaign, and considering that men and women generally take different positions on economic issues, it does not seem to have resulted in a move among women towards the left. In fact, if such gender differences in issue positions did not exist, women would actually be more inclined to vote National than men. Then again, while there were substantial differences between Labour’s and National’s policy positions during the campaign, and even though it obviously put its right-wing mark on its first government, National did continue a number of policies introduced by Labour during its first term. 61 Previous research suggests that women are more likely to support left-leaning parties in a more conservative political climate. 62
The 2011 general election and lack of clear gender pattern in voting behaviour seem, however, not to be exceptional in the New Zealand context and confirm the existing empirical research on electoral behaviour. 63 This suggests that New Zealand may not (yet) follow the pattern of a move towards a modern gender gap. One exception to the general pattern of limited gender differences in partisanship in New Zealand seems to be the 1996 election, when women were appreciably more likely to support Labour than men. At that election, for the first time in its history, Labour was led by a woman, 64 Helen Clark, and a substantial gender gap, with women being more likely to favour Labour, came about because of greater support among women for a female leader. 65 Similarly, whereas no clear pattern of a modern gender gap in voting behaviour had occurred in Australia before the 2010 elections, Tranter found that Australian women were considerably more likely to vote for the Labour Party at the 2010 federal elections because they were substantially more likely to ‘like’ Julia Gillard compared to their male counterparts. 66 During the 2011 New Zealand campaign, only the Green Party had a female co-leader, which does not seem to have resulted in a greater likelihood of women supporting the Greens.
To conclude, while I found limited evidence for a clear gendered pattern in voting behaviour at the 2011 New Zealand elections, gender gaps in voting behaviour are not static. Investigating gender differences in voting behaviour and possible changes therein is an issue that needs continuous attention, given its implications for electoral outcomes and thus policymaking.
Footnotes
Acknowledgements
The author wishes to thank the Board of the New Zealand Election Study (NZES) for offering the data. She is also grateful to Kate McMillan for her editorial help and the reviewers for their valuable feedback and suggestions.
Appendix
Means and standard deviations for all variables; men N = 902; women N = 1,054.
| Range | Men | Women | Signa | |||
|---|---|---|---|---|---|---|
| Mean | SD | Mean | SD | |||
| Dependent variables | ||||||
| Labour | 0/1 | .247 | .431 | .251 | .434 | |
| National | 0/1 | .468 | .499 | .503 | .500 | |
| Green | 0/1 | .113 | .317 | .141 | .349 | |
| New Zealand First | 0/1 | .074 | .262 | .044 | .206 | * |
| Independent variablesb | ||||||
| Level of education (Ref.: university) | ||||||
| Primary | 0/1 | .173 | .378 | .120 | .324 | |
| Secondary | 0/1 | .314 | .465 | .340 | .474 | |
| Non-university | 0/1 | .298 | .458 | .293 | .455 | |
| Occupational status (Ref.: white collar) | ||||||
| Blue collar | 0/1 | .264 | .441 | .132 | .338 | *** |
| Self-employed | 0/1 | .206 | .405 | .132 | .339 | *** |
| Public sector | 0/1 | .185 | .388 | .274 | .446 | *** |
| Employed | 0/1 | .750 | .433 | .658 | .475 | *** |
| Assets | 0-1 | .821 | .318 | .772 | .358 | * |
| No religion | 0/1 | .370 | .490 | .291 | .454 | *** |
| Marital status (Ref.: Married or widowed) | ||||||
| Single | 0/1 | .174 | .379 | .148 | .355 | |
| Divorced or separated | 0/1 | .054 | .226 | .089 | .285 | * |
| Children | 0/1 | .343 | .475 | .417 | .493 | * |
| Age | 0-1 | .405 | .215 | .391 | .207 | |
| NZ European | 0/1 | .838 | .368 | .829 | .377 | |
| Positive attitude to welfare state | 0-1 | .437 | .209 | .448 | .222 | |
| Supporting more government responsibility | 0-1 | .602 | .180 | .635 | .179 | ** |
| Supporting government ownership | 0-1 | .759 | .226 | .774 | .236 | |
| Negative attitude to immigration | 0-1 | .507 | .206 | .543 | .204 | ** |
| Sympathy for Keyc | 0-1 | .637 | .327 | .625 | .484 | |
| Preference for Key as Prime Ministerc | 0/1 | .648 | .351 | .602 | .490 | |
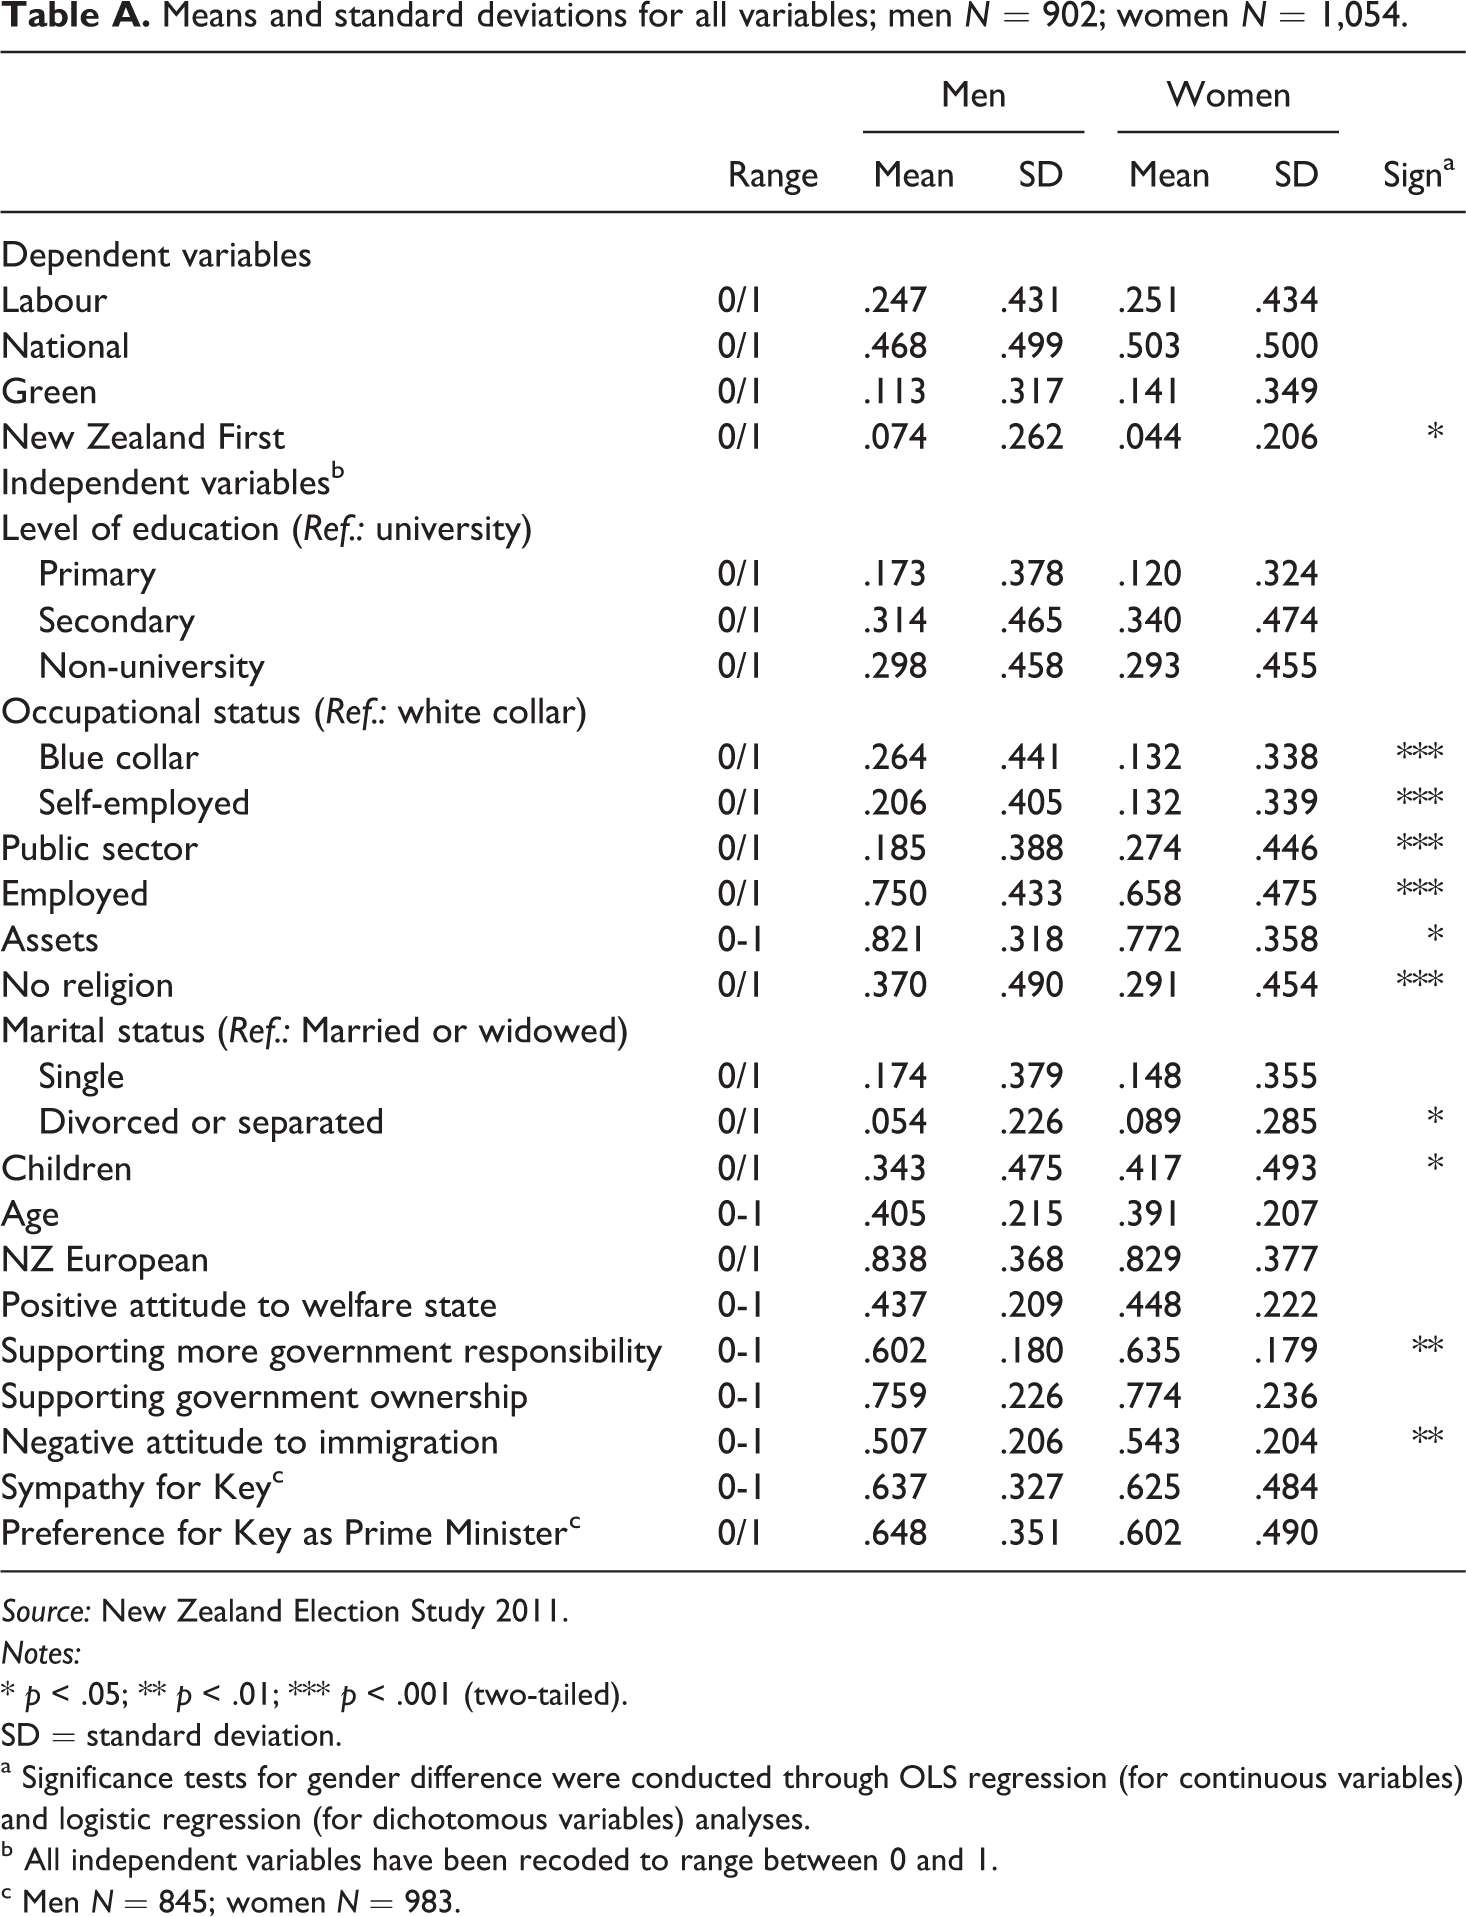
Source: New Zealand Election Study 2011.
Notes:
* p < .05; ** p < .01; *** p < .001 (two-tailed).
SD = standard deviation.
a Significance tests for gender difference were conducted through OLS regression (for continuous variables) and logistic regression (for dichotomous variables) analyses.
b All independent variables have been recoded to range between 0 and 1.
c Men N = 845; women N = 983.