
Abstract
Understanding when and why social cleavages shape electoral behaviour is a central concern in the study of democratic politics. While many accounts emphasise the long-term social changes, others point to the role of party strategy. We contribute to this debate by analysing the political evolution of one of the central cleavages of the twentieth century—class—in one of the world’s longest-standing democracies—Britain. Analysing a unique new dataset combining constituency-level results across 37 general elections from 1885 to 2024 with data from eight censuses, applying geospatial redistricting methods, we describe the rise, stability and eventual decline of class-based voting, showing that a strong class cleavage emerged in the early twentieth century, remained stable for decades, but then unravelled rapidly after the 1990s. These patterns are difficult to reconcile with theories that emphasise gradual social change and are more consistent with accounts that stress political agency and representation.
Introduction
In recent decades, the electoral foundations of Western democracy have begun to shift. New divides or ‘cleavages’, articulated by differences in education (Hooghe and Marks, 2025; Stubager, 2013), ethnic diversity (Bird et al., 2010; Heath et al., 2011) and geographic location (Rodden, 2019; Taylor et al., 2023) have transformed the landscape of party competition (Ford and Jennings, 2020). The importance of older cleavages, such as class, may have waned, but their legacy for both electoral politics and our understanding of political cleavages endures. The ways in which class structured political choice in the past offers vital clues about how new cleavages take root, endure and unravel.
In this article, we advance our understanding of how social cleavages evolve by examining a paradigmatic case: the relationship between class and voting in Great Britain, traced across an unprecedented span of 37 general elections from 1885 to 2024, covering all constituencies. Britain has long been seen as the archetypal class society—a place where class stood at the centre of electoral behaviour (Butler and Stokes, 1969), where its impact on voting was unusually pronounced compared with other countries (Weakliem and Heath, 1999), and where, as Pulzer (1967: 98) put it, ‘all else [was] embellishment and detail’. Much of what we know about class and voting, both in Britain and elsewhere, begins with the advent of survey research in the mid-twentieth century, while the first census to report socio-economic data by constituency was 1966. We know relatively little about the electoral importance of class in earlier elections, when turnout was higher, most voters were newly enfranchised and the partisan loyalties that would shape twentieth century politics were just emerging. 1 Using a unique and newly collected dataset of census statistics re-mapped on to parliamentary constituency election results, we extend analysis of class voting in Britain by more than half a century, to three decades before the era of mass enfranchisement.
Our empirical contribution lies in tracing class voting over a far longer period than has previously been possible. We chart its rise and fall from competition between the Liberals and Conservatives in the late Victorian and Edwardian eras, through the establishment of the Labour party in 1900 and the extension of the franchise in 1918, to the loss of historical Labour strongholds in 2019 and Labour’s return to power in 2024. Our aim is not to offer a causal account of the rise and fall of class voting, but to provide rich, historically grounded description—mapping previously uncharted territory (Gerring, 2012) and paying close attention to the timing of changes (Pierson, 2000). In doing so, we add to a growing literature which re-examines the long-term evolution of political cleavages and electoral alignments, bringing new methods to historical data (e.g. Armstrong et al., 2021; Caramani et al., 2024; Caughey et al., 2020; Taylor et al., 2023).
Our analysis yields three main findings. First, while there is some evidence of class voting between Liberals and Conservatives in the late Victorian era, this collapsed in the early twentieth century, replaced by a rapidly emerging class divide between Labour and the Conservatives—one that crystallised within two general elections of mass enfranchisement in 1918. Second, once established, this class cleavage remained remarkably stable, showing little deviation from the 1920s to the 1990s. Third, we show that the dissolution of the class cleavage is a relatively recent—and abrupt—phenomenon, unfolding almost entirely during and after the New Labour period. The working class–Labour link began to erode in the 1990s, and then the Conservative-middle class link weakened in the wake of the 2016 Brexit referendum. Despite Labour’s return to government in 2024—and the Conservatives’ electoral collapse—there is little evidence that these long-run trends have reversed.
These findings have important implications for our understanding of cleavage politics more broadly. For nearly as long as class voting has been studied, scholars have debated whether it has been in decline. As early as the 1970s, Crewe et al. (1977: 183) suggested that the class basis of party support was diminishing and could ‘wither away’. During much of the 1980s and 1990s, the debate about class dealignment raged on, with each new election offering a potentially critical case to assess whether changes since the 1960s best represented a gradual decline of class voting or ‘trendless fluctuation’ (Crewe, 1986; Evans, 2000; Franklin, 1985; Heath et al., 1985, 1991; Van der Eijk et al., 1992).
Today, few doubt that class voting has weakened. But disagreement remains about when and why this decline occurred (Evans and Tilley, 2012, 2017; Heath, 2015; Thau, 2021). These issues have attracted renewed attention in the wake of Brexit. Labour’s loss of many long-standing working-class strongholds to the Conservatives in 2019 revived interest in the social bases of party support and whether or not there was a class realignment (Cutts et al., 2020; Fieldhouse et al., 2023; Jennings and Stoker, 2017). Central to many of these debates is whether the dissolution of the class cleavage reflects a gradual, secular dealignment, underpinned by gradual processes of social change; or whether it marks a more sudden, abrupt critical juncture, brought about by the actions of political parties.
By taking a genuinely long-term perspective, we are able to situate contemporary realignments within more than a century of social and political change—providing a historical baseline against which current patterns of dealignment can be better understood. Descriptive evidence not only enriches our understanding of what happened; it can also help adjudicate between competing explanations of why things happened the way they did (Spirling and Stewart, 2024).
A prominent line of argument for the decline of class voting holds that class divisions themselves have eroded—that boundaries between classes have become increasingly fluid (Beck, 1992; Clark and Lipset, 1991; Clarke et al., 2004). According to this view, changes within the electorate over the past 50 years—including deindustrialisation, rising living standards and the spread of affluence—have weakened traditional group identities and encouraged a more individualistic, less class-bound electorate (Beck, 1992, 2007; Beck and Beck-Gernsheim, 2002; Dalton, 2019; Franklin et al., 1992; Thomassen, 2005). As such class is no longer thought a salient feature of modern societies, and if not ‘dead’, as argued by Clark and Lipset (1991), lives on as a ‘zombie’ without any real meaning (Beck and Beck-Gernsheim, 2002). 2 According to this individualisation thesis, as the social relevance of class has withered, so too has its political expression. Social classes are no longer politically divided, because the social conflict that underpinned these divisions have been successfully resolved (Van der Eijk et al., 1992: 423). Importantly, this implies a process of gradual change. Individualisation processes do not manifest overnight, they happen gradually over decades rather than years, partly as the result of generational replacement (Stubager et al., 2026). In the words of Beck (1992: 99), ‘The end of class society is not some big revolutionary bang. It consists of a relentlessly progressing and collectively experienced process of individualization and atomization in post-traditional societies’.
Our findings offer strong counterevidence to this interpretation. The timing of the decline of class voting is difficult to reconcile with a slow, incremental process of social change. Theories that emphasise long-term social change struggle to account for the remarkable persistence of the class cleavage in British elections across much of the twentieth century. By contrast, our results align more closely with accounts that foreground political agency—highlighting the role of parties in maintaining or reshaping cleavages through symbolic, descriptive and substantive representation (Carnes and Lupu, 2016; Evans and Tilley, 2017; Heath, 2015; Robison et al., 2020; Thau, 2021). Our results indicate that the working class–Labour link only began to erode in the 1990s, during a time when Tony Blair’s Third Way centrism led to a radical rebrand of the party as New Labour. In a bid to modernise the party’s image and appeal to the expanding middle-class, Labour moved to the right on issues that traditionally divided the classes (Evans and Tilley, 2012, 2017), broke links with trade unions (Fouirnaies, 2026), selected middle class rather than working-class candidates (Heath, 2016) and actively de-emphasised class rhetoric, appealing more to business than workers (Thau, 2019). In this view, the endurance and eventual unravelling of class voting is less a reflection of social structure than of how class was politically mobilised, represented and contested.
The article proceeds as follows. We begin by introducing our new dataset, which links historical census measures of social class to constituency-level election results across 37 general elections. We then trace the evolving relationship between class and vote from the late Victorian era to the present, highlighting key phases of alignment and realignment. In the third section, we employ a changepoint modelling strategy to identify when significant shifts in the class–vote relationship occurred. We conclude by reflecting on the implications of our findings for the study of social cleavages and electoral change.
Data and measures
In order to examine trends in class voting, we combine constituency-level election results and socio-economic statistics from the census for 37 general elections over a period of 139 years, from 1885 to 2024. Since both administrative boundaries and electoral boundaries have changed over time, we derive our pre-1966 constituency level estimates using two alternative redistricting methodologies, vector overlay and via composition tables (see Supplemental Online Appendix A1 for more details). Table 1 summarises which censuses and approach are used for each election. In the period covered by our study, there have been seven main changes to constituency geography, the last of which occurred in 2024, giving us eight distinct periods over which constituency boundaries remained constant. For each set of stable boundaries, the most relevant census is matched to the entire constituency geography, so, for example, the 1931 census data is used for all general elections from 1918 to 1935, and additionally in 1945 with a variant form of the geography. Given that class structures change relatively slowly, this approach helps to ensure as much consistency as possible between elections.
Census data sources and general elections covered.
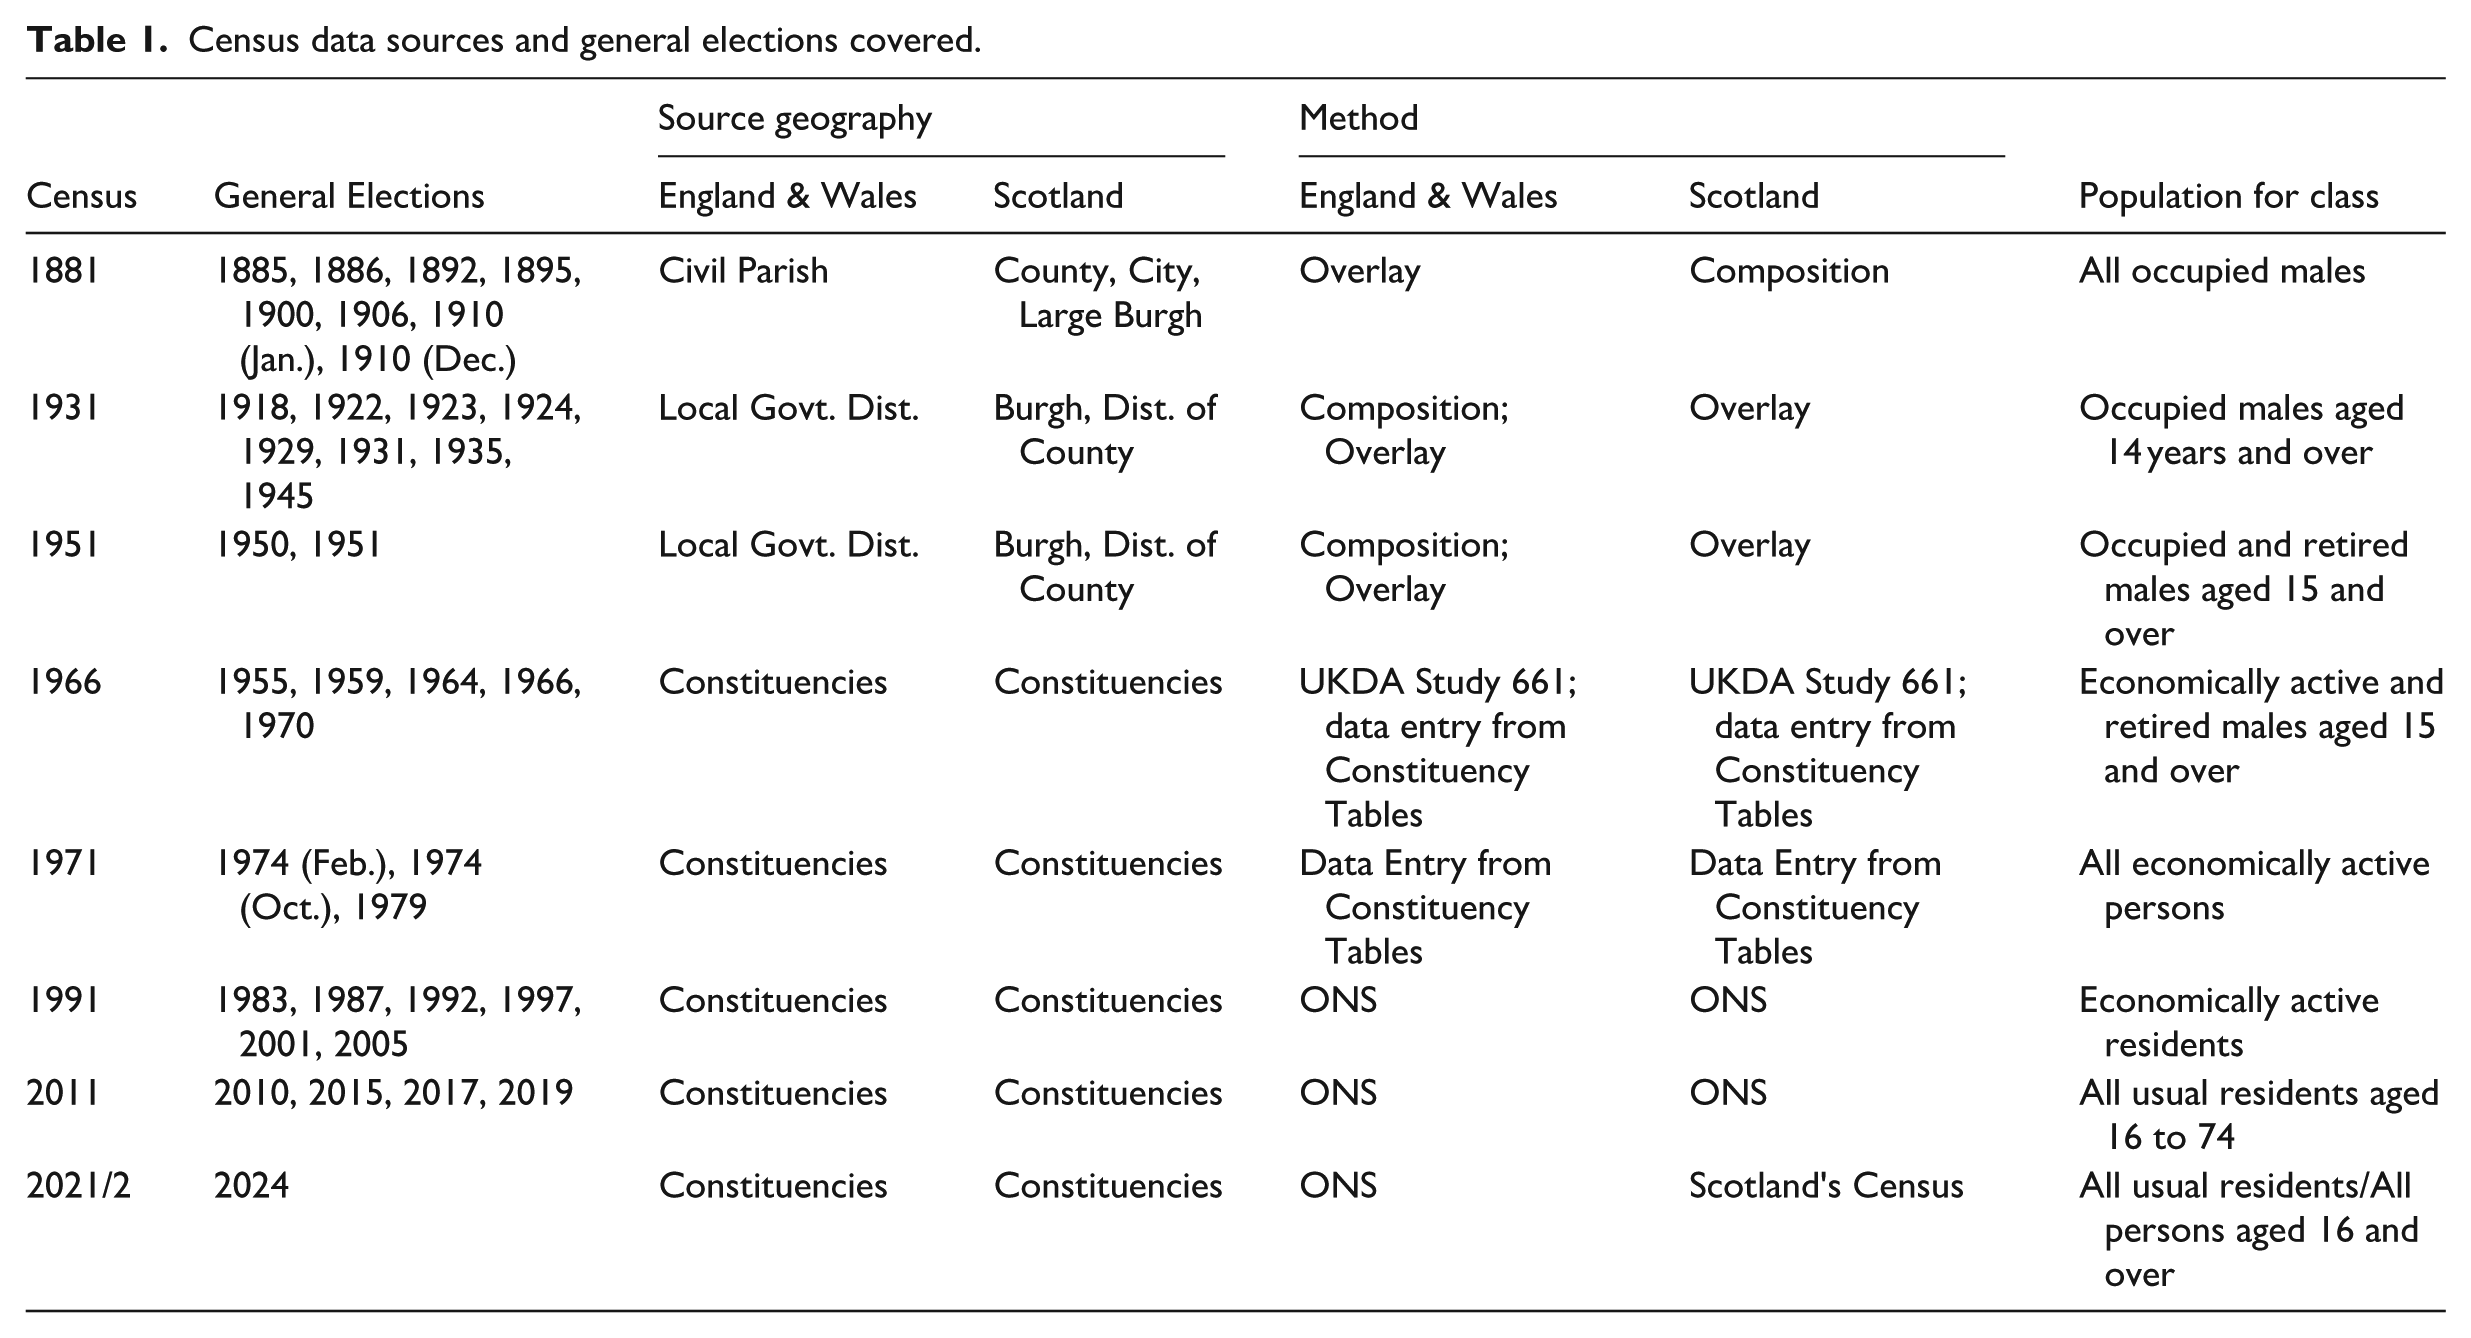
For the general elections between 1955 and 2024, we use published census statistics for electoral constituencies. For 1983 onwards, these constituency profiles come from the census office online systems. However, these are not available for earlier periods. We therefore rely on the printed reports from the 1966 and 1971 census, which include volumes of Constituency Tables. We computerised selected tables from the 1966 and 1971 reports, and drew on previously computerised tables from the 1966 reports (Crewe 1977).
For earlier years, such constituency tables were not produced. Instead, we work with census data assembled into the Great Britain Historical GIS (GBHGIS), which has computerised much data from the published census reports between 1801 and 1971, and created digital boundaries for the main census reporting geographies, including for the circa 16,000 parishes, and for parliamentary constituencies (Southall, 2011, 2012, 2014). We use the 1881 census to derive socio-economic constituency profiles for general elections between 1885 and 1910.
For England and Wales in 1881 the census did not provide information on constituency composition. To solve this problem, we draw on a large parish-level dataset, created from the transcription of individual responses by the Genealogical Society of Utah. The dataset was created by cross-tabulating occupations by age by sex by parish, and comprises circa 3.6 million non-zero counts. We use previously created digital boundary datasets for both the 14,897 civil parishes of 1881 and the 468 constituencies of 1885; the former mainly from the Ordnance Survey’s Diagrams of Sanitary Districts (1888) at 4 miles to 1-in. scale and later County Administrative Diagrams at 2 miles to 1-in., the latter from the maps in the reports of the 1885 Parliamentary Boundary Commission. These digital boundary datasets describe each geography as sets of vectors, and by overlaying the post-1885 constituency boundaries on the 1881 parish boundaries, within a geospatial database, we compute what fraction of each parish’s area lies in each constituency, and then use these fractions to redistrict the census data to the constituencies. 3
For Scotland, the 1881 census published detailed occupational statistics, which we use to measure the class structure. The 1901 Scottish census also published tables listing the exact composition of the 69 post-1885 constituencies in terms of parts of counties and Parliamentary Burghs, providing the population of each component area in both 1891 and 1901. From these tables we construct a composition table to reassign data from each census reporting unit to constituencies exactly pro rata to their 1891 populations. 4
Next, we use the 1931 and 1951 censuses to derive socio-economic constituency profiles for elections held using the 1918–1945 boundaries, and 1950 and 1951 boundaries, respectively. 5 For England and Wales, the censuses published composition tables which list the administrative components of each constituency: which at one extreme comprise whole counties, as for Westmorland in 1931; and at the other extreme comprise parts of parishes or wards. However, unlike Scotland for 1881, these tables do not include population counts. We therefore supplement this data with the GBHGIS transcriptions of the 1931 and 1951 parish-level tables, which include population counts for each parish. With this information, we reallocate census counts for socio-economic variables from local government districts to constituencies using three different methods:
Where the whole of a local government district fell into a single constituency, the socio-economic counts are directly assigned.
Where a district was sub-divided, but the whole of a parish fell into a single constituency, the district counts are assigned to parishes pro rata to population, and these parish estimates are assigned to the relevant constituency.
Where a parish was sub-divided, we use our digital boundary data for both parishes and constituencies to apportion the parish estimates to the relevant constituencies by vector overlay, that is, pro rata to area.
For Scotland, a somewhat different method was used, as parish boundaries were unrelated to burghs, but from 1930 onwards rural Scotland was divided into Districts of County which, together with Large and Small Burghs, formed a geography of about 400 units, which had already been digitally mapped for 1931 and 1951. The socio-economic variables were reallocated to them from counties and Large Burghs pro rata to population, and then all the data were redistricted from the burghs and districts using vector overlay.
Having derived the socio-economic constituency profiles, we link these data with constituency-level election results. Electoral data comes from three main sources. Data for the 1885–1970 elections are taken from three volumes compiled by Craig (1974, 1977, 1983). Data for the 1971–1992 elections are taken from Kimber (2018). Finally, data for the 1997–2024 elections data come from either the Electoral Commission or the House of Commons Library websites. The combined dataset contains information on the results for 22,108 constituencies across 37 general elections from 1885 to 2024 (see Supplemental Online Appendix A3 for further discussion of these data).
Occupational class
Our main independent variable is occupational class. Britain’s economy, society and labour market has changed dramatically over the past 150 years, and as a result, so too have the questions asked in the censuses. While every census since 1841 has gathered data on how people made their living, how it has been collected and coded has changed substantially. The first official attempts to devise an occupational class schema were for research into mortality, which first appeared in the Registrar-General’s (RG’s) Annual Report for 1911 (Szreter, 1984). This distinguished between five occupational classes: professionals, managers, clerical and skilled manual workers, semi-skilled manual workers and unskilled manual workers. However, the first census to use this schema for occupational class for local areas was not until 1951. The 1961 census then introduced a more complex system of 17 Socio-Economic Groups (SEGs), which was in turn replaced by the multi-level National Statistics Socio-Economic Classification (NS-SeC) in 2001, which emphasises semi-routine and routine rather than semi-skilled and unskilled.
Given the overlap between these different schema and in order to ensure as much consistency as possible we adopt a simplified version of the SEG schema, which is available in the printed constituency reports and distinguishes between the following occupational groupings:
Class 1/Professional workers (SEGs 3 and 4)
Class 2/Managerial workers (1, 2, 13)
Class 3 Non-manual/Routine non-manual work (5 and 6)
Class 3 Manual/Skilled workers (8, 9, 12 and 14)
Class 4/Semi-skilled workers (7, 10 and 15)
Class 5/Unskilled workers (11)
We code occupations to this schema using information available in the earlier censuses. For 1881 and 1931, the data are based on re-assigning categories from the relevant very detailed occupational tables.
6
For 1881, this re-assignment is based on the RG 1921 Classification provided by Armstrong (1972). For 1931, it is based on a table in the Registrar General for England and Wales’s Decennial Supplement for 1931, listing each census occupational category with its assigned social class (1938: 191–219). The RG’s 1921 Social Classification does not divide Social Class 3 into manual and non-manual, so we add this division for both 1881 and 1931 following, as far as possible, the 1980 Classification of Occupation. For 2001, 2011 and 2021, we use NS-SEC groupings to map onto the SEG schema (see Supplemental Online Appendix A2 for more details). The correlation between the SEG measure of class and the NS-SEC measure is very strong (
Given that our main focus is on the political incorporation of the working class, we treat the percentage of the labour force employed in class 3 manual, and class 4 and 5 occupations as our indicator for the size of the working-class population. Figure 1 shows that the size of the working-class population in Britain has declined from around 80% in the nineteenth century to less than 40% in the twenty-first century. The decline of the working class as a percentage of the population has therefore reduced the electoral incentives of parties—particularly Labour—to appeal exclusively to the working class (see also Kitschelt, 1994). Whereas in the 1960s the working class formed a majority of the population in nearly all constituencies (92% of constituencies had a working-class population above 50%); by 2024 the working class formed a majority in just a handful of constituencies (just 3% of constituencies had a working-class population above 50%).
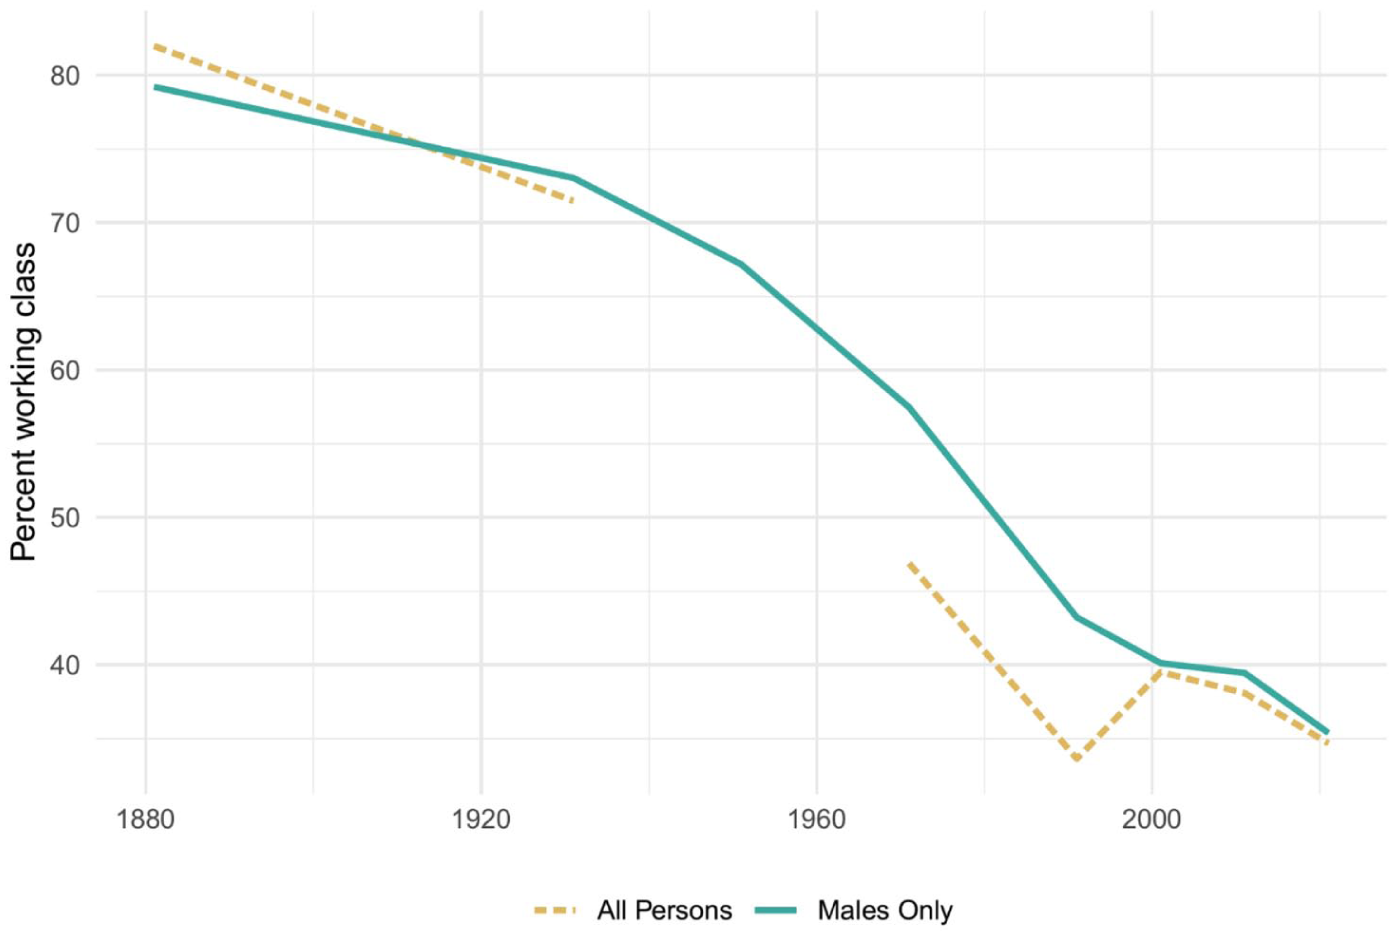
Working-class proportion of economically active population, 1881–2021. Class data for female workers is not available for the 1951 Census.
Changes to the way class is measured in different censuses over time (e.g. whether percentages are given as a proportion of people between particular ages, those who are economically active or all usual residents; whether the data are just for men or for both men and women) make it difficult to estimate the proportion of a constituency that falls into the working class in a consistent fashion. The gaps between censuses also mean that we cannot account for changes in the size of populations within each census allocation. We are also not trying to estimate an ecological model of how individual voters are behaving, but rather our estimates measure the combined influence of compositional and contextual effects on the relationship between constituency class composition and electoral support. We therefore focus on the relative size of the working-class population—that is, the most and least working-class constituencies—rather than the absolute size of the working class in each constituency. This allows us to focus on social comparisons and examine how the political differences between the most working-class areas of the country and the least working-class areas have changed over time. Such rank-based measures are more robust to alternative specifications as they are scale invariant and less sensitive to measurement issues (Gregg et al., 2017).
Class voting over time
We examine the evolution of class voting (or strength of the class–vote association) over time in four ways. First, we examine the overall strength of class voting by examining the overall predictive power of a class voting models of seat winners and vote shares over time. Second, we examine the difference in average vote share for each of the main parties between the most and the least working-class constituencies. Third, we examine the relative impact of class on vote for Labour, the Conservatives and Liberals with separate constituency class effects for each election. 7 Finally, we identify the key turning points in the relationship between class and vote for Labour and the Conservatives since 1900 using meta-analytic changepoint (piecewise linear) regression models.
One of the challenges of analysing vote shares over 134 years is that political parties have not always had the relatively clear and stable organisational structures that exist today. Our general approach to this problem is to treat parties that ran in electoral alliances under the vote count of the dominant party in that coalition, so, for example, the Liberal Unionists are counted as Conservative, as are the ‘coupon’ candidates at the 1918 election, and the national government candidates in the 1930s (with the pragmatic exception of the Liberal party in 1931, which we continue to treat as a separate party). We also ignore changes in party labelling and structure when there are clear continuities between organisations, for example, we treat the Labour Representation Committee (LRC) as essentially being the Labour Party, though it did not officially become so until 1906. For convenience, we use the party label associated with the grouping for the longest period of history, so, for example, our ‘Liberal’ grouping includes both the Liberal Party as it existed until 1988, its alliance with the Social Democratic Party (SDP) and the merger of the two in the form of the current Liberal Democrats.
Because we are interested in the emergence of Labour as a challenger to the two existing parties (i.e. we count trade union sponsored ‘Liberal-Labour’ candidates who took the Liberal whip as being part of the Liberals), we also include candidates who ran under a variety of Labour related labels prior to the foundation of the LRC in 1900, which includes organisations involved in the LRC’s creation, such as the Social Democratic Federation (SDF), and Independent Labour Party (ILP). We also include a slightly disparate set of candidates in elections prior to 1900 identified by Craig (1974) as ‘Independent Labour’, which includes both individuals not affiliated with any party and organisations that had an important influence on the development of Labour politics, such as the Bradford Labour Union. 8 See Supplemental Online Appendix A4 for more details about which candidates we count as belonging to which party at each election, and Supplemental Online Appendix A4.1 for the robustness of our analysis to different treatments of party alliances.
Any linkage between an electorate’s class composition and party support is driven by an interaction between demand (how much voters want to support a party) and supply (whether parties run in particular seats). The emergence of the working-class–Labour linkage emerged from both the way in which voters behaved and the increasing supply of Labour candidates. In 1900, the LRC contested their first election, under the leadership of Keir Hardie, standing 15 candidates and winning two seats, and picking up just over 1% of the national vote. Labour fielded more candidates and was more successful in 1906—contesting 50 and winning 29 seats, with nearly 5% of the national vote. After the extension of the franchise the number of seats they contested rapidly increased, particularly in working-class constituencies. In 1918, they contested 90% of the seats in working-class areas, compared with just over 50% of the seats in middle-class areas and won 21% of the national vote. Because we are interested in the interaction between supply and demand rather than one of these in isolation, we treat seats without a party’s candidate as receiving zero votes for that party. Conversely, where some candidates are elected unopposed, we grant the winning party 100% of the vote, which represents an entirely (lack of) supply-driven linkage between constituency characteristics and party success. 9
Overall strength of the class cleavage
To start with, we examine the overall strength of the class cleavage by following the example of Taylor et al. (2023), who look at the evolution of the urban–rural cleavage by comparing the predictive power of a cleavage model to a null model over time. Taylor et al. operationalise this using the expected proportional reduction in error (EPRE) of a multinomial logit model predicting the winning party in each constituency. We replicate this approach using our class data, shown in the left-hand panel of Figure 2. The results show that class becomes increasingly predictive of the winning party over the first half of the twentieth century, reaching a peak in 1960, fluctuating in strength for the next few decades but remaining overall a good predictor, before suddenly dropping back to pre-war levels of predictive power in 1997 and lower still at subsequent elections.
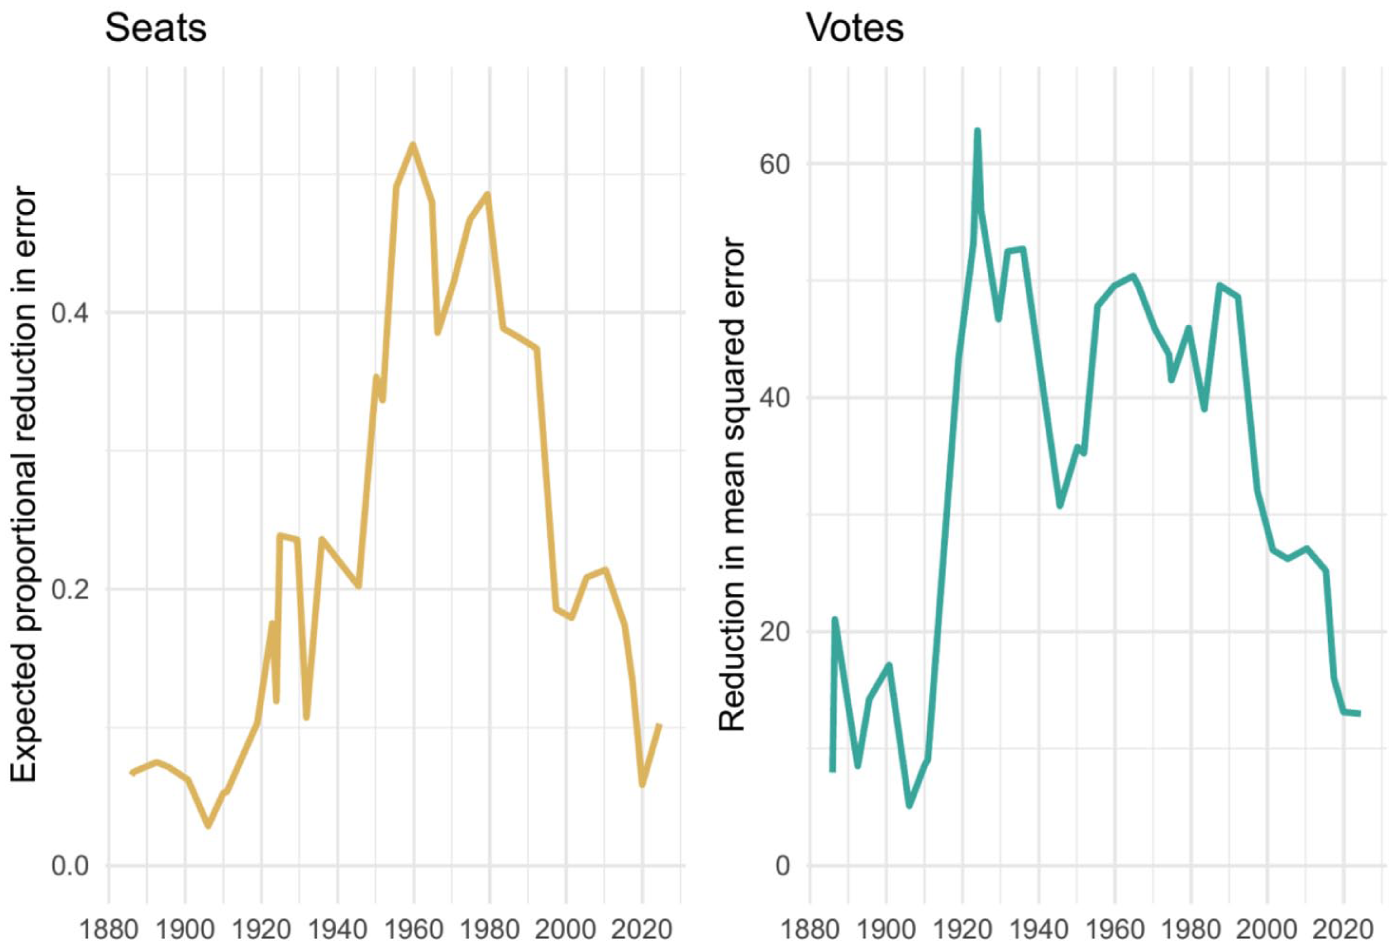
Expected proportional reduction in error (seat winners) and reduction in mean squared error (votes) from class versus null models, 1885–2024.
Looking at the relationship between constituency class and seat winner gives us important information, particularly as regards class–party linkages in parliament. However, it also has the potential to mislead us about the relationship between constituency class and the strength of parties in terms of their vote shares. First-past-the-post elections do not allocate seats proportional to vote shares and can exaggerate the apparent levels of support for particular parties (Curtice and Steed, 1986). We therefore extend the EPRE approach to vote shares by examining the reduction in mean squared error (MSE) of class models compared with null models of party vote shares, shown in the right-hand panel of Figure 2. This metric presents a slightly different story to seat winners—class rapidly emerges as a strong predictor of vote share in the early twentieth century, reaching a peak in 1923. Apart from a brief dip at the 1945, 1950 and 1951 elections, class remains a strong predictor of vote shares throughout nearly the remainder of the twentieth century before suddenly dropping in 1997 and dropping further still thereafter.
The two metrics present slightly different stories about the rise of class voting in the first half of the twentieth century. Looking at seat winners suggests that a moderate class voting relationship emerged in the 1920s, before increasing rapidly in the postwar era. Looking at votes suggests that class voting emerged even more quickly and remained stable for longer. To unpack this relationship further, we turn our attention to the relationship between constituency class and support for particular parties.
Class and support for particular parties
To start with, we simply examine how each party performed on average in seats with the most working-class populations (the top quartile in each census period: ‘working class constituencies’) against seats with the least working-class populations (the bottom quartile in each census period: ‘middle class constituencies’). From Figures 3–5, we can see that the relationship between class and vote develops over three main phases for each party, though the timing and duration of these phases is slightly different in each case.
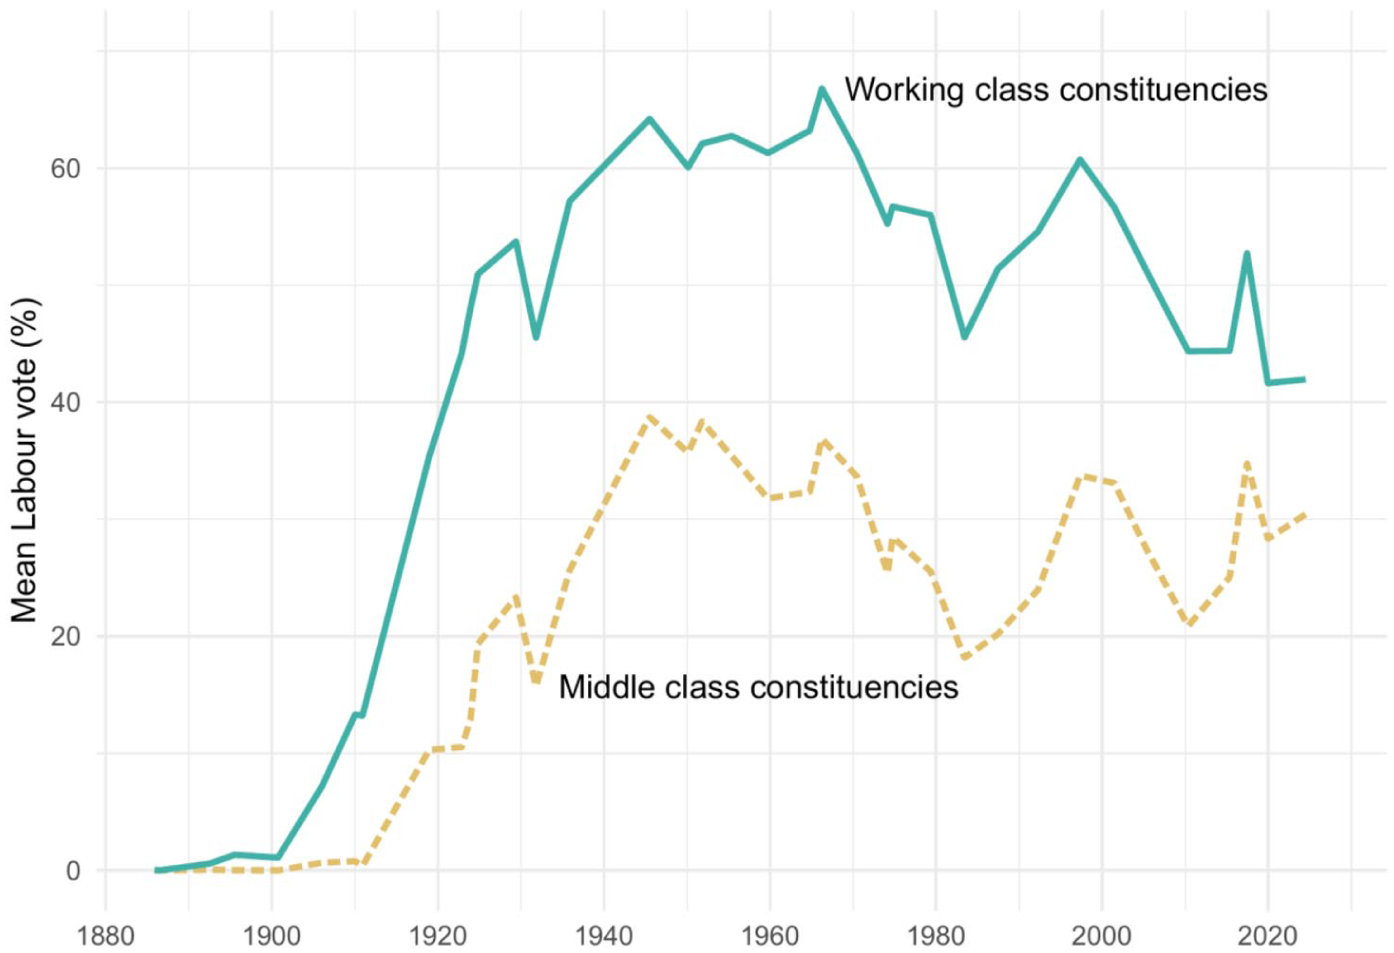
Constituency class profile and average support for Labour.
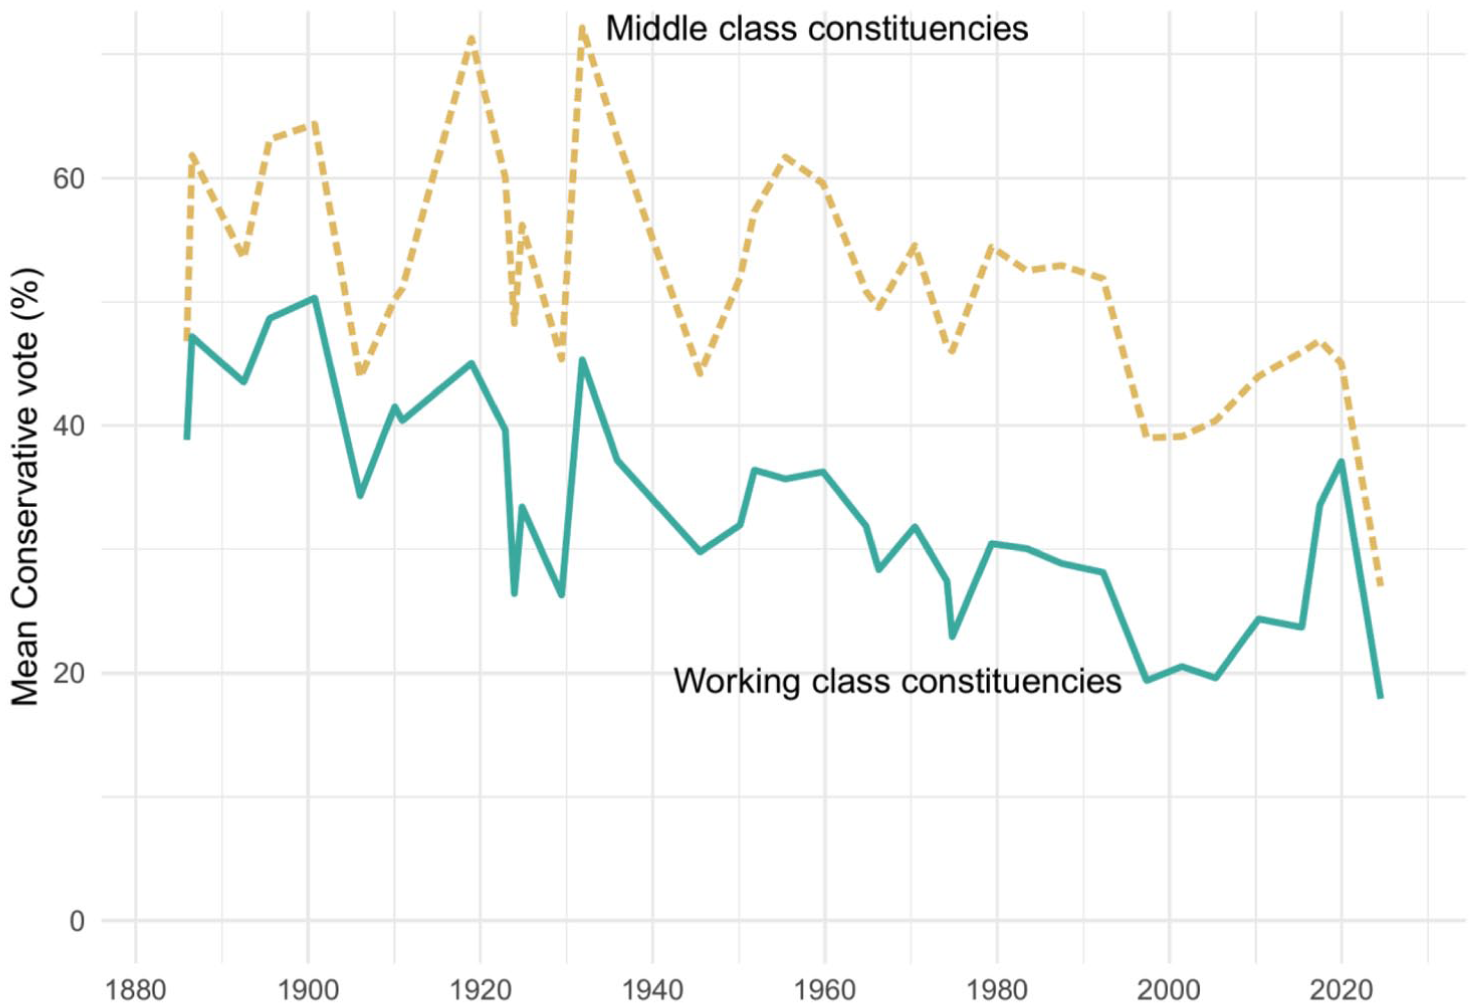
Constituency class profile and average support for the Conservatives.
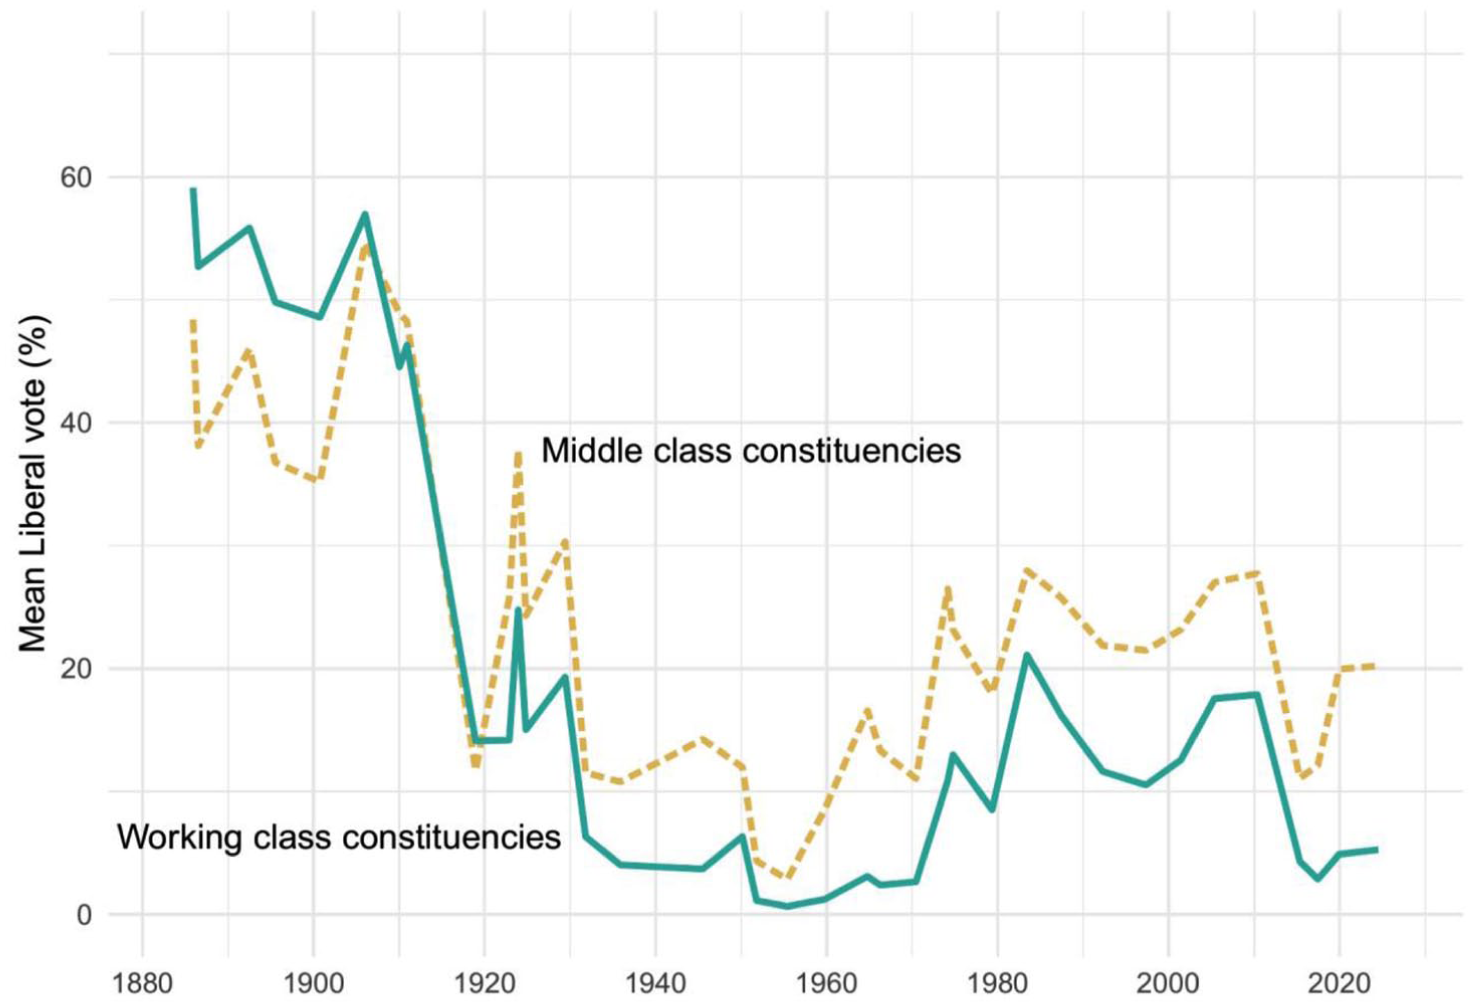
Constituency class profile and average support for the Liberals.
Figure 3 shows that the evolution of Labour’s support in working-class and middle-class constituencies. The first phase of class voting for Labour occurs rapidly over a short period of time, with the emergence of a strong link between working-class constituencies and Labour Party support following the transformation of the LRC into the Labour Party in 1906. In the space of five elections, spanning 16 years, the difference in Labour support between working- and middle-class constituencies grows from 7 percentage points in 1906, to 13 points in 1910, 25 points in 1918, before reaching 34 points in 1922. This marks the onset of the second phase. From 1923 onwards, despite fluctuations in the overall level of support for Labour, the difference in support between working-class constituencies and middle-class constituencies remains remarkably stable until the early 1990s, with a mean difference of 29, and a standard deviation of 3. Thereafter however, the third phase of Labour’s relationship with class begins. There is a gradual erosion to the class basis of Labour’s support during the New Labour era from 1997 to 2010, with the class difference in Labour support dropping from 31 points in 1992, to 27 points in 1997, hovering around 24 points between 2001 and 2010, then dropping to 19 points in 2015, 18 points in 2017, 13 points in 2019 and 12 points in 2024—the smallest class difference in Labour’s support since 1910, and their lowest share of the vote in working-class constituencies since 1918.
Turning to the Conservatives, Figure 4 shows that through the period covered by our data, the Conservative party has always done better on average in middle-class constituencies compared with working-class constituencies. However, the magnitude of this difference has changed during different periods. Once again, we can characterise this development in three phases. The first phase lasts between the 1885 and 1910 elections, when there is some evidence of weak class voting. During this period, the difference in Conservative vote share between middle- and working-class constituencies ranges from 8 to 15 percentage points (with a mean difference of 11 points, and a standard deviation of 3). The second phase begins with the extension of the franchise in 1918 to working-class men over the age of 21 and women over the age of 30, when the class basis of Conservative support becomes much stronger. In the 1918 election the class difference in support for the Conservatives is 26 percentage points. For nearly 100 years, this difference remains remarkably stable, with a mean difference of 22 points and a standard deviation of 3.
The third phase of the Conservative–class relationship occurs in the wake of the 2016 EU referendum, when the Conservatives make dramatic inroads in working-class constituencies and as a result the Conservative–class relationship weakens substantially, with the class difference in vote share falling to 13 points in 2017—the smallest difference in the era of mass enfranchisement that began in 1918—and to just 8 points in 2019—the smallest difference in the entire span of our data, before rising 1–9 points in 2024. The 2017 and 2019 changes also provide an important nuance to discussions about the collapse of Labour strongholds in 2019—while in terms of seats, the changes between constituency class and Conservative success were most evident in the 2019 election, a much larger shift in votes occurred at the previous election.
Next, Figure 5 shows the relationship between class and vote for the Liberals. The first phase covers the elections in the late Victorian era: 1885–1900. During these elections, there is evidence of weak class voting, and the Liberals consistently do between 10 and 15 percentage points better in working-class constituencies than in middle-class constituencies. The second phase covers a volatile period of electoral history, during which the Liberal’s electoral fortunes varied dramatically—from the Liberal landslide in 1906, to the ‘People’s budget’ elections of 1910, and the 1918 election which followed the Lloyd George–Asquith split and saw the near annihilation of the Liberal party. Despite their wildly varying overall electoral performance, this period shows only very small differences in the Liberal vote between working- and middle-class constituencies, which ranged between just −4 points and 2 points.
The 1922 election marked the start of the third phase, with Liberal support now being 12 points higher in middle-class constituencies. Thereafter, despite considerable variation in the Liberal’s electoral fortunes, which reached a low of 2.5% of the national vote in 1951 and a high of 25.4% in 1983 (in alliance with the SDP), the class difference in Liberal support remains fairly stable, with the Liberals doing between 2 and 16 percentage points better in middle-class constituencies than in working-class constituencies (with a mean difference of 9, and a standard deviation of 3).
To inspect the evolution in the strength of the class cleavage more directly we examine the magnitude of the marginal effect of class on support for each party. Figure 6 shows the marginal effect of class (in deciles) on support for the Conservatives, Labour and the Liberals. Despite the different operationalisation, these results echo the patterns we described earlier for each party in Figures 3–5.
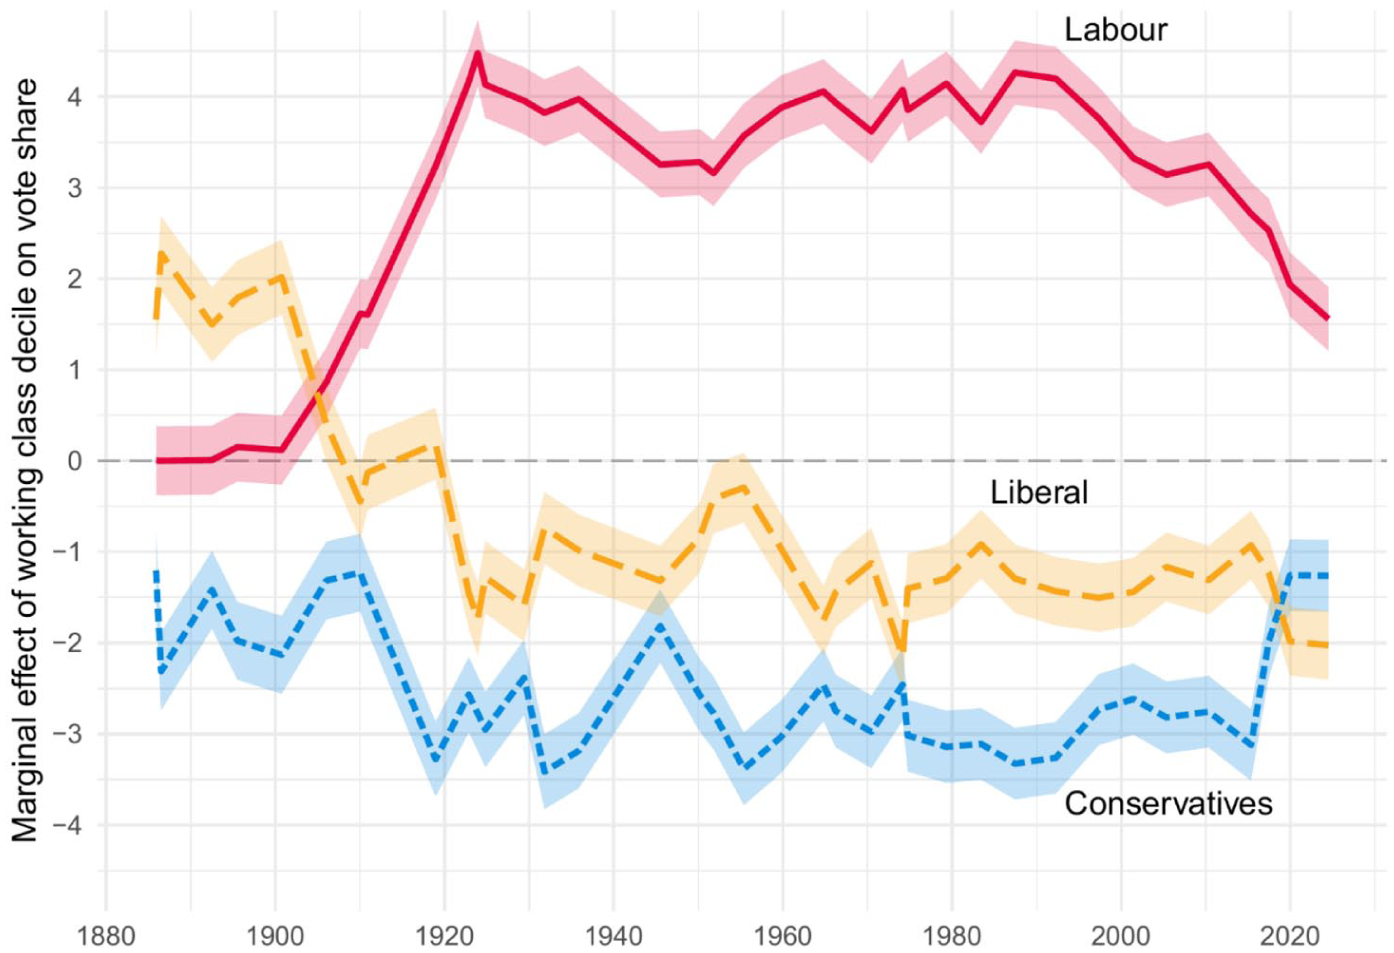
Marginal effect of class decile on support for Labour, the Conservatives, and Liberals at the constituency level.
Taken together, our results suggest that there have been five key periods in the evolution of class voting in Great Britain. (1) During the late Victorian era, there is a clear class pattern of support for the Liberals, who do better in more working-class areas, and the Conservatives, who do better in more middle-class areas (albeit to a degree that is smaller than the difference that later emerges between Labour and the Conservatives). (2) During the Edwardian era, the class basis of Liberal support collapses, and the Labour Party emerges as the new beneficiary of the working-class vote. (3) In the aftermath of the First World War, and expansion of the franchise in 1918, the relationship between class and support for the Labour and Conservative parties increases in magnitude, and the Liberals begin to perform relatively better in more middle-class areas. This pattern remains remarkably stable for the next three-quarters of a century. (4) Starting in the New Labour era, the Labour advantage in working-class areas begins to erode. This is followed by an even sharper decline in 2015, when the UK Independence Party (UKIP) first burst onto the scene in many working-class areas. (5) The brief rise of UKIP serves as a prelude to the final period covered by our data, which occurs in the aftermath of the 2016 EU referendum, and sees the continued decline of the class–vote relationship for Labour, and an even more rapid change in the class–vote relationship for the Conservatives, culminating in the fall of the ‘red-wall’ when Boris Johnson’s Conservatives swept to power on the back of Brexit, winning seats for the first time in a generation in many of Labour’s working-class heartlands (Cutts et al., 2020). Although constituency class continues to predict Labour and Conservative support in 2024, it only does so to a degree last seen at the end of the Edwardian era, before the expansion of the franchise and the emergence of Labour as a serious electoral force.
Estimating the changepoints in class voting
Although the rise, stabilisation and decline of class voting seem fairly clear in a visual inspection of our results, in order to more robustly identify the key moments when class voting changed course—especially given the scholarly debate about when class voting started to decline—we estimate a Bayesian meta-analytic changepoint (piecewise regression) models for Labour and the Conservatives, focusing on the period since the formation of the LRC in 1900. These models take our previous estimates of the class voting coefficients (as shown in Figure 6) and model them as a piecewise linear function of time where the changepoints (joins between segments) are estimated as part of the model.
If
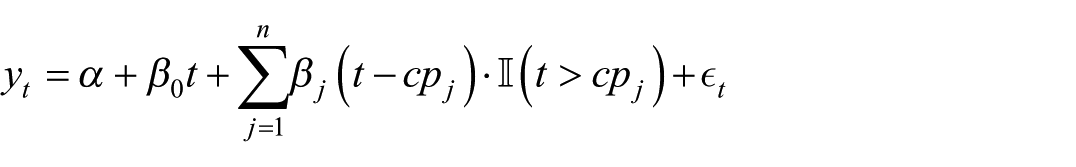
Where:
In simple terms, the model works as follows:
Before the first changepoint, the marginal effect of class on vote share (
Before a changepoint, the additional coefficients
After a changepoint, its indicator function is equal to 1, and so
The additional changepoint terms are cumulative. For example, after two changepoints, the marginal effect of class at time
To identify the number of changepoints, we compare models with different numbers of changepoints and select the model with the highest adjusted
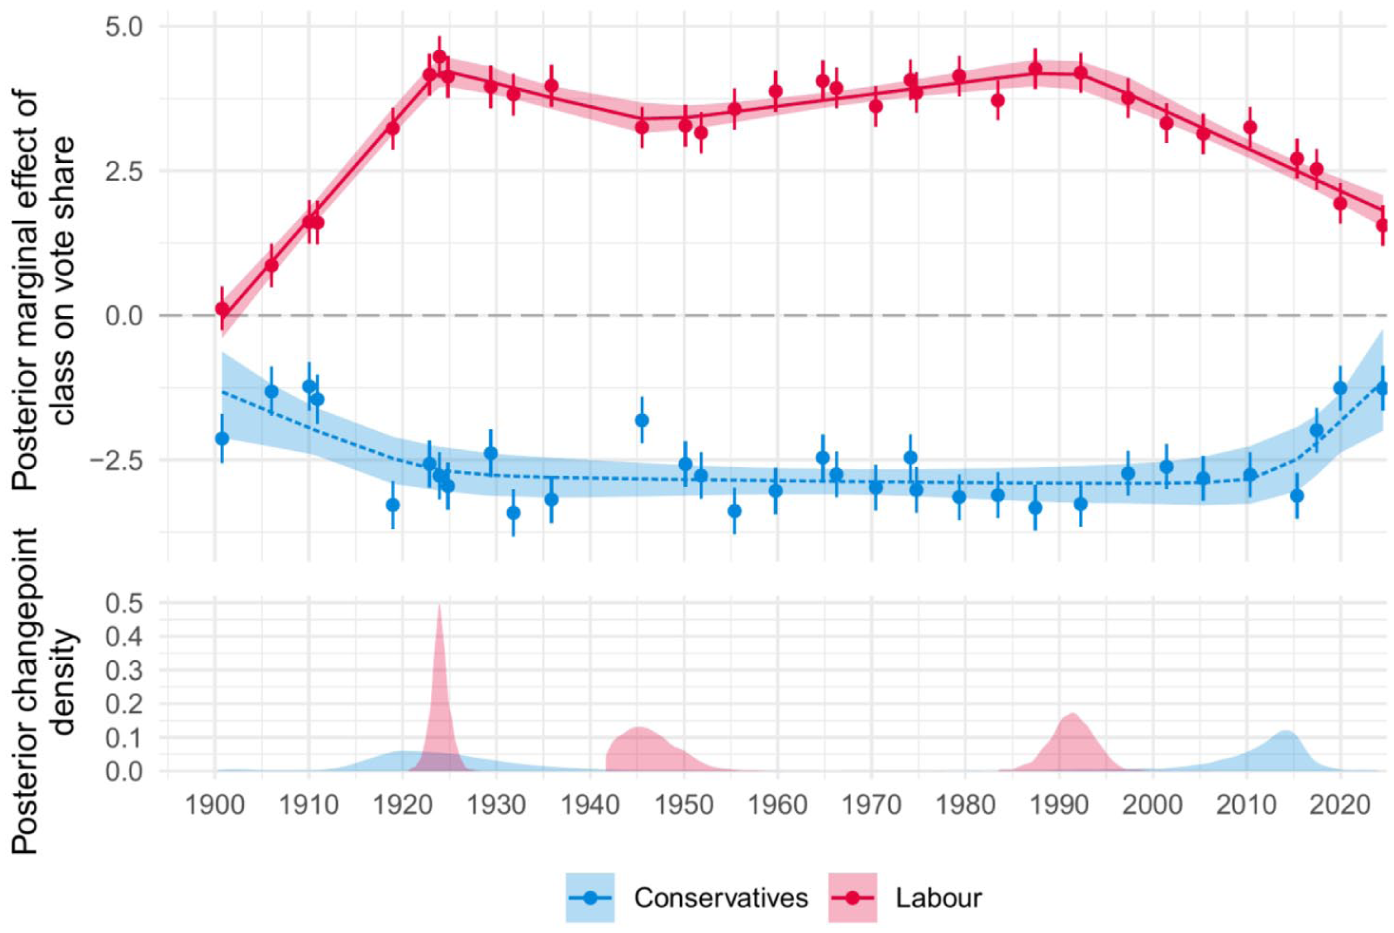
Meta-analytic changepoint models of the effect of class decile on vote share. In the top panel, points and errors bars are election-specific estimates of the effect of class decile on vote share. Lines and shaded areas are the posterior estimates of the piecewise linear estimate of the evolution of class voting since 1900. The lower panel shows the posterior distribution of the changepoints.
The first Labour changepoint occurs around the time of the 1923 General Election (maximum a posteriori probability estimate = 1923.9), which represents the point at which the class–Labour relationship stabilises after a period of rapid increase. Likewise, the first Conservative changepoint occurs in the decades following the First World War (maximum a posteriori probability estimate = 1920), though it is estimated with less precision than the Labour equivalent. Taken together, these changepoints support our earlier interpretation that the relationship between class and party support emerged rapidly in the first two decades of the twentieth century and stabilised shortly after the 1918 expansion of the electoral franchise.
Labour’s second changepoint is estimated to occur during the 1940s (maximum a posteriori probability estimate = 1945.1) and represents an increase in the class–Labour relationship after a short-lived—and relatively modest—dip in the class–Labour relationship in the immediate aftermath of the Second World War, which subsequently reverts to its pre-existing level. Although there is no Conservative changepoint estimated around this time there is a single outlying election—1945—which does not overlap the estimated time trend. Both of these suggest a temporary drop in the class–vote relationship that occurred around Labour’s landslide victory at the 1945 General Election.
The third Labour changepoint occurs in the 1990s (maximum a posteriori probability estimate = 1991.4). This marks the end of the relatively stable period of the class–Labour relationship that had run from the early 1920s and the start of a decline, which becomes apparent in the New Labour era and continues for the remainder of the time series. This result is important evidence in the long running debate about the decline of class voting in Britain. It is difficult to reconcile our analysis with the claim that class voting was already waning in the 1970s (e.g. Crewe, 1986). Instead, our results strongly support the argument that class voting was in trendless fluctuation during this period (Heath et al., 1985; Heath et al., 1991) and that the start of the decline in the working class–Labour linkage can be traced to the New Labour era (Evans and Tilley, 2017).
The second Conservative changepoint occurred slightly later (maximum a posteriori probability estimate = 2013.9), suggesting that the stable period of anti-Conservative working-class correlation lasted until around the time of the 2015 election and then rapidly unravelled in the wake of the 2016 Brexit referendum, in line with evidence from individual-level data (Fieldhouse et al., 2023).
We can also revisit historical questions with modern techniques to evaluate whether the extension of the franchise in 1918 represented a sharp discontinuity (Marquand, 1977; Pelling, 1979), or whether cleavage realignment largely occurred before the war (Clarke, 1971; Wald, 1983). 10 To do so, we augment our changepoint models with two variables which capture whether elections took place after the Representation of the People Act 1918 and the Representation of the People Act 1928 (see Supplemental Online Appendix A9 for summary). The results indicate that the 1918 franchise expansion had no statistically discernible effect on the class–Labour relationship, perhaps because, as argued by Clarke (1977), the Labour Party before 1918 was largely a party of trade unionists, who were the one section of the working class most likely to be enfranchised. However, there is some evidence of an increase in the strength of the Conservative–class voting relationship. The model suggests that there is no clear effect of the 1928 franchise expansion for either party.
Conclusion
Lipset and Rokkan (1967) famously declared that the ‘party systems of the 1960s reflect, with few but significant exceptions, the cleavage structures of the 1920s’ (p.50). Since then, much research has examined the dissolution of these cleavages. However, without a truly long-term perspective, it is hard to put the magnitude of these changes into broader historical context and easy to read too much into minor variations that occur from election to election. This article shows that class voting in the twentieth century was remarkably stable, and that short-term variations in the strength of class voting are relatively minor in comparison to the underlying persistence of the class cleavage. Or, as Bartolini and Mair (1990) put it over 30 years ago—the ‘rumours of change [have] been greatly exaggerated’ (p.xvii).
The patterns of class–party support we find in the latter part of the twentieth and early twenty-first centuries are important evidence in long running disputes about the timing, and causes of, the decline in class voting. We show that the post New Labour period sharply deviates from what happened before. The timing of this juncture—and the sharpness of the break from the past—suggests that class voting did not simply decline as a function of social change, as has often been assumed in the literature. Although British society has undergone enormous social change over the last 100 years; the strength of the class divide remained remarkably constant up until very recently. Accounts of class dealignment which emphasise social change are thus ill-equipped to explain the persistent stability of the class cleavage observed in British elections. Even with a prior that the decline of the Labour–class relationship began sometime around the 1970s, our data suggest we should conclude that it was stable until the 1990s (see Supplemental Online Appendix A8.4 for more detail).
Rather, our findings are more consistent with accounts that emphasise political factors and the structure of the choices offered to voters by politicians and parties. Although our analysis does not directly test this possibility, our preference for the political change scenario is founded on the longitudinal element of our design combined with the secondary literature on the topic. We show that the decline of class voting only starts with New Labour and then accelerates with the emergence of Brexit as a new conflict issue. To this end, it is telling that the decline of class voting only began in earnest under Tony Blair’s Third Way centrism, which actively de-emphasised class as an electoral issue, through policy, rhetoric and personnel (Evans and Tilley, 2017; Fouirnaies, 2026; Heath, 2015; Thau, 2021). During this period, New Labour not only sought to broaden its appeal among the expanding middle class by moving to the right on issues that traditionally divided the classes (Evans and Tilley, 2012, 2017) and making explicit appeals to business (Thau, 2019); it also actively distanced itself from the working class by selecting more and more middle-class candidates (Heath, 2016) and breaking links with trade unions, who from 1900 until the practice was abolished in 1996 sponsored many Labour Party candidates standing for election often in safe (working-class) constituencies (Fouirnaies, 2026). Of all the political events to have occurred in the twenty-first century, it is New Labour’s radical break from the past that does most to disrupt traditional patterns of class alignment and create the electoral space for further changes to come. Class did not therefore dissolve as a cleavage; but was actively de-emphasised by Labour. This created the electoral space for new dimensions of political conflict to emerge, most notably evident in the sudden increase in Conservatives support in working-class areas post Brexit. Despite Labour’s return to power in 2024 and the rise of Reform UK, there is little evidence that these trends have altered course.
As Kitschelt’s (1994) classic account of the social democratic dilemma makes clear: these party strategies can themselves be a response to social change. Social democratic parties have long faced incentives to adapt their strategies as their traditional constituencies have declined in size, and across Europe many social democratic parties changed their ideological offer to attract the growing share of the expanding middle classes. The Labour Party under Tony Blair was perhaps an extreme example of this, but it was by no means unique (Häusermann and Kitschelt, 2024). At the time, this move was celebrated as a successful strategy to overcome the dilemma of electoral socialism (Przeworski and Sprague, 1986), but as our results show, it has come with a cost: Labour’s support in working-class parts of the country is now at its lowest level since the extension of the franchise in 1918.
Although our focus is on the structure of political alignments at the constituency level, much recent research on class voting has focused on the individual level using survey data. One fruitful line for future research is to link our constituency-level data with survey data to explore how these effects vary and interact over time.
In addition to our main findings, the subtle difference we see in the relationship between class and votes and class and seats (i.e. Figure 2, but see also Supplemental Online Appendix A7.1) also points to a methodological and substantive challenge posed by plurality electoral systems. If we are interested in the relationship between variables such as constituency class and levels of support for different political parties, we will get slightly different answers if we look at vote shares or seat shares. In our case, the class–winning party linkage significantly lags the class–vote linkage. This is important methodologically because unless we are interested in seat winners specifically, vote shares will yield a more accurate measure of the relationship between social groups and party support. It is also important substantively because it shows that parliaments elected by plurality electoral rules can be relatively slow to respond to changing political alignments.
Our findings also speak of important debates about the earlier period of British politics. Historians have long debated if the rise of Labour politics in the early twentieth century meant inevitable doom for the Liberal party (McKibbin, 1984; Pelling, 1967) or, had the Liberals not split during the First World War, whether they might have been able to incorporate the working class into the Liberal electorate (Clarke, 1971; Wilson, 1966). 11 Our findings suggest that, while the Liberals were in good overall electoral health before the First World War, there had already been a dramatic change in the relationship between class and Liberal support. While this does not necessarily mean that the decline of the Liberals was inevitable, it does suggest that had the Liberals survived the First World War intact, they would have faced a serious electoral challenge in their previous strongholds from the emergent Labour Party.
Finally, while our analysis focuses on Britain, the findings have broader implications for comparative theories of social cleavages and electoral alignment. Our results illustrate how a country’s political cleavage structure influences the opportunity structure that new parties face (Kriesi et al., 1995). Stable cleavages limit the space for new parties to enter the system; but changing political cleavages create opportunities that new parties can exploit (Golder, 2016). For much of the postwar period, Britain was regarded as something of an outlier in Western Europe for its apparent immunity to the rise of electorally successful radical right parties. While countries such as Italy, France, Austria and the Netherlands saw sustained support for parties mobilising around nativist, anti-immigration and anti-establishment platforms, the UK party system remained largely insulated from these dynamics. However, since the late 1990s, rapid class dealignment has undermined this stability and parties such as the UKIP and, more recently, Reform UK, have found fertile ground in working-class localities, tapping into grievances over immigration, sovereignty and political disillusionment (Evans and Mellon, 2015; Heath et al., 2025). Whereas accounts of class dealignment that identify the 1970s as the decisive moment in the weakening of the Labour–working-class relationship do not draw a direct link between that earlier period and the more recent reconfiguration of party support, identifying the late 1990s as a critical turning point offers a more proximate explanation for these developments and illustrates how the decline of old cleavages and the emergence of new cleavages are intricately related.
Supplemental Material
sj-pdf-1-psx-10.1177_00323217261448797 – Supplemental material for The rise and fall of class voting in Britain, 1885–2024
Supplemental material, sj-pdf-1-psx-10.1177_00323217261448797 for The rise and fall of class voting in Britain, 1885–2024 by Oliver Heath, Humphrey Southall, Paula Aucott and Christopher Prosser in Political Studies
Footnotes
Funding
The authors disclosed receipt of the following financial support for the research, authorship and/or publication of this article: This research was supported by ESRC grant ES/Z503344/1.
Declaration of conflicting interests
The authors declared no potential conflicts of interest with respect to the research, authorship and/or publication of this article.
Supplemental material
Supplemental material for this article is available online.
Notes
Author biographies
References
Supplementary Material
Please find the following supplemental material available below.
For Open Access articles published under a Creative Commons License, all supplemental material carries the same license as the article it is associated with.
For non-Open Access articles published, all supplemental material carries a non-exclusive license, and permission requests for re-use of supplemental material or any part of supplemental material shall be sent directly to the copyright owner as specified in the copyright notice associated with the article.