
Abstract
The volume of fluid (VOF) model and the discrete phase model (DPM) were adopted for primary and secondary atomization processes, respectively. The effects of the inlet-limited delivery tube geometry on the flow field, melt breakup and particle cooling were then investigated. The results show that under the delivery tube extrusion length of 5 mm, the suction effect and the breakup efficiency can be improved, and the risk of freeze-off can be inhibited. With the decrease of the delivery tube diameter from 2.5 to 1.5 mm, the calculated median diameter is decreased by more than half and the average cooling rate is more than doubled. The industrial trial results under different delivery tube diameters match the simulation results, and the stable casting of melt with low flow rate can be realized by adopting the inlet-limited delivery tube. When the delivery tube diameter is 1.5 mm, the amorphous powder has a median diameter of 38.9 μm and optimal soft magnetic properties with saturation magnetization of 135.0 emu·g−1 and coercivity of 0.26 Oe.
Introduction
In recent years, the rapid development of the electrical and electronic fields has driven the rapid updating of electronic components, and the development trend of high-frequency, lightweight and high-efficiency for electronic components has put forward high requirements for the soft magnetic properties of magnetic functional materials.1–4 Compared with traditional crystalline soft magnetic materials (such as silicon steel and ferrite), Fe-based amorphous alloys have excellent soft magnetic properties such as high permeability, high magnetic induction and low coercivity due to the absence of defects such as grain boundaries, dislocations and segregation.5,6 Therefore, in the field of powder metallurgy, Fe-based amorphous powder is expected to have widespread applications in wireless communications, smart terminals, new energy vehicles and transformers as an ideal material for electromagnetic energy conversion and power transmission components.7–9 As the amorphous fraction, diameter and sphericity of powder have a significant impact on the density and soft magnetic properties of subsequent powder compacts and electronic modules, the development and optimization of high-quality amorphous powder production processes are crucial. 10
The atomization method mainly works by converting the kinetic energy of the high-velocity atomization medium into the surface energy of the molten metal so as to achieve the rapid fragmentation, cooling and solidification of the molten metal.11,12 Despite the low efficiency of energy utilization in the atomization process, it has become one of the most mature commercialized powder production processes due to its unique advantages of non-pollution, low cost, large-scale production capacity and high flexibility in alloy composition.13,14 Based on the different types of atomization media, the atomization method can be divided into water atomization, gas atomization and gas-water combined atomization. 15 Due to the high specific heat capacity of water, the cooling rate of water atomization is extremely fast. The droplets are fragmented after the impact of the high-speed water flow and remain irregular in shape to solidify into powder. The cooling rate of gas atomization is lower than that of water atomization, and the liquid droplets can complete the spheroidization process under the action of surface tension due to the adequate solidification time, thus the powder produced by gas atomization exhibits excellent sphericity. Gas-water combined atomization can effectively combine the technical advantages of gas atomization and water atomization by developing a reasonable gas-water cooling system. However, its large-scale industrial application has not yet been realized due to the technical difficulty. 16 Therefore, considering the technical drawbacks of poor powder sphericity of water atomization, gas atomization technology is currently the main process for the production of spherical amorphous powders.
For the high-temperature, high-pressure and closed chamber used in the actual industrial gas atomization process, the molten metal and the supersonic gas jet undergo intense energy and momentum exchanges within millisecond time scales. This feature leads to the fact that conventional experimental methods cannot be directly applied to the atomization process.17,18 For methods such as high-speed cameras18,19 or particle image velocimetry, 20 although the results are useful as a guide for understanding the atomization process, they are costly and suffer from drawbacks in directly observing gas-liquid interactions during the atomization process or measuring the atomization flow field. Therefore, the computational fluid dynamics (CFD) method has become the main means to investigate the atomization process. By analyzing the gas-liquid interaction, turbulence flow development and droplet breakup in the atomization process through the CFD, scientific insights can be provided for the optimization of the equipment structure and atomization process parameters.
Although there is no clear criterion for the division of the actual atomization process, the atomization process is currently often divided into primary and secondary atomization based on the length scale of the broken droplets. 17 The process of fragmenting the molten metal to millimeter-scale droplets above the recirculation zone after it flows out of the delivery tube is known as primary atomization. The process of further breakup of mother droplets to micron-scale sub-droplets below the recirculation zone is known as secondary atomization. 21 In the early period, scholars mainly adopted various assumptions to simplify the primary atomization process and simulated the secondary atomization process by simplifying the droplets into discrete phases through the Lagrangian method, thus obtaining the final particle size distribution. Zeoli et al. 22 omitted the complex gas-liquid multiphase flow modeling during primary atomization by directly simulating the breakup process of particles in the diameter range of 1–5 mm. Markus et al. 23 proposed 10%-100% of the delivery tube diameter as the initial droplet diameter for secondary atomization simulations, and this assumption was widely adopted.
In recent years, with the improvement of computational capability and the development of numerical models, a coupling method that combines the Volume of Fluid (VOF) model based on Eulerian method and the Discrete Phase Model (DPM) based on Lagrangian method to realize the modeling and analysis of the whole atomization process has gradually become the mainstream method. Based on this method, Luo et al. 24 analyzed the gas-liquid interaction and the evolution of hollow powder during atomization using the VOF method, and then investigated the secondary breakup process by the DPM method. For the Ni-Si alloy atomization process, Hua et al. 17 firstly used OpenFOAM software to calculate the primary atomization process, and the particle size distribution information was obtained by extracting the physical information of the droplets as the initial condition for the calculation of the secondary atomization process based on the Fluent software. Wei et al. 25 simulated the primary atomization process of 24CrNiMoY droplets using the VOF model and the Large Eddy Simulation method, and the size of large droplets obtained from the simulation matched the experimental observations. Then, the results were used as the initial condition to calculate the secondary atomization process using the Taylor analogy breakup model and the effect of different atomization pressures on the particle size distribution of alloy steel powder was investigated.
Based on the research of our group in atomization numerical simulation,26–30 the atomization process of FeSiBCCr amorphous alloy is investigated by numerical simulation and experiments in this study. The influences of structure parameters of the inlet-limited delivery tube on the atomization compliance, droplet breakup and cooling are further studied, with a view to providing theoretical and practical bases for the development of the atomization technology.
Numerical and experimental methods
In this study, the numerical simulation method for the whole gas atomization process of FeSiBCCr amorphous alloy is shown in Figure 1. In order to simulate the actual atomization process of injecting the gas first and then casting the melt, the steady state supersonic gas-only flow field is first calculated using the Shear Stress Transport (SST) k-ω turbulence model. The process of high-temperature melt outflow from the delivery tube to the recirculation zone is defined as primary atomization, and the gas-liquid interaction and droplet morphology evolution at this stage are investigated using the VOF method combined with the SST k-ω turbulence model. As the atomization process proceeds, the number of droplets fragmented to the micron scale increases, and the computational load required to simulate the atomization process using the VOF method increases significantly. In order to overcome the limitation of computational capability, the results of primary atomization calculations are used as the initial conditions, and the relevant physical information of particles during secondary atomization is obtained by DPM method with Kelvin–Helmholtz Rayleigh–Transport breakup model. Further, the corresponding industrial atomization trials with corresponding powder characterization are carried out, in order to validate the numerical model and give an optimized delivery tube configuration.
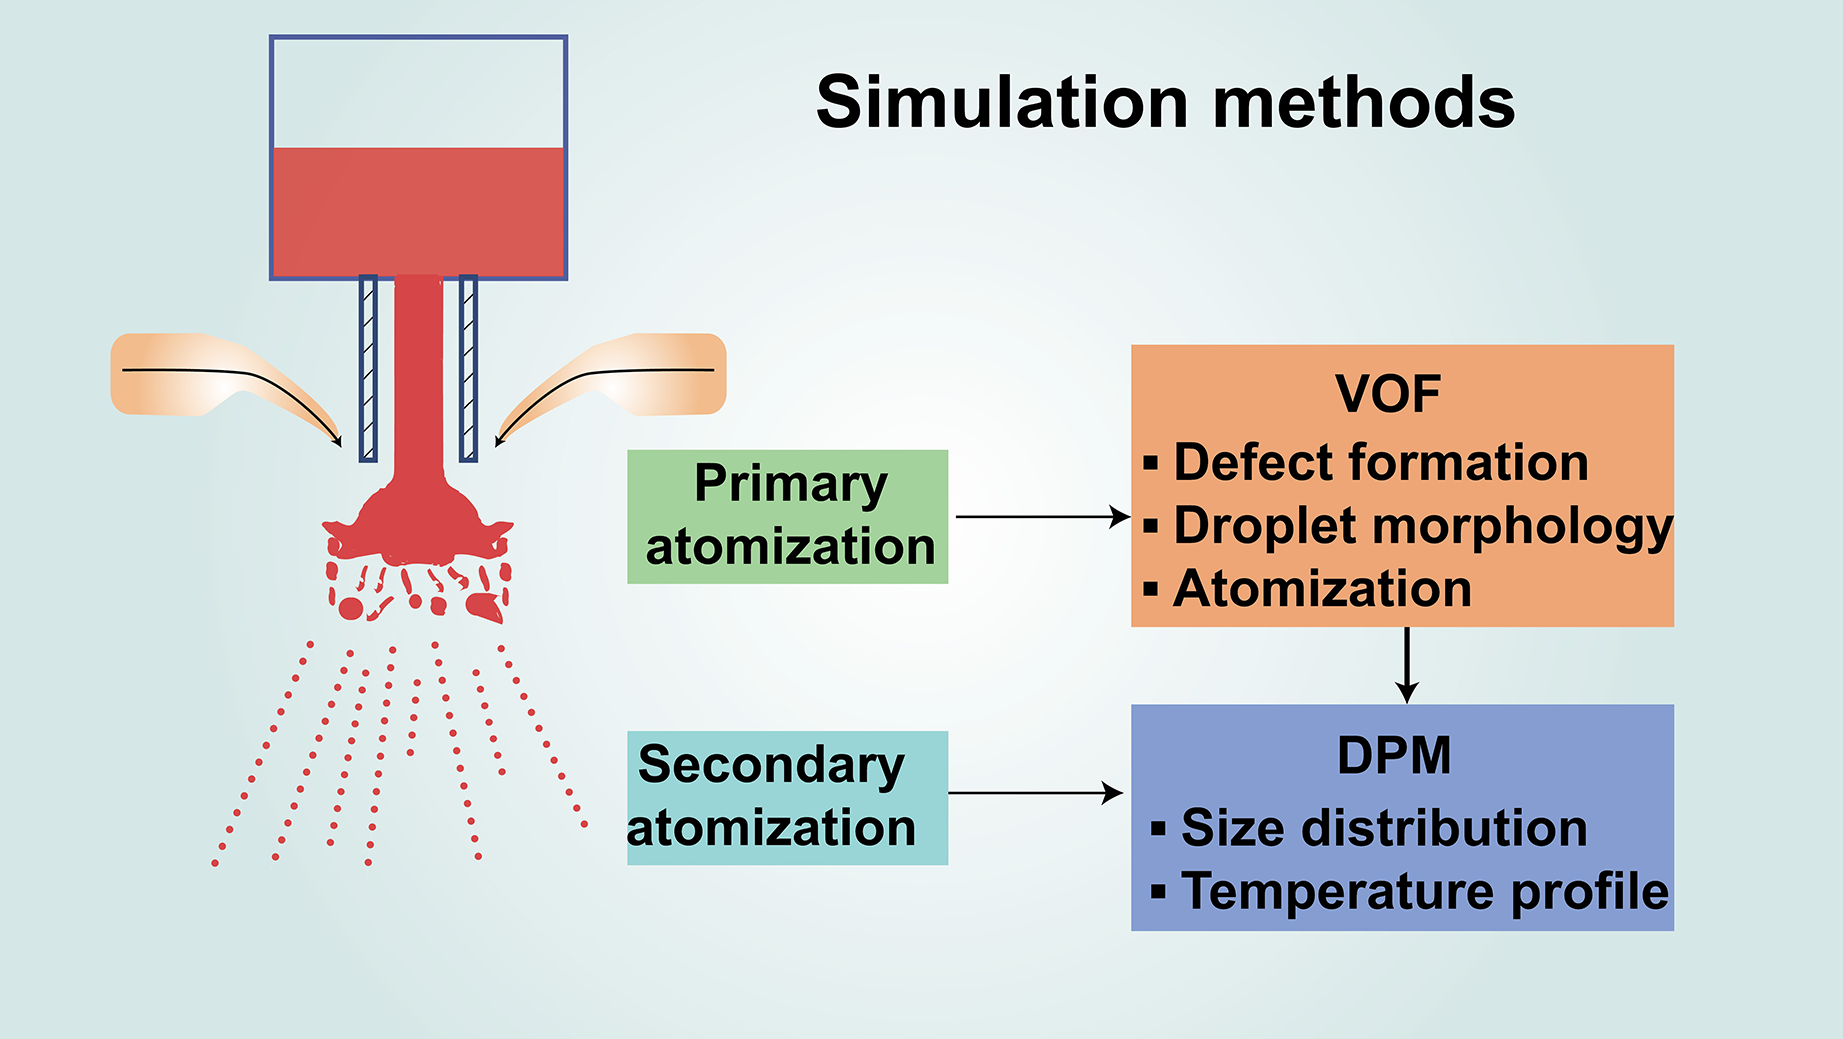
Modeling route for the whole atomization process.
Model assumptions
In this study, the numerical computation of atomization process is performed using ANSYS Fluent 2021 R2, a commercial CFD software based on finite volume method. Under the premise of ensuring the computational accuracy, the actual complex atomization process is simplified based on the following assumptions:
Based on the supersonic flow field characteristics of the Laval nozzle used, the nitrogen is treated as a compressible fluid conforming to the ideal gas law. The melt mass flow rate during casting is regarded as constant, and the value is obtained by dividing the melt mass by the actual atomization time. The viscosity of the melt is a temperature-dependent function measured experimentally (details in Figure S1), and the other physical parameters are constant. The release of solidification latent heat is neglected because the cooling rate of atomization is extremely fast and the droplets can be cooled to below 800 K in a few milliseconds.
31
All walls were smooth, non-slip and adiabatic.
The governing equations involved in the numerical model developed in this study have been listed in detail in our previous studies.27–29
Model settings
In this study, a two-dimensional axisymmetric model is used to complete the required calculations, and the geometry and boundary conditions are shown in Figure 2. The size of the computational domain is 260 mm × 90 mm. The gas nozzle is a typical Laval nozzle with an inlet diameter of 9.20 mm, an outlet diameter of 1.90 mm, and a throat length of 0.34 mm, and the injection angle is 10°. The delivery tube is a special inlet-limited structure, i.e., the inlet diameter is much smaller than the outlet diameter. Due to the fixed outlet diameter, all subsequent delivery tube diameter refers to the inlet diameter. In contrast to conventional delivery tube structures, the liquid column does not come into direct contact with the inner wall of the delivery tube during falling. By utilizing the air insulation effect and equipped with thermal insulation, the risk and hazards of clogging can be effectively reduced and the actual atomization process window can be widened. The delivery tube diameter d and extrusion length L are investigated in this work. The outlet diameter of the delivery tube is fixed at 11 mm, the inlet diameter of the delivery tube is 1.5, 2.0, 2.3, and 2.5 mm according to the actual used specifications. L ranges from 0 to 5 mm. The boundary conditions for the steady-state gas-only flow field calculations are shown in Figure 2. The gas inlet is set as the pressure inlet condition, the side walls and bottom of the atomization chamber are set as the pressure outlet condition, and the delivery tube inlet is set as the Wall condition (Massflow inlet for primary atomization calculation only).
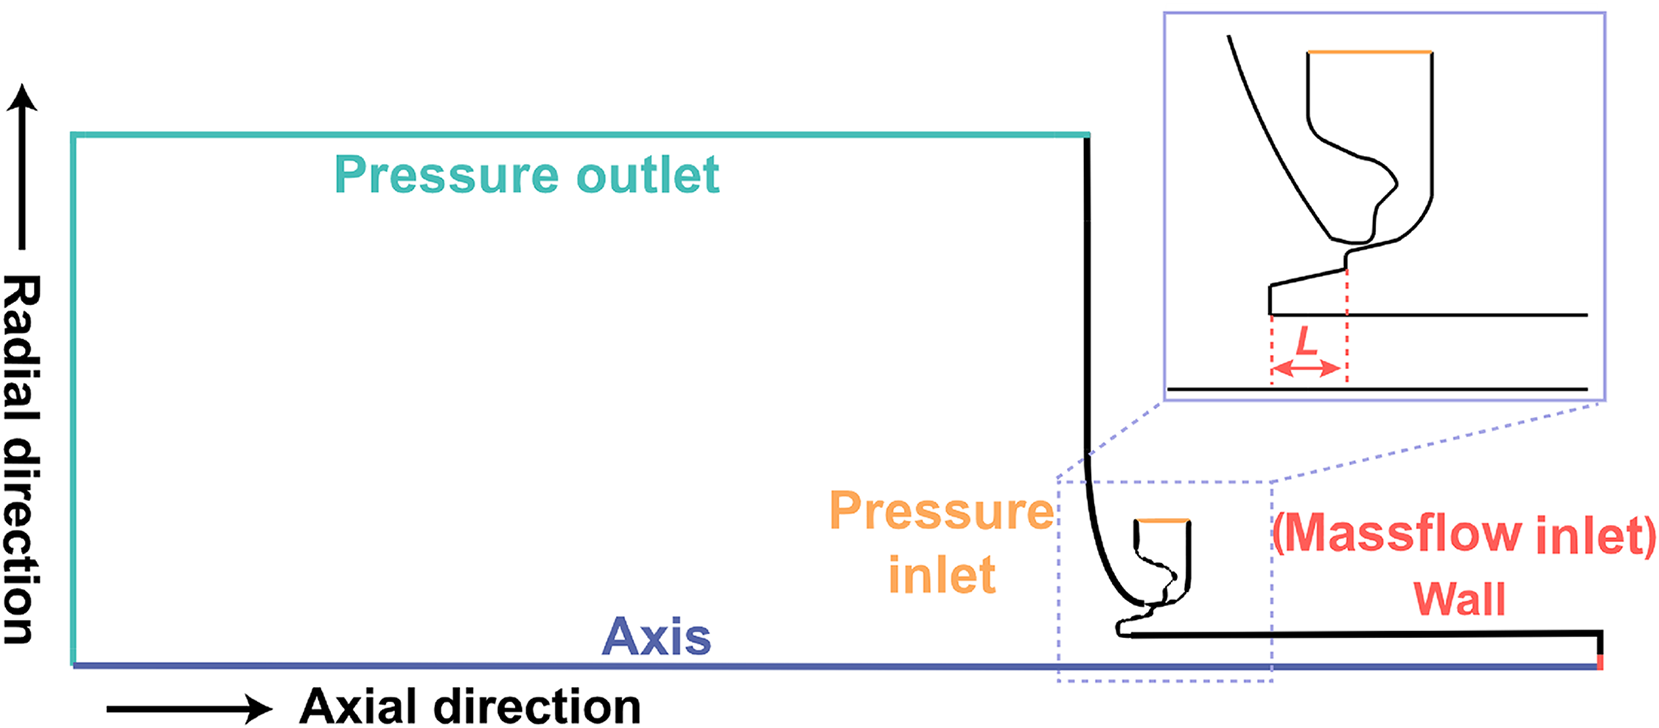
Schematic diagram of geometry and boundary condition. The magnification illustrates the nozzle structure.
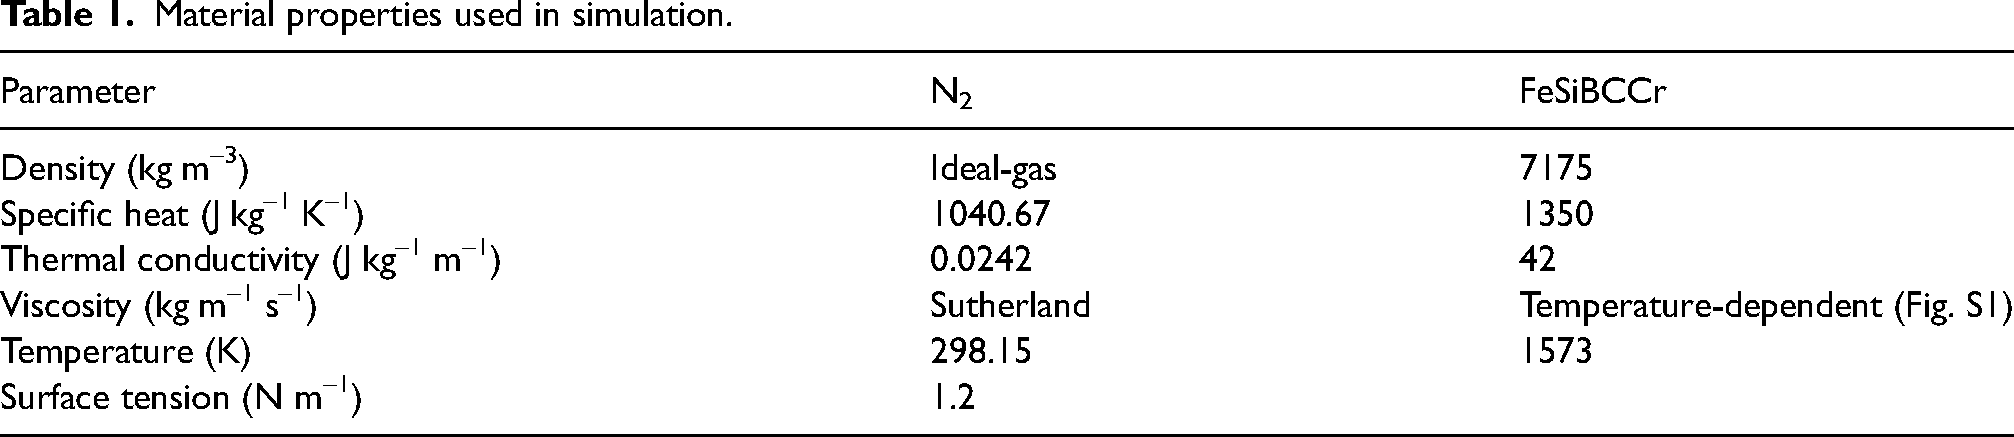
Since primary atomization occurs only in a small area from the delivery tube outlet to the recirculation zone, the computational domain is further reduced to 115 mm × 42 mm to save the computational resources required for primary atomization calculations. The used mesh type for the primary atomization simulation is quadrilateral. The minimum size of the original mesh is 0.2 mm and the mesh number is 4.6 × 10⁴. A dynamic adaptive mesh method predefined for VOF model in Fluent is used, which automatically refines or coarsens the regions where the gradient of the phase volume fraction meets the criterion during the calculation process. Wherein, the adaptive level is set to 3, and the minimum mesh size after refinement is less than 30 μm, which can meet the required mesh resolution for primary atomization calculations. The adaptive time step based on the Multiphase-Specific method time step is adopted. The initial and maximum time steps are set to 1 × 10⁻⁸ and 1 × 10⁻⁵ s, respectively. The global Courant number is set to 2 with a total computation time of 70 ms. The physical parameters of the N2 and FeSiBCCr amorphous alloys are shown in Table 1 below.
Material properties used in simulation.
The original computational domain is used for the secondary atomization calculations. The mesh type is quadrilateral with a minimum mesh size of 0.1 mm and a mesh number of 19.9 × 10⁴. The particle group is set to be released 5 mm below the outlet of the delivery tube. The total particle mass flow rate is equal to the melt mass flow rate. The particle size conforms to the Rosin–Rammler distribution, and the initial particle size is obtained by extracting the results of the primary atomization calculations (Table S1). The adaptive time step for the secondary atomization computation is based on the error-based adaptive step method. The minimum and maximum step size of 1 × 10⁻⁸ s and 1 × 10⁻⁵ s, respectively, and the total computation time is 30 ms.
In the above calculation process, the pressure-velocity coupling scheme is set as coupled. The pressure, density, momentum, turbulent kinetic energy, specific dissipation rate and energy are discretized by the second-order upwind. The volume fraction is discretized by Compressive. Residuals of 10−6 for the energy equation and 10−4 for the others are defined as the convergence criteria.
Model validation
For the validation of the gas-only flow field model, a cold experimental platform was built. A rubber tube connected with a digital pressure gauge was inserted into the center of the gas die without installing the delivery tube, and then the pressure and velocity of the local flow field could be measured by a Direct-reading anemometer (JCP-7000). 30 In order to avoid the fluctuation of measurement results caused by excessive atomization pressure, conditions of 0.5 and 1.0 MPa were selected for experiments in this study. The comparison of the experimental results with the numerical simulation results is shown in Figure 3. It can be seen that for the characteristic points at different vertical distances from the centerline, the velocity and pressure results obtained from the simulation are in good agreement with the experimental values.
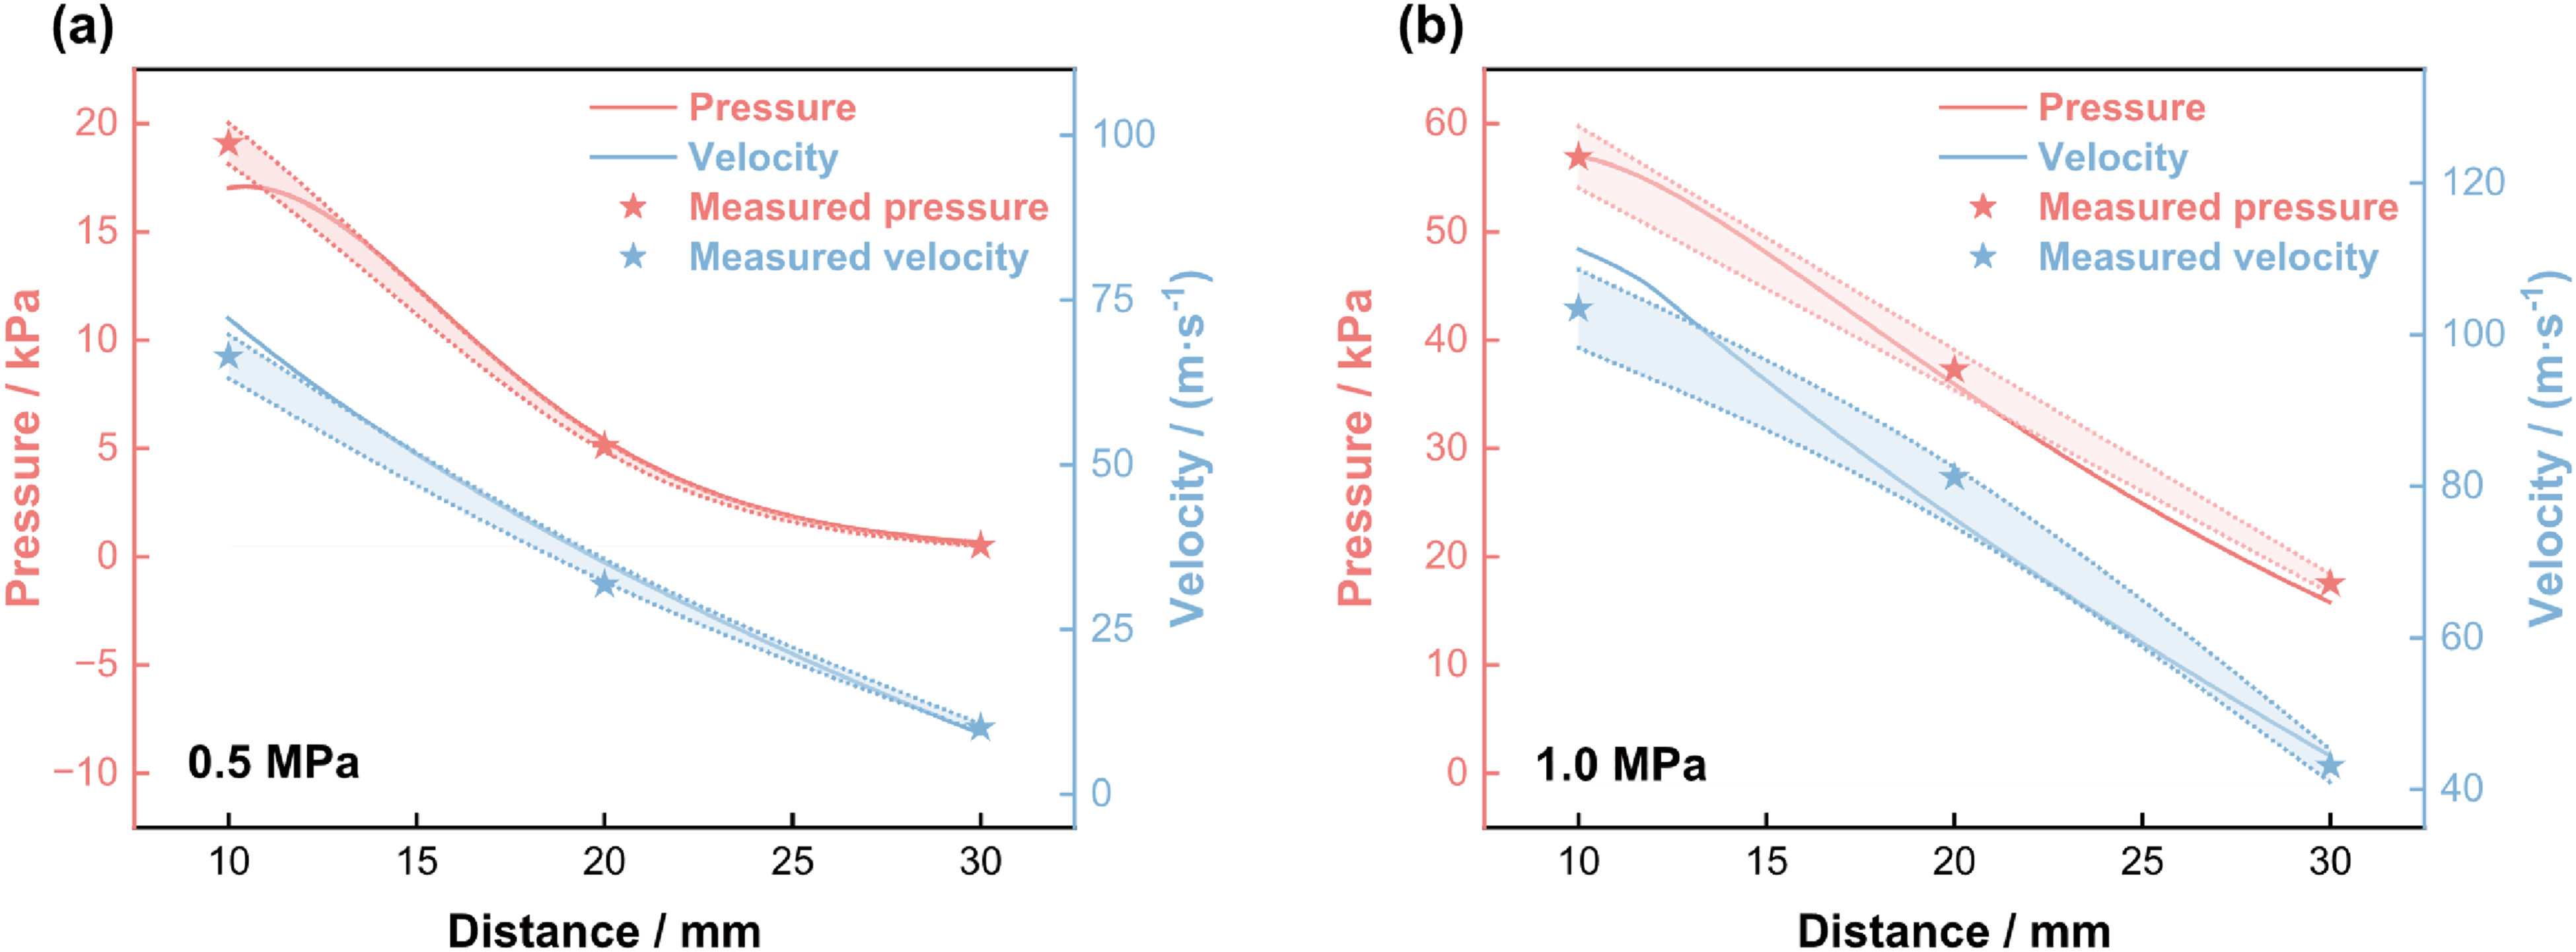
Comparison of measured and calculated flow field data under different atomization pressures: (a) 0.5 mpa; (b) 1.0 mpa.
The independence of the refined domain size for primary atomization, mesh size and solution time for secondary atomization has been validated in our previous related studies.28,29 The validation of the secondary atomization model can also be found in Ref. 29.
Industrial trials and experimental methods
Commercial iron (purity > 99.9%), silicon (purity > 99.5%), boron (purity > 99.9%) and pre-alloyed Fe-B and Fe-C alloys were proportioned according to nominal composition Fe70.8Si11.4B11.9C3.2Cr2.7 (at.%) and melted in the induction furnace. When the raw material was completely melted and the temperature reached 1573 K, the molten steel was poured into the tundish for holding. Atomization began when the preheating of the delivery tube was completed. When the atomization pressure was 3.0 MPa, industrial trials were conducted at different delivery tube diameters (1.5, 2.0, 2.3, and 2.5 mm). For different delivery tube inlet diameters, the melt mass flow rate was different and the atomization time varied. When the atomization finished, the powder accumulated in the collection tank was then collected for subsequent experiments.
The morphology of the FeSiBCCr powders was observed by scanning electron microscope (SEM, Phenom Pro Desktop SEM). The average sphericity of FeSiBCCr powders was obtained by the Phenom Prisuite Software. The d50 of the FeSiBCCr powders was measured by a laser-diffraction particle-size analyzer (BT-9300S). The phase of the FeSiBCCr powders was characterized by X-ray diffraction (XRD, D2 PHASER) with Cu Kα radiation (λ = 0.154184 nm). The crystallization enthalpy of the FeSiBCCr powders was obtained by differential scanning calorimeter (DSC, Setaram Setsys Evo) at a heating rate of 10 K·min–1. The saturation magnetization (Ms) and coercivity (Hc) of the powders were measured by vibrating sample magnetometer (VSM, Lake Shore 8604).
Results and discussion
Gas-only flow field
Table 2 lists the simulated atomization process conditions. The velocity distribution under different extrusion lengths is shown in Figure 4. The gas flow behavior in the Laval nozzle is in accordance with the one-dimensional isentropic flow theory. During the ejection of the gas from the divergent section of the Laval nozzle to the atomization chamber, the gas expands rapidly, accompanied by a rapid decrease in pressure and temperature. The velocity reaches the supersonic state rapidly, and thus a series of Prandtl-Meyer shock waves are generated in the vicinity of the jet. Under the action of shock waves, the jet contracts and expands periodically, accompanied by energy loss. In the downstream region, the jet pressure is comparable to the ambient pressure and the flow field stabilizes. Due to the shifting in the gas motion direction, a recirculation zone is thus generated below the delivery tube where the shock wave is fully developed (marked by the black line in the Figure 4). Some gas may leave the recirculation zone under the driving effect of the surrounding supersonic jets, and some supersonic jets may enter the recirculation zone due to the energy loss, and the difference between the two flow rates determines the pressure in the recirculation zone. 26 When the pressure within the recirculation zone is positive, the pressure direction is opposite to the direction of gravity; when the pressure within the recirculation zone is negative, the pressure direction is the same as the direction of gravity. 32
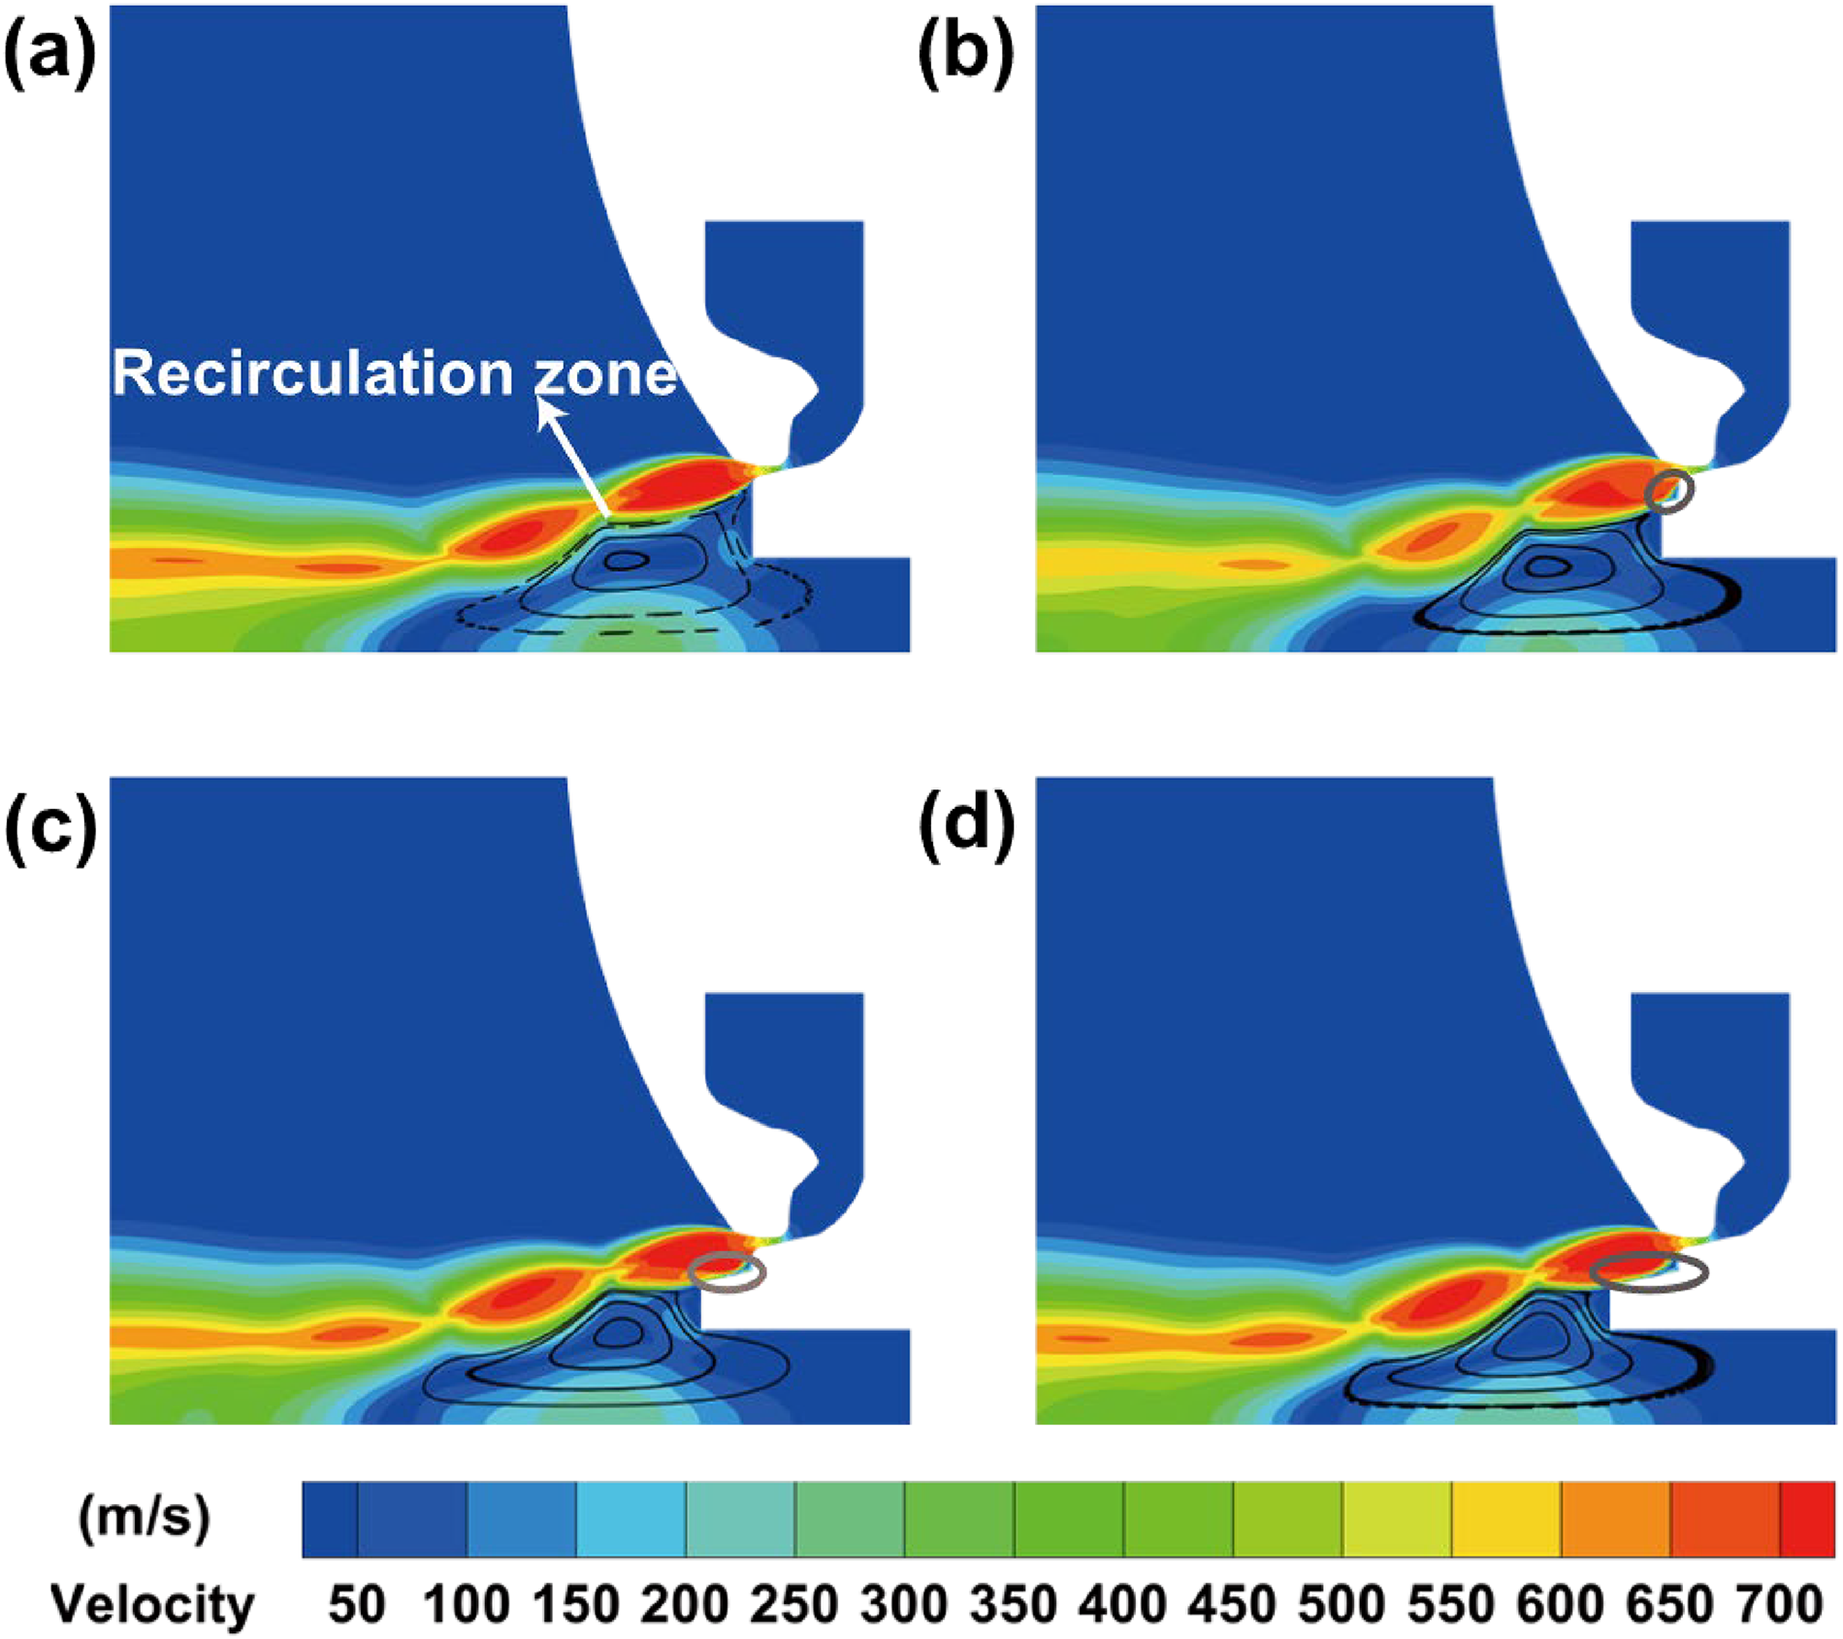
Velocity contour under different extrusion lengths of delivery tube: (a) 0 mm; (b) 1 mm; (c) 3 mm; (d) 5 mm.
Atomization technological parameters used for simulation.
As can be seen in Figure 5(a), the pressure below the delivery tube is positive when L is 0, 1 and 3 mm. While the pressure below the delivery tube is negative when L is 5 mm, and the recirculation zone exhibits a suction effect on the melt. For the stationary point, i.e., the location corresponding to the maximum pressure in the recirculation zone, it can be found that the extrusion length has a significant effect on the pressure at the stationary point. When L is increased from 0 mm to 5 mm, the pressure at the stationary point is decreased from −4.4 kPa to −31.6 kPa. Figure 5(b) shows the velocity distribution of the flow field at the center axis. Combined with Figure 4(a)–(d), it can be seen that with the increase of L to more than 0 mm, the collision of the jet with the outer wall of the delivery tube results in the energy loss and the shift of jet direction. This may be the reason why the position of the recirculation zone moves downward as L increases. Moreover, when L is increased, the energy loss is increased, and the velocity in the recirculation zone and the length of the recirculation zone are decreased. Since the effect of the delivery tube diameter on the gas-only flow field is almost negligible, only the extrusion length is discussed in this section.
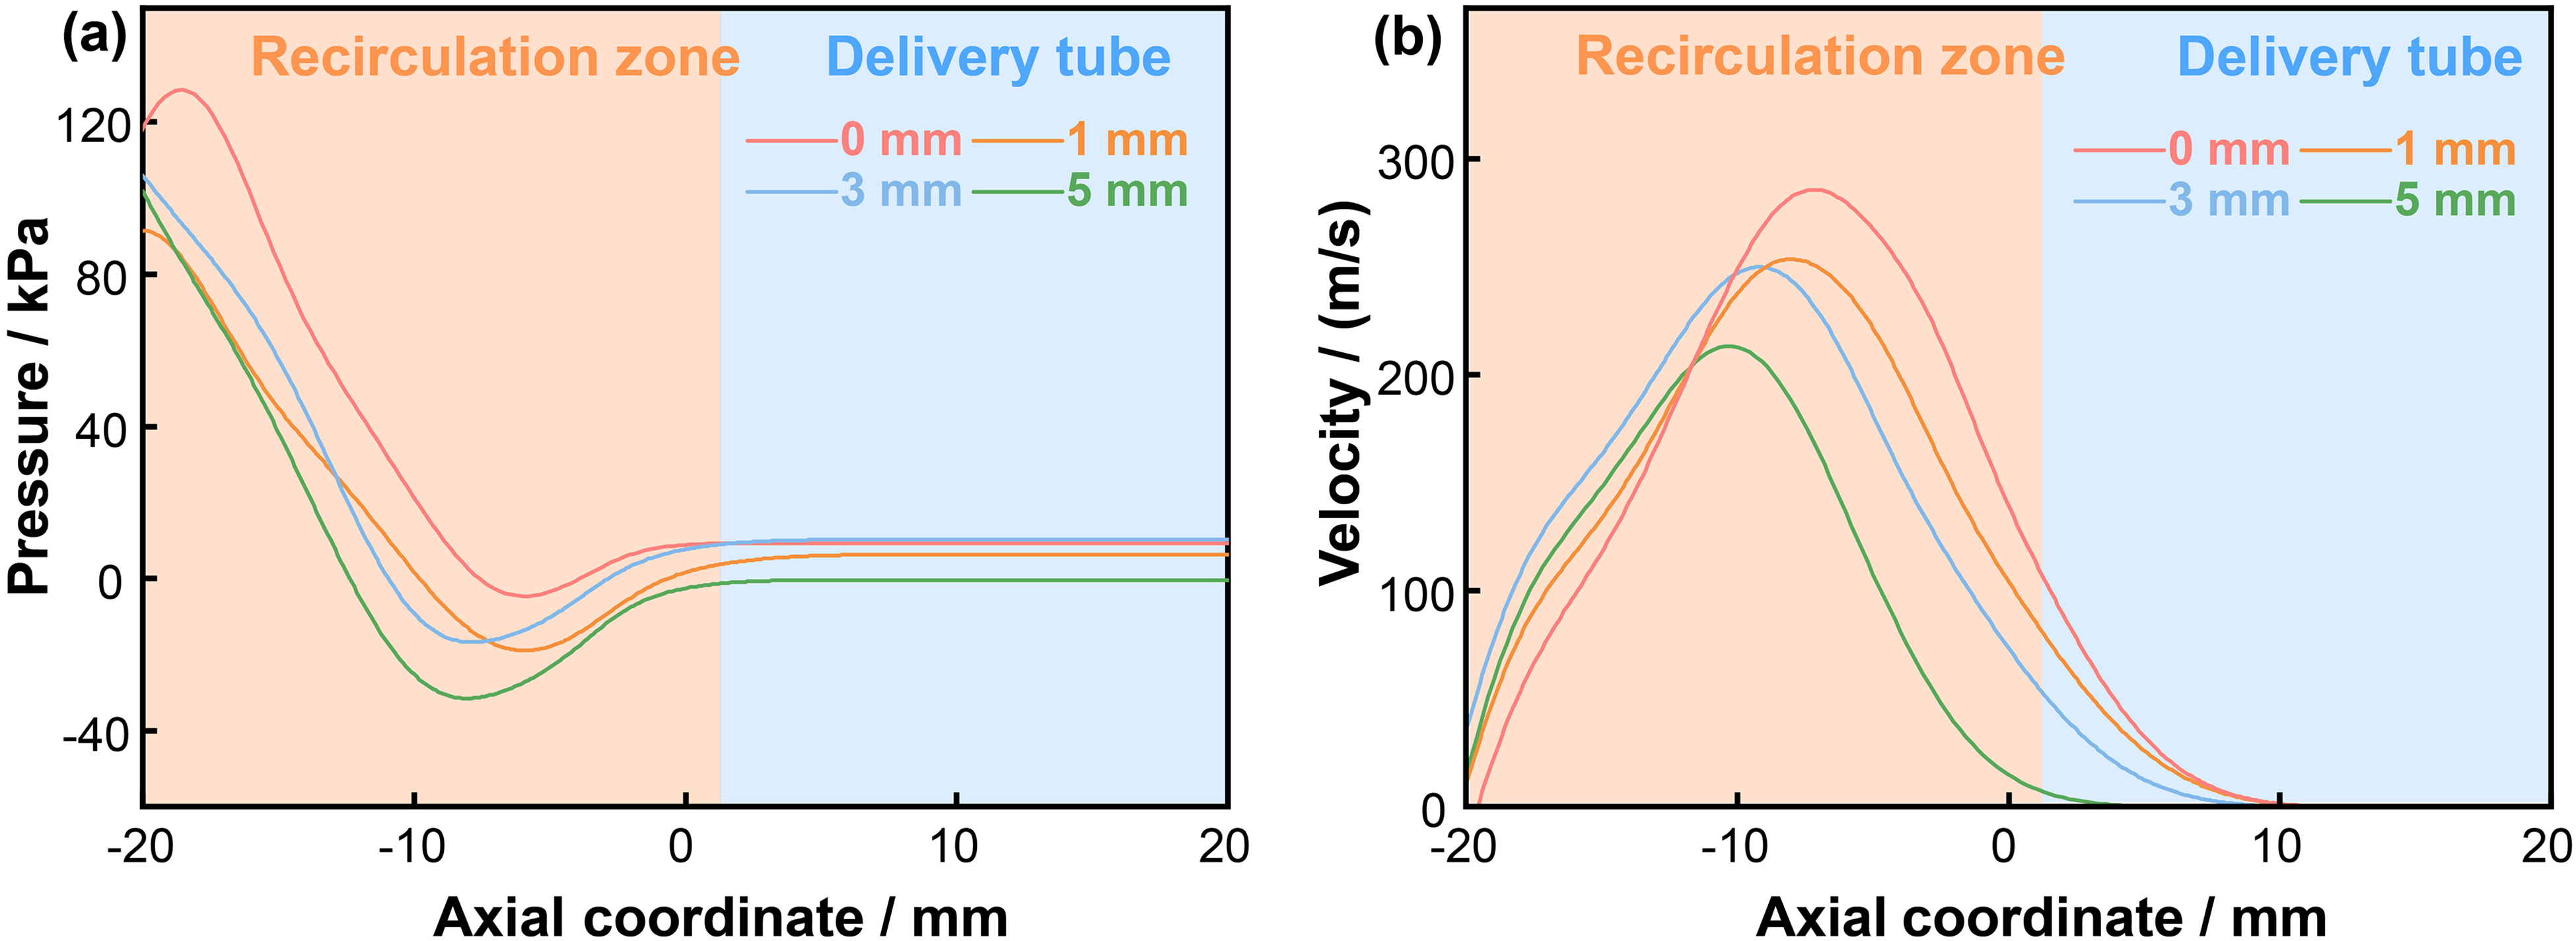
Axial distribution of pressure (a) and velocity (b) under different extrusion lengths of delivery tube.
Melt breakup during primary atomization
Figure 6 shows the primary atomization process of the melt under different extrusion lengths. As shown in Figure 6(a), when L is 0 mm, the melt flows to the vicinity of the delivery tube outlet, and the melt converges into a crown shape to overcome the resistance (t = 45.0 ms). As the liquid column flows downward, the tip of the column gradually develops from crown-shaped to umbrella-shaped, and the downstream melt ends start to touch the inner wall of the delivery tube (t = 46.5 ms). When t = 59.5–60.0 ms, the liquid column does not move further downward, and the downstream deformed film is broken into small droplets and backflows due to the action of the recirculation zone (white arrow in the figure). From the enlarged figure, since the size and velocity of the broken droplets are different, a large number of fused droplets formed due to droplet collisions can be observed. When L = 0 mm, the pressure at the outlet of the delivery tube is high, the suction effect is weak, and the position of the recirculation zone is too high, resulting in the melt not even smoothly flowing out of the delivery tube, which may easily cause clogging accidents. When L is increased to 1 mm, the downstream liquid film deforms significantly at a large angle under the gas shock (t = 47.5 ms). Driven by self-gravity, the liquid column flows out of the delivery tube and fragments, but most of droplets still return to the delivery tube against the flow. Combined with Figure 5, it can be seen that when L = 1 mm and L = 3 mm, the two flow field distributions are similar, and the gas suction effect under the delivery tube is not significantly improved, so the melt fragmentation in Figure 6(c) is close to that in Figure 6(b). When L is increased to 5 mm, the suction effect is significantly enhanced, and the liquid column can smoothly flow out of the delivery tube and enter the recirculation zone (t = 64.0 ms). The liquid film on both sides extends radially at the wall and is directly fragmented into small droplets by the jet (t = 64.0–67.0 ms). In summary, the suction effect is enhanced and the clogging is avoided when L = 5 mm, and then L = 5 mm is selected for subsequent calculation.
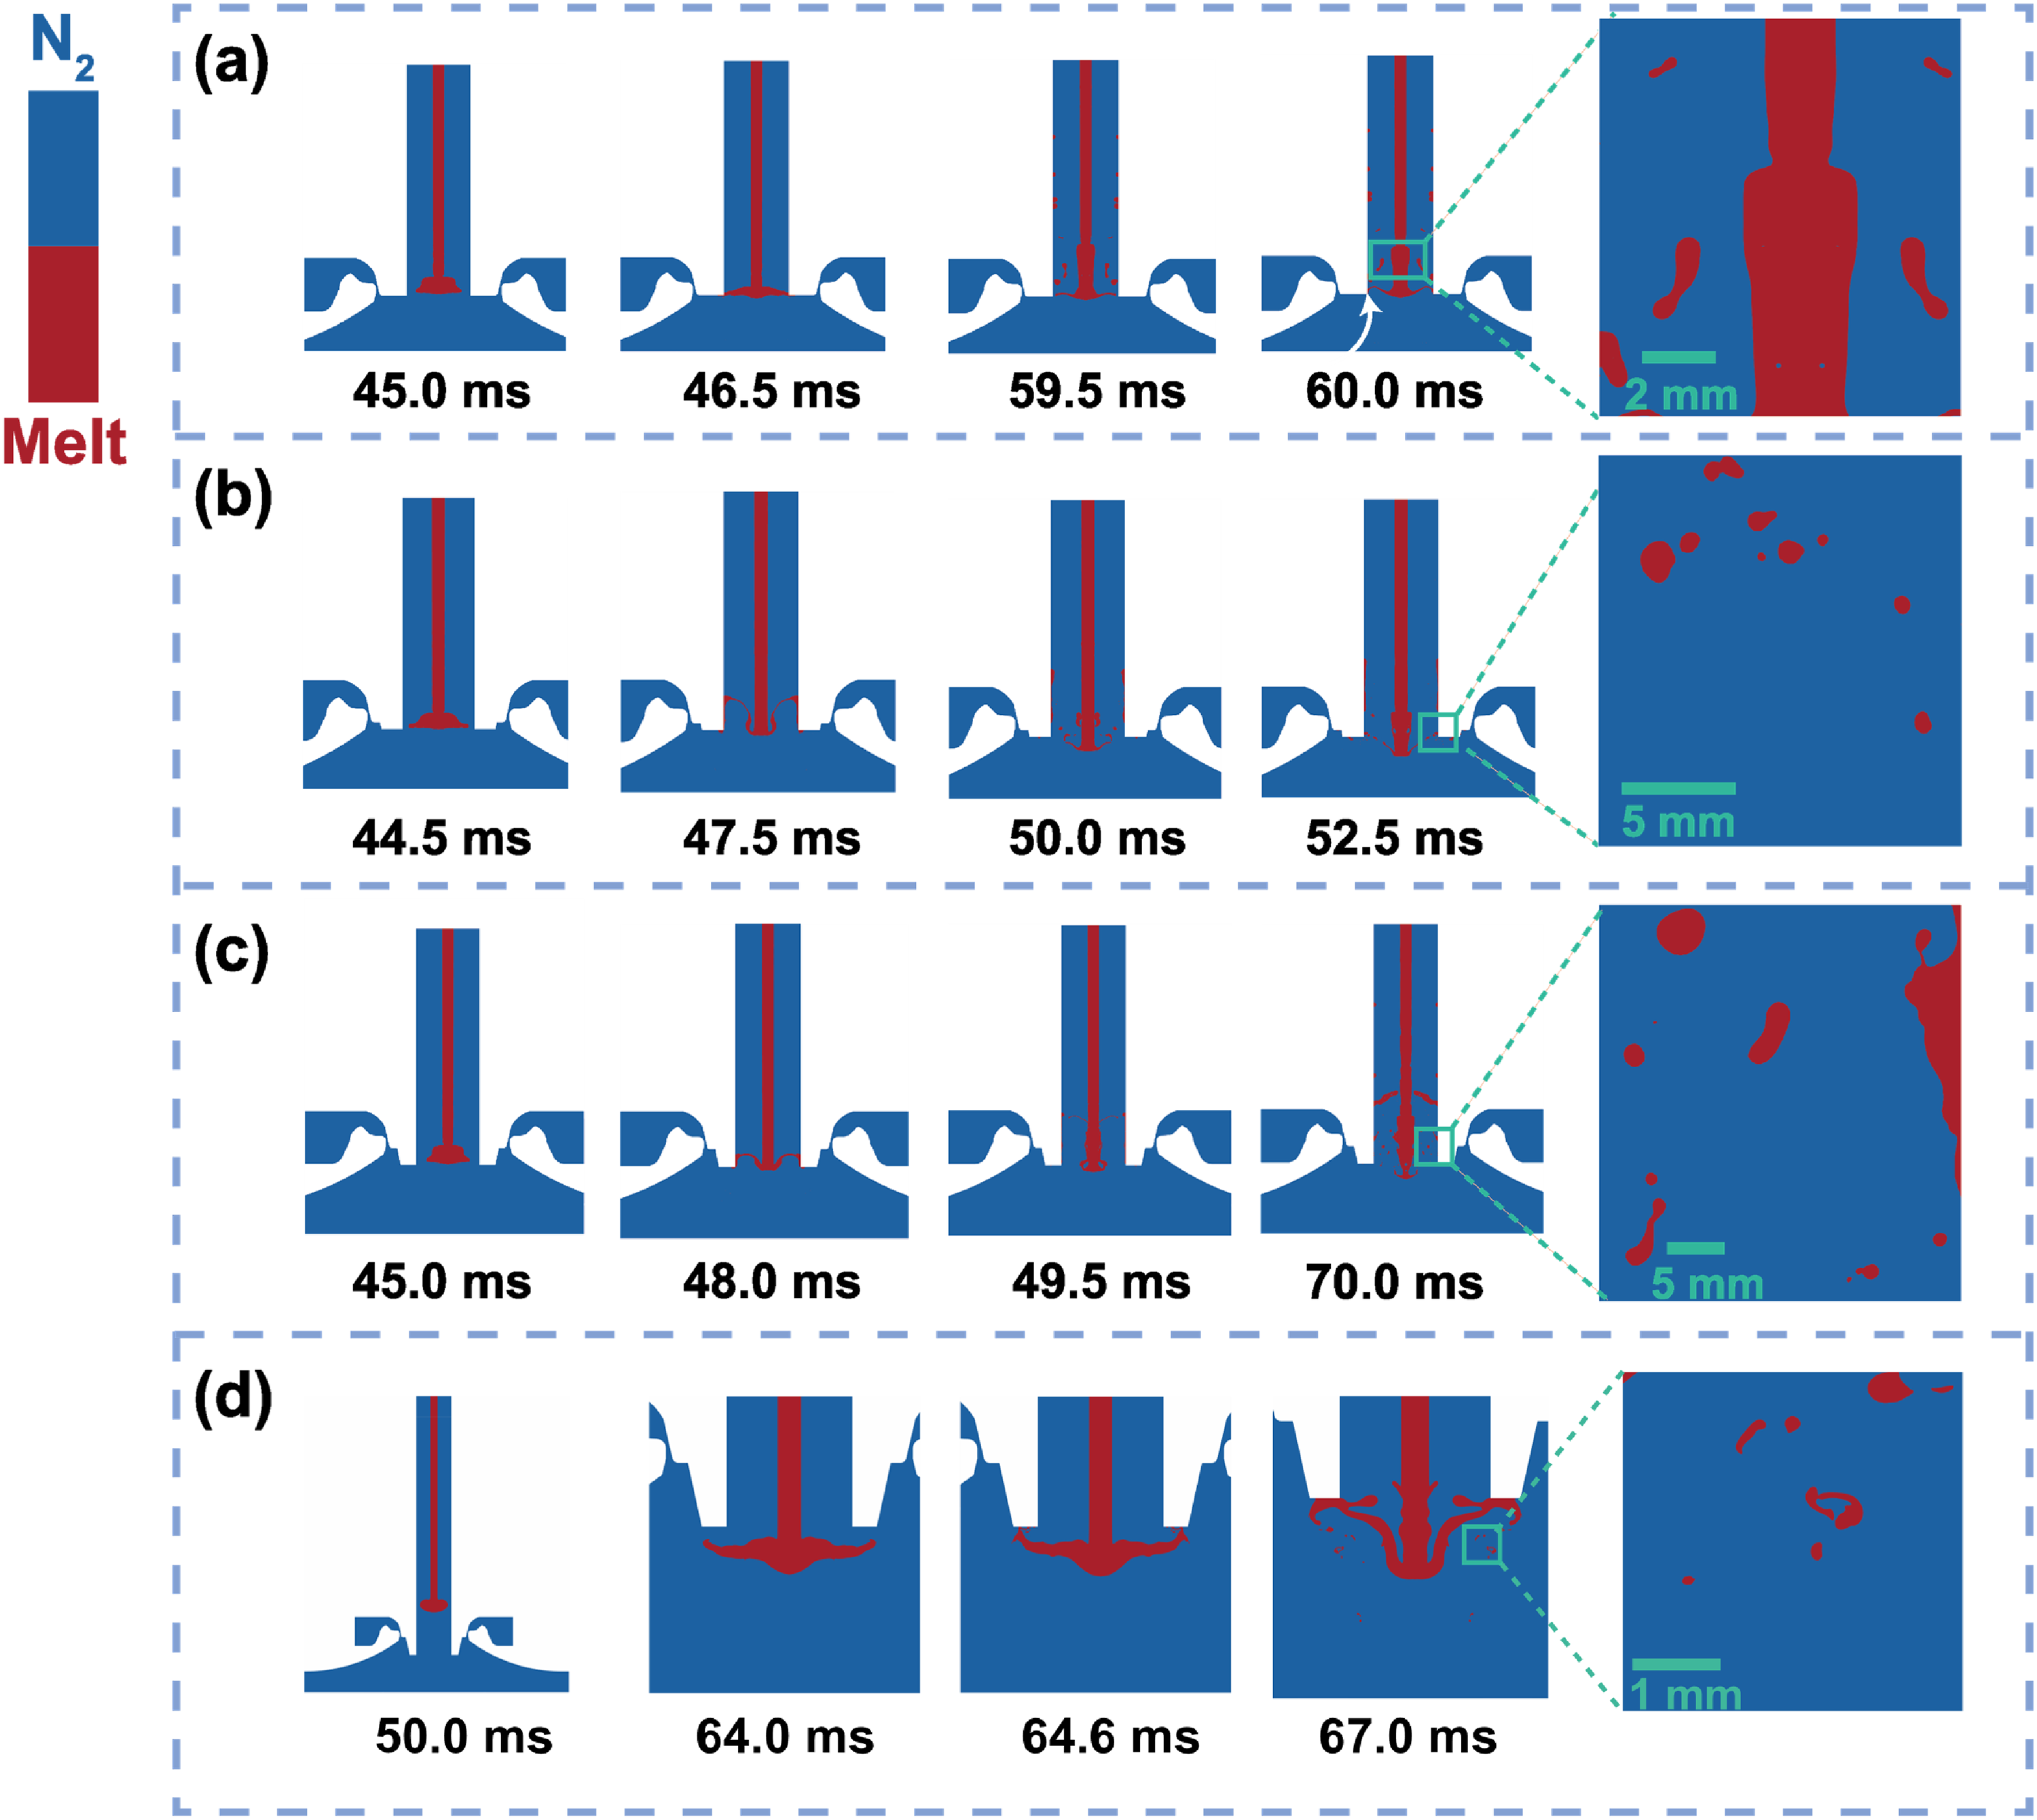
Primary atomization process under different extrusion lengths of delivery tube: (a) L = 0 mm; (b) L = 1 mm; (c) L = 3 mm; (d) L = 5 mm. The magnification displays droplet morphology after fragmentation.
The primary atomization process under different delivery tube diameters is shown in Figure 7. In Figure 7(a), the tip of the liquid column maintains a spherical shape under the effect of surface tension (t = 50.0 ms) during falling. To overcome the drag force, the tip starts to converge as the liquid column approaches the outlet of the delivery tube and extends radially to the inner wall (t = 54.0–55.1 ms). As the melt mass flow rate is small when d is 1.5 mm, the gas-to-melt ratio increases, and the edge liquid film is sufficiently fragmented by the jet. As seen in the enlarged figure, the average droplet size is only 0.05 mm. As shown in Figure 7(c), when d is increased to 2.3 mm, the downstream driving force of the liquid column increases with the increase of the melt mass flow rate. A velocity gradient is generated between the liquid core and the edge film in the vertical direction, and the edge liquid film is in a “V” shape due to the velocity difference (t = 50.0 ms). At t = 51.5 ms, the tip of the liquid core moves to the outlet of the delivery tube and gradually deforms into umbrella shape, while the V-shaped film separates from the tip and is located at the upstream of the liquid column due to the lower velocity. The downstream liquid film separates from the liquid column and fragments under the jet impact (the broken sub-droplets are marked with white circles). Moreover, the upstream liquid film, which extends along the radial direction, also starts to deform and is ready to break up (t = 56.0–56.5 ms). In the enlarged figure, some elongated and satellite-shaped droplets can be observed. When d is increased to 2.5 mm, the falling velocity of the liquid column is further accelerated, and the liquid film on both sides is separated from the liquid core during the downflow process and is gradually spheroidized under the action of surface tension (t = 30.0–47.0 ms). At t = 54.0 ms, the liquid column enters the recirculation zone, and the liquid film on both sides is broken under the impact of the jet. Combined with the results of the average droplet diameter in Table S1, it can be found that due to the decreased gas-to-melt ratio, the breakup efficiency decreases, and the average droplet diameter increases from 0.05 mm at d = 1.5 mm to 1.10 mm at d = 2.5 mm. In addition, the number of irregularly shaped droplets also increases with the increase of the delivery tube diameter since the spheroidization time of the droplets is proportional to the fourth power of the droplet diameter. 33 Therefore, it can be assumed that it is easier to obtain spherical fine powder as the delivery tube diameter decreases.
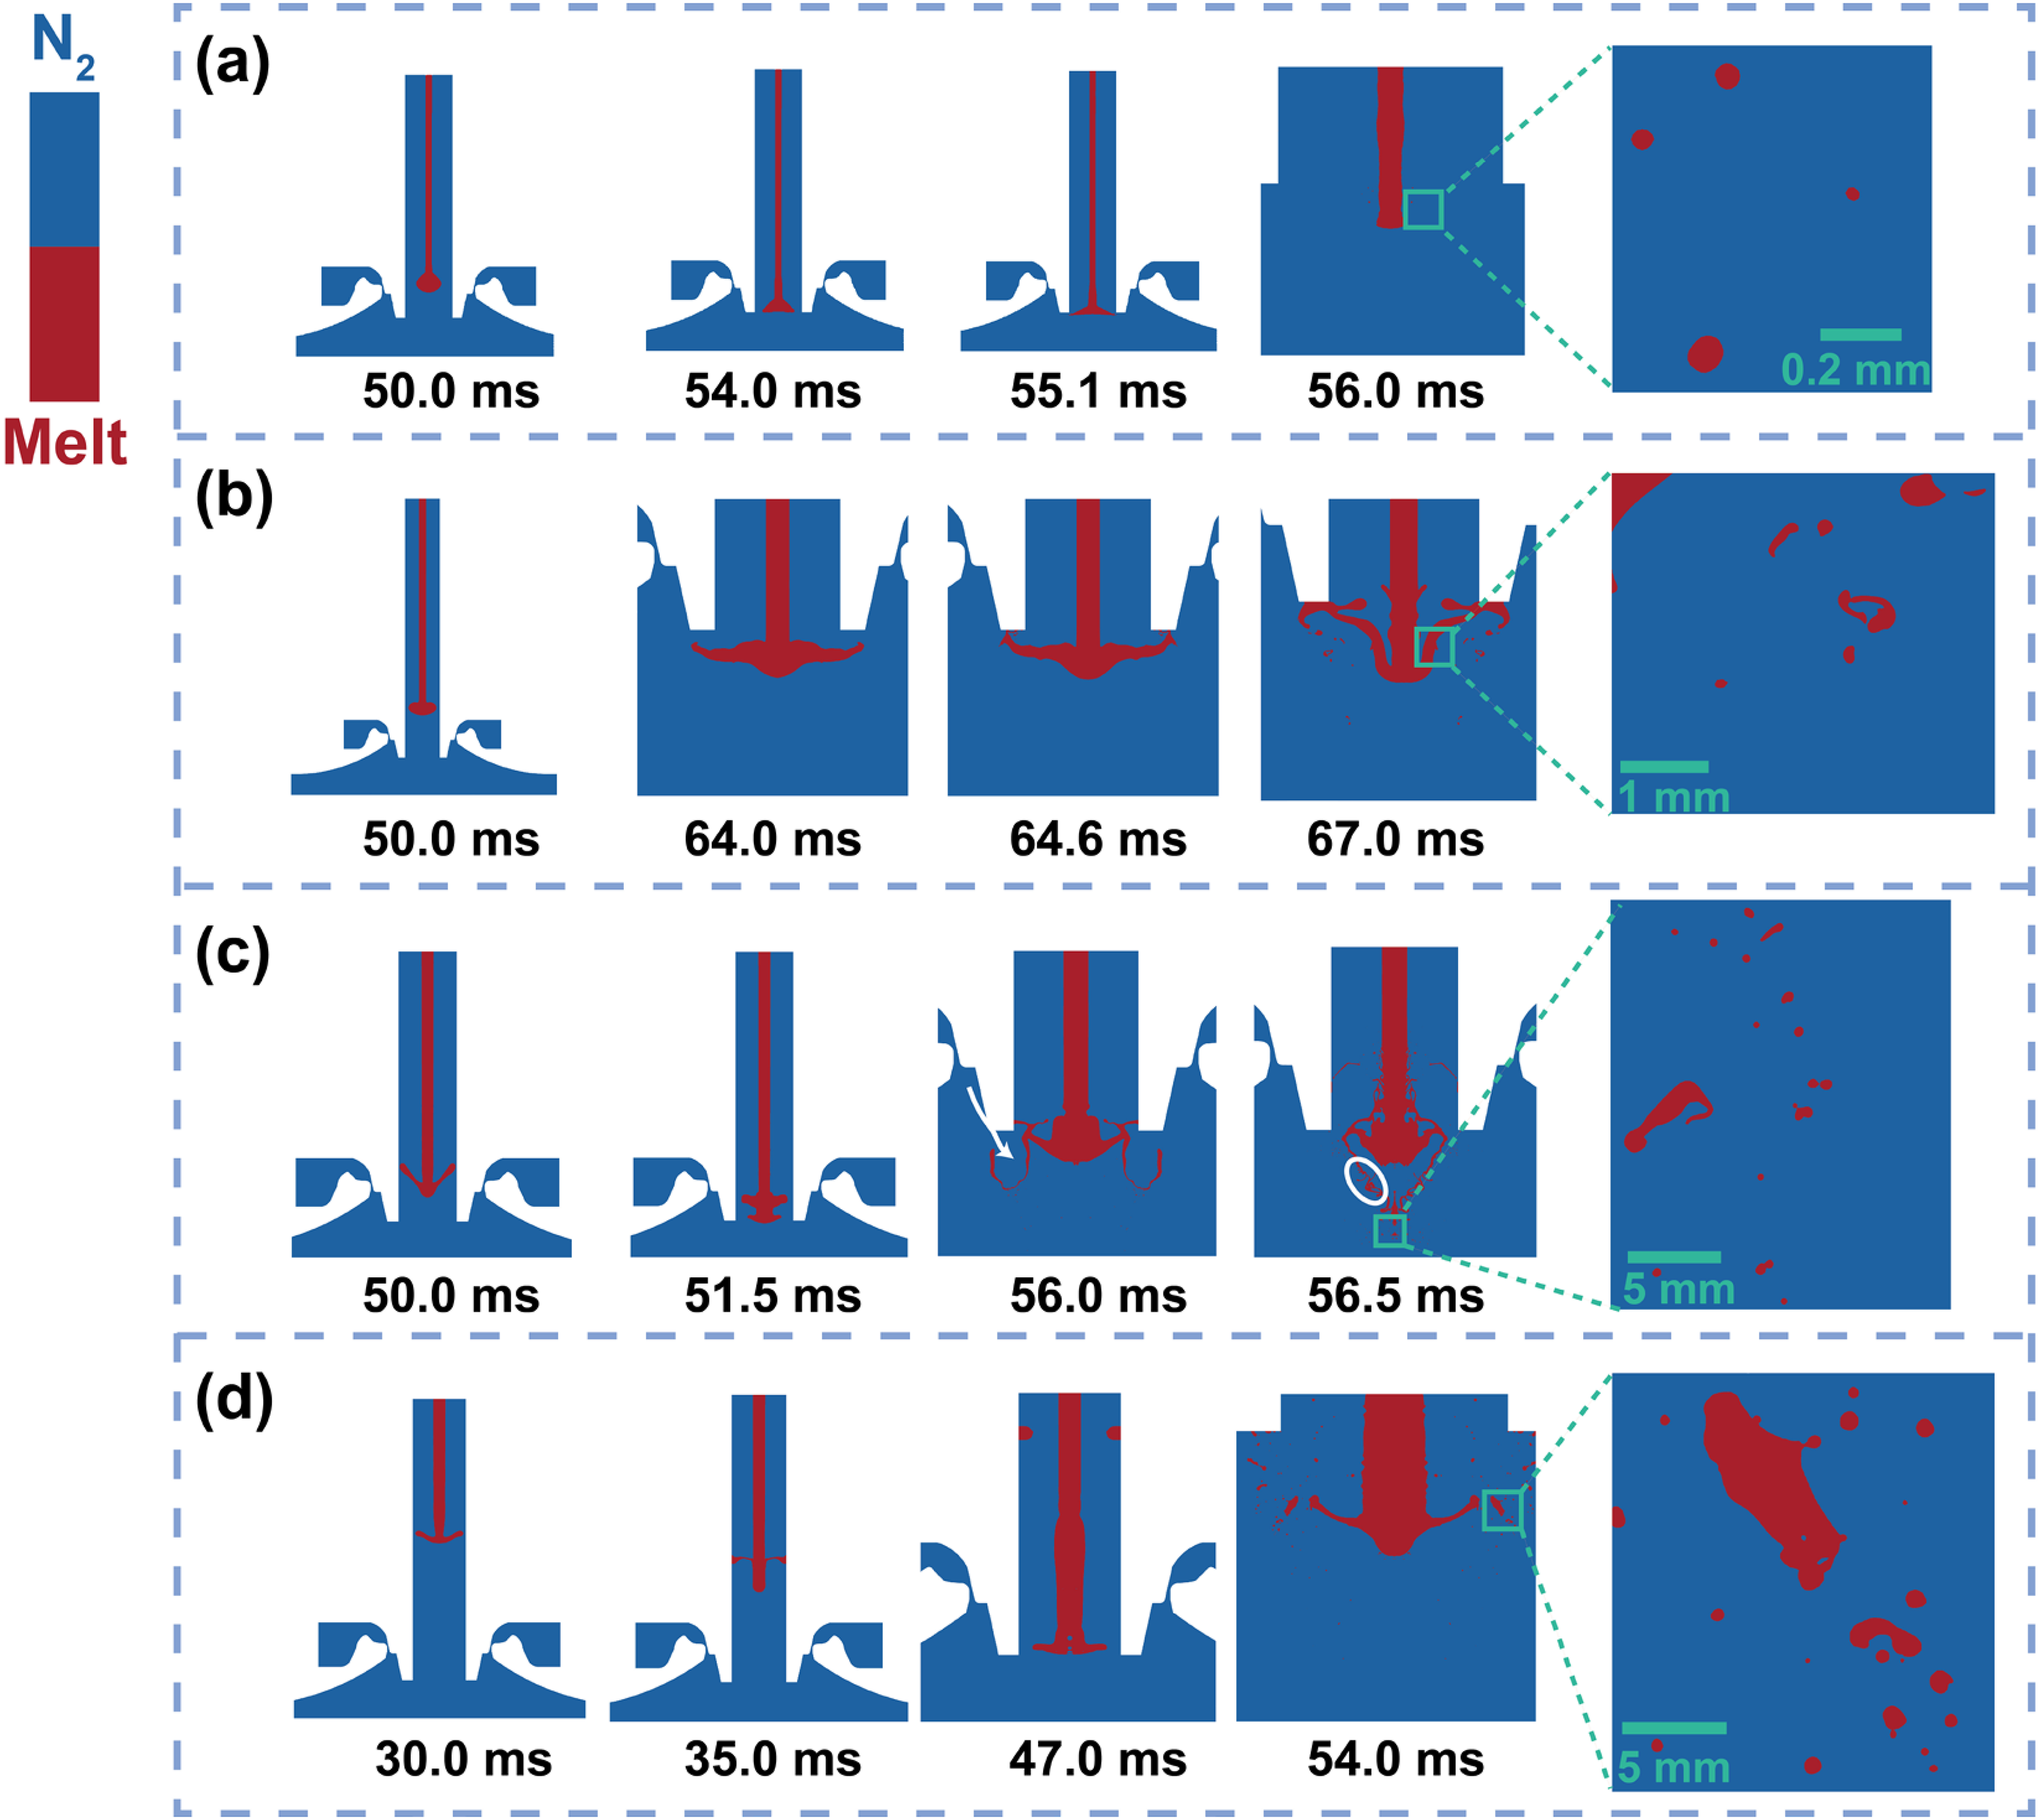
Primary atomization process under different delivery tube diameters: (a) d = 1.5 mm; (b) d = 2.0 mm; (c) d = 2.3 mm; (d) d = 2.5 mm. The magnification displays droplet morphology after fragmentation.
Particle information during secondary atomization
Under the condition of d = 2.0 mm and L = 5 mm, the characteristics of the particle flight trajectory and physical distribution obtained from secondary atomization calculations are shown in Figure 8. Combined with the characteristics of the velocity distribution in Figure 4, it can be seen that the velocity in the center region of the atomization cone is small, while the velocity at the edge is high. The droplets located near the supersonic boundary get high acceleration driven by the jet and are sufficiently fragmented to less than 20 μm, while the droplets in the center region keep low velocity and are not sufficiently fragmented due to the weak driving force. As a result, the droplet population located at the periphery of the atomization cone is sufficiently fragmented (as evidenced by low We numbers), with small diameter, high velocity and low temperature, while the droplets located in the central region of the atomization cone are insufficiently fragmented (as evidenced by high We numbers), with large diameter, low velocity and low temperature.
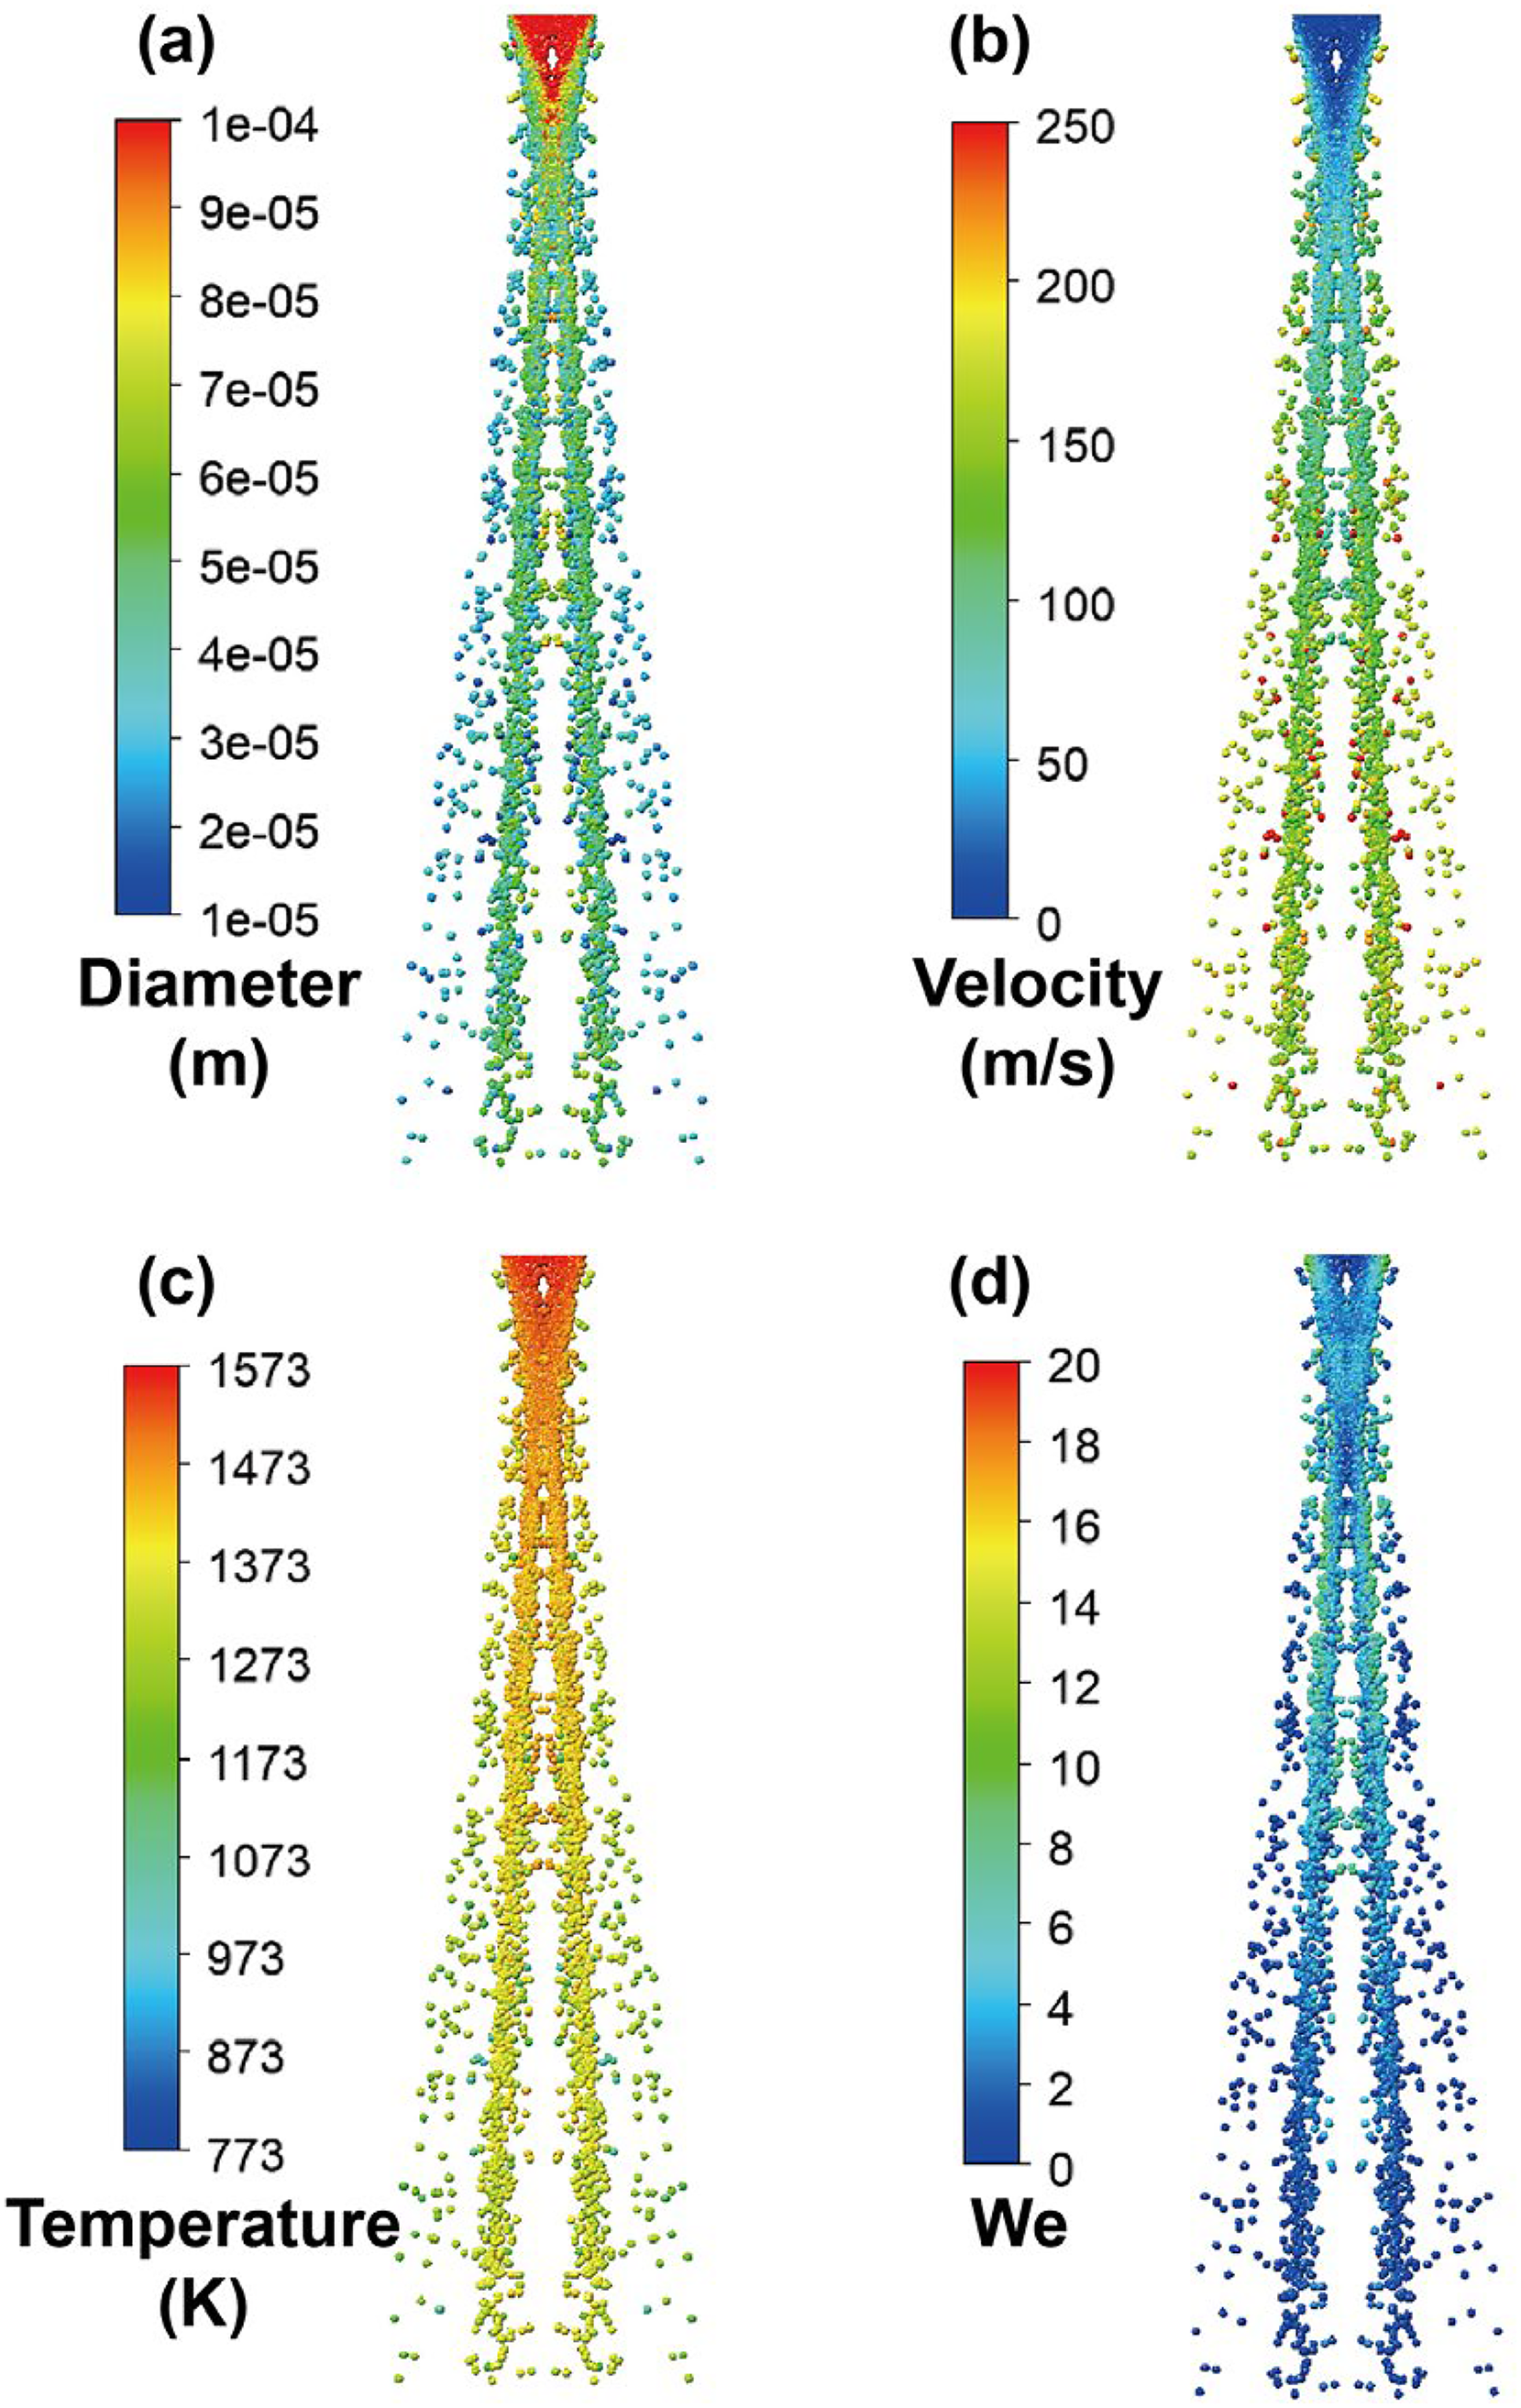
Particle distribution characteristics during secondary atomization: (a) diameter; (b) velocity; (c) temperature; (d) we.
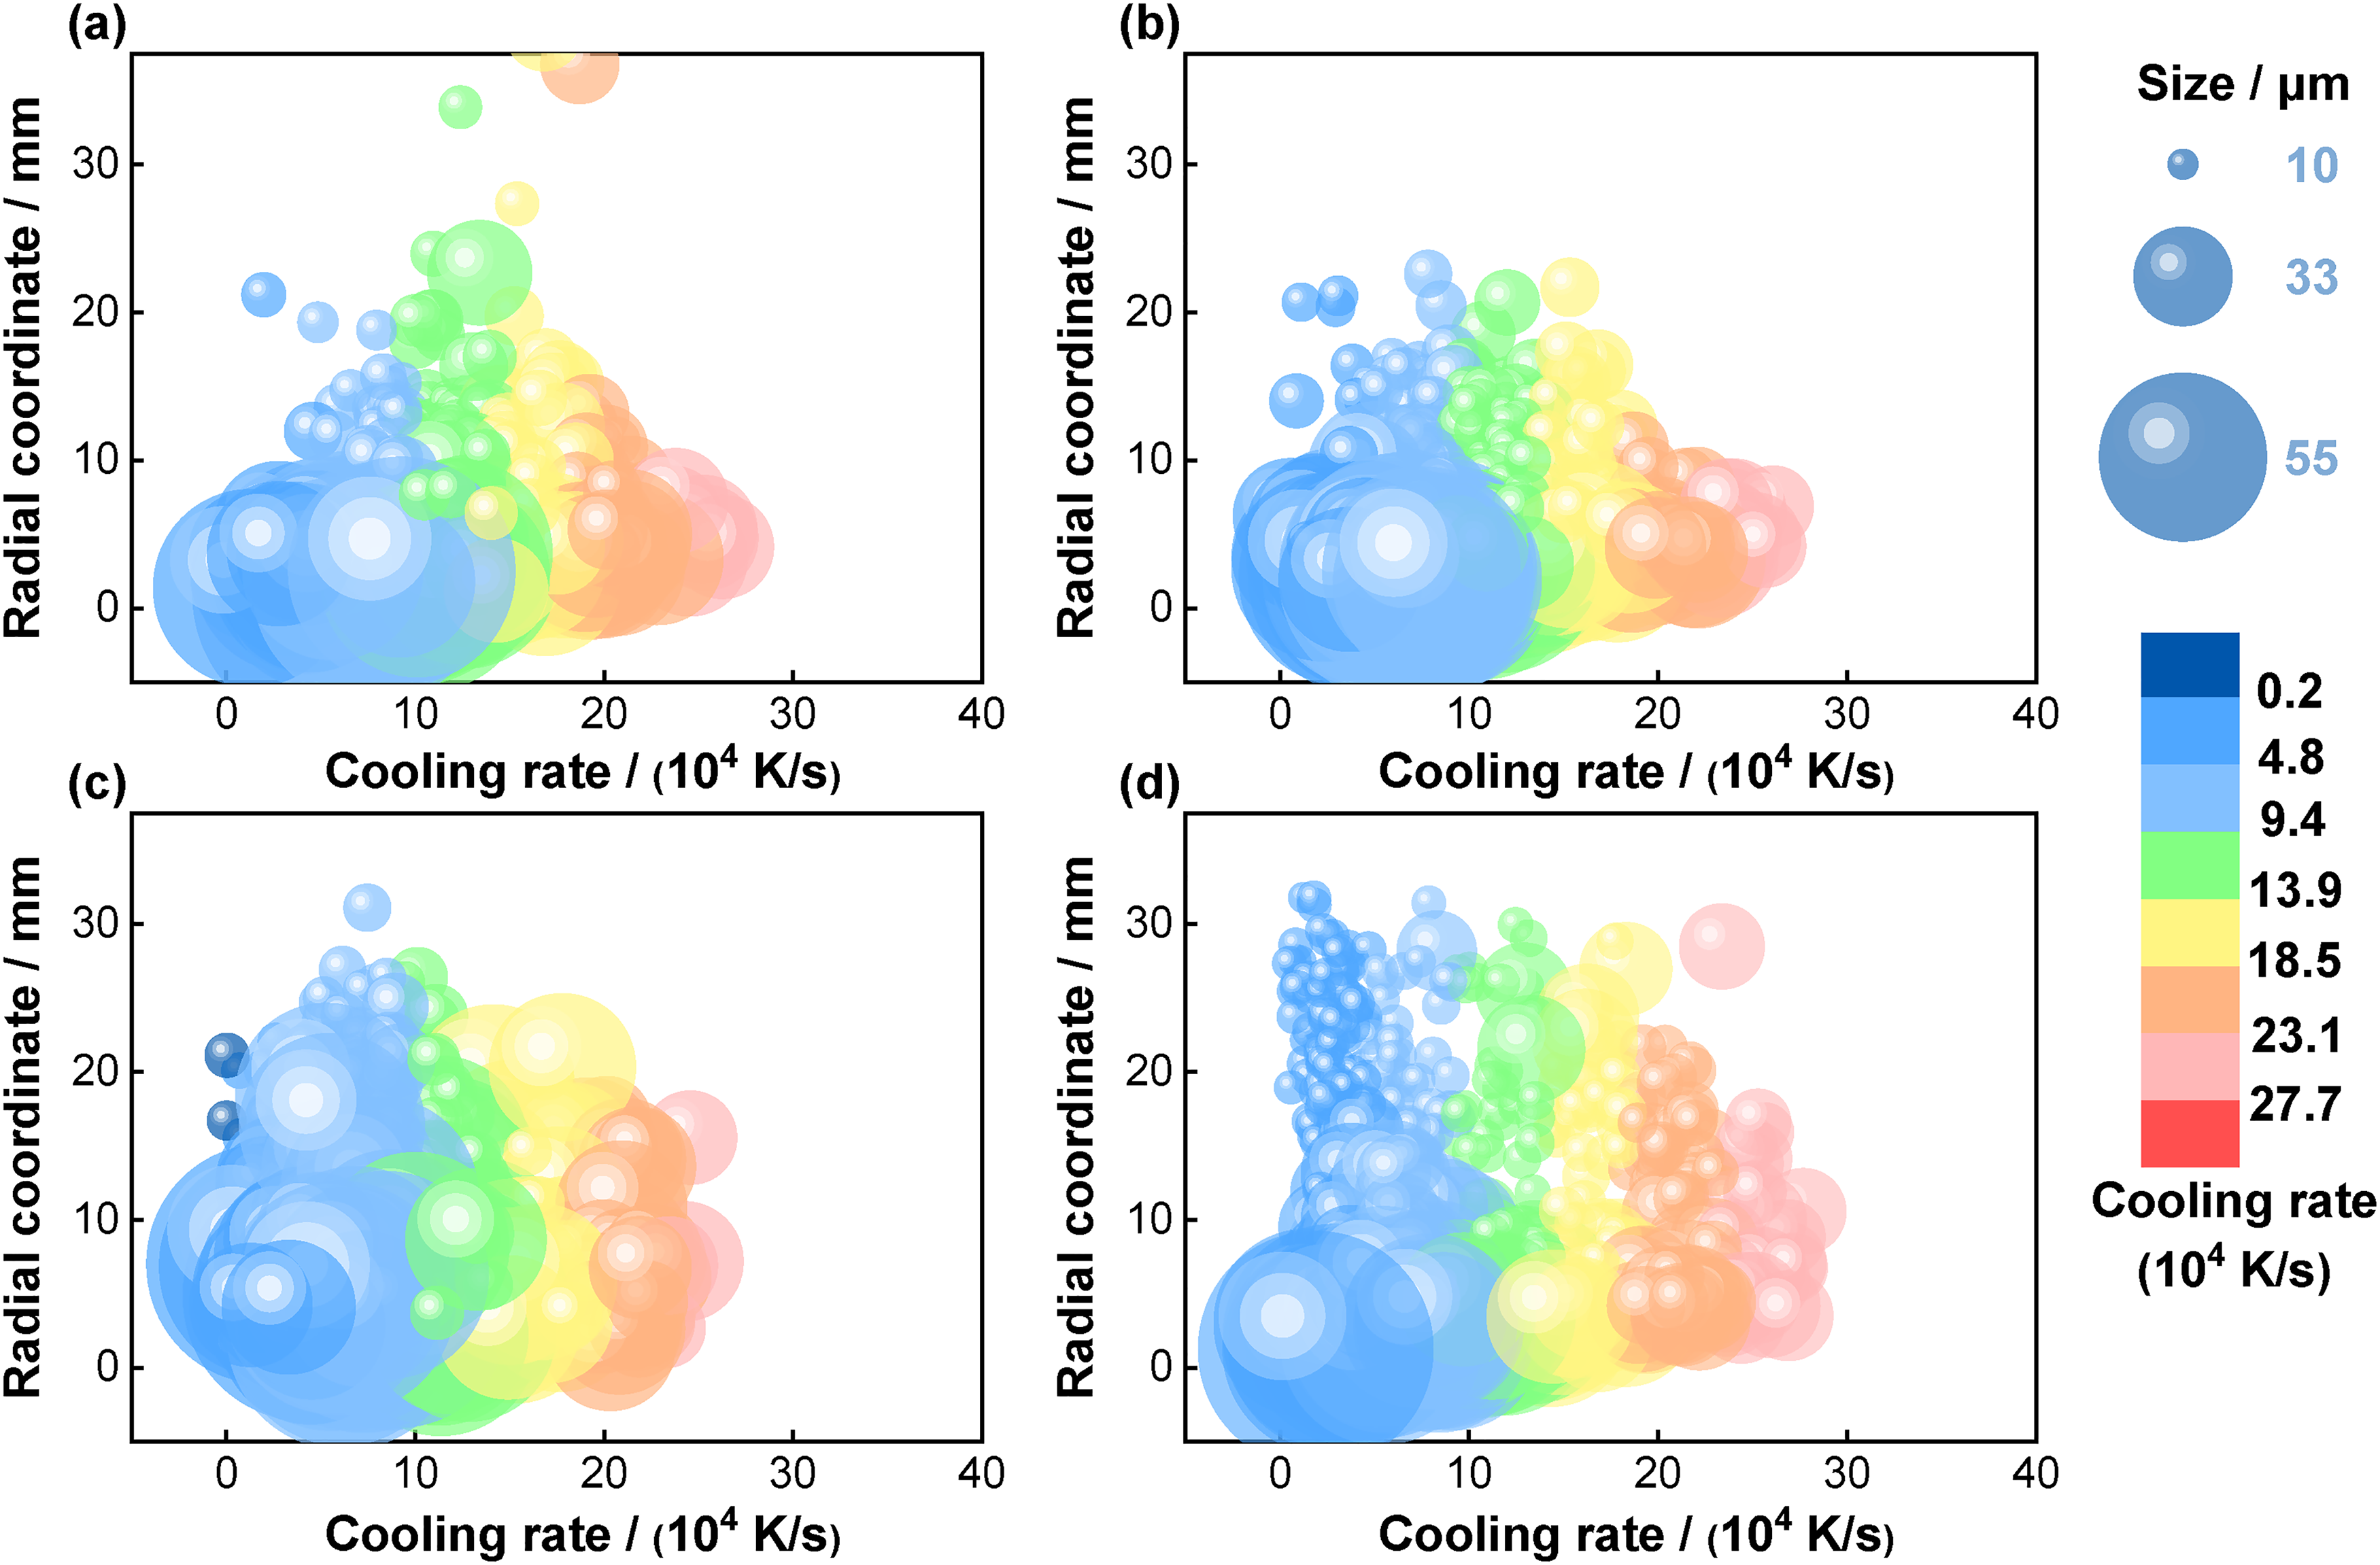
The average cooling rate va and median diameter d50 (mass-weighted) for different d and L are summarized in Table 3. The physical information of particles is sampled at the bottom of the atomization chamber. In addition, one thousand particles are randomly selected to plot the schematic distribution of particle diameters versus cooling rates along the radial direction at the bottom of the atomization chamber, and the distribution at different extrusion lengths is shown in Figure 9. Large droplets are mostly distributed in the center region, and the cooling rate of large droplets is generally lower than that of small droplets due to lower heat transfer coefficient. 20 When L is 0 mm, the jet is not deflected by the collision with the outer wall of the delivery tube, resulting in the largest possible radial displacement and dispersion angle of the atomization cone. Combined with data in Table 3, it can be observed that even neglecting the large droplets that backflow at L = 0–3 mm, it is still at L = 5 mm that the average droplet diameter is the smallest and the cooling rate is the fastest. For L = 0, 1 and 3 mm, on the one hand, the delivery tube is prone to clogging due to the weak suction effect; on the other hand, the droplets cannot be efficiently fragmented by the jet due to the large range of the recirculation zone.
Distribution of particles with different sizes and cooling rates along radial direction for different extrusion lengths of delivery tube: (a) L = 0 mm; (b) L = 1 mm; (c) L = 3 mm; (d) L = 5 mm.
Calculated va and d50 under different atomization technological parameters.
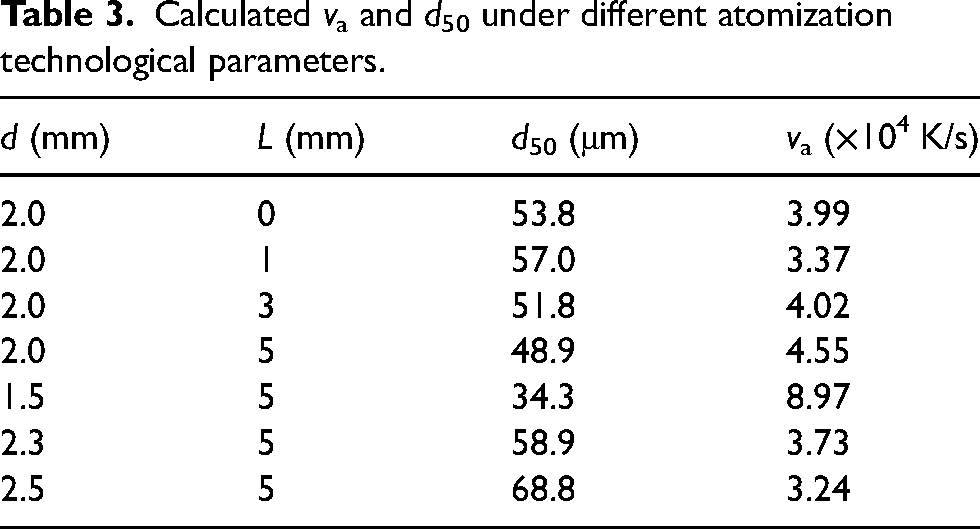
Under different delivery tube diameters, the diameters and cooling rates of particles along the radial direction are shown in Figure 10. When d = 1.5 mm, the droplets are sufficiently fragmented, most droplets are less than 50 μm in diameter, and cooling rates of some droplets can reach more than 106 K/s. As d is increased above 2.0 mm, the number of large particles increases significantly and the particle cooling rates decrease significantly as shown in Figure 10(b)-(d). Therefore, as d is increased from 1.5 mm to 2.5 mm, the d50 is increased from 34.3 to 68.8 μm, and the va is decreased from 8.97 × 10⁴ K/s to 3.24 × 10⁴ K/s.
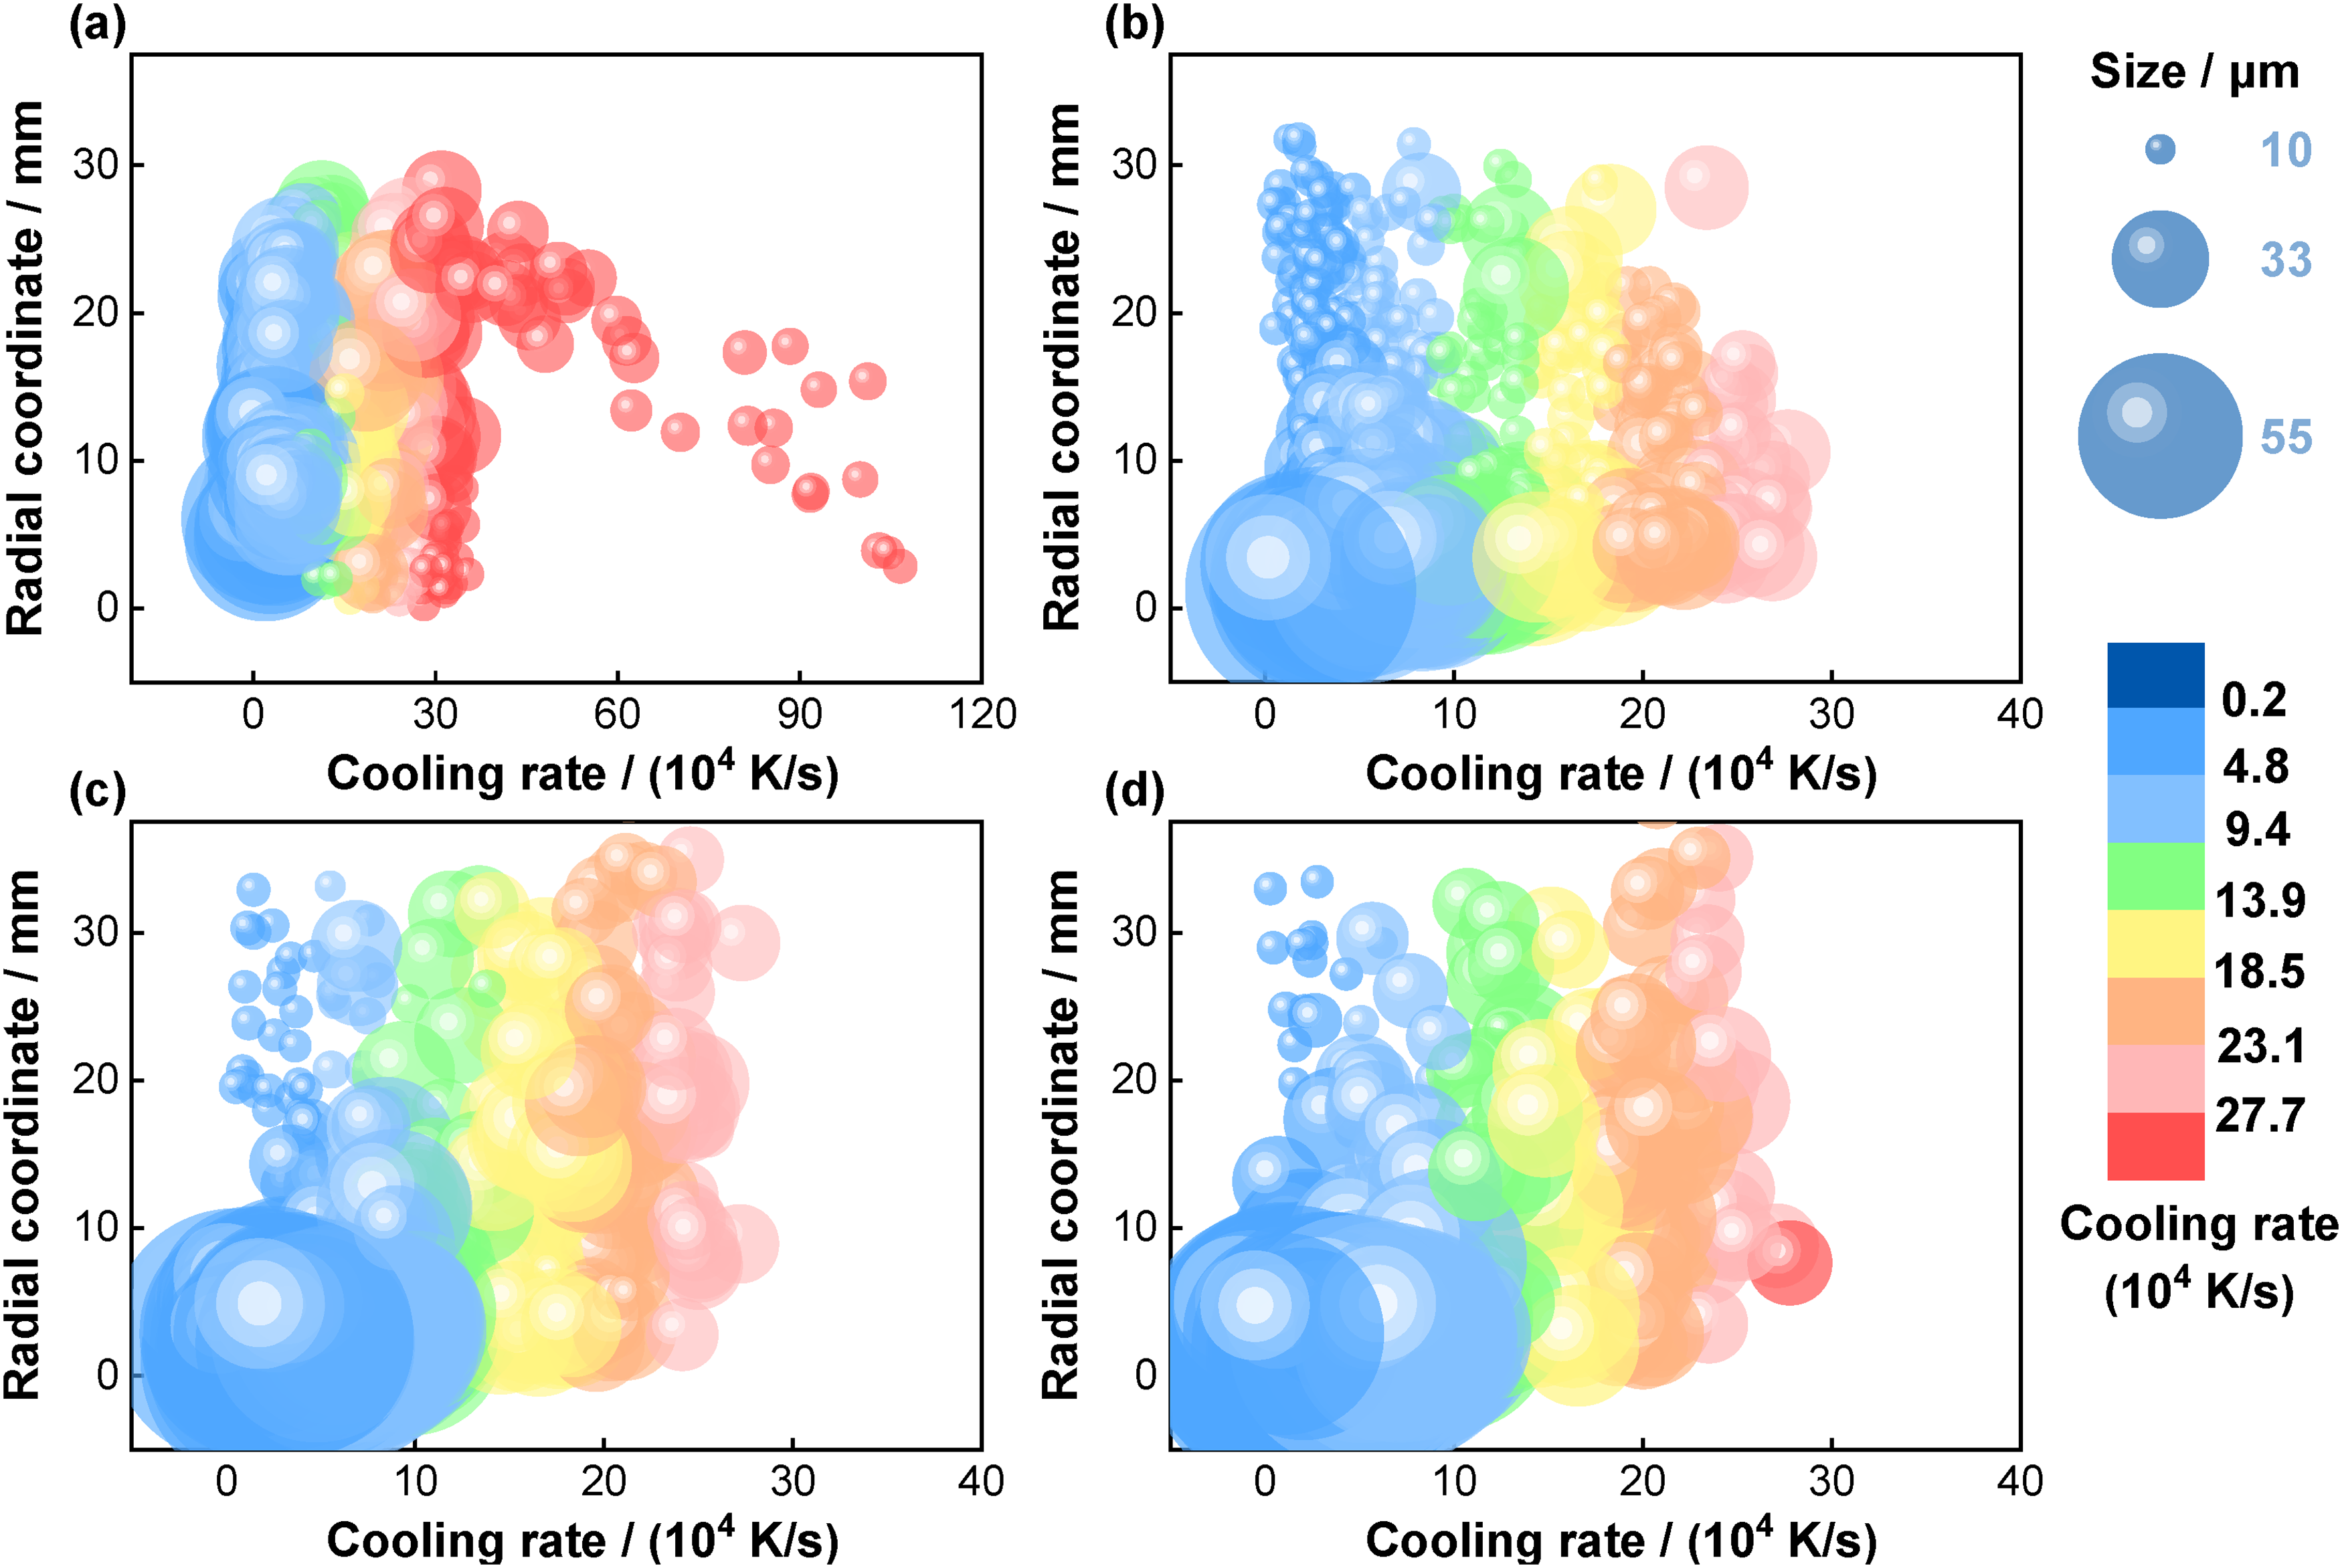
Distribution of particles with different sizes and cooling rates along radial direction for different delivery tube diameters: (a) d = 1.5 mm; (b) d = 2.0 mm; (c) d = 2.3 mm; (d) d = 2.5 mm.
Based on the above simulation results, a moderate increase in the extrusion length can promote the atomization compliance and reduce the range of the recirculation zone, which can effectively improve the breakup efficiency and cooling ability of atomization. For the conventional delivery tube structure, although reducing the delivery tube diameter is beneficial to the production of fine powder, the risk of clogging also increases. As for the inlet-limited delivery tube used in this study, when a small delivery tube diameter is used, there is sufficient margin between the liquid column and the inner wall of the delivery tube, which can effectively suppress the risk and hazard of clogging. Therefore, based on the simulation results, the delivery tube configuration with L = 5 mm and d = 1.5 mm is considered optimal. Industrial trials under different delivery tube diameters are discussed subsequently due to the risk of clogging at L = 0–3 mm.
Industrial trials under different delivery tube diameters
When the atomization pressure is 3.0 MPa, the SEM photographs of the powders produced under different delivery tube diameters and the results of the sphericity of the particles in different sizes are shown in Figure 11. Wherein, the sphericity of each particle and the volume-weighted average sphericity CA of the powder are obtained by processing the SEM photographs with the Phenom Prisuite Software. The closer the sphericity is to 1 means the closer the shape of the particles is to a spherical shape. Detailed results regarding particle characterization under different delivery tube diameters are listed in Table 4. Also, the comparison of the simulated and measured powder size distribution curves can be seen in Figure S2. As shown in Figure 11(a), when d = 1.5 mm, the spherical small particles take up the majority of the particles and irregularly shaped powders almost cannot be observed due to the short spheroidization time required for small particles. When d is increased to 2.5 mm, the particle size is increased significantly (the d50 is increased from 38.9 to 71.6 μm), and the proportion of defects such as needle-shaped powder, rod-shaped powder and satellite powder is higher, with CA decreasing from 0.910 to 0.803.
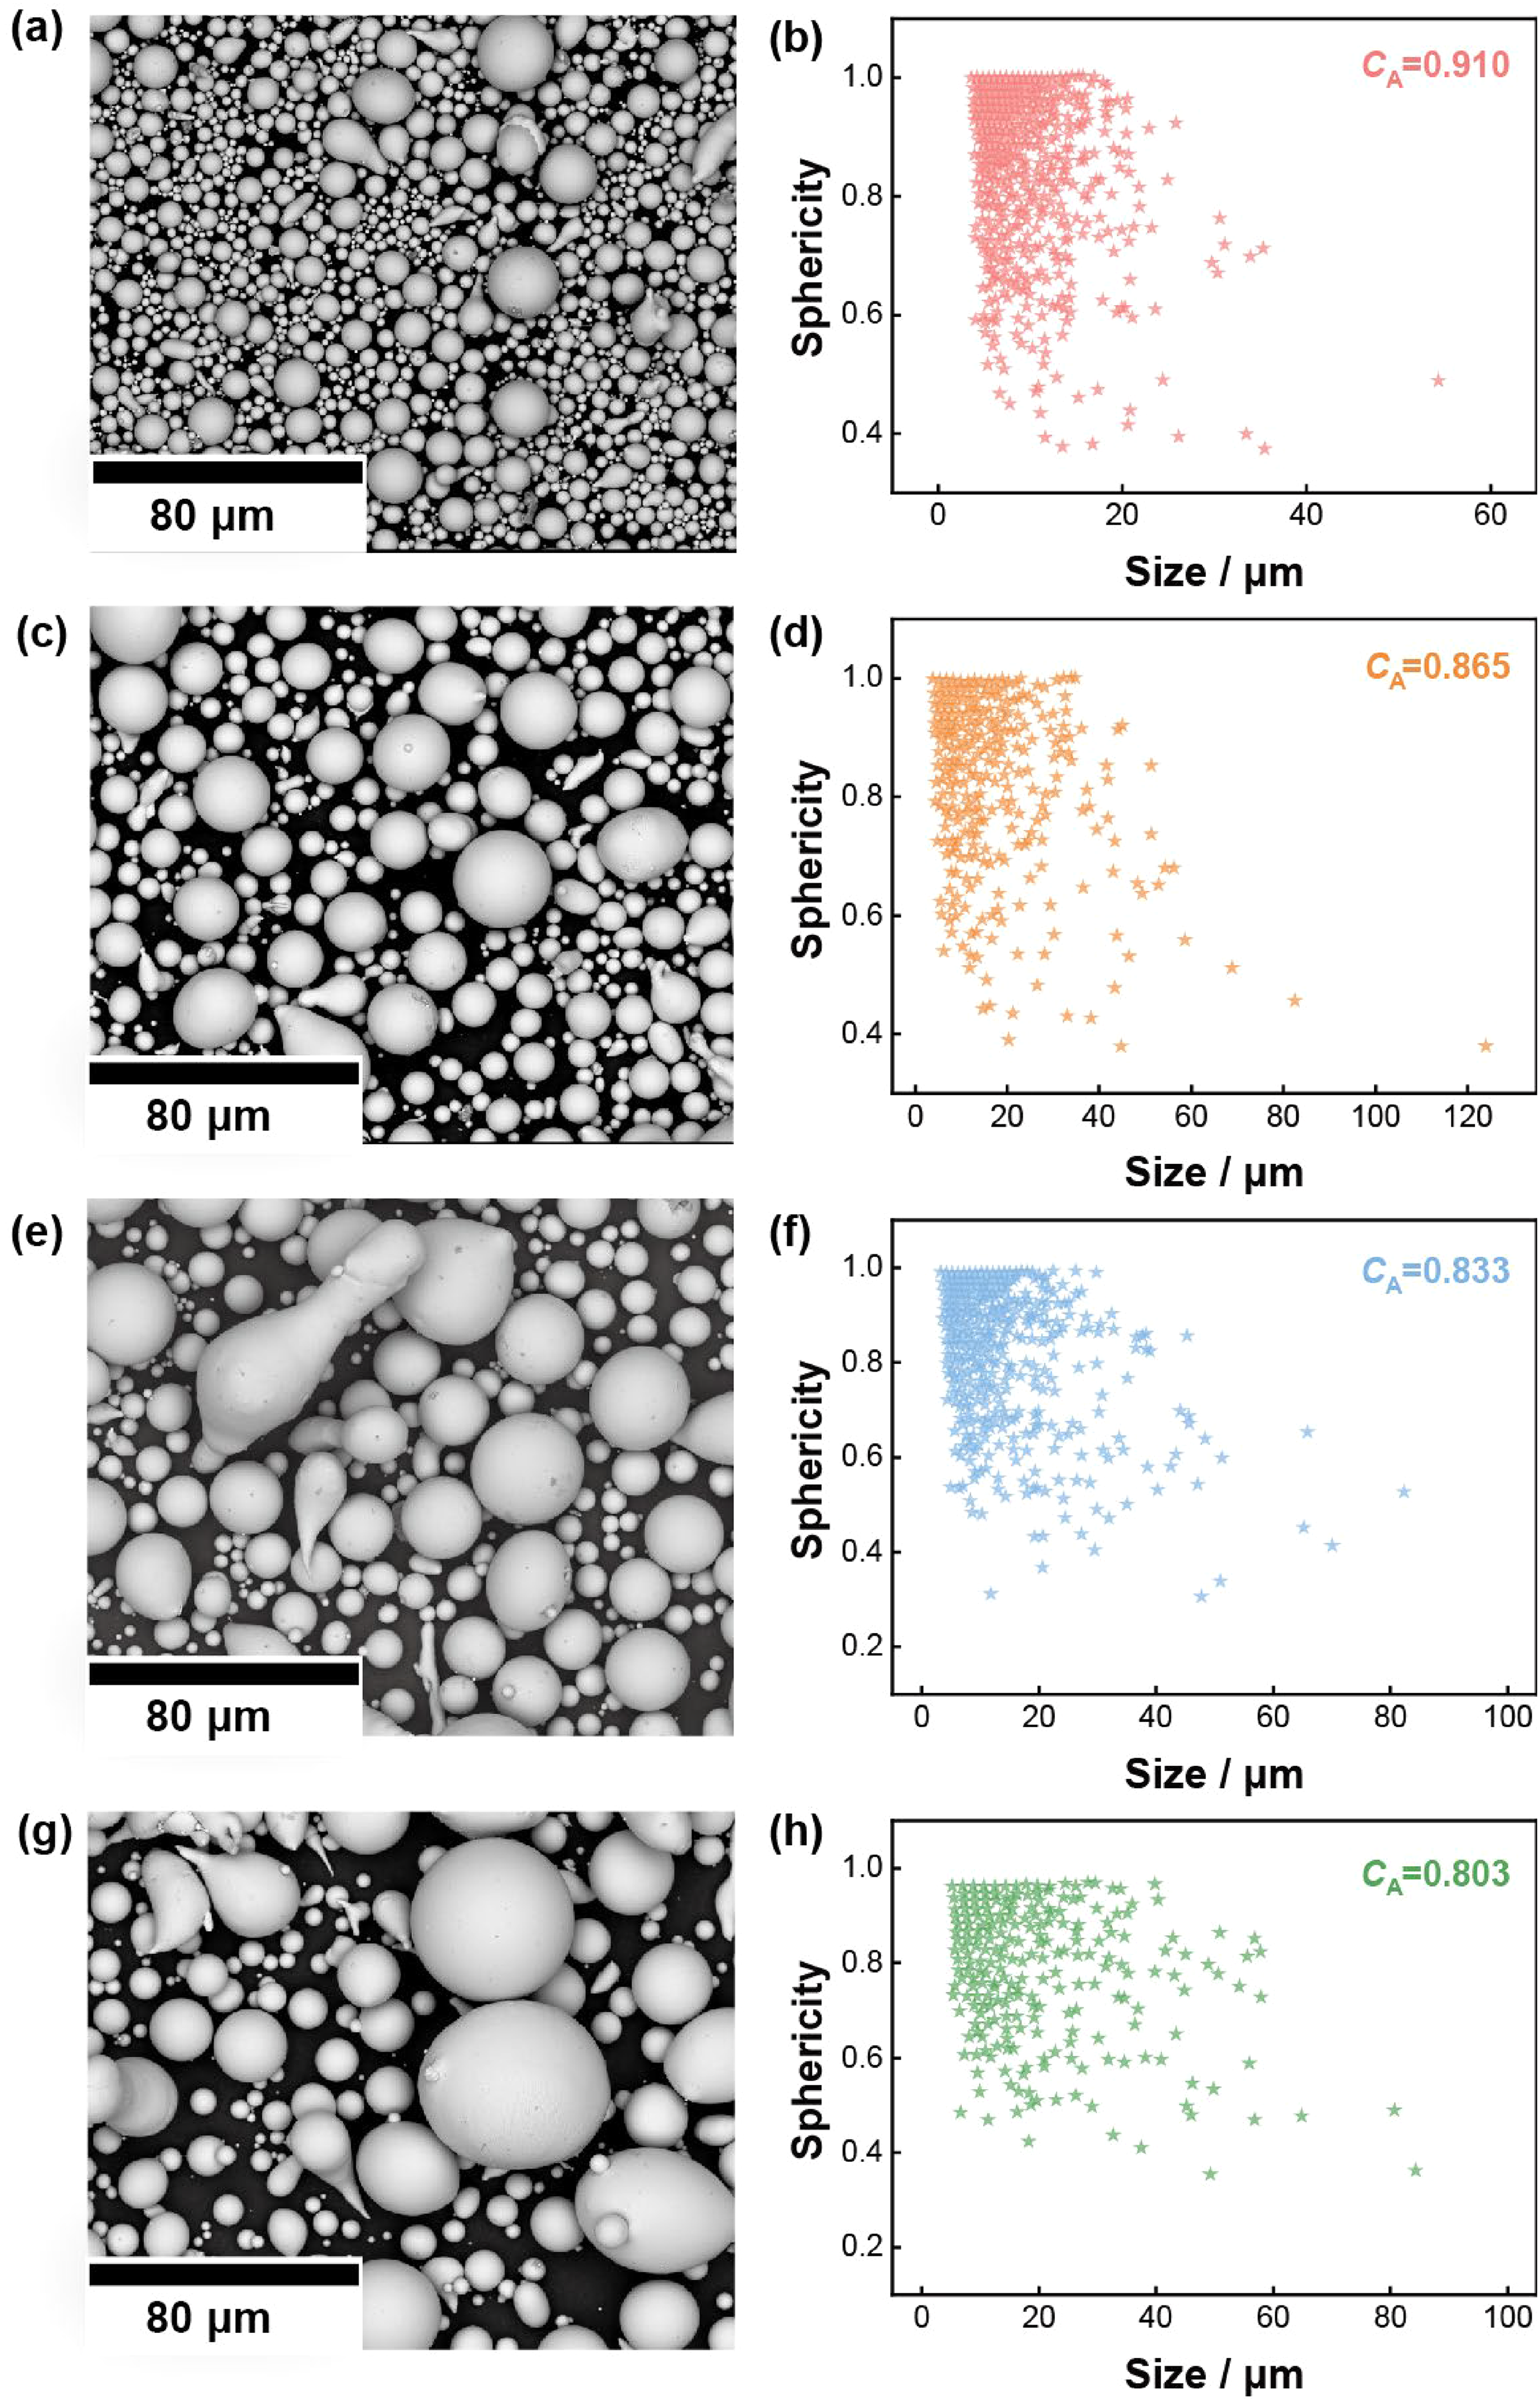
SEM pictures and sphericity of powders obtained under different delivery tube diameters: (a, b) d = 1.5 mm; (c, d) d = 2.0 mm; (e, f) d = 2.3 mm; (g, h) d = 2.5 mm.
Characterization results of powder properties.

As shown in Figure 12(a), since the FeSiBCCr amorphous alloy possesses strong amorphous formation ability, 34 no obvious sharp crystal diffraction peaks can be observed in the XRD patterns, indicating the powder is mainly amorphous. In order to further quantitatively characterize the amorphous fraction of the powder prepared under different conditions, the crystallization enthalpy of the powder was measured. The higher crystallization enthalpy means the higher content of amorphous phase in the material. In this study, the FeSiBCCr fine powder obtained in our previous study 26 was used as reference, which was sieved several times and had the highest value of crystallization enthalpy (123.1 J·g−1). Therefore, the amorphous fraction of the samples is represented by the ratio of the crystallization enthalpy of the samples to that of the reference sample. The DSC curves of the powder filtered through a −400-mesh sieve at a heating rate of 10 K/min are shown in Figure 12(b). It can be seen that the crystallization enthalpy is decreased from 122.4 J/g to 111.3 J/g with d increasing from 1.5 mm to 2.5 mm, indicating that the atomization cooling capacity is decreased with the increase of the delivery tube diameter. Subsequently, the powders produced under different conditions were sieved to different size ranges, and the measured amorphous fraction is shown in Figure 12(c). It can be seen that the amorphous fraction decreases with increasing particle size for the powder in different size ranges. For the powder smaller than 38 μm in size, the amorphous fraction is decreased from 99.4% to 90.3% with d increasing from 1.5 to 2.5 mm, while for the powder larger than 106 μm in size, the amorphous fraction is decreased rapidly from 62.5% to 44.3% with d increasing from 1.5 mm to 2.5 mm.
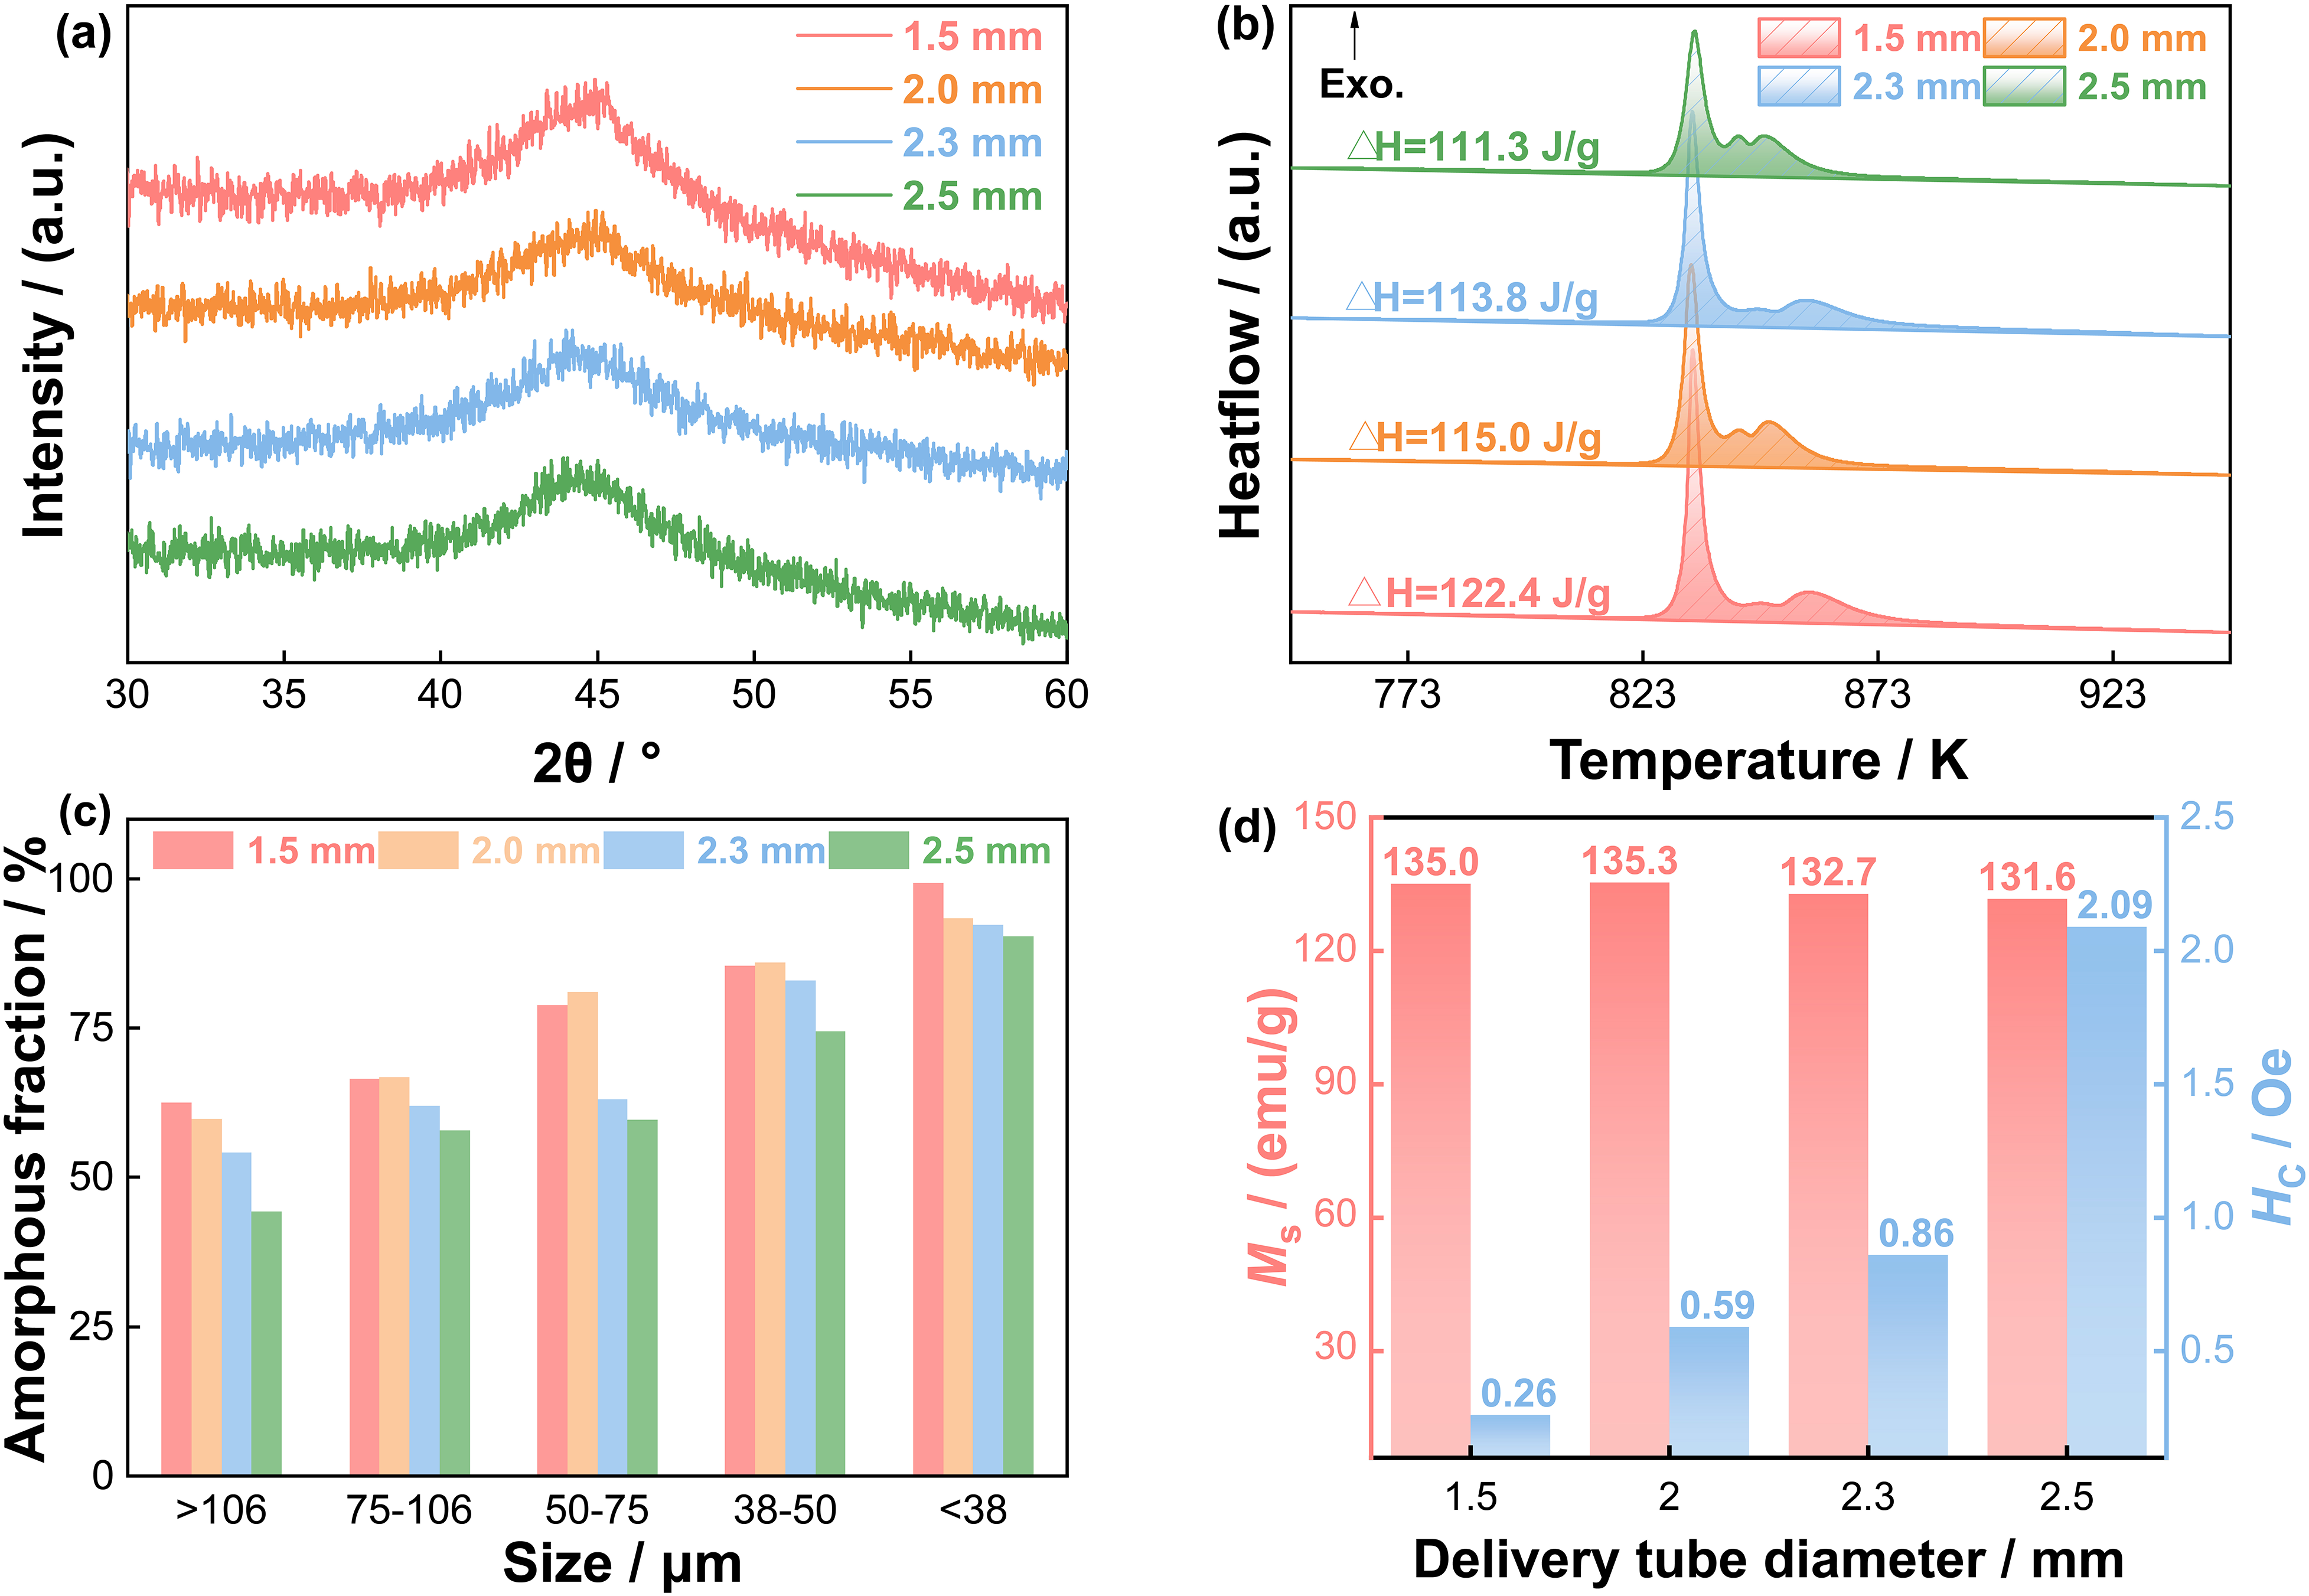
(a) XRD pattern of FeSiBCCr amorphous powders; (b) DSC curves of sieved FeSiBCCr amorphous powders; (c) variation in amorphous fraction for powders in different size ranges; (d) Ms and Hc of sieved FeSiBCCr amorphous powders.
The comparative results of the magnetic properties of the powder are shown in Figure 12(d), and the hysteresis loops can be seen in Figure S3. The saturation magnetization Ms is mainly related to the ferromagnetic material content. 9 Since the Fe content is the same, the Ms of the powder produced under different conditions is similar. The coercivity Hc, as a structure-sensitive physical quantity, is related to the particle shape and amorphous fraction. 9 When d = 2.5 mm, the powder size is increased, and the sphericity and amorphous fraction are deteriorated, and the magneto-crystalline anisotropy is intensified, and thus the Hc is increased to 2.09 Oe. While when d = 1.5 mm, the particle size of the prepared powder is the smallest and the amorphous fraction is the highest, leading to the Hc of only 0.26 Oe. Therefore, it can be considered that the delivery tube structure with L = 5 mm and d = 1.5 mm is preferred by combining the above experimental and simulated results.
Conclusion
In this study, a flow-heat transfer-VOF-DPM coupled numerical model is established to investigate the whole atomization process. The effects of the delivery tube structure parameters on the gas-only flow field, primary atomization and secondary atomization process are analyzed. By combining with the corresponding industrial trials, the following conclusions are obtained
Although the maximum velocity in the recirculation zone increases when the extrusion length is reduced, the suction effect under the delivery tube outlet is significantly weakened and the range of the recirculation zone is increased, which is likely to cause the clogging. Even when droplet backflow is not considered, decreasing the extrusion length is still detrimental to droplet breakup. The calculated d50 is increased from 48.9 to 53.8 μm as the extrusion length is decreased from 5 mm to 0 mm. The gas-to-melt ratio is increased and the melt breakup efficiency is significantly enhanced due to the decrease in the delivery tube diameter. With the refinement of the droplets, the degree of droplet spheroidization and the cooling rate are enhanced. Thus, the calculated d50 is decreased from 68.8 μm at d = 2.5 mm to 34.3 μm at d = 1.5 mm, and the average cooling rate of particles is increased rapidly from 3.24 × 10⁴ K/s to 8.97 × 10⁴ K/s. With the decrease of the delivery tube diameter from 2.5 mm to 1.5 mm, the average sphericity of the powder is increased from 0.803 to 0.910, and the d50 is decreased from 71.6 to 38.9 μm, which is in accordance with the simulated results. When the delivery tube diameter is 1.5 mm, the produced powder exhibits excellent comprehensive properties with the highest amorphous fraction and the lowest coercivity of only 0.26 Oe. Therefore, the delivery tube with d = 1.5 mm and L = 5 mm is the optimal structure in this work.
Supplemental Material
sj-docx-1-pmg-10.1177_00325899241274069 - Supplemental material for Effects of delivery tube configuration regarding the gas atomization for preparing Fe-based amorphous powders: Numerical and experimental investigation
Supplemental material, sj-docx-1-pmg-10.1177_00325899241274069 for Effects of delivery tube configuration regarding the gas atomization for preparing Fe-based amorphous powders: Numerical and experimental investigation by Jiaqi Liu, Pu Wang, Xiaoyu Li and Jiaquan Zhang in Powder Metallurgy
Footnotes
Acknowledgements
This work was financially supported by the Key research and development project of Shandong province in China (Grant No. 2022CXGC020308).
Declaration of conflicting interests
The authors declared no potential conflicts of interest with respect to the research, authorship, and/or publication of this article.
Funding
The authors disclosed receipt of the following financial support for the research, authorship, and/or publication of this article: This work was supported by the Key research and development project of Shandong province in China, (grant number 2022CXGC020308).
Supplemental material
Supplemental material for this article is available online.
References
Supplementary Material
Please find the following supplemental material available below.
For Open Access articles published under a Creative Commons License, all supplemental material carries the same license as the article it is associated with.
For non-Open Access articles published, all supplemental material carries a non-exclusive license, and permission requests for re-use of supplemental material or any part of supplemental material shall be sent directly to the copyright owner as specified in the copyright notice associated with the article.