
Abstract
Motor vehicle crashes are among the leading causes of death of young drivers. Vulnerable drivers, such as young drivers with ADHD, are at high risk of crashes. However, not all young drivers with ADHD are at equal risk for experiencing these negative outcomes, indicating a need to identify factors that increase risk within this population. Compared with individuals without ADHD, individuals with ADHD also experience more adverse childhood experiences (ACEs), which have been independently identified as predictors of unsafe driving. The unique impact of ADHD, ACEs, and their interaction has not been evaluated within a single, demographically at-risk sample. A total of 263 licensed young drivers between the ages of 18 and 29 years old completed a survey measuring self-reported symptoms of ADHD, a subset of adverse childhood experiences, as well as risky and distracted driving behaviors. Total symptoms of ADHD and its dimensions and number of ACEs significantly predicted greater engagement in risky driving. Only total symptoms of ADHD and hyperactivity/impulsivity uniquely predicted engagement in distracted driving. The interaction between ADHD symptoms and ACEs was not significant for any analysis. Findings indicated that ADHD symptoms and ACEs each contribute to risk for unsafe driving behaviors, but that ACEs do not exacerbate the risk of ADHD on driving outcomes. This study highlights the need for interventions aimed at helping individuals who present with symptoms of ADHD or who have experienced childhood adversity prevent negative driving behaviors.
Keywords
Introduction
The National Highway Traffic Safety Administration (NHTSA) estimated that, in 2023, nearly 41,000 people died in motor vehicle crashes. (NHTSA, 2024). Young drivers—between the ages of 15 and 29—are at particular risk for crashes (Centers for Disease Control and Prevention [CDC], 2014). Research on factors that increase crash risk in this age group is needed, representing opportunities for application and intervention to reduce crash-related morbidity and mortality in the future.
Attention-Deficit/Hyperactivity Disorder (ADHD), a neurodevelopmental disorder characterized by persistent symptoms of inattention and/or hyperactivity-impulsivity (American Psychiatric Association [APA], 2022), is a known risk factor for crashes, including at-fault and fatal crashes (Aduen et al., 2015, 2016; Chang et al., 2014; Jerome et al., 2006; Vaa, 2014). Studies have consistently reported that individuals with ADHD experience greater negative driving outcomes, including more driving citations, license suspensions, and car crashes (Aduen et al., 2015, 2018; Barkley et al., 2002; Fischer et al., 2007; Vaa, 2014). These outcomes are not limited to young drivers with ADHD continuing into emerging adulthood and beyond for individuals with persistent ADHD (Roy et al., 2020). Still, not all drivers with ADHD are at equal risk for experiencing these negative outcomes (Fuermaier et al., 2017). More specifically, one study surveyed drivers with ADHD and found that 60% had not experienced a minor crash within the previous year (Cox et al., 2011). Another study of drivers with ADHD found that during a 4-year follow-up period, only 6.5% of men and 3.9% of women reported experiencing a crash (Chang et al., 2014). This pattern of findings highlights the need to identify risk factors within this at-risk population.
Several risk factors have been considered when examining sources of variability in driving outcomes among drivers with ADHD. For example, current ADHD status, as opposed to a childhood history of ADHD, is important for predicting which drivers with ADHD symptoms are at increased risk (Roy et al., 2020). Given the heterogeneity of the disorder, one way to explore differences within ADHD is to examine how driving outcomes differ by ADHD presentations (i.e., predominantly inattentive, predominantly hyperactive/impulsive, and combined). However, research exploring these differences is limited, potentially because beyond childhood, the predominantly hyperactive/impulsive presentation lacks validity, and differentiating between the predominantly inattentive and combined presentations becomes more difficult (Willcutt et al., 2012). As a result, examining core symptom dimensions of ADHD, including inattention and hyperactivity/impulsivity, is a more empirically-supported method of assessing the variability in outcomes amongst drivers with ADHD. For example, one study evaluating the relation between these dimensions and driving outcomes in a sample of adolescent drivers concluded that, unlike symptoms of hyperactivity/impulsivity, symptoms of inattention were uniquely associated with driving problems, including citations and crashes (Garner et al., 2014). On the other hand, another study examining risky driving in adolescents and young adults with ADHD found that it was symptoms of hyperactivity-impulsivity, and not inattention, that accounted for, or mediated, the relationship between childhood ADHD and tickets and crashes (Thompson et al., 2007). In contrast, Roy and colleagues (2020) concluded that both inattention and hyperactivity predicted risk for crashes. These disparate results highlight the need for more research on the relation between ADHD symptom dimensions and driving outcomes within young adult populations. Additionally, discovering other risk factors that contribute to variability in driving outcomes among those with ADHD is important for targeted intervention and prevention. For example, a previous study found that visual inattention mediated the relationship between ADHD and poor simulated driving in a sample of teens with ADHD (Kingery et al., 2015) which led to the development of a training-skills based intervention—enhanced FOrward Concentration and Attention Learning (FOCAL+)—that targeted visual inattention and effectively reduced crash risk one year post-training (Epstein et al., 2022). The FOCAL+ intervention is an example of how research on mediators leads to targeted interventions.
Moderators of ADHD Driving Risk
Research examining possible moderators of ADHD driving risk could provide insights into who is most at-risk, and therefore, most in need of intervention. One study did not find that any of the demographic and clinical characteristics examined were significant moderators of the relationship between ADHD status and traffic violations in a Canadian sample of drivers; however, among individuals who reported having been diagnosed with ADHD, the odds of traffic violations is greater among men, white individuals, and individuals between the ages of 20–29 yeards old (Ferro & Leatherdale, 2019). Another study found that gender was a significant moderator of the relationship between ADHD symptom dimensions and “deviant driving behaviors” (i.e., ordinary violations, errors, lapses, and aggressive violations) (Timmermans et al., 2020). Specifically, symptoms of hyperactivity and, to a lesser extent, impulsivity, predicted deviant driving behaviors for men, whereas for women, it was symptoms of inattention that predicted deviant driving behaviors (Timmermans et al., 2020). Personality characteristics such as neuroticism have also been found to moderate the relationship between ADHD and aggressive driving violations such that this relationship is only significant at low and moderate, but not at high, levels of neuroticism (Sheikh, 2026). This finding counterintuitively suggests that individuals with ADHD and lower levels of neuroticism are the most at-risk for aggressive driving. It is important to note that the author cautioned that the findings are preliminary because the moderation test only approached significance (Sheikh, 2026).
Another study found that family factors moderate the positive relationship between ADHD symptoms and dangerous driving (Burns et al., 2022). Specifically, in a sample of over 4,000 undergraduate students in the United States, the positive relationship between ADHD and dangerous driving was weaker when drivers reported that their parents provided them greater levels of feedback regarding their driving and when they communicated more about how to be a safer driver. In contrast, when parents exhibited less commitment as opposed to greater commitment to driving safety, the positive relationship between ADHD symptoms and dangerous driving was stronger.
Taken together, research suggests that driving risk is higher for individuals with ADHD who are emerging adults, men, white, and whose parents do not create a safe driving climate within the family. Further, the relationship between ADHD symptom dimensions and deviant driving differs depending on gender.
ACES: An Unexplored Moderator of ADHD Driving Risk
Stressful and traumatic childhood experiences can have effects and consequences that manifest in adulthood, including negative mental health outcomes (e.g., suicidality) (CDC, 2021; Felitti et al., 1998; Petruccelli et al., 2019) and general health-risk behavior (e.g., substance use) (Garrido et al., 2018). This is particularly true for a subset of experiences known as adverse childhood experiences (ACEs). ACEs, are defined as occurring between 0–17 years of age, and include emotional, physical, or sexual abuse, physical or emotional neglect, or parental separation or divorce, witnessing intimate partner violence, or growing up in a household with one or more members experiencing substance abuse, severe mental illness, or incarceration (CDC, 2020; Felitti et al., 1998). Nearly two-thirds of adults in a nationally representative sample of adults reported they experienced at least one ACE, and roughly 17% reported that they experienced four or more ACEs (Swedo et al., 2023).
Children with ADHD experience more ACEs than children without ADHD, including greater prevalence of socioeconomic hardship, parent/guardian divorce, familial substance abuse, mental illness, and incarceration, and neighborhood and domestic violence (Brown et al., 2017; Crouch et al., 2021). In addition, amongst children with ADHD, exposure to more ACEs is associated with increased severity of ADHD (Brown et al., 2017). Longitudinal studies have found that there is a bidirectional relationship between ADHD and ACEs. Specifically, having ADHD, particularly inattention symptoms, increases risk of experiencing future ACEs (Lugo-Candelas et al., 2021), and experiencing ACEs is predictive of subsequent ADHD diagnosis (Jiminez et al., 2017). One explanation for this bidirectional relationship is that a child who experiences symptoms of inattention (e.g., losing materials or not listening when a parent is speaking to them) may experience more negative responses from parents, such as more frequent or harsh discipline, one form of ACE (Lugo-Candelas et al., 2021). Furthermore, research has indicated that parents of children with ADHD are more likely to experience conflict in their relationship with each other, which could lead to a child experiencing other ACEs such as parental divorce or exposure to intimate partner violence (Lugo-Candelas et al., 2021; Schermerhorn et al., 2012).
A separate line of research has established the relation between childhood adverse experiences and risky driving in non-ADHD populations. For instance, in addition to young age (<25 years old), childhood adversity was associated with risky driving behavior in a sample of armed forces personnel (Fear et al., 2008). Specifically, drivers who reported experiencing 2–3 ACEs had a 52% increased likelihood, while those with 4–5 ACEs had a 117% increased likelihood of engaging in risky driving (Fear et al., 2008). Another study found that ACEs have been linked to increased risk of alcohol-impaired driving, especially among younger adults (Sahoo & Sacco, 2019). These studies highlight that adolescence and emerging adulthood are particularly risky from a driving safety perspective for individuals who experience ACEs, underscoring the need to examine the impact of ACEs on driving during these developmental periods.
To our knowledge, no study has examined whether ACEs may moderate the relationship between ADHD and adverse driving outcomes. We argue that this is a gap in research for multiple reasons. First, ADHD and ACEs are independently associated with negative driving outcomes. The idea that multiple pathways, in this case, ADHD and ACEs, could lead to the same outcome (negative driving outcomes) is consistent with the concept of equifinality as described in the developmental psychopathology framework (Rutter & Sroufe, 2000). In this framework, both ACEs and ADHD are considered risk factors for negative driving behaviors (Kerig et al., 2012). However, despite empirical support for the overlapping nature of these experiences and their outcomes, the unique predictive power of ADHD symptoms and ACEs and their combined, interactive effect (or moderation) on negative driving behaviors have not been examined. Such an analysis would be a test of equifinality. Moreover, one could argue that when the effects of these two risk factors are combined, the effects are that much greater. This is known as vulnerability—the effects of one risk factor are greater in the presence of another known risk factor (Kerig et al., 2012). Statistically, vulnerability is tested using a moderation framework. To our knowledge, the impact of ACEs has not been evaluated as a moderating factor for negative driving outcomes among individuals with greater levels of ADHD.
Present Study
The purpose of this study is to further examine the relation between ADHD and driving outcomes. Substantial research supports the notion that individuals with symptoms of ADHD exhibit worse driving outcomes compared to the general population. However, not all drivers who report ADHD symptoms indicate having experienced equally negative driving outcomes. What factors make some individuals with ADHD more likely to exhibit negative driving outcomes than others? Do these factors operate as risk and/or vulnerability factors? ADHD and ACEs have separately been investigated as predictors of negative driving outcomes, but never in a single study. Additionally, little research exists exploring potential moderators of the relation between ADHD and negative driving outcomes. In this study, we attempt to provide an answer by investigating ACEs as a potential moderator.
We asked a sample of young drivers to report their current symptoms of ADHD and retrospectively report their experiences with a subset of ACEs. Young adults are of particular interest for this study given their increased risk for negative driving outcomes, including citations and crashes (Aduen et al., 2015, 2018; Barkley et al., 2002; Fischer et al., 2007; Vaa, 2014). In this study, we specifically focus on engagement in unsafe or risky behaviors that are known to increase risk of motor vehicle crash, such as speeding or texting while driving (Caird et al., 2014; Elvik et al., 2004).
Our first aim was to evaluate whether ACEs moderated the relation between total symptoms of ADHD and risky driving behaviors. Consistent with previous research, we expected greater ADHD scores and greater ACE scores to predict higher levels of risky and distracted driving. Finally, we expected that ACEs would moderate the relation between symptoms of ADHD and reports of risky and distracted driving, such that the positive relationship between ADHD symptoms and risky and distracted driving will be stronger when ACE scores are higher and weaker when ACE scores are lower.
Our second aim was to evaluate whether ACEs moderate the relation between ADHD symptom dimensions (hyperactivity/impulsivity and inattention) and risky driving behaviors. The literature on the relation between ADHD symptom dimensions and driving has demonstrated mixed outcomes (Garner et al., 2014; Roy et al., 2020; Thompson et al., 2007). As a result, we did not have a hypotheses these analyses, though we did expect the main effect of ACEs on risky and distracted driving to be significant and positive.
Research Design and Methods
Recruitment and Procedures
Inclusion criteria included being between the ages of 18 and 29 years old and possessing a learner’s permit, restricted license, or full driver’s license at the time of the study. An a priori power analysis was conducted using G*Power (Faul et al., 2007) to determine the appropriate number of participants for this study. A sample size of 85 – 129 participants was necessary to achieve power between 0.80 and 0.95.
We utilized two recruitment methods. First, we recruited undergraduate students at a private, Midwestern university utilizing SONA, a web-based research participation site. SONA participants were provided a description of the study, contact information for the IRB and principal investigator, and at the end of the survey, information for the student counseling center, should completion of the survey cause distress. Participants were asked to consent to participation. Once they had given consent, participants were directed to complete the survey. The approximate length of the survey was 15 minutes. Participants were provided a debriefing statement discussing the purpose of the study and offering additional resources. Participants received course credit for their participation.
We also utilized the online data collection platform Prolific to increase our sample size and power, as well as the diversity of our sample. Research indicates that Prolific produces high data quality, especially compared to other platforms such as Amazon Mechanical Turk (MTurk) (Peer et al., 2022). Given that our SONA sample consisted primarily of participants who identified as White/Caucasian, and in order to recruit a more diverse sample, participants who identified ethnically as White/Caucasian were unable to participate in the Prolific sample. Before beginning to complete the test battery, participants were asked to consent to participation. Once they had given consent, participants were directed to complete the survey. Participants were provided a debriefing statement discussing the purpose of the study and offering resources. Participants were paid $8.00 per hour for their time. This rate exceeds the national minimum wage and represents the minimum payment allowed by Prolific.
Several steps were taken to ensure validity of responding. We utilized an instructional manipulation check (IMC) to bolster reliability (Oppenheimer et al., 2009). The IMC included one question at the beginning of the survey (i.e., “Which of these activities do you engage in regularly?”), which was introduced with instructions for respondents to only select the “basketball” option. Respondents who selected the correct option demonstrated that they read the instructions. Respondents who did not respond with the correct option were informed that their response was invalid and prompted to reread the instructions and answer the question again. Respondents who again answered the question incorrectly were excluded. We also include three similar “trap” questions embedded in the survey in which participants were instructed to respond to a question in a specific manner (e.g., “If you are reading this, please answer always”) and a survey effort question to ensure that participants are paying attention and providing sufficient effort. Participants who answered “trap” questions with an accuracy below 50% or rated their effort below a 5 on a scale from 1 – 10 (1 = not much effort at all, 10 = my best effort) were excluded. This procedure has been used in previous studies involving college students (see Becker et al., 2018). Finally, participants’ identity remained completely anonymous throughout the entire study by disabling the IP address tracking feature in Qualtrics, helping to limit social desirability bias (Krumpal, 2013). All study procedures were approved by the institutional IRB.
Participants
A total of 263 individuals consented and completed the survey. Data gathered from these participants was screened for invalid responding. Invalid responding included 8 participants who reported that they did not have a valid permit or license, 1 participant who answered “trap” questions with an accuracy below 50%, 3 participants who rated their effort below a 5 on a scale from 1 – 10 (0 = not much effort at all, 10 = my best effort) and 21 participants were excluded because they did not pass the IMC. We did not have any missing data. Our final sample consisted of 230 participants.
Participants in this sample were between the ages of 18 and 29 years old (M = 22.37, SD = 3.85) and predominantly identified as women (60%), and 5% of participants identified outside of the gender binary. Racially, 48% of the participants identified as White, 23% as Asian, 17% as Black or African American, 5% as Hispanic or Latino, 4% as Biracial/Multiracial, and 3% as Native Hawaiian or Pacific Islander. Ethnically, participants predominantly identified as not Hispanic or Latino (77%). According to the 2025 U.S. census, the racial and ethnic composition of this sample is characterized by a higher percentage of individuals who identify as Asian and a lower percentage of individuals who identify as White (75%), Black/African American (14%), and Hispanic or Latino (20%) (United States Census Bureau, 2025). There were no meaningful differences between our sample and U.S. census data regarding individuals who identify as Biracial/Multiracial (3%), or Native Hawaiian or Pacific Islander (1%). Additionally, 64% of the sample indicated that they are college students (23% freshmen, 22% sophomores, 12% juniors, 7%).
In terms of psychiatric diagnoses, 48% of participants reported that they have received a psychiatric diagnosis from a mental health professional, most commonly anxiety disorder (35%) and depression (27%). A previous diagnosis of ADHD was reported by 17% of the sample, which is slightly above the national average (Kessler et al., 2005), and consistent with the national average, 6% of the sample reported being diagnosed with Posttraumatic Stress Disorder (PTSD) (Harvard Medical School, 2007). The sample is characterized by a slightly higher percentage of individuals who have experienced one ACE (26% vs 23% national average) or four or more ACEs (20% vs. 17% national average) and a lower percentage of individuals who have experienced zero (34% vs. 36% national average) or two or three ACEs (20% vs. 24% national average) compared to national statistics (Swedo et al., 2023). Lastly, on average, 50% of participants report driving five times or more, 9% report driving four times, 11% report driving three times, 9% report driving twice, and 20% report driving once in the last week.
Measures
Demographics Questionnaire
Participants were asked to report their age, sex, gender, race/ethnicity, whether they were in college, and, if they were, which year. Additionally, marital status, mental health diagnosis, current medication use, when they received their license, and how often they drive per week were ascertained for the purpose of describing our sample.
Barkley Adult ADHD Rating Scale-IV (BAARS-IV)
The BAARS-IV consists of 27 items and screens for symptoms of ADHD in adults between the ages of 18 and 81 years (Barkley, 2011). Participants were asked how often they exhibit ADHD inattentive and hyperactive-impulsive symptoms on a scale of 0 (not at all) to 3 (very often). Responses on both categories of symptoms were summed to create a total score; scores for the symptom dimensions of inattention and hyperactivity/impulsivity were also created. Items within this scale contributing to the total ADHD score demonstrated satisfactory internal consistency in the current sample (α = 0.95). Items within this scale contributing to the inattention (α = 0.92) and hyperactivity/impulsivity (α = 0.86) scores demonstrated satisfactory internal consistency as well. Furthermore, the BAARS-IV has exhibited fair to excellent inter-rater reliability in previous studies (Barkley et al., 2010; Burns et al., 2022). This scale has also demonstrated satisfactory convergent validity. Research indicates that the BAARS-IV displays small to medium and medium to large correlations, respectively, with Conner’s Continuous Performance Test and the Barkley Deficits in Executive Functioning Scale (BDEFS) (Barkley, 2011). A total ADHD severity score and symptom dimension scores for inattention and hyperactivity/impulsivity were used as predictor variables in the analysis.
DULA Dangerous Driving Index (DDDI)
Participants completed the Risky Driving subscale of the DDDI. This scale includes 12 items and asks participants to indicate the extent to which they engage in risky behaviors while driving on a scale of 1 (never) to 5 (always) (Dula & Ballard, 2003). This scale has also demonstrated satisfactory internal consistency in the present sample (α = 0.90) and construct validity in previous studies (Burns et al., 2022; Dula & Ballard, 2003). Responses to these questions were summed and used as a dependent variable in the analysis.
Distracted Driving Survey (DDS)
Participants answered 11 questions regarding their engagement in risky driving behavior within the last 30 days (e.g., texting or using social media while driving) and the speed at which they drove while exhibiting these behaviors (Bergmark et al., 2016). This scale demonstrated satisfactory internal consistency in the present sample (α = 0.90) and strong concurrent validity in previous studies (Bergmark et al., 2016). Responses to these questions were summed and used as a dependent variable in the analysis.
Behavior Risk Factor Surveillance System (BRFSS) ACE Module
Participants responded to 9 out of 11 questions from the BRFSS ACE Module assessing their experience with childhood adversity, specifically household dysfunction and physical and sexual abuse (Lombard et al., 2022). Two items, “How often did your parents or adults in your home ever slap, hit, kick, punch, or beat each other up?” and “How often did a parent or adult in your home ever swear at you, insult you, or put you down?” were omitted. The sum of the 9 items was used as a moderator variable in analyses. Research supports the broad validity of BRFSS data and the structural validity of the ACE Module (Ford et al., 2014; Pierannunzi et al., 2013). The items demonstrated satisfactory internal consistency in the present sample (α = 0.73).
Analytic Strategy
The R statistical program was used to perform all analyses (R Core Team, 2018).
Preliminary Analyses
The distribution of variables of interest was assessed using histograms, boxplots, and Q-Q plots. Skewness and kurtosis were assessed using descriptive statistics. We identified univariate outliers as scores that were greater than 3 standard deviations above the mean. These scores were truncated to a value equal to 3 standard deviations above the mean. For each analysis, multivariate outliers were identified using Mahalanobis and Cook’s distance tests and excluded from the analysis. To maintain an adequate sample size, each analysis has a unique sample (N ranging between 161–187). 1 Once multivariate outliers were removed, each of these samples was then assessed for multivariate normality again using Mardia’s, Henze-Zirkler’s, and Zhou-Shao’s tests. Despite removing all multivariate outliers, these tests indicate that our samples are not multivariate normal. Violation of this assumption increases the likelihood that standard error values are underestimated and Type 1 errors occur. Thus, caution should be taken when assessing the generalizability of results. Homoscedasticity was confirmed using the Breusch-Pagan test. Collinearity was assessed by examining bivariate correlations as well as tolerance and Variance Inflation Factor (VIF) statistics. More specifically, we confirmed that bivariate correlations were equal to less than 0.85 (Schroeder et al., 1990), tolerance was equal to less than 1 – R2 (Leech et al., 2005), and VIF statistics were equal to less than 10 (O’brien, 2007).
Hypotheses 1a, 1b, and 1c
We conducted hierarchical linear regressions with the mean centered total ADHD score and mean centered ACE score, and the interaction between these two variables on risky and distracted driving scores. The interaction effect was used to determine if the effect of symptoms of ADHD on risky driving was moderated by the experience of ACEs. Gender (0 = not women and 1 = women) and driving frequency were controlled in all analyses.
Hypotheses 2a, 2b, 2c, 2d, and 2e
We conducted four secondary analyses. We examined whether moderation of ACEs differs by ADHD symptom dimension. We conducted four linear regressions with the mean centered ADHD symptom dimension scores and mean centered ACE scores, and the interaction between these variables. The interaction terms in these analyses were used to determine if the effect of symptoms of hyperactivity/impulsivity and/or inattention on risky and distracted driving scores is moderated by the experience of ACEs. Again, gender and driving frequency were controlled in these analyses.
Supplemental Analyses
We conducted two supplemental analyses. These analyses had a unique sample. The preliminary analyses remained consistent, with the exception of our process of removing multivariate outliers. This process was informed by an additional a priori power analysis that was conducted using G*Power (Faul et al., 2007). This analysis determined that to achieve a power of 0.8, we needed to retain a sample size of at least 118 participants. As a result, when we reached this number, we stopped removing multivariate outliers to ensure that we maintained a sufficient sample size, leaving us with a sample size of 121 for supplemental analyses.
With this sample, we conducted two linear regressions with both mean centered ADHD symptom dimension scores included within the same model, mean centered ACE scores, and the interaction between these variables. The interaction terms in these analyses were used to determine the unique impact of ADHD symptom dimensions (hyperactivity/impulsivity and inattention) and ACE scores on risky and distracted driving scores in a single model. Gender and driving frequency were covariates in both analyses.
Results
Bivariate Correlations Among Variables of Interest
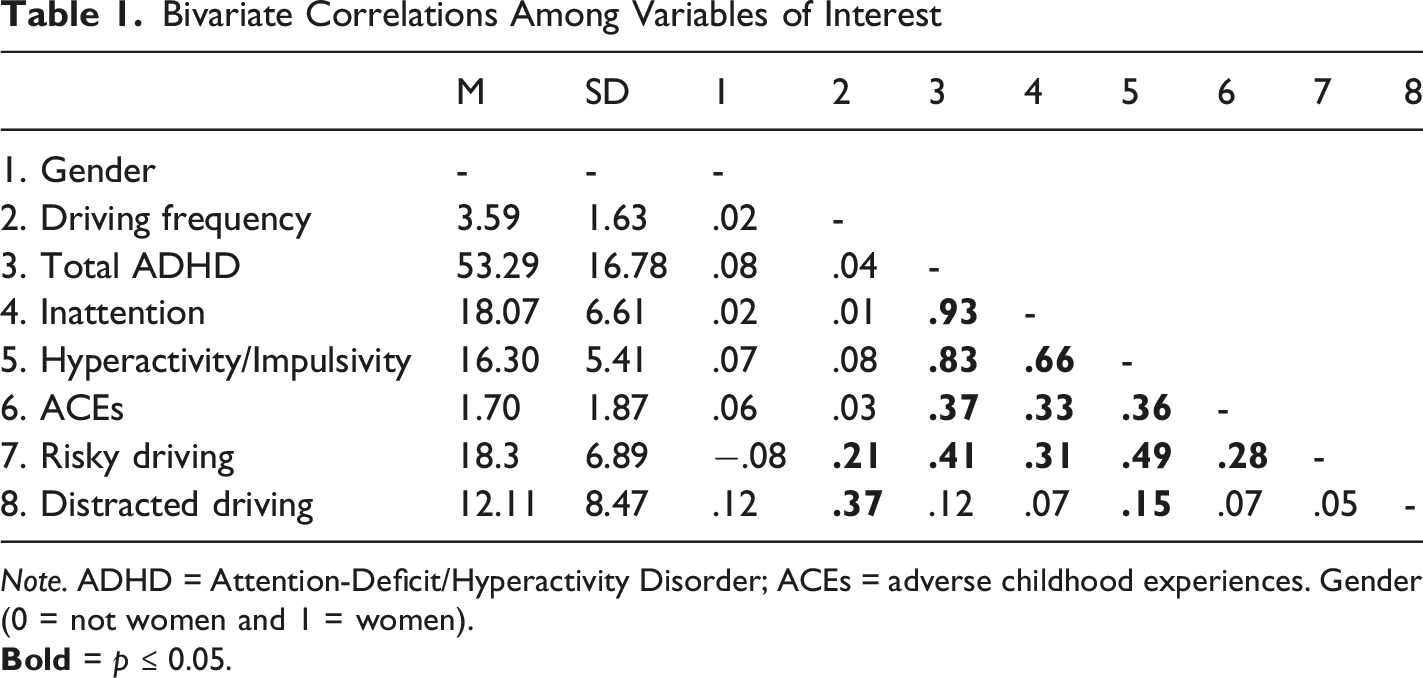
Note. ADHD = Attention-Deficit/Hyperactivity Disorder; ACEs = adverse childhood experiences. Gender (0 = not women and 1 = women).
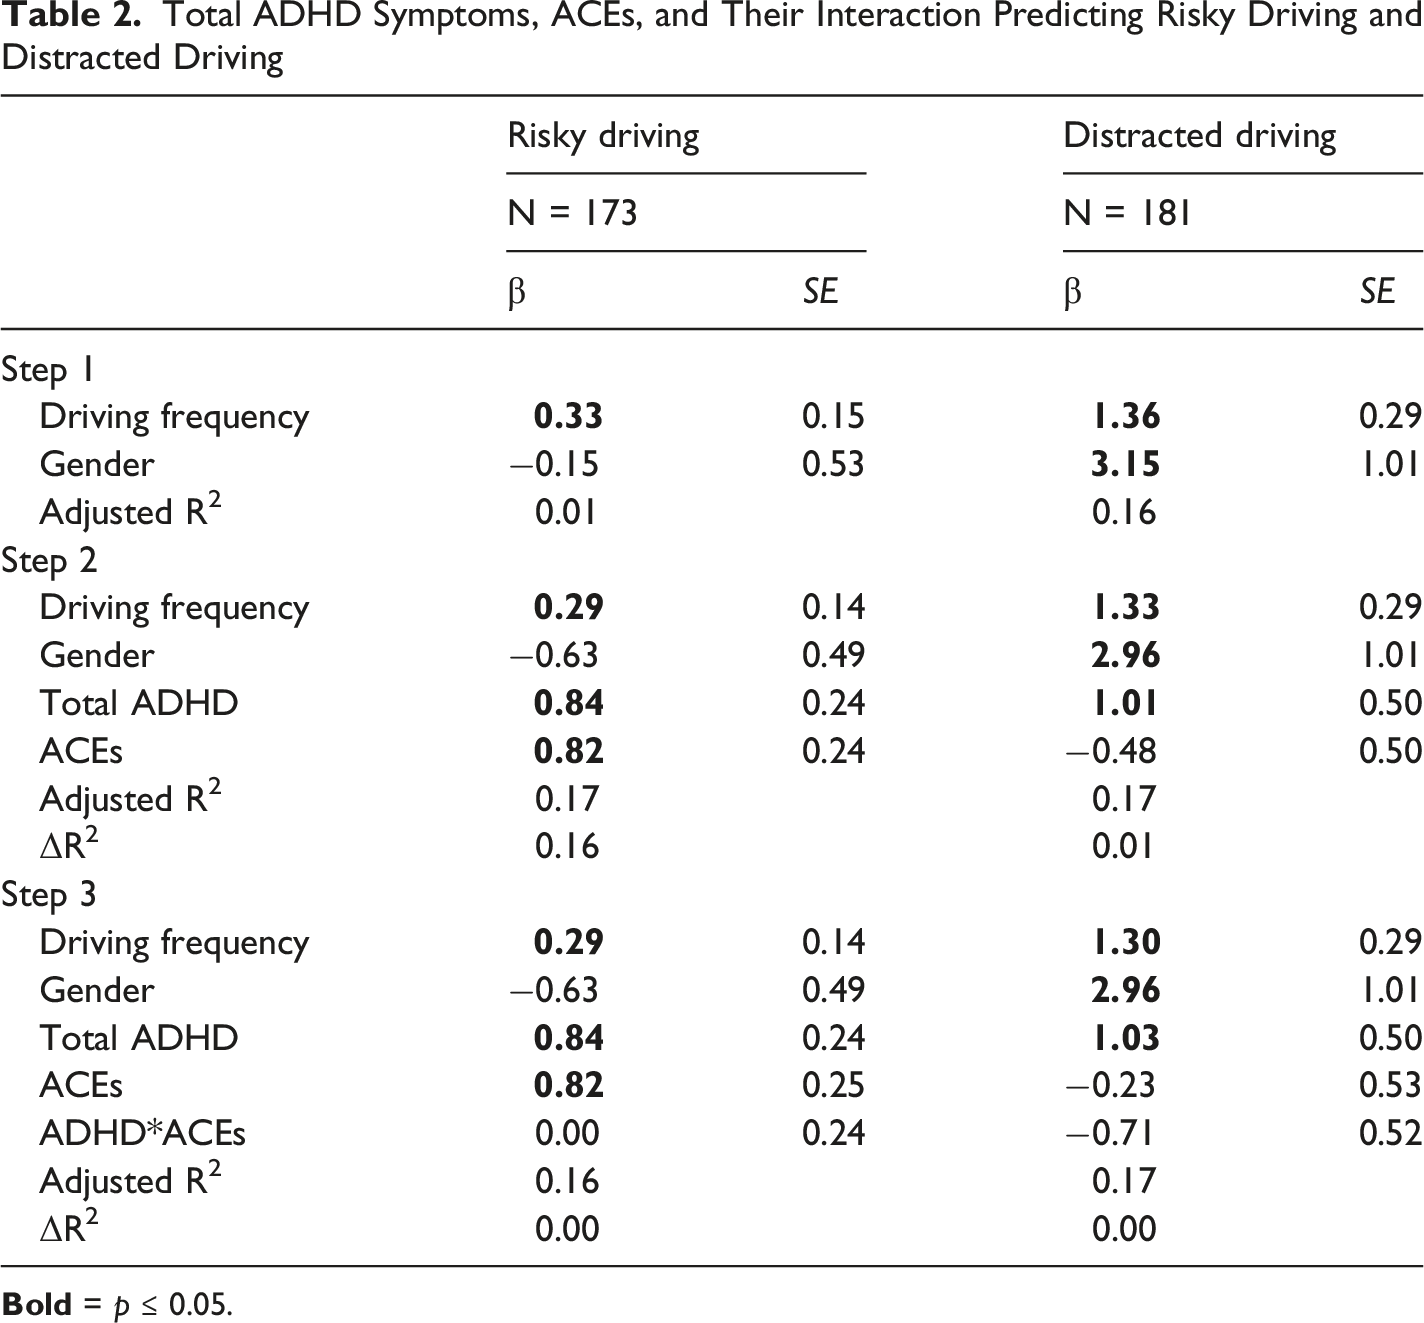
Total ADHD Symptoms, ACEs, and Their Interaction Predicting Risky Driving and Distracted Driving
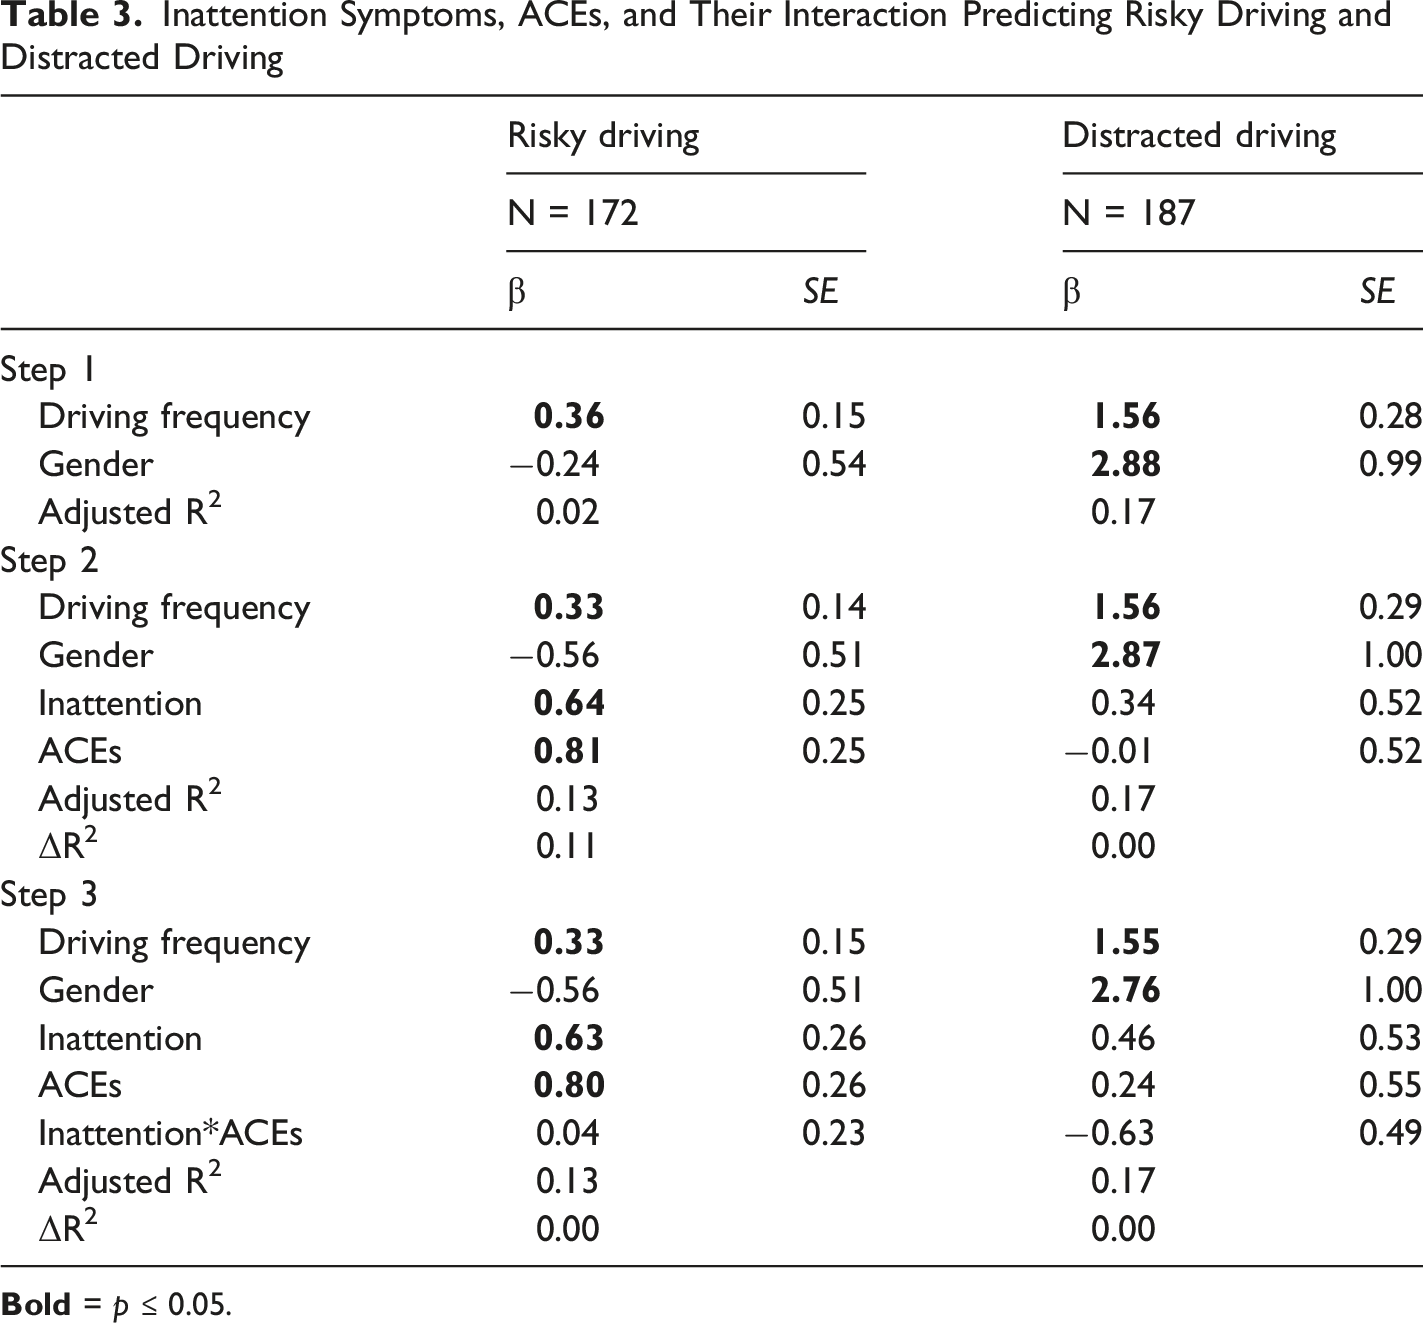
Inattention Symptoms, ACEs, and Their Interaction Predicting Risky Driving and Distracted Driving
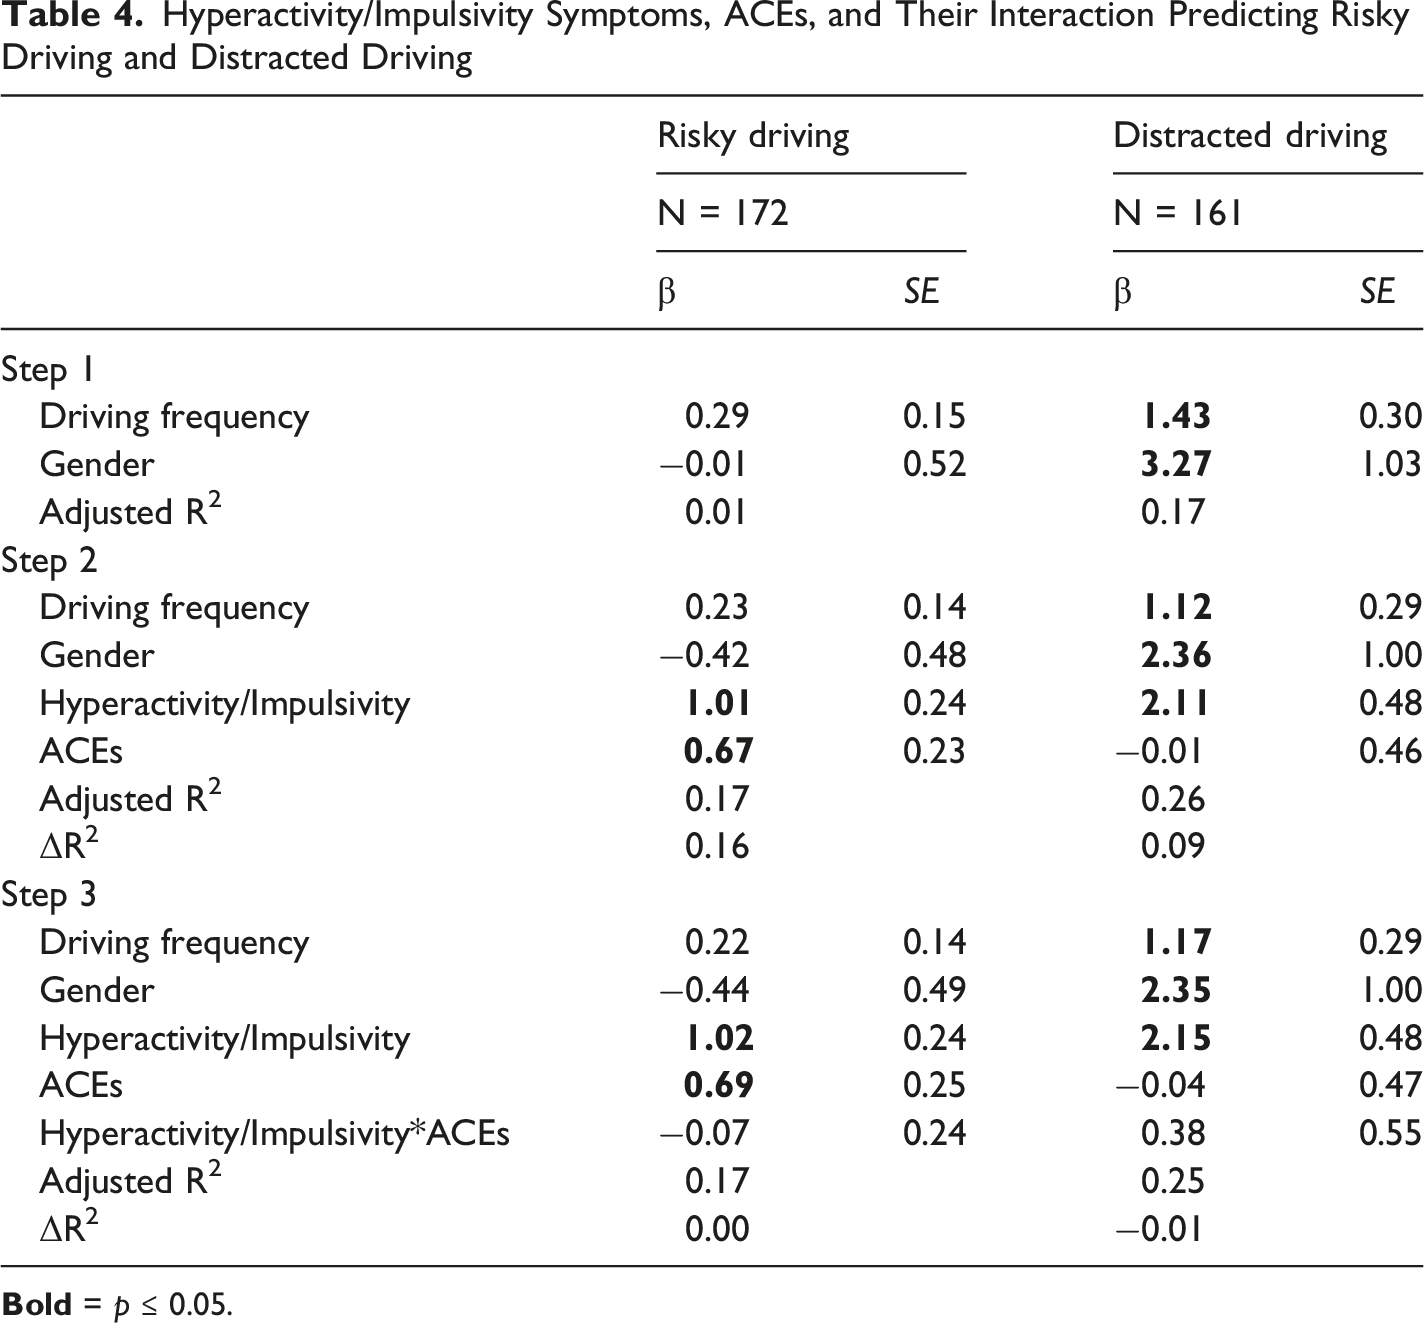
Hyperactivity/Impulsivity Symptoms, ACEs, and Their Interaction Predicting Risky Driving and Distracted Driving
Total ADHD
In Step 1 of our hierarchical regression, greater driving frequency was significantly associated with increased risky driving (β = 0.33, SE = 0.15, p ≤ 0.05) and distracted driving behaviors (β = 1.36, SE = 0.29, p ≤ 0.001). In addition, participants who identified as women reported significantly higher levels of distracted driving (β = 3.15, SE = 1.01, p ≤ 0.01). Risky driving did not differ significantly by gender. Driving frequency and gender accounted for 1% of the variance on risky driving and 16% of the variance on distracted driving.
The effects of the control variables remained the same in Step 2. Furthermore, higher levels of total ADHD symptoms were significantly associated with increased risky (β = 0.84, SE = 0.24, p ≤ 0.001) and distracted driving behaviors (β = 1.01, SE = 0.50, p ≤ 0.05). In addition, higher levels of ACEs was associated with increased risky driving behaviors (β = 0.82, SE = 0.24, p ≤ 0.001). There was no significant main effect of ACEs on distracted driving. Adding the main effects of ADHD and ACEs to the model accounted for an additional 16% of the variance on risky driving and 1% of the variance on distracted driving.
In Step 3, the addition of the interaction effect of ADHD and ACEs did not account for any additional variance on risky or distracted driving behaviors in the model. The main effects and total variance explained by the model were unchanged from Step 2.
Inattention
In Step 1 of our hierarchical regression, greater driving frequency was significantly associated with increased risky driving (β = 0.36, SE = 0.15, p ≤ 0.05) and distracted driving (β = 1.56, SE = 0.28, p ≤ 0.001) behaviors. In addition, participants who identified as women reported significantly higher levels of distracted driving (β = 2.88, SE = 0.99, p ≤ 0.01). Risky driving did not differ significantly by gender. Driving frequency and gender accounted for 2% of the variance on risky driving and 17% of the variance on distracted driving.
The effects of the control variables remained the same in Step 2. Higher levels of inattention symptoms (β = 0.64, SE = 0.25, p ≤ 0.05) and higher levels of ACEs (β = 0.81, SE = 0.25, p ≤ 0.01) were significantly associated with increased risky driving behaviors. There was no main effect of symptoms of inattention or ACEs on distracted driving. The addition of the main effects of inattention and ACEs accounted for an additional 11% of the variance on risky driving. The addition of the main effects of inattention and ACEs did not account for any additional variance on distracted driving.
In Step 3, the addition of the interaction effect of ADHD and ACEs did not account for any additional variance on risky or distracted driving behaviors in the model. The main effects and total variance explained by the model were unchanged from Step 2.
Hyperactivity/Impulsivity
In Step 1 of our hierarchical regression, risky driving did not differ significantly by driving frequency or gender. However, greater driving frequency was significantly associated with increased distracted driving (β = 1.43, SE = 0.30, p ≤ 0.001) behaviors. In addition, participants who identified as women reported significantly higher levels of distracted driving (β = 3.27, SE = 1.03, p ≤ 0.01). Driving frequency and gender accounted for 1% of the variance on risky driving and 17% of the variance on distracted driving.
The effects of the control variables remained the same in Step 2. Furthermore, higher levels of hyperactivity/impulsivity symptoms were significantly associated with increased risky (β = 1.01, SE = 0.24, p ≤ 0.001) and distracted driving behaviors (β = 2.11, SE = 0.48, p ≤ 0.001). In addition, higher levels of ACEs was associated with increased risky driving behaviors (β = 0.67, SE = 0.23, p ≤ 0.01). There was no significant main effect of ACEs on distracted driving. The main effects of hyperactivity/impulsivity and ACEs accounted for an additional 16% of the variance on risky driving and 9% of the variance on distracted driving.
In Step 3, the addition of the interaction effect of ADHD and ACEs did not account for any additional variance on risky or distracted driving behaviors in the model. The main effects and total variance explained by the model were unchanged from Step 2.
Supplemental Analyses
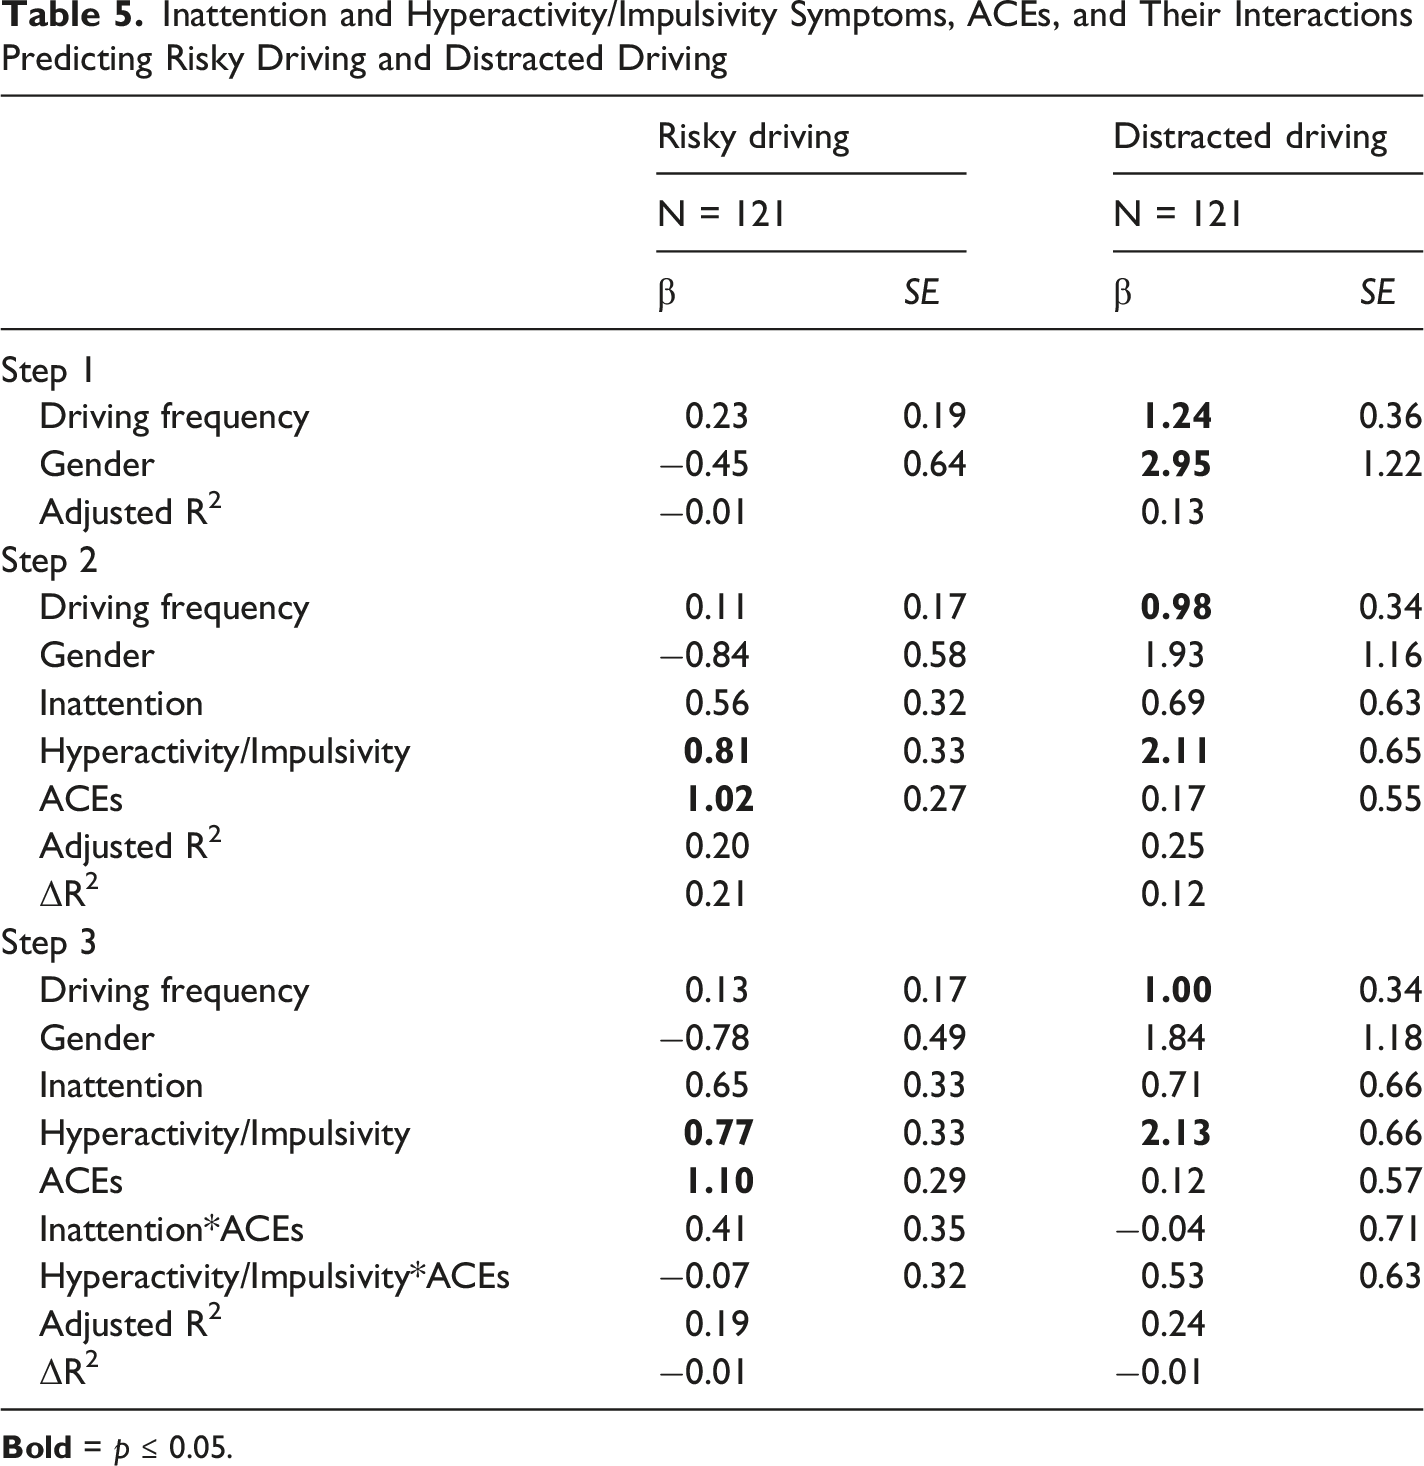
Inattention and Hyperactivity/Impulsivity Symptoms, ACEs, and Their Interactions Predicting Risky Driving and Distracted Driving
Discussion
The present study is the first to examine the unique predictive power of ADHD and ACEs on driving behaviors of young adults, and the first to consider whether ACEs might moderate the relationship between ADHD and these behaviors. In line with our hypotheses, the results indicate that total ADHD symptoms were significantly associated with risky and distracted driving, such that greater symptoms of total ADHD predicted greater engagement in both risky and distracted driving behaviors. This research adds to the significant body of research that has documented the association of ADHD with negative driving outcomes (Aduen et al., 2015, 2018, 2020; Barkley et al., 2002; Fischer et al., 2007; Vaa, 2014). Additionally, greater symptoms of inattention predicted greater engagement in risky driving behaviors. However, inattention was not significantly associated with distracted driving.
One explanation of these findings relates to the conceptualization of attention as a multidimensional construct. Research has attempted to provide a framework for conceptualizing how attention specifically relates to driving. These studies conclude that attention is dictated by both voluntary, goal-directed, and involuntary, stimulus-driven processes and driven by stimuli within and outside of the body (Corbetta et al., 2008; Trick et al., 2004). These voluntary or top-down processes help individuals select or orient their attention to a specific stimulus (e.g., the roadway), while the involuntary or bottom-up processes dictate an individual’s alertness or ability to sustain attention (Aduen et al., 2020). These attentional processes are supported by an individual’s executive functions, including inhibition and cognitive flexibility (Lynch et al., 2023). These functions help individuals to ignore distracting stimuli or resist impulses and shift their attention from one stimulus to another (Aduen et al., 2020; Lynch et al., 2023). For example, inhibition and cognitive flexibility are required for an individual to resist checking their phone when they receive a text message and shift their attention back to the roadway. Considering these dimensions, it appears that our measure of inattention, the BAARS-IV, assesses involuntary attention (e.g., being easily distracted by extraneous stimuli or irrelevant thoughts). However, our measure of distracted driving, the DDS, focuses less on distractibility and more on voluntary engagement in cell phone use (e.g., writing text messages) while driving. As a result, theoretically, it makes sense that symptoms of inattention assessed in this study do not significantly predict cell phone use while driving, a task that requires voluntary attention.
Moreover, the results indicate that hyperactivity/impulsivity was significantly associated with both risky and distracted driving, such that greater symptoms of hyperactivity/impulsivity predicted greater engagement in both risky and distracted driving behaviors. These findings add to the literature examining the impact of ADHD symptom dimensions on driving outcomes. However, the literature remains mixed. One study concluded that symptoms of inattention were uniquely associated with driving problems (e.g., citations and crashes) (Garner et al., 2014). Another study found that hyperactivity-impulsivity mediated the relationship between childhood ADHD and tickets and crashes (Thompson et al., 2007). Furthermore, a third study concluded that both inattention and hyperactivity predicted risk for crashes (Roy et al., 2020). Although our findings indicate that symptoms of hyperactivity/impulsivity predict distracted driving, both inattention and hyperactivity/impulsivity were significantly associated with risky driving.
Our supplemental analyses attempted to clarify the unique impact of symptoms of hyperactivity/impulsivity and inattention and ACE scores on risky and distracted driving scores by including inattention and hyperactivity/impulsivity within the same statistical model. In these analyses, symptoms of inattention no longer significantly predicted risky driving. These results suggest that symptoms of hyperactivity/impulsivity uniquely predict engagement in risky driving behaviors. They also suggest that targeting symptoms of hyperactivity/impulsivity may be an important component of future risky driving interventions.
Furthermore, the impact of ACEs on driving outcomes was evaluated across each of our analyses. ACEs was significantly associated with risky driving such that as ACEs increase, risky driving behaviors also increase. These findings on the relation between ACEs and risky driving were consistent with our expectations and previous research (Fear et al., 2008; Sahoo & Sacco, 2019). However, distracted driving was not predicted by total experiences of ACEs. This finding, in particular, extends previous work on ACEs and driving outcomes by examining a different, highly relevant form of risky driving. Although novel, the nonsignificant relation between ACEs and distracted driving was unexpected. This finding, once again, speaks to the notion that attention is a multidimensional construct. Current literature indicates that childhood adversity predicts executive functioning difficulties, which include a decreased ability to concentrate on current tasks (e.g., driving) (Dahmen et al., 2012; Diamond, 2013; Johnson et al., 2021). Like ADHD-related inattention, these difficulties represent a likelihood of engaging in involuntary attention processes. However, these difficulties may not enhance the likelihood that individuals voluntarily use their cell phones while driving. Although ACEs may be associated with concentration difficulties, the measure of distracted driving used in the present study does not inquire about mind wandering. Instead, distracted driving was conceptualized as participants’ willingness to choose to read and send messages while driving, a task that, although independent of driving, requires some level of goal-directed concentration. Furthermore, this finding highlights that ACEs are experiences that can result in a wide range of outcomes.
Another possible explanation for why ACEs predicted risky driving but not distracted driving is that research indicates that the experience of ACEs is associated with increased sensation-seeking behaviors (Babakr & Fatahi, 2023). These behaviors align more with items included in our risky driving measure (e.g., I will drive when I am drunk or I feel that most traffic laws could be considered as suggestions) than those in the distracted driving measure. In fact, it is well documented within the literature that higher levels of sensation-seeking behaviors predict increased engagement in risky driving (e.g., speeding or driving while inebriated) (Iversen & Rundmo, 2002; Jonah, 1997; van Beurden et al., 2005). Furthermore, another study explored the relations between sensation-seeking tendencies and initiating, reading, and responding to cell phone messages while driving, concluding that sensation-seeking only significantly predicted responding to cell phone messages (Mostyn Sullivan et al., 2021). Ultimately, these findings suggest that the link between ACEs and sensation-seeking may help to explain why ACEs were significantly associated with risky but not distracted driving in the current study, though this warrants further investigation.
A novel contribution of the study was the examination of ACEs as a factor that contributes to variability in driving behaviors among individuals with ADHD. Contrary to our expectations, the results suggest that the experience of ACEs does not moderate the impact of ADHD or its symptom dimensions (inattention and hyperactivity/impulsivity) on risky or distracted driving. These findings can be contextualized using the developmental psychopathology perspective. Our findings suggest that ADHD symptoms and ACEs are risk factors for risky driving in that they uniquely increase the likelihood of engagement in risky driving behaviors. Our findings also suggest that total ADHD and hyperactivity/impulsivity symptoms are risk factors for distracted driving in that they increase the likelihood of engagement in distracted driving behaviors. However, these variables do not act as vulnerability factors, given that in combination, they do not further increase the likelihood of negative driving outcomes in the presence of the other. In other words, the effects of total ADHD, inattention, and hyperactivity/impulsivity and ACEs are overlapping and not multiplicative. Research indicates that both ADHD and ACEs contribute to atypical brain development and impaired executive functioning (Brown, 2008; Friedman & Rapoport, 2015; Johnson et al., 2021; Sheridan & McLaughlin, 2014). Research also indicates that ADHD and childhood maltreatment produce abnormalities in similar brain areas (Dahmen et al., 2012). As a result, the consequences of their combined impact on driving outcomes may be limited or more nuanced than could be captured within the measurement in the current study.
Study Implications
This study has implications for improving outcomes of young drivers. In the United States, the legal driving age typically is 16 to 18 years old; for this reason, the American Academy of Pediatrics (AAP) encourages pediatricians to provide guidance related to driving including encouraging parents to model safe driving behavior and discussing the risks of engaging in risky and distracted driving with teens (Alderman et al., 2018). The AAP also provides information related to the increased risk that drivers with ADHD, as well as other health conditions such as epilepsy, experience and recommends that these risks be discussed with patients when relevant (Alderman et al., 2018). However, the AAP does not list ACEs as a risk factor for risky driving among teen drivers (Alderman et al., 2018). While our sample was made up of emerging adults, early prevention efforts in adolescence by pediatricians could have downstream effects later in development. Surprisingly, a review of resources from the American Academy of Family Physicians and American Medical Association failed to unearth guidelines related to driving safety for emerging adult drivers, though guidelines exist for physicians working with older adult drivers who experience cognitive decline. The results of the current study provide additional evidence of the importance of increasing public awareness of the impact of ADHD as well as ACEs on the driving of emerging adult drivers, not just teen drivers.
Limitations and Future Directions
No study is without limitations. The cross-sectional nature of this study limits our ability to draw causal conclusions, and self-report data may be subject to bias. Furthermore, despite utilizing Prolific to diversify our sample, collecting data through an undergraduate recruitment system (SONA) and Prolific limits the extent to which the data generalizes beyond samples of college students and users of online data collection platforms. Future work should use community sources of recruitment and utilize a longitudinal design to evaluate the causal relationships between ACEs, ADHD, and driving. Future work should also consider other driving outcomes such as motor vehicle crashes and traffic violations as well as extended eye glances, which has been implicated in the relation between ADHD and risk for crash involvement (Epstein et al., 2022).
The biggest limitation of this study was that only 9 out of the 11 BRFSS ACE Module items were included in the survey due to investigator error. The following items were not used in the present study: “How often did your parents or adults in your home ever slap, hit, kick, punch, or beat each other up?” and “How often did a parent or adult in your home ever swear at you, insult you, or put you down?” As a result, it is possible that if all 11 items had been included, the results may be different. Although the internal consistency of the 9 items included in this study (α = 0.73) was comparable to that reported with all 11 items in another study (α = 0.78; Ford et al., 2014), using a subset of the full ACE module limits the number of ACEs that participants could report. As a result, the sample may have experienced more ACEs than indicated by the data, and the correlations between ACEs and other variables could have been different as well. Additionally, beyond the ACE score that was determined by these 9 items, considering the heterogeneity of ACEs, future research should focus on the outcomes of these experiences, investigate whether moderation effects are specific to the type or severity of ACE, and examine how the timing of ACEs may differentially impact driving safety and outcomes.
Finally, now that the relation between ACEs and risky driving has been established, future studies should explore why ACEs are associated with greater engagement in risky driving behaviors. Further research should move beyond moderation and examine potential mediators of the relationship between ACEs and risky driving, including the role of sensation seeking in this relationship. This research would help to guide methods of intervention.
Footnotes
Acknowledgements
This study was conducted as part of the thesis research requirement for the degree of Master of Science in Psychology at Saint Louis University.
Ethical Considerations
This study received ethical approval from the Saint Louis University IRB (approval #33617) on October 4, 2023.
Consent to Participate
All participants provided written informed consent prior to participating.
Funding
The authors disclosed receipt of the following financial support for the research, authorship, and/or publication of this article: This work was supported by Saint Louis University’s College of Arts and Sciences Knoedler Research Fund.
Declaration of Conflicting Interests
The authors declared no potential conflicts of interest with respect to the research, authorship, and/or publication of this article.
Data Availability Statement
The dataset generated and analyzed during the current study is not publicly available because data sharing was not included in the IRB application but is available from the corresponding author on reasonable request.
Note
Author Biographies
Appendix
Multivariate outliers were identified using Mahalanobis and Cook’s distance tests. Mahalanobis distances were standardized, and any participants with distances exceeding 3.29 (p = 0.001) were identified as outliers. Additionally, any participants with Cook’s distances exceeding a value equal to 4 divided by the sample size were identified as outliers. All outliers were excluded from further analysis. Initially, all outliers were removed from one sample. However, after observing that removing all outliers significantly decreased the sample size, to maintain an adequate sample size, we removed multivariate outliers separately for each primary analysis. As a result, six unique samples were created.
The first sample, utilized to examine the effects of total ADHD symptoms and ACEs on risky driving, included 173 participants after 57 multivariate outliers were removed. The second sample, utilized to examine the effects of total ADHD symptoms and ACEs on distracted driving, included 181 participants after 49 multivariate outliers were removed. The third sample, utilized to examine the effects of inattention symptoms and ACEs on risky driving, included 172 participants after 58 multivariate outliers were removed. The fourth sample, utilized to examine the effects of total inattention symptoms and ACEs on distracted driving, included 187 participants after 43 multivariate outliers were removed. The fifth sample, utilized to examine the effects of hyperactivity/impulsivity symptoms and ACEs on risky driving, included 172 participants after 58 multivariate outliers were removed. The sixth sample, utilized to examine the effects of hyperactivity/impulsivity symptoms and ACEs on distracted driving, included 161 participants after 69 multivariate outliers were removed. In total, 17 iterations were required to remove all multivariate outliers across each sample.
A different process was utilized for the two supplemental analyses. These analyses were conducted using one sample. Once again, multivariate outliers were identified using Mahalanobis and Cook’s distance tests. Participants with Mahalanobis distances exceeding 3.29 or Cook’s distances exceeding a value equal to 4 divided by the sample size were identified as outliers and removed. However, an a priori power analysis that was conducted using G*Power (Faul et al., 2007) indicated that a sample size of 118 participants was necessary to achieve a power of 0.8. As a result, multivariate outliers were removed iteratively until the following iteration would result in the sample size falling below 118 participants. Thus, after 10 iterations, 109 multivariate outliers were removed, and the sample size consisted of 121 participants.
The impact of excluding multivariate outliers from these analyses could be both positive and negative. By excluding participants, we left meaningful data unanalyzed. These data points represented more extreme scores that could have changed the results. For example, participants who reported higher ACE scores may have been excluded from analyses. As a result, the effect of ACEs on risky and distracted driving may have been less significant. However, although this data may have been meaningful, it would have had a negative impact on the distribution of the sample. By including outliers within the final sample, we would have risked further violating assumptions of normality and drawing invalid conclusions.