






Abstract
Flourishing and quality of life are related constructs often used to measure overall well-being, but it is unclear whether they capture the same underlying facets of well-being or provide complementary information. This study evaluated the relationship between a multidimensional flourishing measure (i.e., the Harvard Human Flourishing Program Measure; FM) and a commonly used quality of life instrument (i.e., the Quality of Life Enjoyment and Satisfaction Questionnaire-Short Form, Q-LES-SF). Analysis was performed on a sample of 302 adult participants recruited using the online survey platform Prolific. Participants completed the FM and Q-LES-SF, as well as the Patient Health Questionnaire-9 (PHQ-9; depression), Generalized Anxiety Disorder-7 (GAD-7), Alcohol Use Disorders Identification Test (AUDIT), and the PROMIS Smoking/Nicotine Dependence scale. Pearson correlations were used to assess associations between variables, Fisher’s z-tests compared correlation magnitudes, and linear regressions tested incremental validity. FM and Q-LES-SF scores were strongly positively correlated (r = 0.81, p < .001). Both FM and Q-LES-SF showed significant negative correlations with PHQ-9 (rs = −0.69, −0.74), GAD-7 (rs = −0.65, −0.66), and AUDIT (rs = −0.17, −0.18, respectively) scores (ps < .001), with no significant differences between correlation magnitudes. Adding FM as a predictor alongside QL significantly improved the prediction of PHQ-9 and GAD-7 scores but not AUDIT or cigarette dependence scores. These findings are a first step in understanding the convergent and incremental validity of FM and QL and if the separate research programs for each measure may be mutually informative.
Introduction
Flourishing has recently gained prominence as a framework for assessing overall well-being. In 2021, Harvard University launched the Global Flourishing Study, a longitudinal investigation of 200,000 participants across 22 countries, building on the growing interest in understanding overall well-being on a global scale (Crabtree et al., 2021). This heightened interest aligns with the broader goals of positive psychology and public health to move beyond the mere absence of disease and better understand and promote well-being (Trudel-Fitzgerald et al., 2019). Flourishing is generally conceptualized as a state in which “all aspects of a person’s life are good” (VanderWeele & Johnson, 2025b). The two most well-known scales for measuring flourishing are the Flourishing Scale (Diener et al., 2010) and Human Flourishing Program’s Flourishing Measure (VanderWeele, 2017). The latter assesses well-being across six domains: happiness and life satisfaction, physical and mental health, meaning and purpose, character and virtue, social relationships, and financial stability.
A related concept for capturing well-being is quality of life. Quality of life evaluates life satisfaction across various domains, such as physical health, social relationships, and daily activities (Burckhardt & Anderson, 2003). Thus, although both quality of life and flourishing instruments intend to assess holistic well-being, they do so with different theoretical emphases: quality of life is often rooted in subjective life satisfaction within key domains (e.g., physical health, social connection) whereas flourishing extends beyond satisfaction to include purpose, virtue, and other elements of human thriving (VanderWeele & Johnson, 2025a).
Numerous instruments exist to measure quality of life, varying in length and focus. Common examples include the Quality of Life Scale (Flanagan, 1978), McGill Quality of Life Questionnaire – Expanded (Robin Cohen et al., 2019), Health-Related Quality of Life Questionnaire (HRQOL; CDC, 2022), World Health Organization Quality of Life Instrument (WHOQOL-BREF; WHO, 2024), Global Quality of Life Scale (Burckhardt & Anderson, 2003), and the Quality of Life Enjoyment and Satisfaction Questionnaire – Short Form or Q-LES-SF (Endicott et al., 1993; Stevanovic, 2011) used in the present study. These measures differ in their inclusion of domains like spirituality, their length, and complexity and their intended usage (e.g., general population surveys versus clinical trials) (Hyland, 2003).
To date, it remains unclear to what extent flourishing and quality of life reflect overlapping versus distinct constructs. Despite their different nomenclature and theoretical underpinnings, the empirical distinctions between them are not well established. There is a growing literature examining how flourishing and quality of life relate to mental health and health behaviors, but it has largely considered these constructs separately. Quality of life has well-documented associations with mental health: for example, low quality of life is linked to higher levels of anxiety and depression (Defar et al., 2023; Wilmer et al., 2021), increased likelihood of smoking initiation and reduced odds of smoking cessation (Goldenberg et al., 2014), and alcohol use disorder (Dayal & Kaloiya, 2024; Lu et al., 2022). Fewer studies have examined flourishing in relation to mental health and health behaviors, though some early evidence indicates that low flourishing is associated with mood and anxiety disorders (Schotanus-Dijkstra et al., 2017) and greater marijuana use (Rhew et al., 2021). Interestingly, there is also some evidence to suggest that flourishing improves with recovery from alcohol use disorder (Makin et al., 2022; McGaffin et al., 2015). However, findings have not been entirely consistent, as two studies found no association between flourishing and substance use (Low, 2011; Schotanus-Dijkstra et al., 2017). Additionally, one found a negative association between flourishing and marijuana use, but not alcohol consumption (Rhew et al., 2021).
In summary, flourishing and quality of life have known links to mental health and substance use, yet it is not established whether one of these well-being constructs is more strongly related to such outcomes and whether both offer unique underlying variance related to well-being. No prior research has directly compared a comprehensive flourishing and quality of life measure in the same sample. Gaining insight into these associations could clarify if flourishing and quality of life measures provide complementary information about well-being. Such knowledge may inform whether the separate research programs centered on each construct can be integrated or interpreted together.
The present study examines the convergent validity between a flourishing measure (i.e., the FM) and a quality of life measure (i.e., the Q-LES-SF) within a single sample. We examine their correlations and compare how each relates to depression, anxiety, alcohol use, and smoking. We also test whether each measure provides unique predictive value when included in combined regression models. These analyses aim to assess how FM and quality of life (as measured by the Q-LES-SF) function as distinct yet complementary indicators of well-being.
Methods
Prolific Sample and Data Collection
Participant Characteristics
Note. *n = subset of sample.
Participants completed multiple self-report assessments, including the Q-LES-SF (Endicott et al., 1993; Stevanovic, 2011), a 16-item measure of past-week life satisfaction and the FM (VanderWeele, 2017), a 12-item assessment of flourishing and well-being. The Q-LES-SF specifically asks participants to rate their satisfaction with physical health, economic stability, social relationships and ability to function over the past two weeks. FM includes questions related to six domains: meaning and purpose in life, happiness and life satisfaction, character and virtue, physical and mental health, close social relationships, and financial and material stability. Participants also completed the Alcohol Use Disorder Identification Test (AUDIT; (Higgins-Biddle & Babor, 2018), a 10-item screening tool for alcohol consumption and risky alcohol-associated behaviors; Patient Reported Outcomes Measurement Information System (PROMIS) E-cigarette: Nicotine Dependence for Daily and Nondaily Smokers – Short Form 4a and Smoking: Nicotine Dependence for Daily and Nondaily Smokers – Short Form 4a (Shadel et al., 2014), two 4-item assessments of E-cigarette and smoking dependence; Patient Health Questionnaire-9 (Kroenke et al., 2001), a 9-item screening measure for depression; and the Generalized Anxiety Disorder-7 (Spitzer et al., 2006), a 7-item screening measure for anxiety. Two attention check items were embedded in the Prolific battery instructing participants to choose a specific answer choice. Participants who answered either check incorrectly or did not complete at least 50% of the survey were excluded from analyses (n = 20). All assessments were completed using Inquisit software (Inquisit 5, 2016) and are listed in Supplemental File 2. The compensation rate was initially $6 for the first two pilot participants and then increased to $8 for all subsequent participants. This study was reviewed by the Uniformed Services University Human Research Protections Program and determined to be exempt from Institutional Review Board oversight. This manuscript was prepared with consideration of Strengthening the Reporting of Observational Studies in Epidemiology (STROBE) guidelines (Cuschieri, 2019).
Data Analysis
Data were analyzed using R, version 4.4.1 (R Core Team, 2023). Cronbach’s alpha was calculated to determine internal consistency. Shapiro-Wilk tests were used to assess normality. Pearson’s correlation coefficients were calculated to assess bivariate correlations between FM, Q-LES-SF, and each health outcome (AUDIT, PROMIS, PHQ-9, and GAD-7). Fisher’s z-test was then used to determine whether there were significant differences between correlation coefficients. To determine whether FM improved model fit, linear regression analyses were first performed with Q-LES-SF and each dependent variable individually. FM was then added to each model. To assess model fit, we calculated the difference in Akaike Information Criteria (AIC) and Bayesian Information Criteria (BIC) values between models containing only Q-LES-SF and models containing both Q-LES-SF and FM as predictors. Additionally, ANOVA was utilized to compare explained variance between models. This process was repeated for each individual dependent variable. An alpha value of 0.05 was used for all analyses. Furthermore, all analyses used pairwise deletion, so that if the participant was missing data on either of the variables used in the analysis, they were dropped from that analysis, but included in all others where data was available. With 302 participants in the primary analytic sample, we were powered to detect correlations of 0.16 with 80% power and alpha of 0.05.
Results
Participant Characteristics
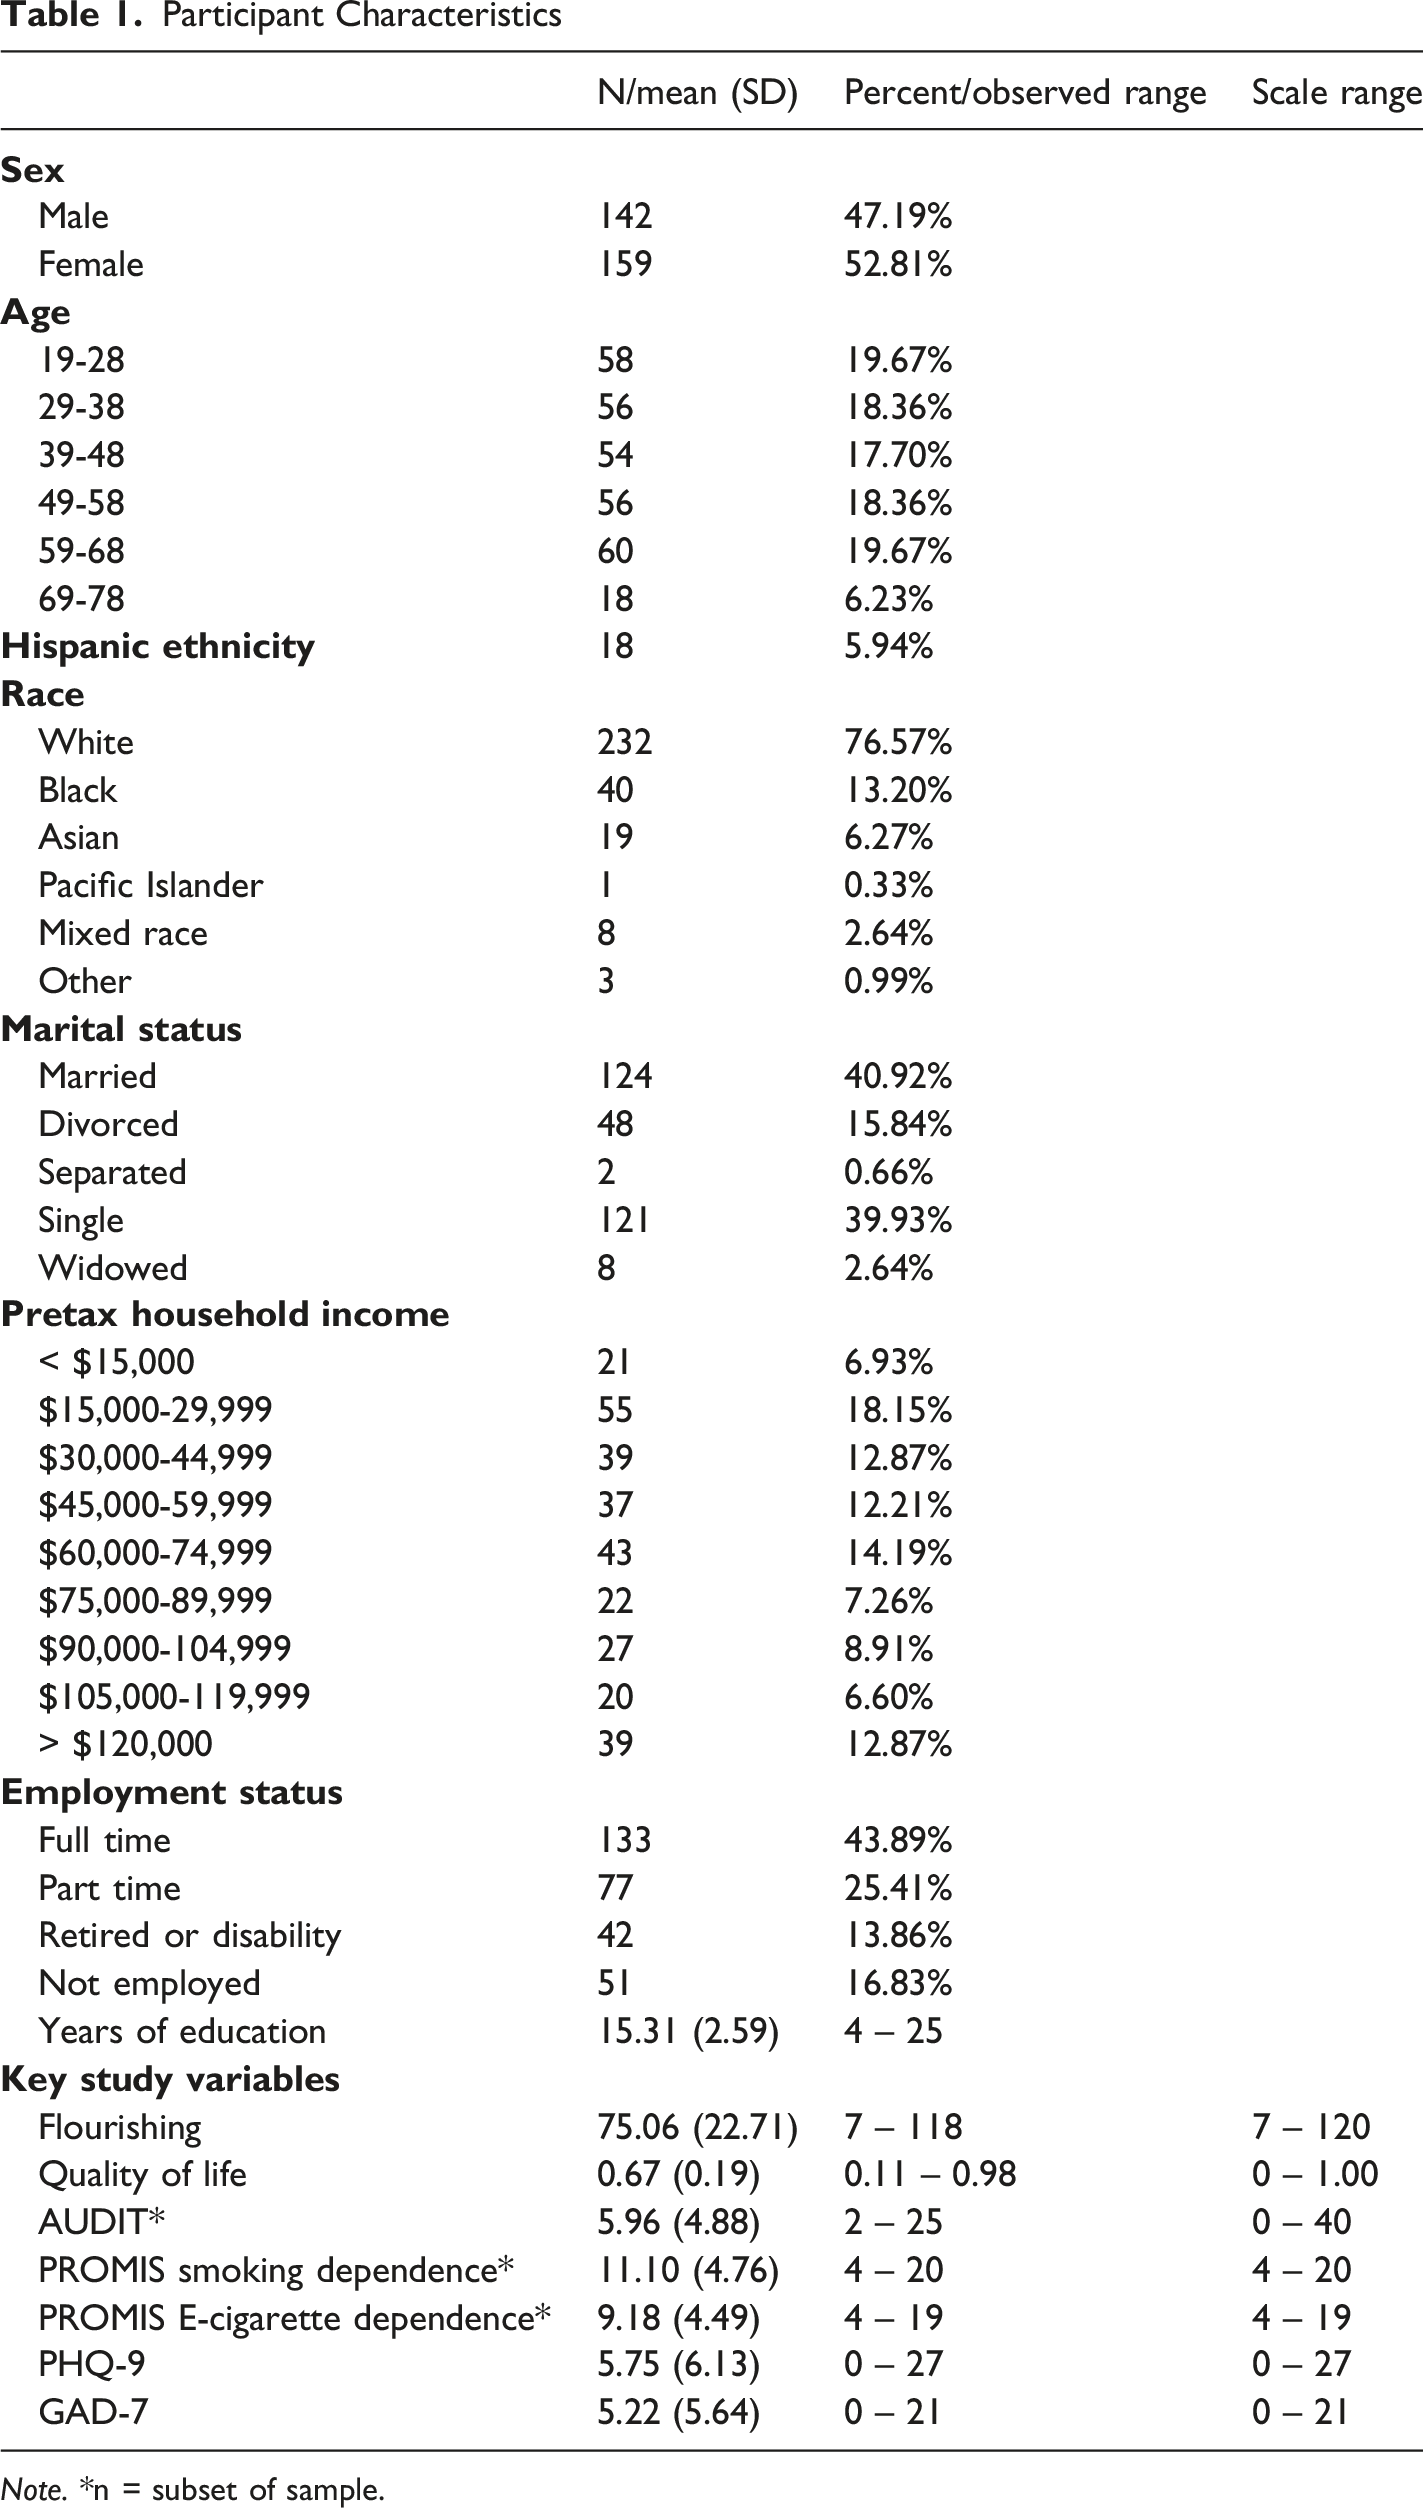
Demographic characteristics of the sample are presented in Table 1. Briefly, participants ranged in age from 19 to 78 years (mean age = 45.4, SD = 15.4), with a roughly even gender split (47% male, 53% female). While diverse, the sample overall tended to have lower levels of mental health symptoms or substance abuse. Although Shapiro-Wilk test indicated that multiple variables deviated from normality (Table S2), Spearman correlations were highly similar to Pearson correlations (Table S3). We therefore retained Pearson correlations in the primary analyses due to their interpretability and consistency with prior literature.
FM and Q-LES-SF
Both FM and Q-LES-SF demonstrated high internal consistency in this sample (Cronbach’s α = 0.91 for FM, 0.94 for Q-LES-SF). On average, participants reported moderately high levels of well-being: the mean FM score was 75.06 (SD = 22.71) on the 0–120 flourishing scale, and the mean Q-LES-SF score was 0.67 (SD = 0.19) when expressed as proportion of the maximum (67% satisfaction). There was a statistically significant strong positive correlation between FM and Q-LES-SF, (r = .81, p ≤ 2.2e-16). The scatterplot between FM and Q-LES-SF is shown in Figure 1. Flourishing and Quality of Life. There was a strong, positive correlation between FM and Q-LES-SF scores, r = .81, p ≤ 2.2e-16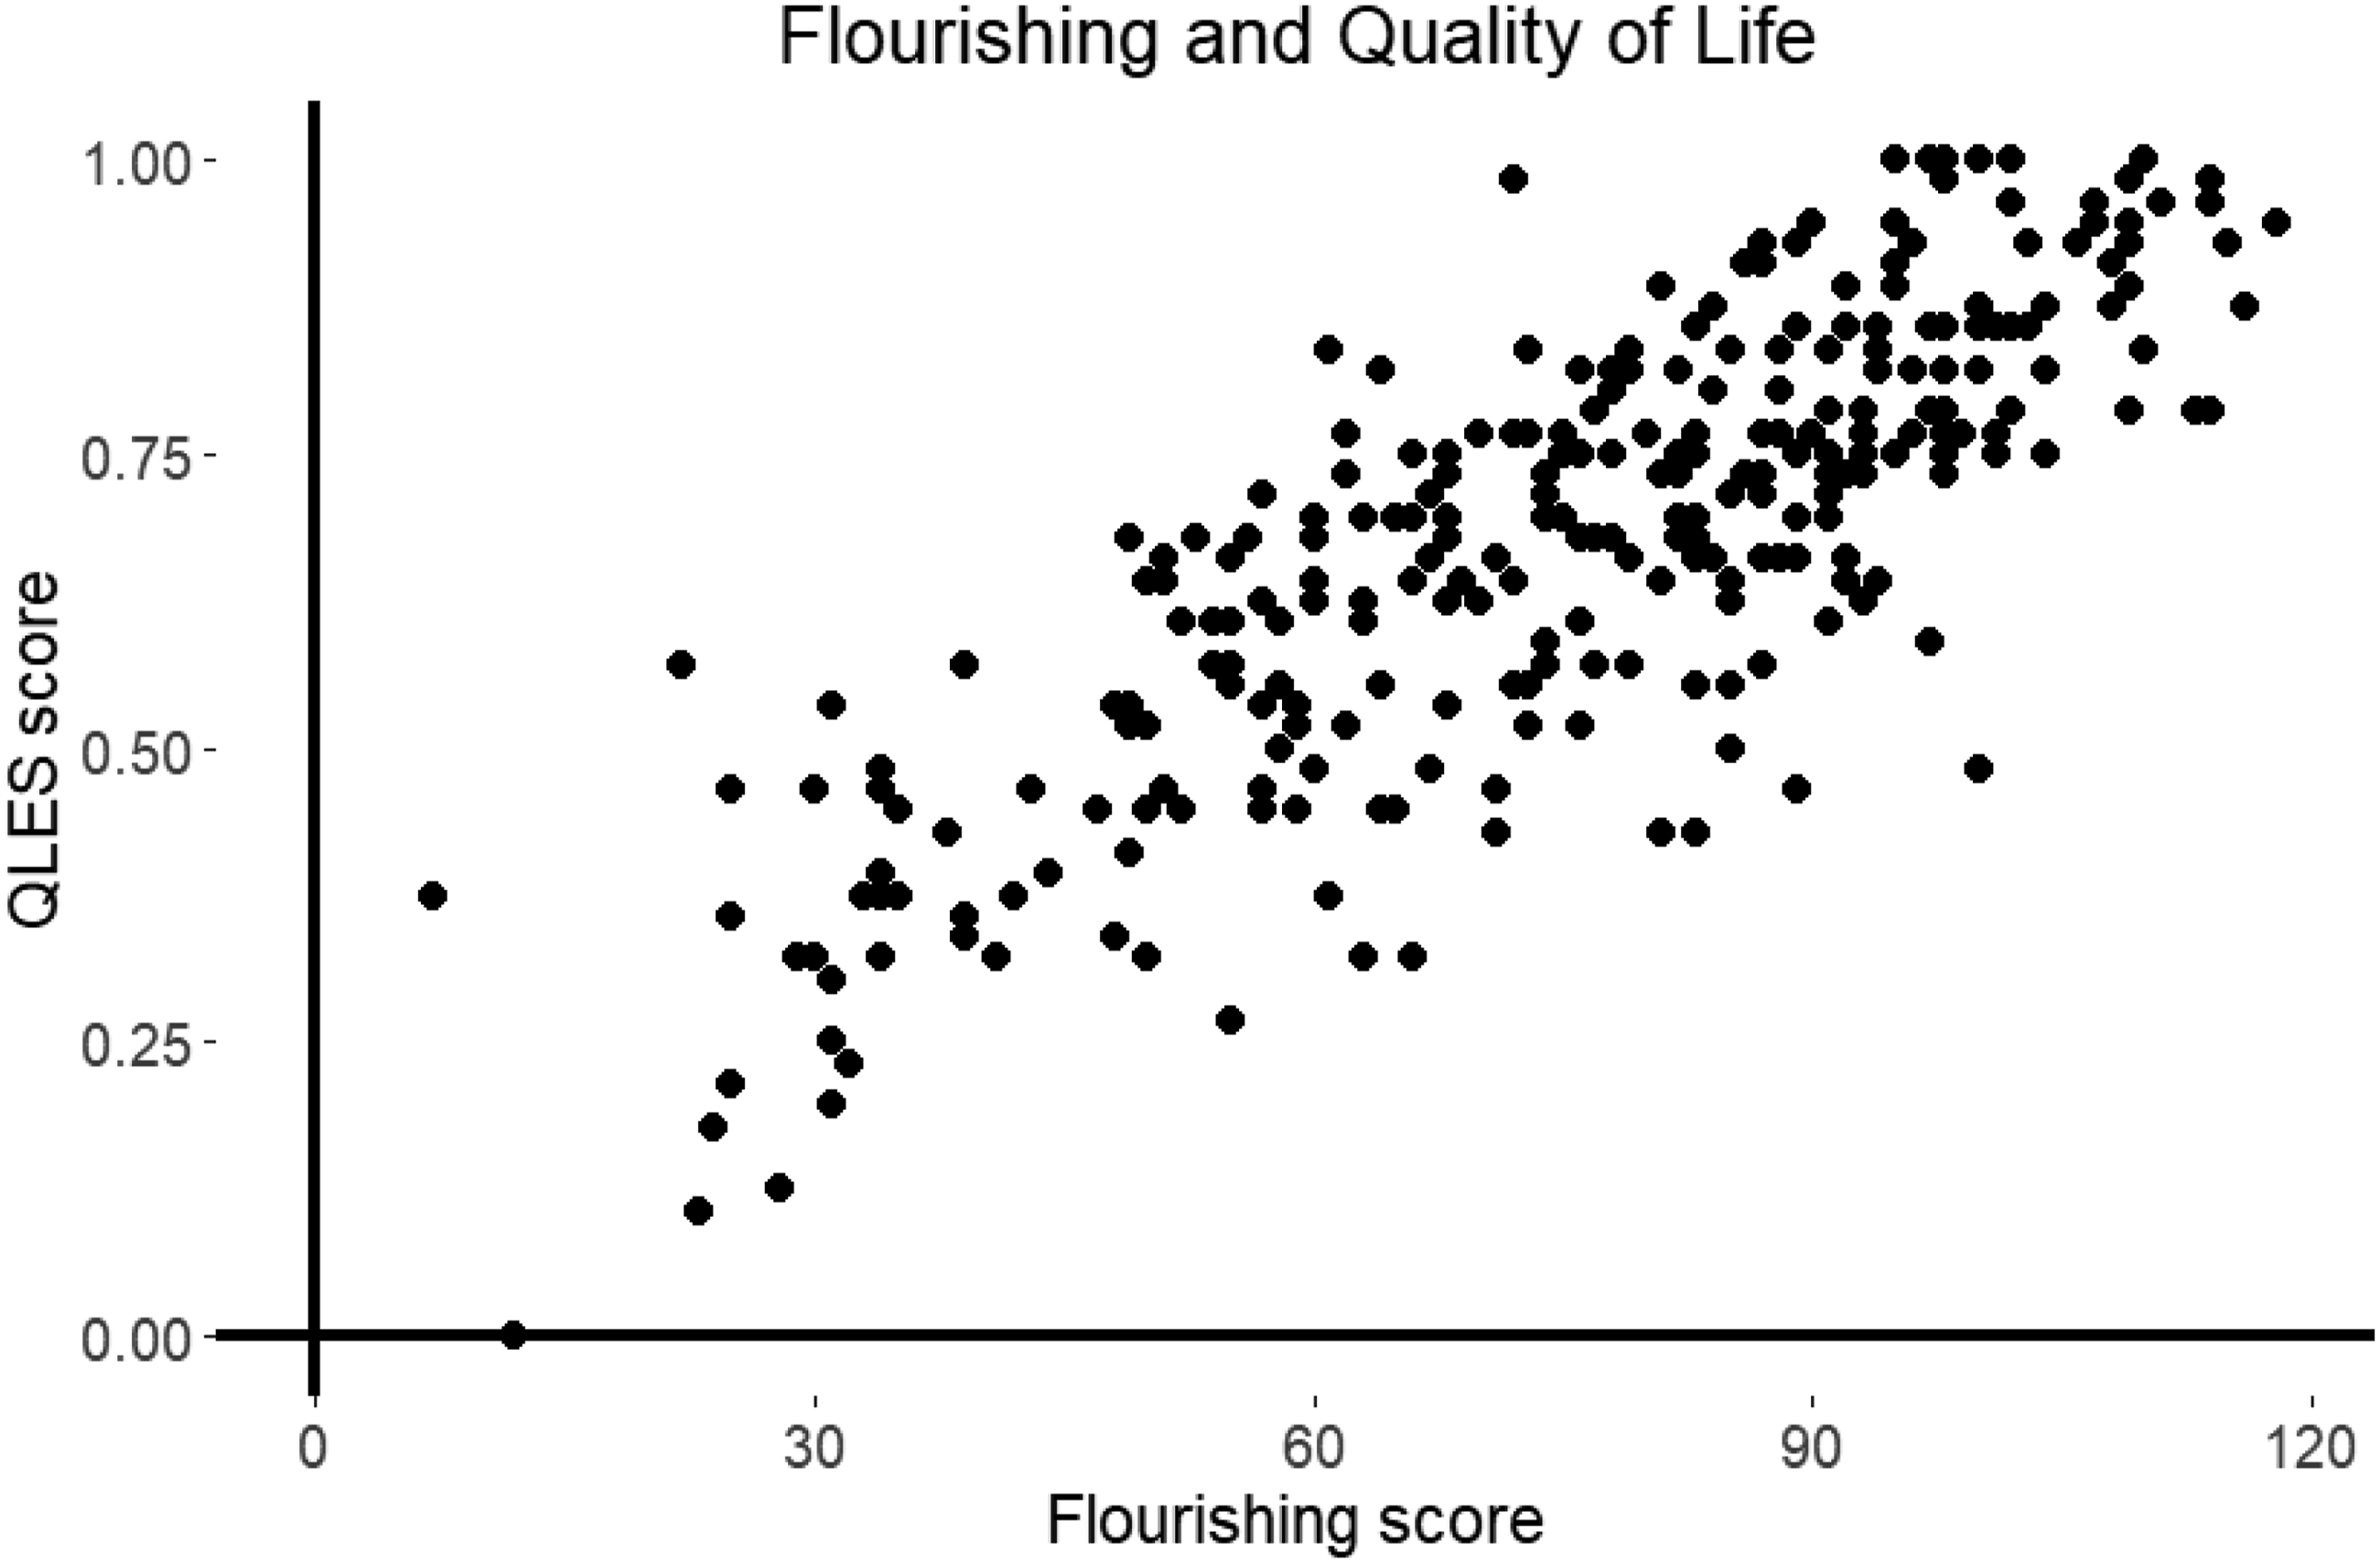
AUDIT
AUDIT scores were only calculated for individuals who reported alcohol consumption (n = 211). Cronbach’s α for the AUDIT was 0.82. There was a negative correlation between FM and AUDIT scores (r = −0.17, p = 0.013; Figure 2(A)). Similarly, there was a negative correlation between Q-LES-SF and AUDIT (r = −0.18, p = 0.008; Figure 2(B)). A Fisher’s z-test determined these two correlation coefficients were not significantly different from each other (z = −0.12, p = 0.91). Flourishing and Quality of Life with Mental Health Measures. Dep. = dependence. (A) Flourishing and Problematic Drinking, r = −0.17, p = 0.013. (B) Quality of Life and Problematic Drinking, r = −0.18, p = 0.008. (C) Flourishing and Smoking Dependence, r = −.23, p = 0.15. (D) Quality of Life and Smoking Dependence, r = −0.41, p = 0.008. (E) Flourishing and E-Cigarette Dependence, r = −.11, p = 0.50. (F) Quality of Life and E-Cigarette Dependence, r = −0.34, p = 0.03. (G) Flourishing and Depression, r = −0.69, p ≤ 2.2e-16. (H) Quality of Life and Depression, r = −0.74, p ≤ 2.2e-16. (I) Flourishing and Anxiety r = −0.65, p ≤ 2.2e-16. (J) Quality of Life and Anxiety, r = −0.66, p ≤ 2.2e-16. Overall, higher flourishing and quality of life as measured by the FM and Q-LES-SF, respectively, were similarly associated with lower depression, anxiety, and substance dependence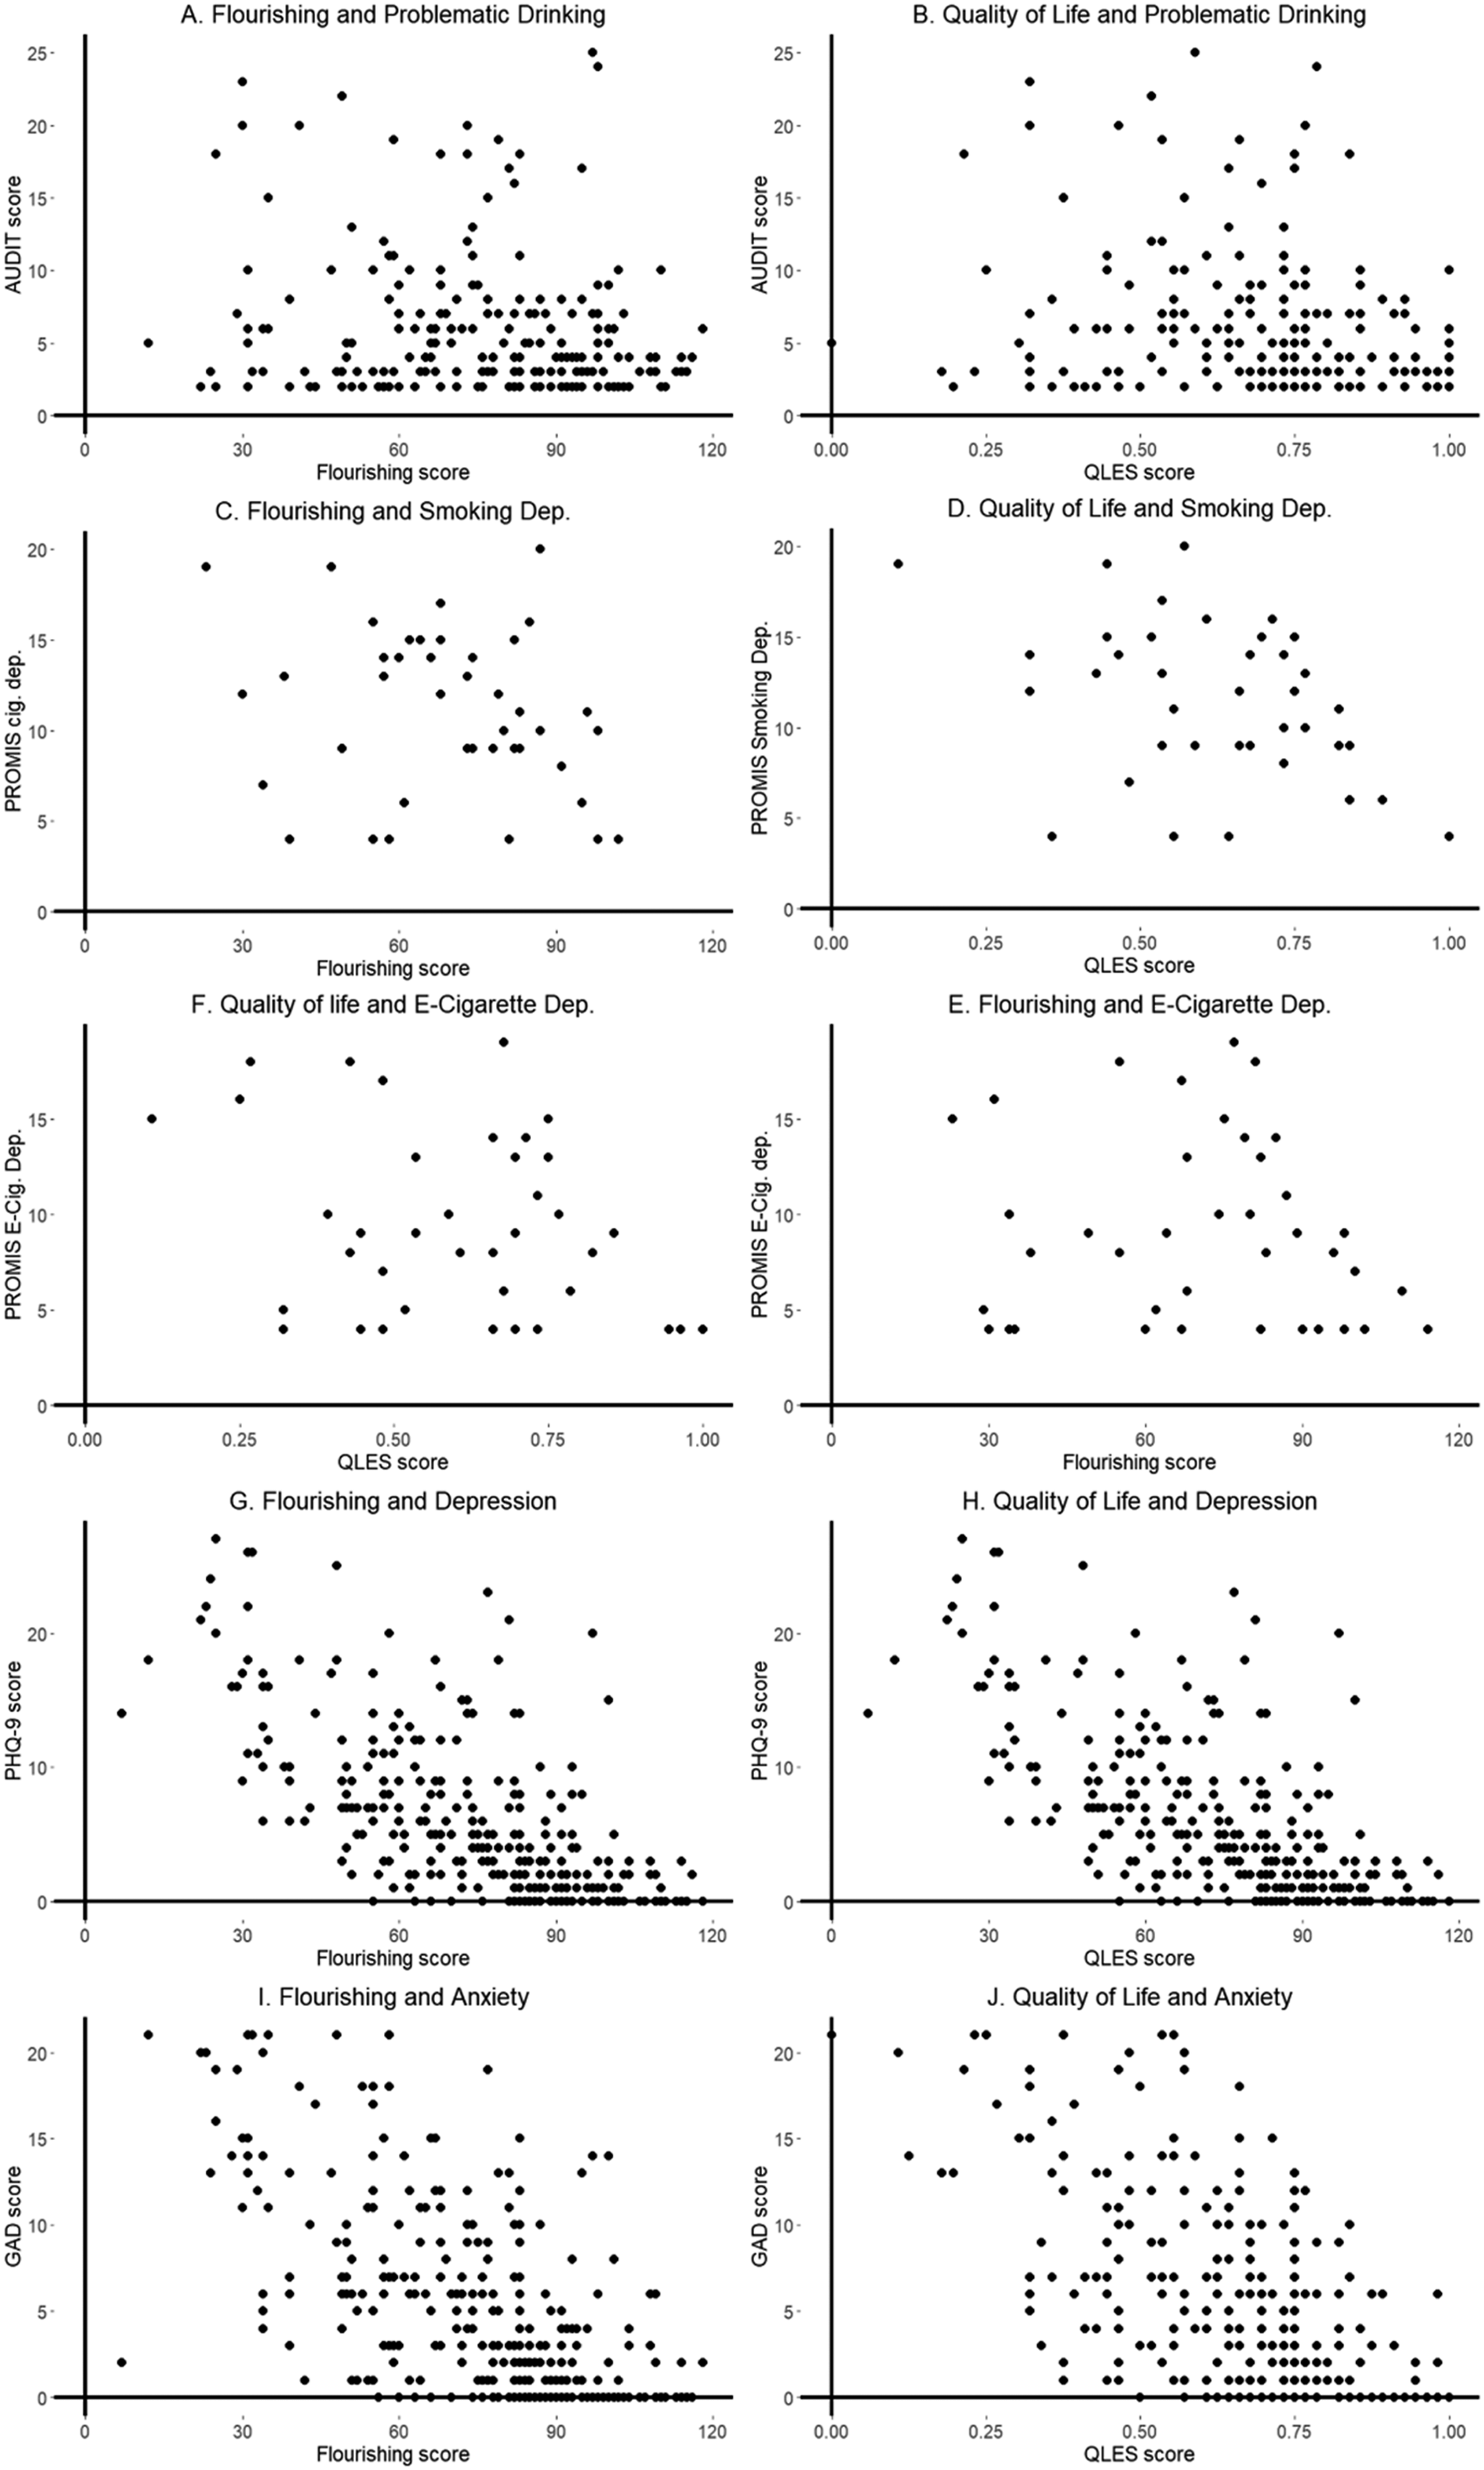
PROMIS Nicotine Dependence
There was a significant negative correlation with ever smoking and FM (r = −0.13, p = 0.027), but not Q-LES-SF (r = −.10, p = 0.09). Among participants who reported smoking cigarettes in the last 30 days (n = 43), there was a significant negative correlation between smoking dependence and Q-LES-SF (r = −0.41, p = 0.008; Figure 2(D)), but not FM (r = −.23, p = 0.15; Figure 2(C)). There was no significant correlation between lifetime E-cigarette use and QL or FM (ps > .05). However, among participants who reported E-cigarette use in the last 30 days (n = 40), there was a significant negative correlation between E-cigarette nicotine dependence and Q-LES-SF (r = −0.34, p = 0.03; Figure 2(F)), but not FM (r = −.11, p = 0.50; Figure 2(E)).
PHQ-9
Cronbach’s α for the PHQ-9 was 0.91. There was a negative correlation between FM and PHQ-9 scores (r = −0.69, p ≤ 2.2e-16; Figure 2(G)). Similarly, there was a negative correlation between Q-LES-SF and PHQ-9 (r = −0.74, p ≤ 2.2e-16; Figure 2(H)). A Fisher’s z-test determined these two correlation coefficients were not significantly different from each other (z = −1.06, p = 0.29).
GAD-7
Cronbach’s α for the GAD-7 was 0.94. There was a negative correlation between FM and GAD-7 scores (r = −0.65, p ≤ 2.2e-16; Figure 2I). Similarly, there was a negative correlation between Q-LES-SF and GAD-7 (r = −0.66, p ≤ 2.2e-16; Figure 2(J)). A Fisher’s z-test determined these two correlation coefficients were not significantly different from each other (z = −0.27, p = 0.78).
Model Fit Analyses
Model Fit Statistics
Note. Model 1: Quality of life; Model 2: Quality of life and Flourishing; p-value for difference in explained variance.
Discussion
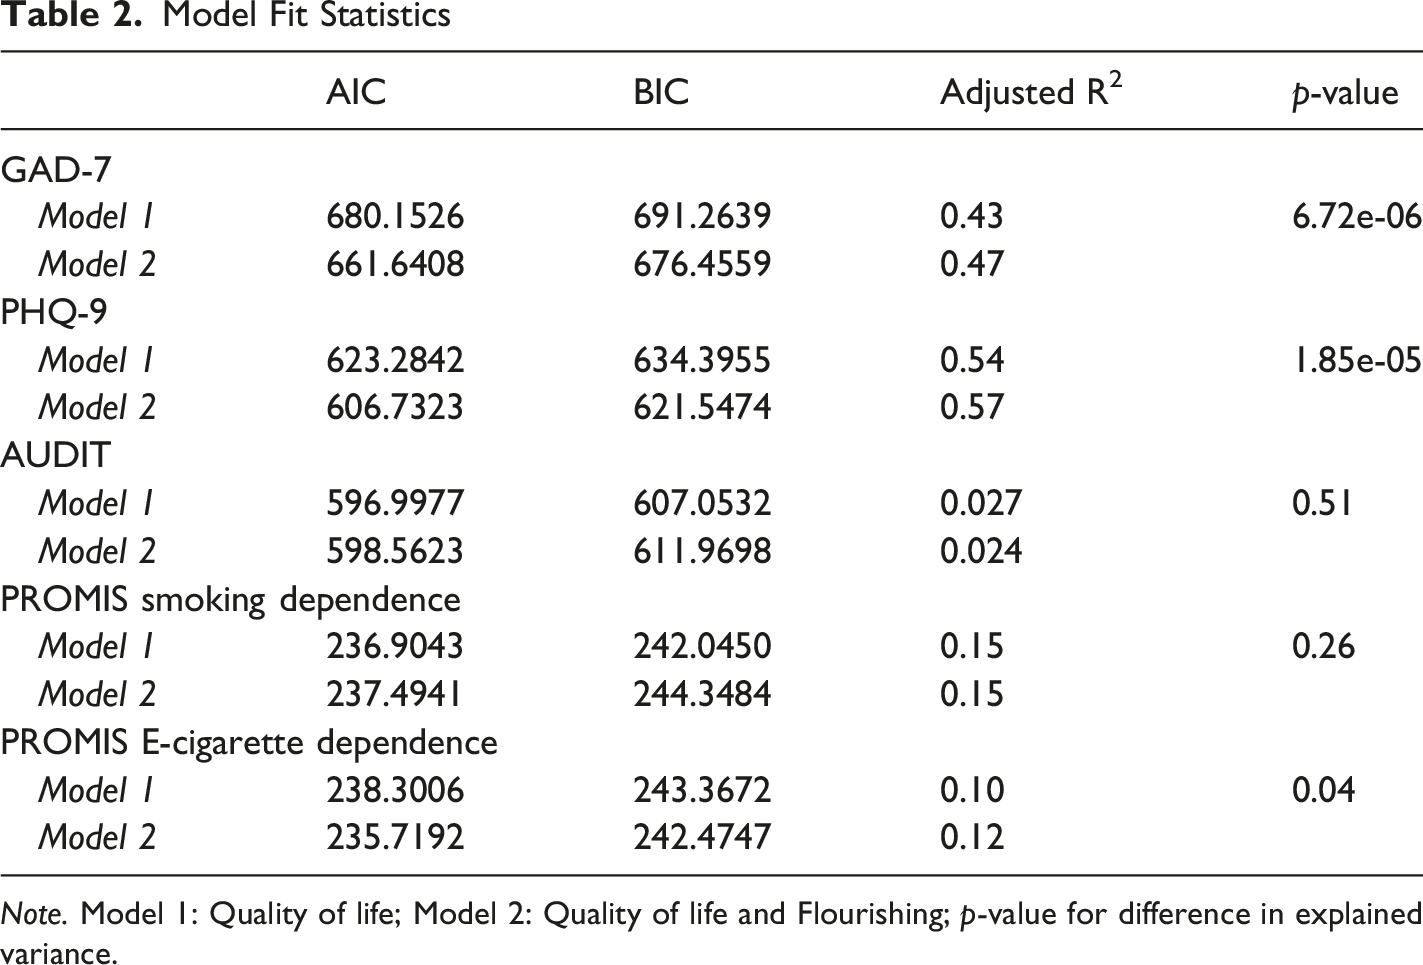
The present study aimed to assess the convergent and incremental validity of two known measures of well-being, flourishing and quality of life. This study showed high levels of similarity but non-redundancy among the FM and Q-LES-SF. Specifically, FM and Q-LES-SF were very strongly correlated (r = .81) and similarly negatively associated with all measures of alcohol use and mental health, with mixed results relating to ever smoking, smoking, and E-cigarette dependence. Additionally, adding FM led to a modest but statistically significant improvement in explaining variance in depression, anxiety, and E-cigarette dependence (though not for alcohol use or smoking). This suggests that although FM and QL are closely related indicators of well-being, FM may encompass additional dimensions that are particularly relevant for mental health outcomes. Interestingly, FM was positively associated with E-cigarette dependence when controlling for QL despite negative univariate association, indicating a potential suppression effect. The residual variance unique to FM may not be negatively associated, or even weakly associated, with E-cigarette use. Additionally, the increase in R2 for predicting E-cigarette was particularly modest and may be simply due to measurement error.
This study is the first to our knowledge to directly compare the Harvard flourishing scale with a multi-item quality of life scale. A recent study found significant positive correlation (r = 0.75) between FM and a unidimensional measurement of quality of life (Shiba et al., 2022). Our finding of an ∼0.8 correlation between FM and Q-LES-SF is consistent with those observations, reiterating the notion that flourishing shares a large common core with general life satisfaction or quality of life measures. In our data, individuals with elevated anxiety and depression symptoms or higher substance use tended to report both lower flourishing and lower quality of life in tandem, which is not surprising given that both constructs encompass content related to mood, functioning, and life satisfaction. At the same time, the fact that FM accounted for modest additional variance in depression and anxiety suggests that it taps into aspects of well-being not fully measured by Q-LES-SF. One interpretation is that FM includes items that place greater emphasis on meaning,purpose and character than Q-LES-SF. For instance, someone may be relatively satisfied with their life circumstances yet still feel a lack of deeper meaning or self-actualization. The Q-LES-SF is likely also more context and situation dependent, as it specifically asks individuals to consider aspects of their life satisfaction within the last week. Finally, the inclusion of subscales of FM that focus on higher-level introspection (such as meaning in life, character, and virtue) may be a significant distinguisher for predicting mental health in a sample such as ours that was relatively healthy, educated and had high levels of employment. Because FM also includes these questions in addition to those more associated with day-to-day well-being, it may have wider applicability in psychological research that specifically focuses on mental health.
There are multiple limitations specific to this study. While this sample was stratified to mirror age, sex, and ethnic demographic representation of U.S. Census Bureau data, this sample was predominantly healthy, which skewed data towards healthier scores on all variables. Thus, it is unclear how these results would generalize to clinical populations with lower Q-LES-SF or FM scores and greater endorsement of mental health and substance use problems. Participants were recruited through the online platform Prolific, and prior studies have found some discrepancies between users of online surveys and the general population, including demographic differences and lower subjective well-being (Stone et al., 2019). Although a recent study found that Prolific users provided relatively high-quality data compared to other crowdsourced respondents (Douglas et al., 2023), the usage of this type of sample may limit generalizability. Additionally, the cross-sectional nature of this study limits its ability to make conclusions on causality or examine the trajectory of these associations over time, and the statistical methods used primarily address convergent and discriminant validity. Thus, we are unable to comment specifically on distinguishing between construct overlap, which would require analyses of latent variables. Some analyses, particularly those involving cigarette and E-cigarette dependence, were performed on a significantly smaller subset of participants, limiting power. Finally, our focus was on one particular flourishing scale and one particular quality of life scale—results may differ with other instruments. Quality of life can be measured in more domain-specific ways (e.g., health-related quality of life in medical studies) and flourishing can also be assessed with different scales (such as Diener’s Flourishing Scale (Diener et al., 2010)). The general pattern of strong overlap might hold broadly, but the exact degree of complementarity could vary with the tools and contexts.
Conclusion
This study provides early evidence indicating that flourishing and quality of life are highly correlated constructs and account for similar levels of variance related to well-being. However, because of FM’s propensity to improve model fit when predicting GAD-7, PHQ-9, and some substance-related scores, it likely captures broader aspects of well-being than a QL measure such as Q-LES-SF alone. This suggests that FM may be an improvement in the measurement of wellbeing or be able to provide insight on functioning across multiple domains. Future studies with clinical and non-US populations, additional measures, and longitudinal analyses are needed to provide further quantitative evidence for the distinctiveness of FM from QL and other measures of well-being.
Supplemental Material
Supplemental material - A Cross-Sectional Study Comparing Flourishing and Quality of Life as Indicators of Psychological Well-Being in Adults
Supplemental material for A Cross-Sectional Study Comparing Flourishing and Quality of Life as Indicators of Psychological Well-Being in Adults by Michael Setzer, Samantha G. Malone, Ravi A. Iyer, Emma L. Winterlind, and Joshua C. Gray in Psychological Reports
Supplemental Material
Supplemental material - A Cross-Sectional Study Comparing Flourishing and Quality of Life as Indicators of Psychological Well-Being in Adults
Supplemental material for A Cross-Sectional Study Comparing Flourishing and Quality of Life as Indicators of Psychological Well-Being in Adults by Michael Setzer, Samantha G. Malone, Ravi A. Iyer, Emma L. Winterlind, and Joshua C. Gray in Psychological Reports
Footnotes
Author note
The authors agree to this author order

Ethical Considerations
This study was deemed exempt from the Uniformed Services University IRB, and all individuals consented to participate in the survey.
Funding
The authors disclosed receipt of the following financial support for the research, authorship, and/or publication of this article: Support provided by National Institute on Alcohol Abuse and Alcoholism (R01-AA030041) and the Department of Defense (HU0001-22-2-0066).
Declaration of Conflicting Interests
The authors declared no potential conflicts of interest with respect to the research, authorship, and/or publication of this article.
Data Availability Statement
Data and materials used for this study are available upon reasonable request of the corresponding author.
Disclaimer
The opinions and assertions herein are those of the authors and do not necessarily reflect the official views of the Henry M. Jackson Foundation for the Advancement of Military Medicine, Inc. Moreover, the opinions and assertions herein do not necessarily reflect the official views of the Department of Defense, Uniformed Services University, the National Institute on Alcohol Abuse and Alcoholism, the US Government, and do not imply endorsement by the Federal Government.
Supplemental Material
Supplemental material for this article is available online.
Author Biographies
References
Supplementary Material
Please find the following supplemental material available below.
For Open Access articles published under a Creative Commons License, all supplemental material carries the same license as the article it is associated with.
For non-Open Access articles published, all supplemental material carries a non-exclusive license, and permission requests for re-use of supplemental material or any part of supplemental material shall be sent directly to the copyright owner as specified in the copyright notice associated with the article.
