
Abstract
Objective:
Although the overall incidence of tuberculosis (TB) in the United States has declined in the last 2 decades, the incidence among racial and ethnic minority populations remains elevated. The objective of this study was to estimate the contributions of 4 risk factors to the incidence of TB, stratified by race and ethnicity and recent transmission in the United States.
Methods:
We estimated the population attributable fractions (PAFs) of TB and TB attributed to recent transmission (RT-TB) associated with HIV, diabetes, current incarceration, and past-year experience of homelessness in the United States during 2011-2015 and 2016-2019, stratified by race and ethnicity.
Results:
The 4 risk factors contributed modestly to TB and RT-TB in the overall US population. During 2016-2019, the estimated PAFs for HIV were 5.0% of all TB cases (6.0% among RT-TB), 6.7% (6.0% among RT-TB) for diabetes, 2.8% (3.9% among RT-TB) for incarceration, and 4.1% (11.3% among RT-TB) for homelessness but varied substantially by race and ethnicity. Diabetes-associated PAFs for RT-TB were >10% among Asian, Hispanic, and Native Hawaiian or Other Pacific Islander populations but 0% among other populations. By contrast, PAFs for RT-TB associated with homelessness were <2% among Asian and Native Hawaiian or Other Pacific Islander populations but >10% among Hispanic, Black, American Indian or Alaska Native, and White populations.
Conclusions:
Efforts to reduce TB disparities in the United States should consider race and ethnicity and associated context.
Although the overall incidence of tuberculosis (TB) in the United States has declined substantially in the past 2 decades, disparities in TB among racial and ethnic minority populations (compared with the non-Hispanic White population) have increased since 1994.1,2 For example, in 2023, the incidence of TB among the US-born Native Hawaiian or Other Pacific Islander population was more than 25 times higher than among the US-born non-Hispanic White population and approximately 14, 7, 5, and 5 times higher among US-born populations of non-Hispanic American Indian or Alaska Native, Black, and Asian people and Hispanic people, respectively, compared with the US-born non-Hispanic White population. 3 A previous study estimated that the excess TB cases resulting from these racial and ethnic disparities constituted 62% and 69% of all TB cases among males and females from 2011 through 2021. 4 It is therefore critical to understand the risk factors contributing to higher TB incidence, specifically among racial and ethnic minority populations. A better quantitative understanding of such racial and ethnic differences in TB risk factors might not only inform effective TB reduction measures but also help advance equity in the approach to TB elimination in the United States.
Although racial and ethnic disparities in TB have been well documented, mechanisms that may lead to a higher incidence of TB in racial and ethnic minority populations are likely to be multifactorial. One mechanism by which these disparities manifest could be a consequence of the disproportionate prevalence of social and medical risk factors for TB. In the United States, 4 risk factors known to increase TB risk are routinely reported to the Centers for Disease Control and Prevention (CDC), including the medical comorbidities of HIV5,6 and diabetes, 7 which are associated with the progression of TB disease, and factors associated with TB exposure and transmission, such as homelessness 8 and incarceration. 9 The prevalence of these risk factors varies among racial and ethnic population groups and may contribute to increased rates of TB incidence.10 -13 For example, a study found that diabetes was associated with an increased prevalence of latent TB infection (LTBI) among non-Hispanic Asian and Hispanic adults, while it found no association among non-Hispanic Black or White adults. 14 Other community-based socioeconomic and medical factors that are not routinely captured in TB surveillance activities may also contribute to the higher TB incidence among racial and ethnic minority populations (compared with non-Hispanic White populations).15,16 The objective of this study was to estimate the contributions of 4 risk factors to the incidence of TB, stratified by race and ethnicity and recent transmission in the United States.
Methods
Study Population and TB Data
In this study, we used TB data reported to the National Tuberculosis Surveillance System (NTSS) in the United States during the 9-year period from 2011 through 2019. 17 We subdivided the period into 2011-2015 and 2016-2019 to capture any potential secular trends. We also stratified TB cases by whether they were attributed to recent transmission (RT-TB) based on the RT variable in the NTSS database.2,18 We attributed a TB case to RT if a plausible source case with a matching genotype was identified in close geographic proximity within 2 years of diagnosis. 19 Race and ethnicity were defined based on US Census Bureau classification of the population into the following self-reported, single racial and ethnic population groups: non-Hispanic Asian (referred to as Asian hereinafter), non-Hispanic Native Hawaiian or Other Pacific Islander (NHPI), Hispanic, non-Hispanic Black (referred to as Black hereinafter), non-Hispanic American Indian or Alaska Native (AI/AN), and non-Hispanic White (referred to as White hereinafter). 20
We focused on 4 risk factors for TB: HIV, diabetes, incarceration, and homelessness. NTSS collects data on these risk factors for all reported TB cases in the United States. Diagnoses of HIV infection and diabetes can occur prior to or at the time of TB diagnostic evaluation and are confirmed based on medical records. 18 People reporting diabetes are people with diabetes at the time of TB diagnosis. 18 Incarceration refers to people currently incarcerated in detention facilities at the time of their TB diagnostic evaluation, and homelessness refers to people who experienced homelessness within the year before their TB diagnostic evaluation. 18
Estimating the Prevalence of Select TB Risk Factors
We used publicly available data21 -39 to estimate the number of people with each risk factor stratified by race and ethnicity. Details are provided in the Supplement.
Estimating Race- and Ethnicity-Specific Population Attributable Fractions
For each of the 2 periods, we estimated the population attributable fraction (PAF) of all TB and TB-RT cases associated with each of the 4 risk factors in each racial and ethnic group. We estimated PAFs by using the Levin formula, 40 in which the PAFr,g of TB attributable to the risk factor r in racial and ethnic population group g is defined as

Here, IRRr,g is the estimated incidence rate ratio (IRR) of TB with respect to risk factor r in population g, and Pr,g is the estimated prevalence of risk factor r in population g.
We estimated the IRR linked to each risk factor IRRr,g by taking the ratio of the incidence of TB among people of race and ethnicity g with risk factor r relative to people without risk factor r. We generated separate IRR estimates for all TB cases and all RT-TB cases and for each of the 2 periods. We calculated corresponding 95% CIs by incorporating the uncertainty in the prevalence estimates (when available) and the sample size of TB case counts. Details are provided in the Supplement.
Ethical Considerations
This analysis used NTSS data collected as part of routine public health surveillance. The NTSS operates under an Assurance of Confidentiality issued by CDC under sections 306 and 308(d) of the Public Health Service Act (42 USC 242k and 242m[d]), which prohibits disclosure of information that could be used to directly or indirectly identify patients. Johns Hopkins School of Public Health Institutional Review Board (IRB) policy does not require IRB oversight for studies involving data analysis of deidentified data.
Results
Stratified TB Case Notifications
A total of 79 737 TB cases were reported during 2011-2019: 48 856 occurred during 2011-2015 and 30 881 during 2016-2019 (Table 1). Of these, 17 001 (21.3%) cases were missing RT status; 8577 cases were attributed to RT, accounting for 10.8% of all cases and 13.7% of cases with RT status available. The prevalence of RT-TB was high among the AI/AN population (30.6%), NHPI population (19.2%), and Black population (16.1%), as well as the population with HIV (14.4%), the population currently incarcerated (12.9%), and the population experiencing homelessness within the past year (27.7%).
Reported tuberculosis (TB) cases stratified by classification of recent transmission (RT), period, race and ethnicity, and risk factors, United States, 2011-2019 a
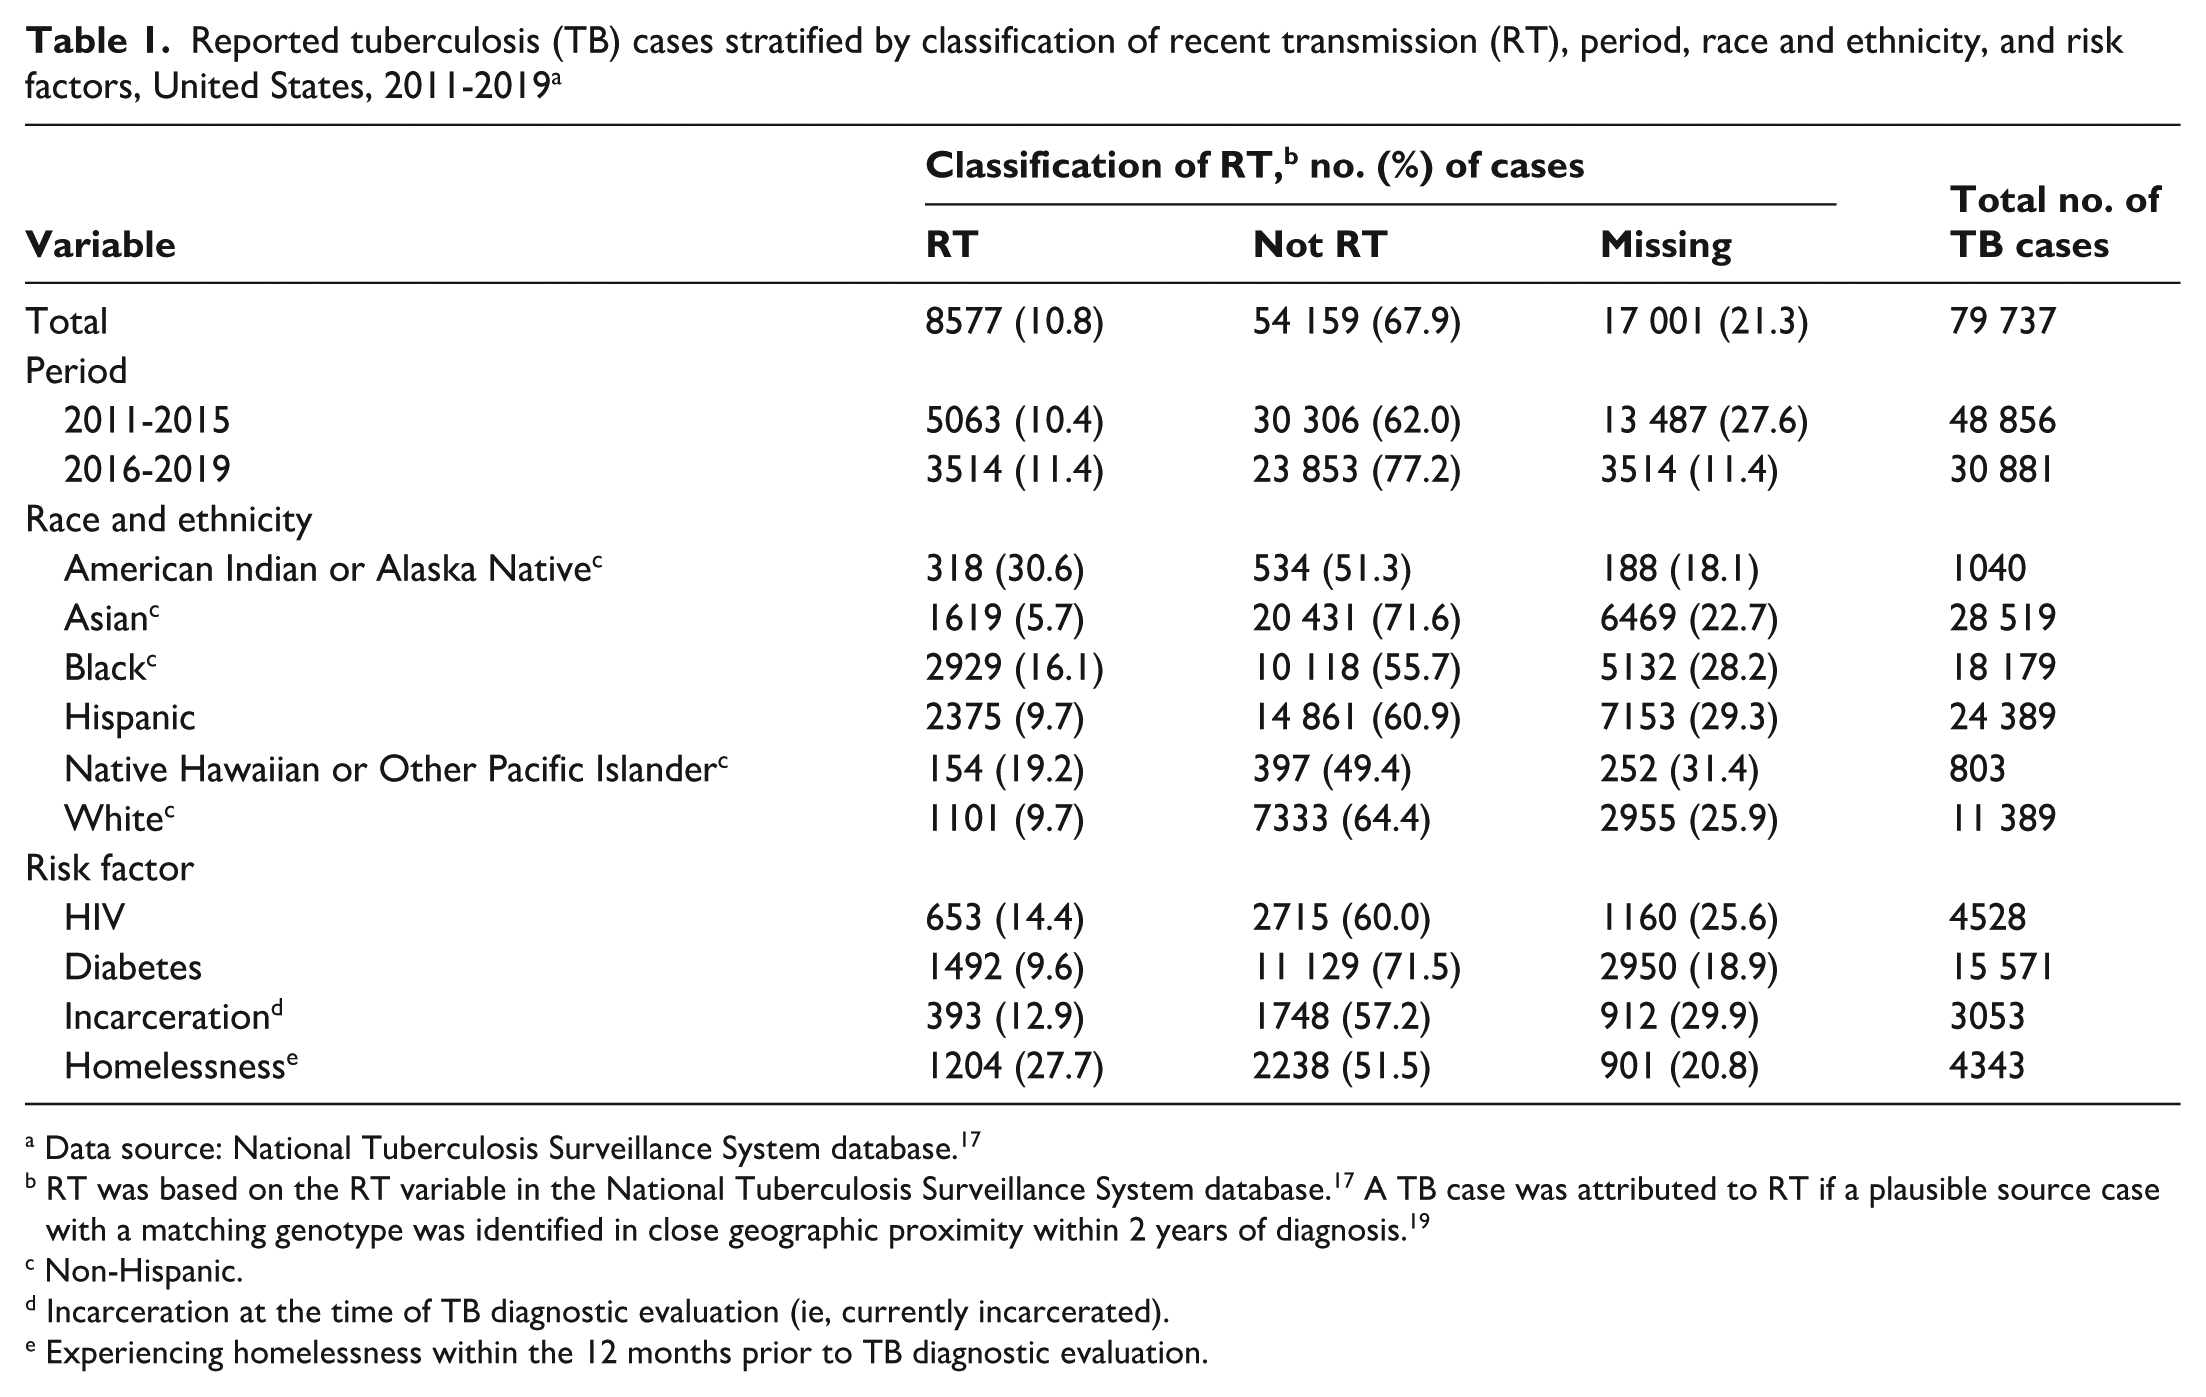
Data source: National Tuberculosis Surveillance System database. 17
RT was based on the RT variable in the National Tuberculosis Surveillance System database. 17 A TB case was attributed to RT if a plausible source case with a matching genotype was identified in close geographic proximity within 2 years of diagnosis. 19
Non-Hispanic.
Incarceration at the time of TB diagnostic evaluation (ie, currently incarcerated).
Experiencing homelessness within the 12 months prior to TB diagnostic evaluation.
Estimated Prevalence of Risk Factors
The prevalence of HIV in the overall population in the United States was 0.4% (95% CI, 0.3%-0.5%) during both 2011-2015 and 2016-2019 (Table 2), with substantial differences across racial and ethnic groups. During 2016-2019, the HIV prevalence varied from 0.1% (95% CI, 0.1%-0.2%) among Asian people to 1.1% (95% CI, 0.9%-1.2%) among Black people. The prevalence of diabetes in the overall population was 13.0% (95% CI, 12.0%-14.1%) during 2011-2015 and increased marginally to 14.3% (95% CI, 12.9%-15.8%) during 2016-2019. The prevalence of current incarceration in the overall population was 0.3% during both 2011-2015 and 2016-2019. Incarceration prevalence during 2016-2019 was 0.6% among Hispanic people, 1.1% among Black people, and 0.8% among AI/AN people. Finally, the prevalence of homelessness was 0.5% during both 2015-2019 and 2016-2019, but it varied across racial and ethnic groups, from 0.1% among Asian people to 1.5% among NHPI and Black people.
Estimated prevalence of risk factors, stratified by race and ethnicity, United States, 2011-2019 a
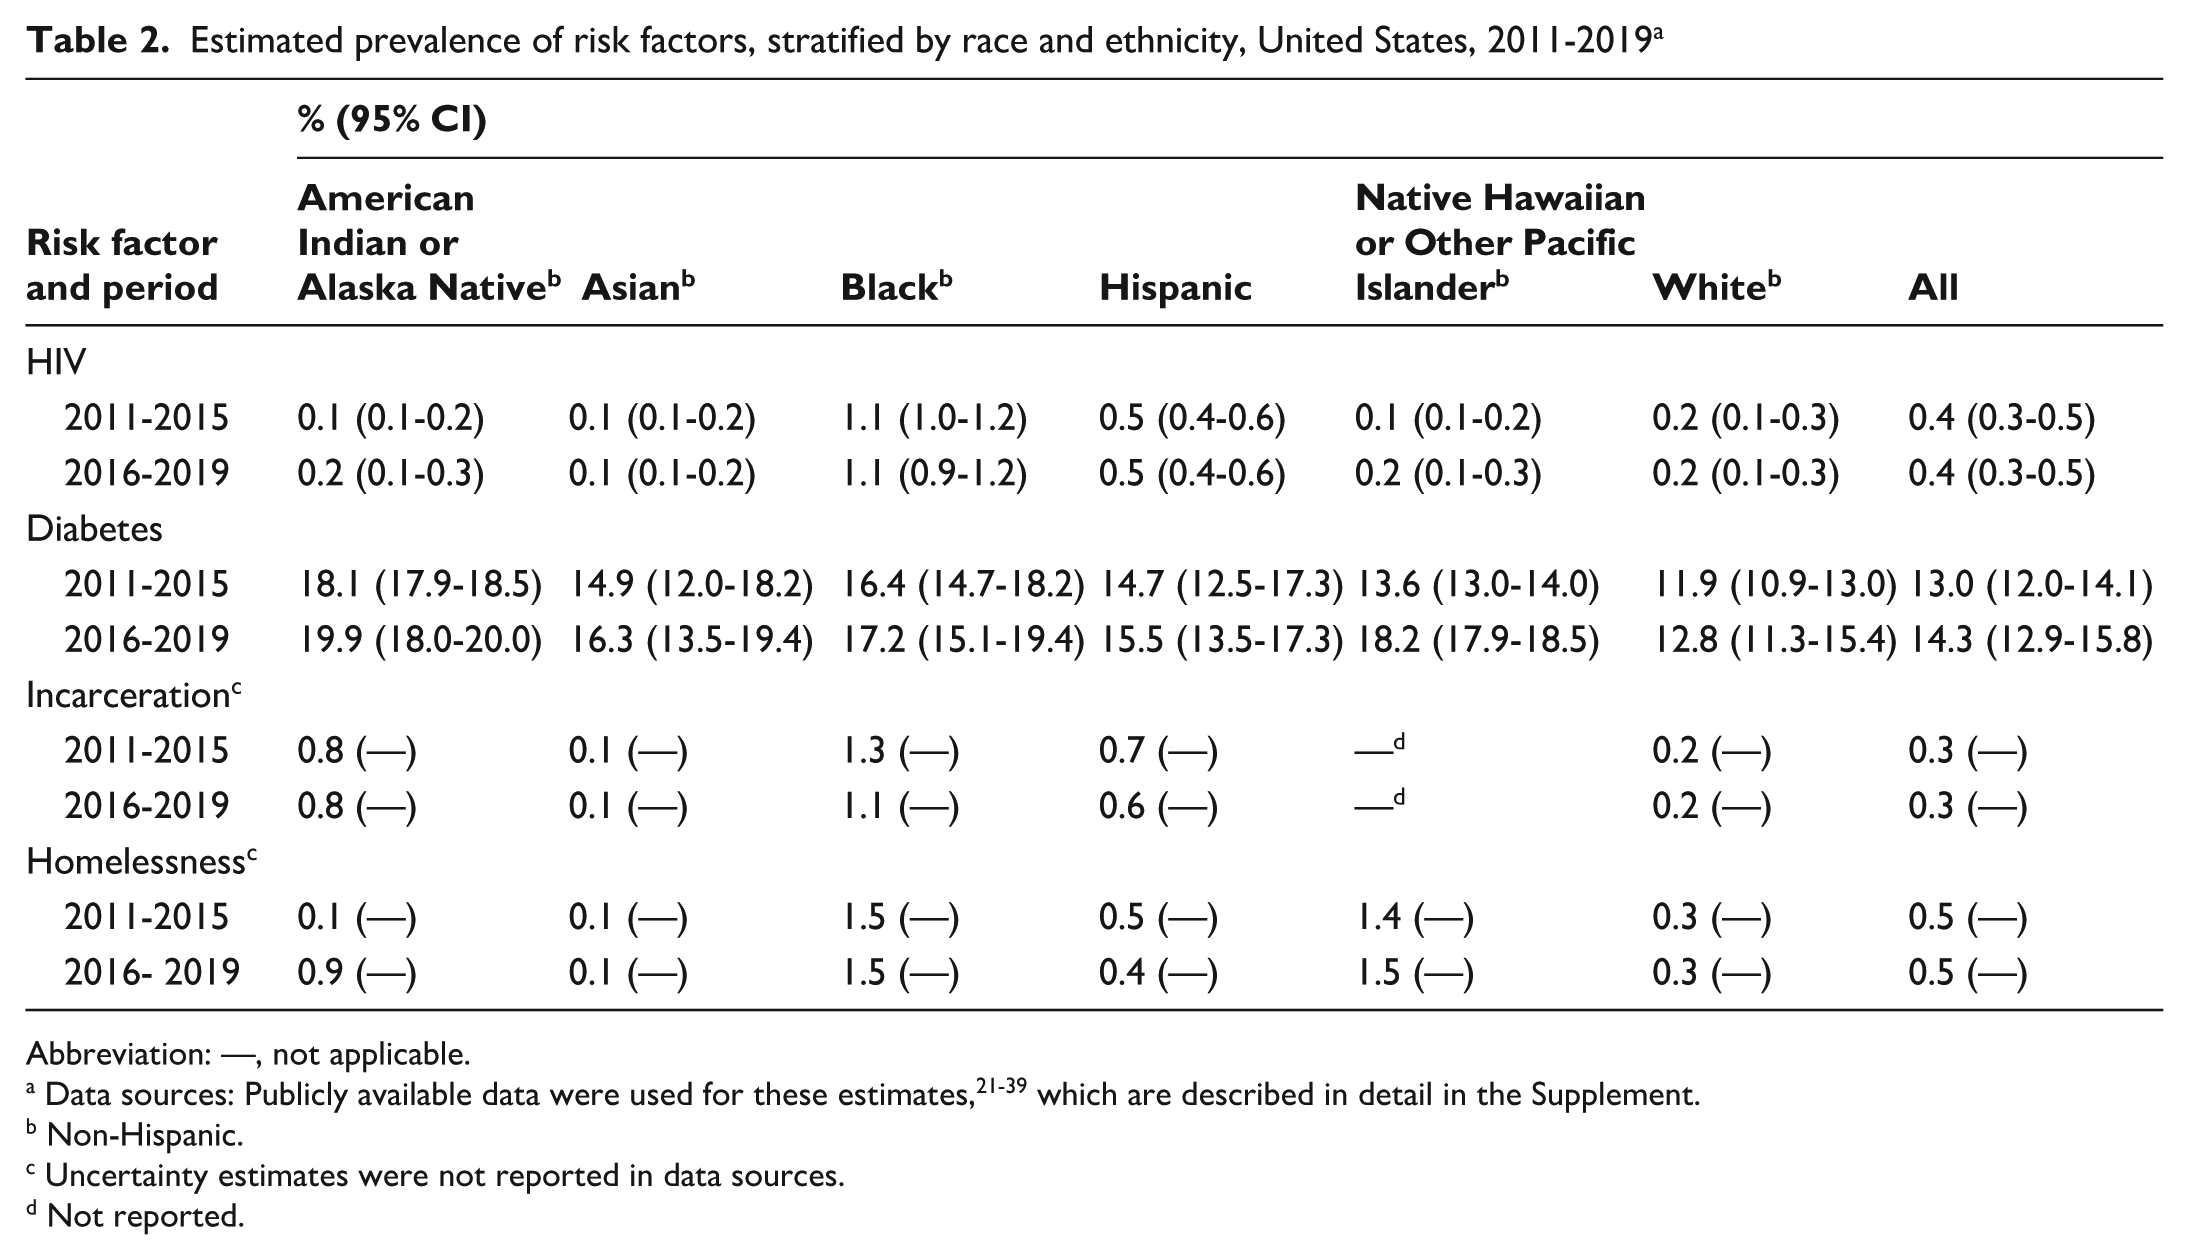
Abbreviation: —, not applicable.
Data sources: Publicly available data were used for these estimates,21 -39 which are described in detail in the Supplement.
Non-Hispanic.
Uncertainty estimates were not reported in data sources.
Not reported.
IRRs Associated With Risk Factors
In the overall US population, the incidence of all forms of TB (including RT-TB, non–RT-TB, and cases with missing RT designation) among people with HIV was 20.3 (95% CI, 20.0-20.6) times higher than among people without HIV during 2011-2015 (Figure 1A; Supplement) and 15.1 (95% CI, 14.9-15.4) times higher during 2016-2019 (Figure 1C; Supplement). The IRRs for HIV among RT-TB cases were 30.8 (95% CI, 30.4-31.1) during 2011-2015 and 18.4 (95% CI, 18.1-18.7) during 2016-2019 (Figures1B and D, respectively, Supplement). HIV-associated IRRs for both TB and RT-TB were >10 for all racial and ethnic groups during 2016-2019, except for the NHPI group.
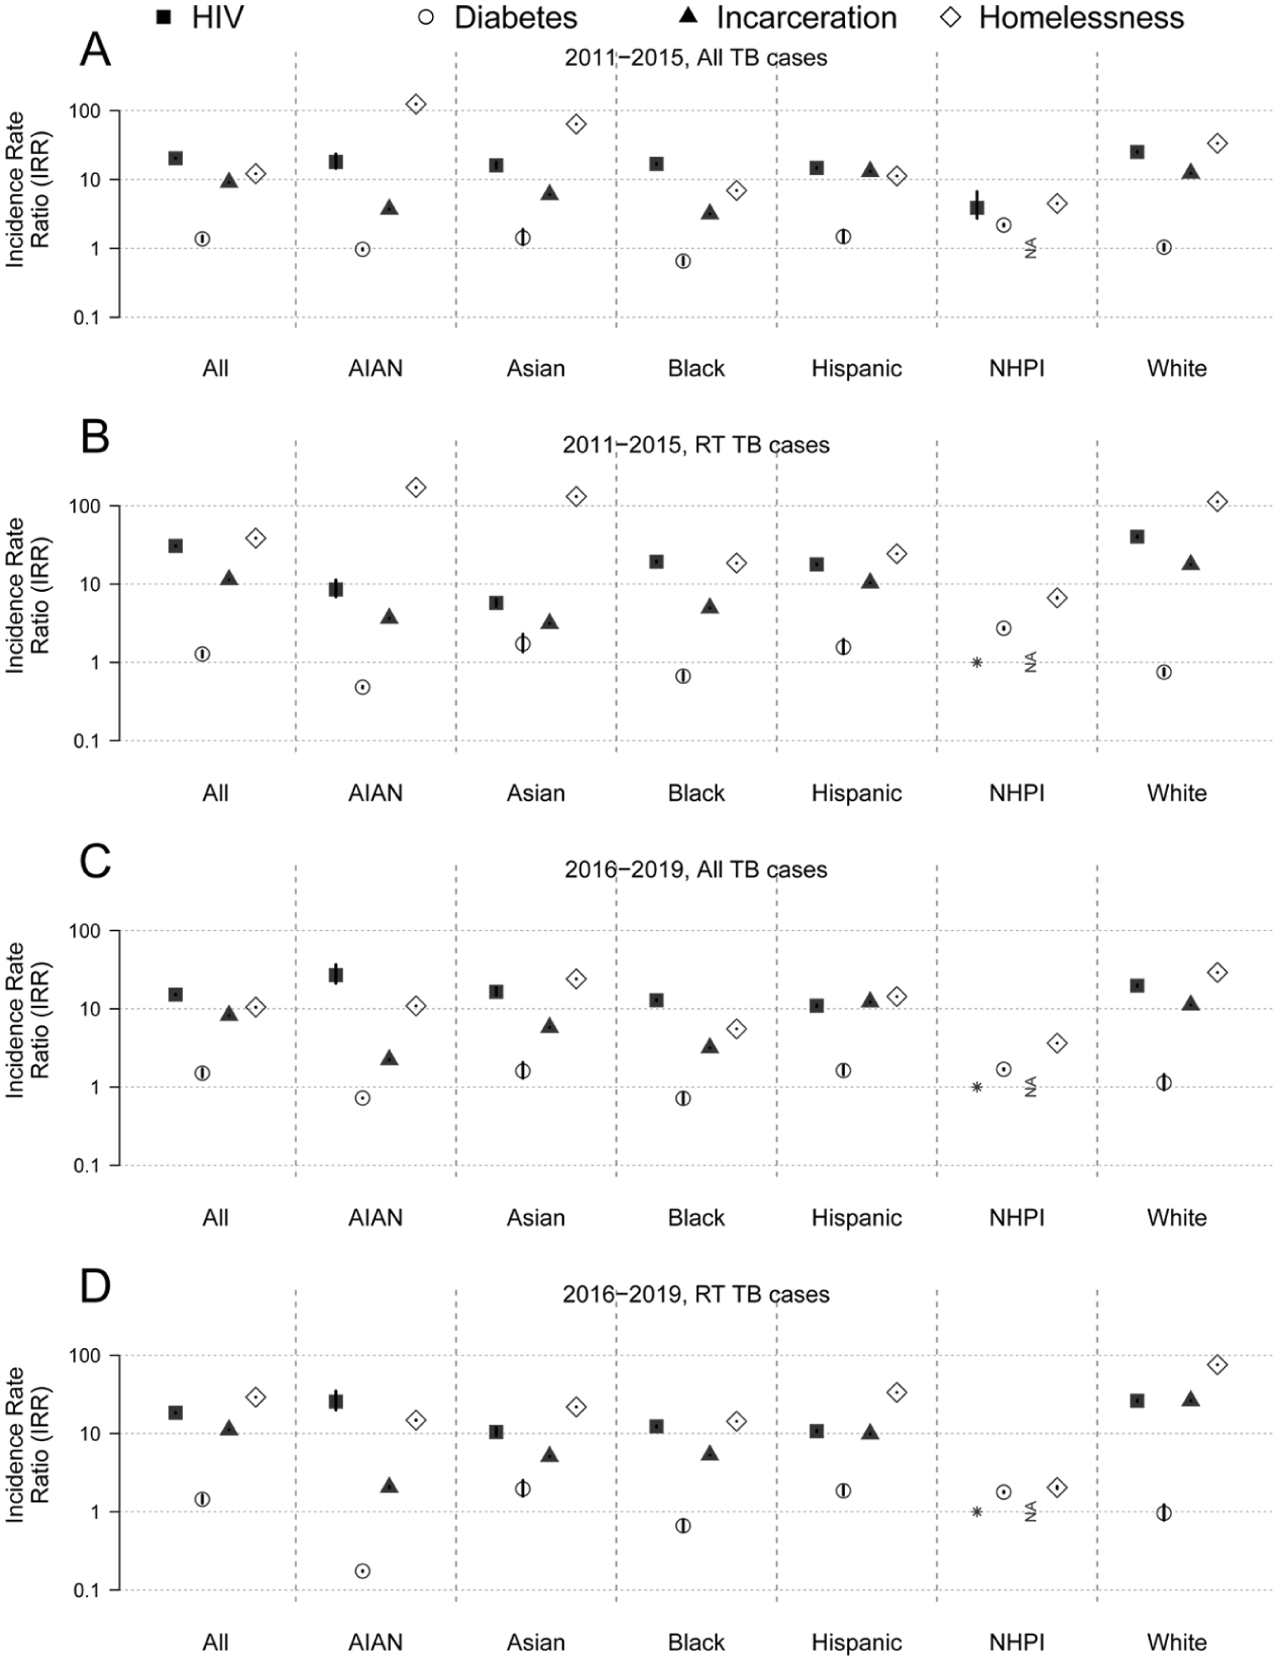
Estimated incidence rate ratios (IRRs) for tuberculosis (TB) associated with various risk factors stratified by race and ethnicity, United States, 2011-2019. (A) All TB cases. (B) TB attributed to recent transmission (RT-TB) cases during 2011-2015. (C) All TB cases. (D) RT-TB cases during 2016-2019 on a log scale. Symbols indicate the point estimate of the IRR; error bars indicate 95% CIs. For each population group, the IRR associated with a given risk factor represents the ratio of estimated TB incidence among individuals with the risk factor to those without the risk factor. NA indicates the absence of prevalence data, and the asterisk indicates an estimated IRR of 0. Black refers to non-Hispanic Black, AI/AN refers to non-Hispanic American Indian or Alaska Native, Asian refers to non-Hispanic Asian, Hispanic refers to Hispanic, NHPI refers to non-Hispanic Native Hawaiian and Other Pacific Islander, and White refers to non-Hispanic White. Data source: Publicly available data were used for these estimates,21 -39 which are described in detail in the Supplement.
The overall incidence of all forms of TB among people with diabetes was 1.4 (95% CI, 1.2-1.5) times higher than among people without diabetes during 2011-2015 (Figure 1A; Supplement) and 1.5 (95% CI, 1.3-1.7) times higher during 2016-2019 (Figure 1C; Supplement). Corresponding IRRs associated with diabetes for RT-TB were 1.3 (95% CI, 1.2-1.4; Supplement) during 2011-2015 and 1.4 (95% CI, 1.3-1.6) during 2016-2019 (Figure 1B and D, respectively; Supplement). Diabetes-associated IRRs varied across racial and ethnic groups. Notably, the IRRs of both all TB and RT-TB for diabetes were significantly >1 among Asian, NHPI, and Hispanic people but not significantly >1 among Black, AI/AN, and White people.
The incidence of all forms of TB among people who were incarcerated was 9.1 (95% CI, 9.1-9.1) times higher than among people who were not incarcerated during 2011-2015 (Figure 1A; Supplement) and 8.2 (95% CI, 8.2-8.2) times higher during 2016-2019 (Figure 1C; Supplement). The IRRs for incarcerated people with RT-TB were 11.4 (95% CI, 11.4-11.4) during 2011-2015 and 11.1 (95% CI, 11.1-11.1) during 2016-2019 (Figure 1B and D, respectively; Supplement). IRRs associated with incarceration varied by race and ethnicity. For example, the IRRs of RT-TB associated with incarceration at the time of TB diagnosis during 2016-2019 were as low as 2.1 (95% CI, 2.0-2.1) among AI/AN people and as high as 26.2 (95% CI, 26.2-26.3) among White people.
Finally, the incidence of all forms of TB among people who reported experiencing homelessness was 12.2 (95% CI, 12.2-12.2) times higher than among people who did not experience homelessness during 2011-2015 (Figure 1A; Supplement) and 10.5 (95% CI, 10.5-10.5) times higher during 2016-2019 (Figure 1C; Supplement). Corresponding IRRs for RT-TB were substantially higher, at 38.6 (95% CI, 38.6-38.6) during 2011-2015 and 29.1 (95% CI, 29-29.1) during 2016-2019 (Figure 1B and D; Supplement). IRRs associated with homelessness for RT-TB during 2016-2019 were >10 across all racial and ethnic groups, except the NHPI group.
Estimated PAFs Associated With Risk Factors
HIV-associated PAFs for TB and RT-TB in the overall US population were 6.3% (95% CI, 6.2%-6.5%) and 9.4% (95% CI, 9.4%-9.4%) during 2011-2015 (Figure 2A and B; Supplement) and 5.0% (95% CI, 4.9%-5.0%) and 6.0% (95% CI, 6.0%-6.0%) during 2016-2019 (Figure 2C and D; Supplement). The PAFs associated with RT-TB among people with HIV varied substantially by race and ethnicity, ranging from 0% among NHPI people and 1.5% among Asian people to 12.1% (95% CI, 12.1%-12.1%) among Black people during 2016-2019. Diabetes-associated PAFs of TB and RT-TB in the overall US population were 4.6% (95% CI, 3.4%-5.8%) and 3.5% (95% CI, 2.3%-4.7%), respectively, during 2011-2015 (Figure 2A and B; Supplement) and 6.9% (95% CI, 5.0%-8.8%) and 6.2% (95% CI, 4.3%-8.1%), respectively, during 2016-2019 (Figure 2C and D; Supplement). As with HIV, diabetes-associated PAFs also varied by race and ethnicity. For example, PAFs of RT-TB during 2016-2019 were 13.6%, 12.5%, and 11.7% among Asian, NHPI, and Hispanic people, respectively, but 0% among other racial and ethnic groups. The PAFs associated with current incarceration in the overall population were 3.4% and 4.3%, respectively, for TB and RT-TB during 2011-2015 (Figure 2A and B; Supplement) and 2.8% and 3.9%, respectively, during 2016-2019 (Figure 2C and D; Supplement). During 2016-2019, incarceration-associated PAFs for TB and RT-TB were <1% among Asian and AI/AN people and 2% to 7% among other racial and ethnic groups.
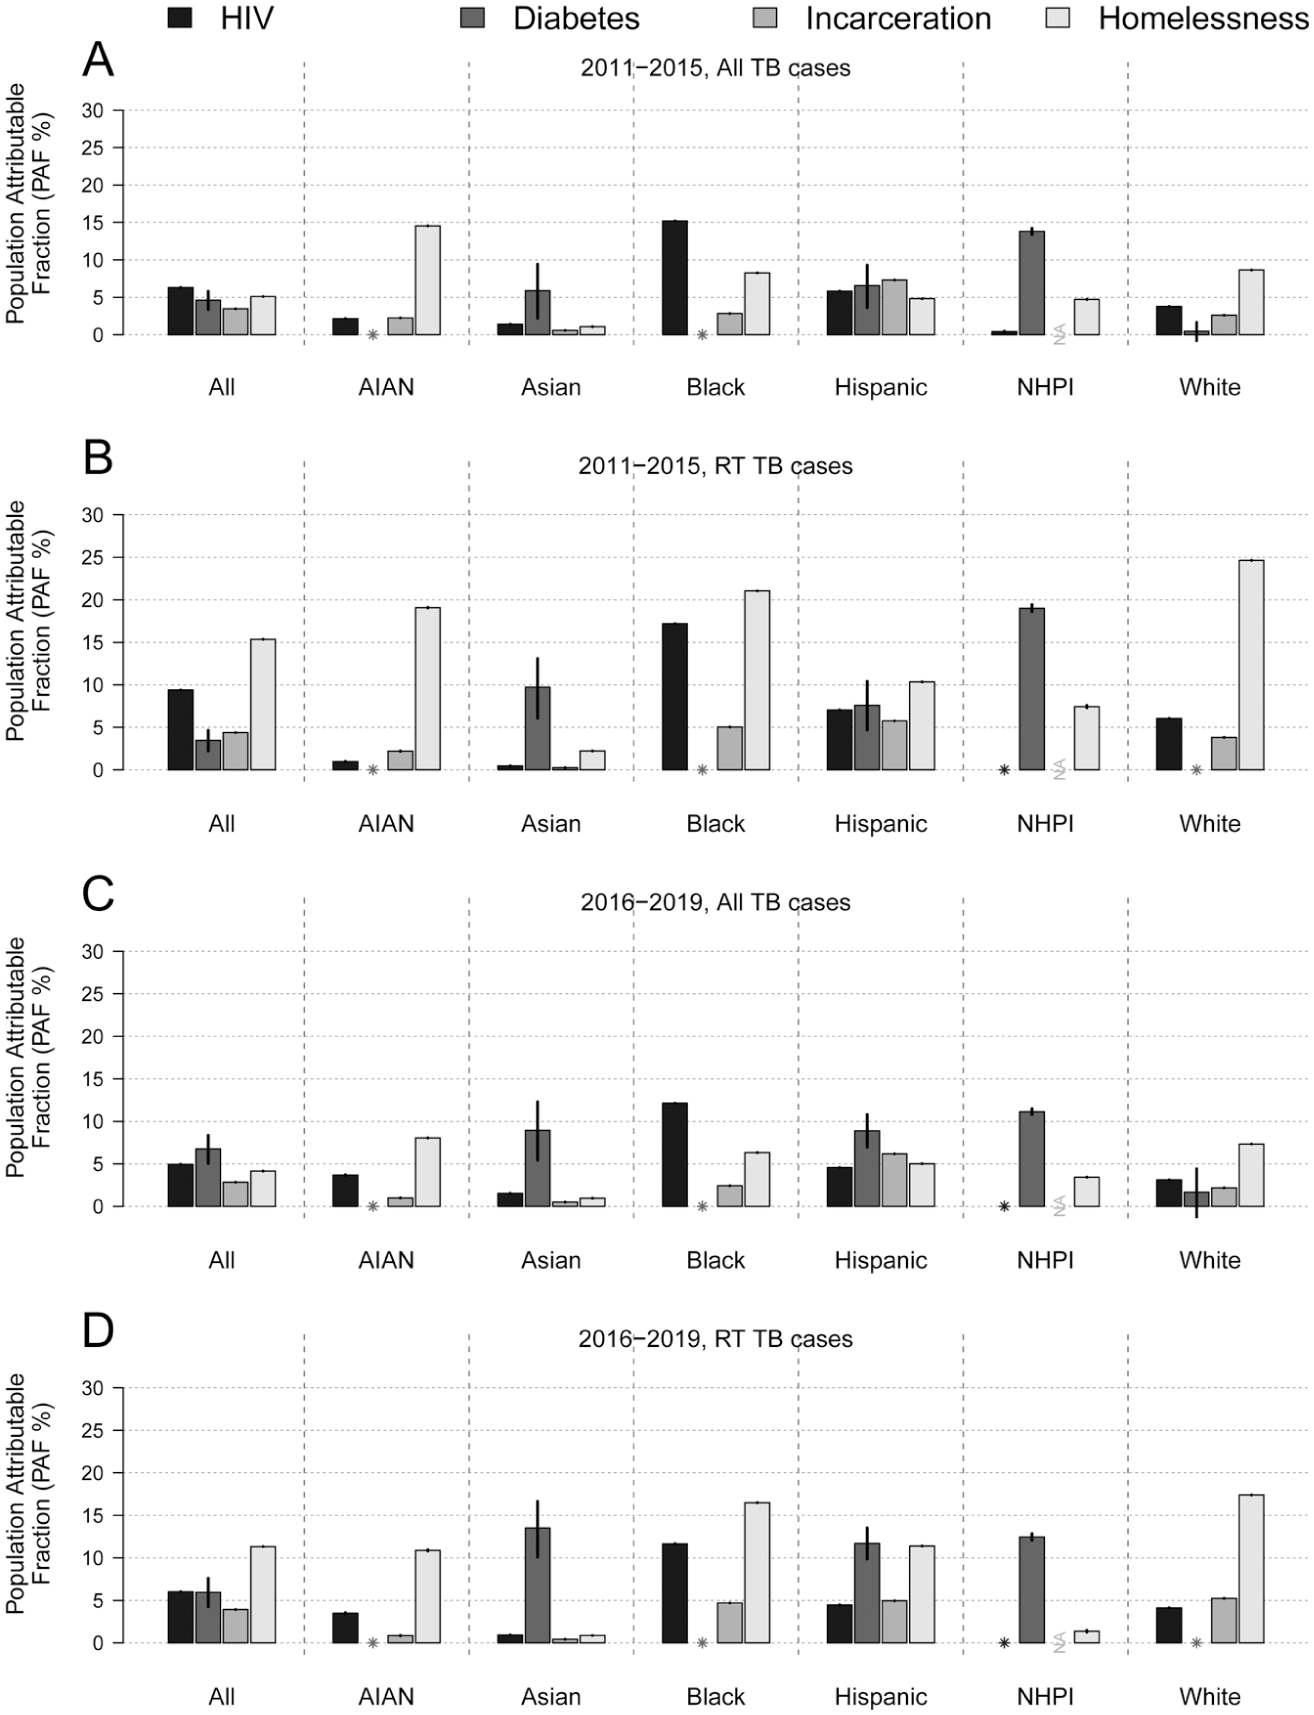
Estimated population attributable fractions (PAFs) for tuberculosis (TB) associated with various risk factors, stratified by race and ethnicity. (A) PAFs for all TB cases. (B) TB attributed to recent transmission (RT-TB) cases during 2011-2015. (C) All TB cases. (D) RT-TB cases, United States, 2016-2019. Bars indicate the point estimate for PAF; error bars indicate 95% CIs. For each population group, the PAF represents the estimated PAF associated with a given risk factor. NA indicates the absence of prevalence data; the asterisk indicates an estimated incidence rate ratio (IRR) of 0. Black refers to non-Hispanic Black, AI/AN refers to non-Hispanic American Indian or Alaska Native, Asian refers to non-Hispanic Asian, Hispanic refers to Hispanic, NHPI refers to non-Hispanic Native Hawaiian and Other Pacific Islander, and White refers to non-Hispanic White. Data source: Publicly available data were used for these estimates,21 -39 which are described in detail in the Supplement.
Finally, the PAF associated with homelessness in the overall population was 5.1% during 2011-2015 (Figure 2A; Supplement) and 4.1% during 2016-2019 (Figure 2C; Supplement). The PAFs of RT-TB were substantially larger: 15.6% during 2011-2015 (Figure 2B; Supplement) and 11.3% during 2016-2019 (Figure 2D; Supplement). As with other risk factors, we found substantial variation in PAFs associated with homelessness by race and ethnicity. During 2016-2019, PAFs associated with RT-TB in people experiencing homelessness were <2% among Asian and NHPI people but 11.4%, 16.5%, 10.9%, and 17.4% among Hispanic, Black, AI/AN, and White people, respectively.
Discussion
Our findings for the overall population suggest that the 4 risk factors considered in our study contributed modestly to TB as a whole and to RT-TB specifically. During 2016-2019, the contribution of each risk factor to TB and RT-TB was <7%, except for the contribution of homelessness to RT-TB, which was 15.6% during 2011-2015 and 11.3% during 2016-2019. The contributions were marginally larger for RT-TB than for all TB and declined modestly from 2011-2015 to 2016-2019, except for diabetes. As such, these results indicate that even if we were able to eliminate each of these 4 risk factors, we would not have reduced TB by >25% in the United States.
We found that HIV, incarceration, and homelessness remain important TB risk factors, as reflected in their estimated IRRs (>5). 2 However, at the population level, these risk factors are quite rare (<1% prevalence). Consequently, their contributions to TB in the overall population of the United States remain modest and has possibly declined from 2011-2015 to 2016-2019. Because their underlying prevalence did not change appreciably, the declines in PAFs were driven by reductions in their respective IRRs, indicating that TB incidence improved in these populations (eg, by increased antiretroviral coverage among people with HIV, or as can be inferred from a reduced number of TB clusters in prison settings 9 ). In contrast, diabetes is a more prevalent risk factor in the United States (>10% prevalence). Yet, its contribution to TB in the overall population was also modest because the relative risk associated with diabetes was modest (IRRs = 1.3-1.5). Notably, reported diabetes prevalence and associated IRRs for this risk factor were similar from 2011-2015 to 2016-2019.
We found some differences in the contributions of the risk factors by race and ethnicity. For example, during 2016-2019, diabetes contributed more substantially to TB among Asian and Hispanic people (PAF >8.9%), but its contribution was minimal among Black, AI/AN, and White people (PAF <2%), even though diabetes prevalence did not differ substantially between Asian and Hispanic people (16.3% and 15.5%, respectively, during 2016-2019) and other racial and ethnic groups (17.2%, 19.9%, and 12.8%, respectively among Black, AI/AN and White people). This finding aligns with a study that found that diabetes was estimated to be associated with an increased prevalence of LTBI among Hispanic and Asian people, while it found no association among Black and White people. 14 In contrast, the contribution of reported homelessness to RT-TB among Asian and NHPI people was much smaller (PAF of RT-TB <2%) compared with the rest of the population (PAF of RT-TB >10%).
Our IRR estimate associated with homelessness during 2016-2019 (IRR = 10.5) was similar to a previous US estimate (IRR = 11). 41 Our IRR estimate associated with incarceration during 2016-2019 (IRR = 8.2) fell within the range of estimated IRRs in a review of US-based studies (IRRs = 6.8-34.2), 42 albeit these studies are older. Our estimate of PAF associated with diabetes during 2016-2019 (PAF = 6.7%) was slightly smaller than the average estimate across several countries with a high incidence of TB (PAF = 7.5%) but well within the range of county-specific estimates (PAF = 1.8% to 13.8%). 43 Finally, our PAF estimate associated with HIV during 2016-2019 (PAF = 5.0%) was also within the range of previously reported country-specific estimates in countries with a low prevalence of HIV. 44
Limitations
The study had several limitations. First, applying the concept of PAF to a broad population presented inherent challenges. To characterize the population at higher risk of TB at the national scale, we used population-level estimates of the prevalence of risk factors, as is commonly done.44,45 Using these methods, we could not account for potential overlap of multiple risk factors of TB, effect modification, or potential confounding as a result of the presence of other factors such as demography (eg, US-born vs non–US-born), level of access to care, socioeconomic factors, and other known risk factors such as smoking and alcohol and drug use. As such, although the term “PAF” includes the term “attributable,” these measurements likely reflect associations, which deserve further investigation and careful interpretation with appropriate context. Future studies could be designed to focus on important associations and rule out potential confounding and effect modification.
Second, PAF is a static measurement and accounts for neither the contributions of the exposure in the past nor the contributions that may manifest in the future. For example, people with a history of incarceration or homelessness may have a higher risk of TB (even if they are not subject to these risk factors at present). 46 A factor might increase the risk of acquiring TB infection, which may take time to result in TB disease, as TB incubation periods can extend to multiple years. The increase in TB cases may also result in onward future transmission, which was not accounted for with our approach. As such, our approach may have underestimated the longer-term contribution of some of these factors in TB transmission, which a model-based approach may account for and should be considered in future studies. 47
Third, the NTSS TB notification data used to estimate race and ethnicity–specific rate ratios have limitations. Race and ethnicity are self-reported during TB diagnosis; any biases in identifying race or ethnicity may affect our race and ethnicity–specific results. RT status was missing in a substantial number of cases (up to 31% in some racial and ethnic groups). With the exclusion of such cases in our analysis, as well as the limitations of RT in ascertaining transmission, these PAFs for RT-TB as contributions to TB transmission should be cautiously interpreted. For medical risk factors such as HIV and particularly diabetes, there is a risk of underreporting when the underlying condition is undiagnosed, which could result in their contributions being underestimated. Furthermore, the risk of TB also depends on access to care and whether people are taking medication to manage the comorbidity; these data are not captured in the NTSS data and were not accounted for in our analyses.
Fourth, our analysis did not consider variations in important factors such as geography and origin of birth (US born vs non–US born). Estimating the prevalence of the race and ethnicity–specific risk factors stratified by geography and origin of birth was limited in our study by the availability of the stratified prevalence of risk factors. Considerable differences in TB incidence rates, the prevalence of various risk factors, and demographic composition exist in the United States.2,47 The nature of disparities in TB and their drivers can be geographically specific.48,49 More than 70% of TB cases in the United States are among non–US-born people, and there are important differences in the contributors by origin of birth. 50 For example, PAFs associated with HIV, incarceration, and homelessness were higher among US-born people than among non–US-born people, but PAFs associated with diabetes were higher among non–US-born people.
Finally, our analysis was limited to quantifying the contributions of the 4 risk factors: HIV, diabetes, incarceration, and homelessness. Other important risk factors, including social determinants of health such as poverty, living conditions, and access to health care, contribute to both TB risk and disparities in the United States. 20 Improved data collection informing these factors among TB cases and future analyses quantifying their roles—both as direct contributors and as indirect contributors by modifying the effects of these risk factors—may be important to better characterize the disparities in TB in the United States.
Conclusions
HIV, diabetes, incarceration, and homelessness are associated with elevated risk of TB and TB transmission in the United States. The contribution of these risk factors to TB ranges from modest to moderate in the overall population but varies substantially by race and ethnicity: not all risk factors are equally consequential across all racial and ethnic groups. Nevertheless, if an intervention were to successfully address each risk factor, TB incidence could be reduced by up to 25%.
Supplemental Material
sj-docx-1-phr-10.1177_00333549261453003 – Supplemental material for Variation by Race and Ethnicity in the Population Attributable Fractions Associated With Key Tuberculosis Risk Factors in the United States
Supplemental material, sj-docx-1-phr-10.1177_00333549261453003 for Variation by Race and Ethnicity in the Population Attributable Fractions Associated With Key Tuberculosis Risk Factors in the United States by Meha Mohammud Ahmed, Raeesa Manjoo-Docrat, Katherine O. Robsky, Lucia Cilloni, Garrett R. Beeler Asay, J. Steve Kammerer, Suzanne M. Marks, David Dowdy and Sourya Shrestha in Public Health Reports®
Footnotes
Acknowledgements
The authors thank Yuri P. Springer, PhD, from the Centers for Disease Control and Prevention for his helpful feedback during manuscript writing.
Funding
The authors disclosed receipt of the following financial support for the research, authorship, and/or publication of this article: This work was supported by the Centers for Disease Control and Prevention, National Center for HIV/AIDS, Viral Hepatitis, STD, and TB Prevention Epidemiologic and Economic Modeling Agreement (grant no. 5U38PS004646).
Declaration of Conflicting Interests
The authors declared no potential conflicts of interest with respect to the research, authorship, and/or publication of this article.
Disclaimer
The findings and conclusions in this article are those of the authors and do not necessarily represent the official position of the Centers for Disease Control and Prevention.
Supplemental Material
Supplemental material for this article is available online. The authors have provided these supplemental materials to give readers additional information about their work. These materials have not been edited or formatted by Public Health Reports’s scientific editors and, thus, may not conform to the guidelines of the AMA Manual of Style, 11th Edition.
References
Supplementary Material
Please find the following supplemental material available below.
For Open Access articles published under a Creative Commons License, all supplemental material carries the same license as the article it is associated with.
For non-Open Access articles published, all supplemental material carries a non-exclusive license, and permission requests for re-use of supplemental material or any part of supplemental material shall be sent directly to the copyright owner as specified in the copyright notice associated with the article.