
Abstract
The existence of different varieties of English in target language use (TLU) domains calls into question the usefulness of listening comprehension tests whose input is limited only to a native speaker variety. This study investigated the impact of non-native varieties or accented English speech on test takers from three different English use contexts: Korea, Sri Lanka and Brazil. The findings showed that the variety of English or accented speech used had no impact on test taker’s performance on a listening test for academic purposes. Also test takers from the three different countries performed similarly even when the speakers shared the same native languages as the test takers. Despite these findings students still perceived that a native variety of English should be used in listening comprehension tests. Though the study suggests the use of non-native varieties as test input, it also raises questions of fairness in the use of such varieties.
Introduction
With the spread of English as an international language, English is currently used by many more non-native speakers than native speakers (Crystal, 2000: 2004). As a result, the topography of the English language has changed dramatically in recent years (Seidlhofer, 2004; Jenkins, 2006); the English used in many target language use (TLU) domains is not limited to the English spoken by native speakers but includes English spoken by non-natives alike. As Canagarajah (2006) points out, in any language use context, whether local or international, the English language is not limited to a single dominant variety. Current testing practices, however, often do not reflect this language use situation. In most cases, the variety of English used has been, and still is, a native variety. For example, the stimulus material and oral questions on the listening section of the Test of English as a Foreign Language (TOEFL) are in standard North American English (ETS, 2005). Similarly, the International English Language Testing System (IELTS) listening tests use UK, UK regional, Australian and American accents (Cambridge ESOL, 2008). In assessing English as a Second Language (ESL) listening comprehension, test developers as in the above cases use samples of language that test takers would encounter in the TLU domain. In the case of academia, specifically in the US, a closer look at this domain will reveal a range of language varieties that students come across. In recent years, the varieties of English that students encounter have not only been those of fellow international students but also international teaching assistants (PhD graduate students who teach and/or assist in introductory undergraduate courses) and even faculty (Gorsuch, 2003; Major et al., 2005). For example, at the University of California Los Angeles (UCLA), students encounter international teaching assistants in introductory chemistry, mathematics and computer science courses as well as in ESL courses. During the 2008-2009 academic year at UCLA, out of 2,980 teaching assistants (TAs), 620 were international teaching assistants (ITAs) which makes up about 21% of the total TA population. Among the ITAs, the largest groups were Chinese (22%), followed by Korean (14%), Indian (7%), Japanese (4%) and others (53%) (Information Services, Graduate Division, UCLA, 2009). Similarly, at Texas Tech University, ITAs made up 30% of the total teaching assistant population, with Chinese students making up the majority of ITAs followed by Indian students (Department of Institutional Research, 2007). This information shows a common scenario found in most universities in the US. Therefore to limit test input to a native speaker variety in listening comprehension tests such as TOEFL and IELTS is a misrepresentation of English use in US academia.
From an assessment perspective, if a listening comprehension test is to be authentic, then the existence of the different varieties of English in academic domains calls into question the usefulness (Bachman and Palmer, 1996) of listening comprehension tests whose input is limited only to a native speaker variety. Following from that, this lack of correspondence will limit the generalizability of test performance and therefore question the validity of inferences made about those test takers’ listening ability. Then the question arises, if tests are to be authentic in nature and correspond to students’ actual language use, then shouldn’t listening comprehension tests such as those in the TOEFL and IELTS tests use non-native varieties of English or accented speech along with native varieties of English as test input?
Literature Review
As Major et al (2002) have pointed out, the relationship between accent and performance on listening comprehension is not clear. This is partly because factors such as exposure, familiarity and attitudes towards accents seem to contribute to performance and partly because the construct of listening comprehension itself is complex. By and large, using non-native varieties or, as commonly called, accented speech, in listening comprehension has been picked out as the factor most contributing to unintelligibility or comprehension difficulty (Goh, 1999). Flowerdew (1994) furnishes a summary of such studies and states in their findings that the effects of accent on listening comprehension are both positive and negative. While unfamiliar accents can cause difficulty in comprehension, some accented English may actually aid listeners’ comprehension. Eisenstein and Berkowitz (1981) found Standard American English was more intelligible than the English spoken by working class New Yorkers or foreign accented English. Other research supports the view of listeners having an advantage when they are familiar with or share the accent of the speaker. For example, Gass and Varonis (1984) report that familiarity with accent, in addition to being familiar with the topic and the speaker, aids listening comprehension. Bent and Bradlow (2003) state that non-native listeners might find second language (L2) speech more intelligible than native speech, whereas the opposite might be true for native listeners. However, some research found the advantages of accent familiarity to be only partially true. Smith and Bisazza (1982) show that while Japanese students found the Japanese speaker easier to understand than the American speaker, Indian students understood the American speaker better than a speaker of Indian English. A study by Major et al (2002) shows that native speakers of Spanish found Spanish accented English easy to understand but native speakers of Chinese found the Chinese accented English difficult to understand. Then there are other studies that show that accent familiarity has no advantage in comprehensibility. Van Wijngaarden et al (2002) claim that Dutch listeners found native English speakers to be more intelligible than their ‘own’ non-native English accent and even recently, Tokumoto and Shibata (2011) found Japanese and Koreans’ preference for native English pronunciation over their own spoken English.
While testing research has looked at the effect of question preview (Sherman, 1997) and the influence of reading (Friedman and Ansley, 1990) on listening comprehension tests, the effect of accented speech (Ortmeyer and Boyle, 1985; Wilcox, 1978) has had very limited focus. In one study, undergraduate comprehension of audio taped lectures did not differ when ITAs spoke with an American accent or an intelligible, foreign accent. Student comprehension only lessened with an unintelligible foreign accent (Bresnahan et al., 2002). Most recently, Harding’s (2008) study found no significant difference in test taker performance on a listening comprehension test when foreign accented speech was used.
Another factor that confounds the use of non-native varieties in listening comprehension is the attitude or perception towards accented speech (Lippi-Green, 1997). Research has shown that non-native speakers are often categorized as learners, uneducated or deficient speakers and stereotyped solely on their accents (Brennan and Brennan, 1981; Cargile, 1997). Gill (1991) showed that native speakers judge native speaker accents as more acceptable than non-native accents. This negativity towards accented speech is not restricted to native speakers alone; non-native speakers also show negative attitudes towards non-native accents. For instance, Toro (1997) found American English was rated higher by Puerto Rican students than English spoken by Greeks, Puerto Ricans or South Americans. Similarly, English as a Foreign Language (EFL) learners in Austria found native varieties to be more positive while non-native varieties (such as their own) were ranked lowest ( Dalton-Puffer et al., 1997 ). Recent research however shows that these attitudes and perceptions may be more complex. Harding (2008) found that listeners’ views of using accented speech differed according to the purpose of the listening activity. Test takers felt using accented speech in tests unfair for reasons of not having equal access to accented speech or it being advantageous to those who are exposed to accented speech or shared the same first language (L1). However, in terms of their own language learning goals, if using accented speech fitted the purpose or was relevant to their communicative needs (i.e. being in environments of non-native speakers), test takers felt that then including accented speech was acceptable.
As discussed above, previous research on the effect of accents on listening comprehension is still inconclusive and listener attitudes vary widely. However, given our current language use contexts where non-native speakers with accented English exist alongside native speakers of English, we should continue to examine the impact of using both native and non-native accented English, especially in assessments where the validity of any test score inferences we make about a test taker’s listening ability is based on listening comprehension tests that claim authenticity. The following research questions guided this study:
Does the use of non-native varieties of English affect performance on listening tests?
Is there any interaction between test takers’ native language and the variety of English used in test input?
What are test taker perceptions and attitudes towards using non-native varieties of speech in listening comprehension tests?
Method
Participants
Data for this study was obtained from 110 test takers from two different language use contexts. They were Korea (N=39) and Brazil (N=33) where English is a Foreign Language (EFL), and Sri Lanka (N=38) where English is a Second Language (ESL). They represent typical international students who would attend US universities. The test takers were college students who were taking courses in various disciplines and at the same time were enrolled in English classes at universities in their respective countries. They were identified as high intermediate level (Korean and Brazilian test takers) and low intermediate level (Sri Lankan test takers) proficiency based on performance in their respective placement tests and the syllabi of their respective ESL classes. Furthermore, a background questionnaire was administered before the test and used primarily for obtaining demographic information and information regarding exposure to different varieties of English. This information was used to ensure that the test takers in the study had similar exposure to English language learning.
Instruments, Speakers and Procedure
The listening comprehension test consisted of eight listening texts; each followed by three to four questions for a total of 31 multiple choice items. These listening passages were retired versions of the TOEFL exam (TOEFL Institutional Testing Program), and are representative of typical classroom lectures (see Appendix A for an example listening test). The content was from different areas of academics such as business, art, psychology, geology and biology. Reliability estimates (0.9) for the listening section were provided by the test publishers (TOEFL Test and Score Manual).
After test takers listened and answered questions for each listening test, they were asked to evaluate speaker comprehensibility. This questionnaire consisted of six items on a 1-7 point Likert scale from ‘strongly disagree’ to ‘strongly agree’ (see Appendix B, speaker comprehensibility rating questionnaire). After the test takers completed all eight listening comprehension tests, a final perception questionnaire was given to learn about test takers’ attitudes and how they felt about the use of non-native speaker input in listening comprehension testing (see Appendix C, attitude questionnaire).
The speakers who provided the input for the listening test were teaching assistants (TAs) at leading universities in the US. These speakers were chosen based on the ITA information obtained from UCLA and Texas Tech University. Since a majority of ITAs are Chinese, two Chinese TAs were included in the study. Then to represent an ITA who spoke the languages of two of the test taker groups, one Korean and one Sri Lankan TA were included. A TA who shares the same language as the Brazilian students was not included to represent the many student groups who are taught by TAs who do not share their language. The other four TAs were native speakers of American English for a total of eight TAs. Except the American TAs, the other TAs had obtained a Test of Spoken English (TSE) score of at least 50 in order to be eligible to be a TA. TSE scores can range from 20-60. The TSE band descriptor for a score of 50 says ‘communication generally effective; task performed competently’, but a closer look at the linguistic description indicates that with such a score, ‘errors [are] not unusual; accent maybe slightly distracting; some range in vocabulary and grammatical structures which may be slightly awkward or inaccurate; delivery generally smooth with some hesitancy and pauses’ (ETS, 2001). Thus it can be concluded that these TAs’ speech was not considered native like. Additionally, these TAs had also taken the Spoken Proficiency English Assessment (SPEAK) at their respective universities and had scored at least 50 points, described as ‘communication generally effective’, which contrasts with the maximum score of 60 points, described as ‘communication always effective’ (ETS, 2001) thus further supporting the fact that these TAs were not native-like. At the time of the study, all eight TAs were teaching undergraduate courses.
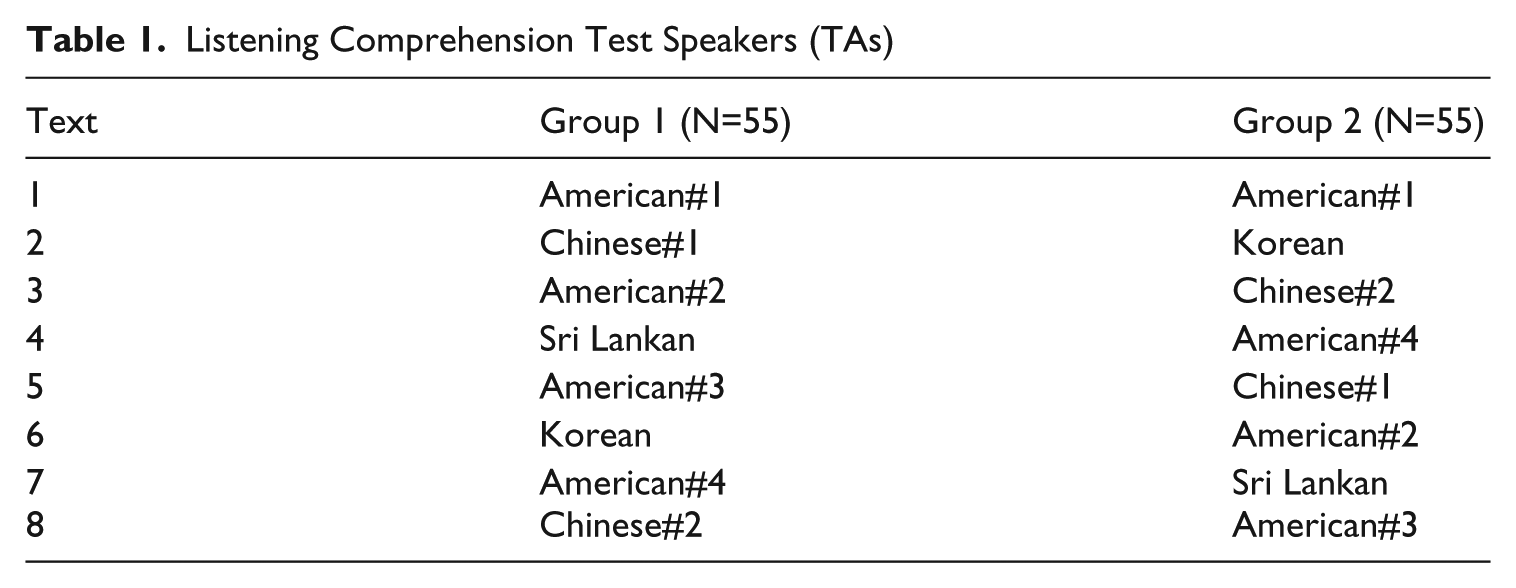
Table 1 describes the design of the study. Test takers were assigned to two groups at random based on their availability to take the test and were administered the listening comprehension test by an ESL instructor at their respective universities in their respective countries. Group 1 consisted of 16 Korean, 18 Brazilian and 21 Sri Lankan test takers and Group 2 consisted of 23 Korean, 15 Brazilian and 17 Sri Lankan test takers. Test takers in both groups heard text 1, on American history read by an American TA. This was to help familiarize students with the test. Also of concern was introducing foreign accented English at the beginning of the test which may have a negative impact on the test takers. For the other texts, the speakers (TAs) were counter-balanced. For example, Group 1 listened to text 2 read by a Chinese TA (#1) while Group 2 listened to the same text read by the Korean TA.
Listening Comprehension Test Speakers (TAs)
Results
Research Question 1
The first research question asks whether the use of non-native input influences the test takers’ performance on the test. As described in the methods section, the participants were divided into two groups and the input language was counter-balanced across the two groups. To answer this research question, using SPSS 10.0 for Windows, a one-way analysis of variance (ANOVA) was conducted with the students’ performance as the dependent variable. The results of the ANOVA are reported in Table 2.
Analysis of Variance Between Test Takers (Group 1 and Group 2).
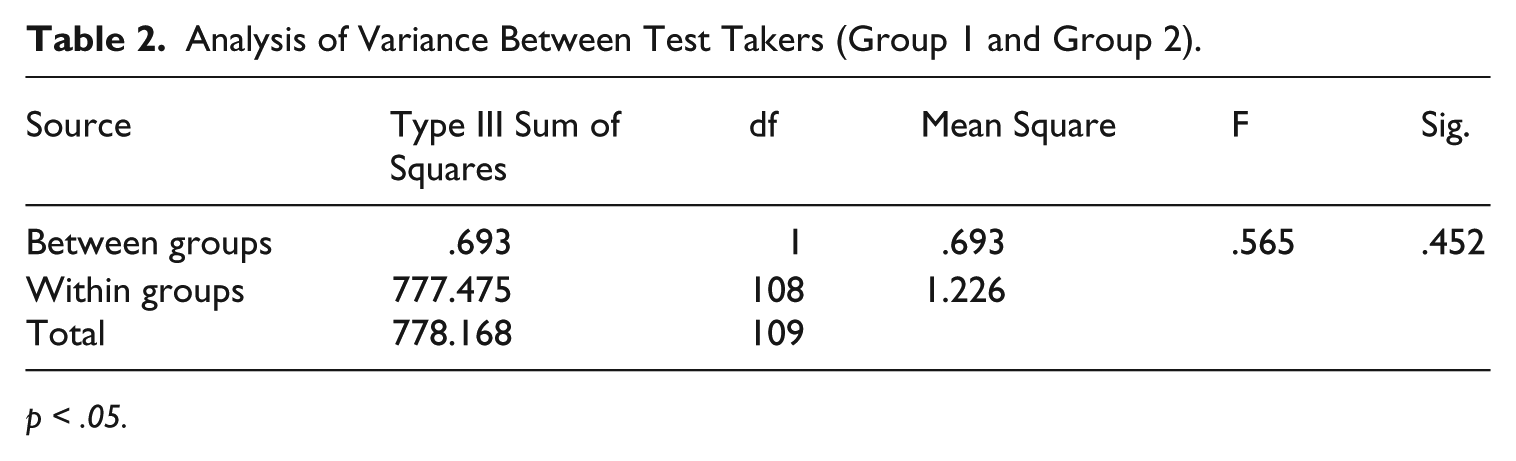
p < .05.
As can be seen in Table 2, the difference in the mean performance across the two groups was not significant, indicating that the use of non-native speaker input did not make a difference in the participants’ performance on the listening tests. This means that the variety of English used did not have any impact on performance. In addition, for each group, the mean performance of test takers between American English speaking TAs and non-native English speaking TAs was examined and found to be not significantly different. Group 1: F (1, 53) = 5.325, p = .362 and Group 2: F (1, 53) = 4.837, p = .298.
Research Question 2
Research question 2 addresses whether there was an interaction between the input language and the test takers’ first language. In other words, this question asks if the test takers would perform better when the speaker shares their first language. If there is a significant interaction between these, for example then Korean test takers would perform better than both Sri Lankan and Brazilian test takers when the input is Korean accented English. If this is the case, the input language is then a source of test bias because the type of input language favors test takers of certain language backgrounds. To answer this research question, a two-way ANOVA was conducted. In this analysis, the students’ performance was the dependent variable, and the speaker language and test takers’ first language (L1) were the two independent variables. The results of the ANOVA are shown in Table 3 and Figure 1 below. As can be seen in Table 3, the interaction between the speaker’s L1 and the test takers’ L1 was not significant, suggesting that Sri Lankan students did not perform significantly better than expected when the speaker (TA) was from Sri Lanka, for example. Figure 1 also shows that mean differences in test taker groups across input language are consistent, which also explains why there was no interaction between the two independent variables. Specifically, even though Korean test takers were favored when the input was from the Korean speaker (TA), the other two groups also had the highest mean scores for the Korean input.
Analysis of Variance Between Test Takers and Speakers (TAs).
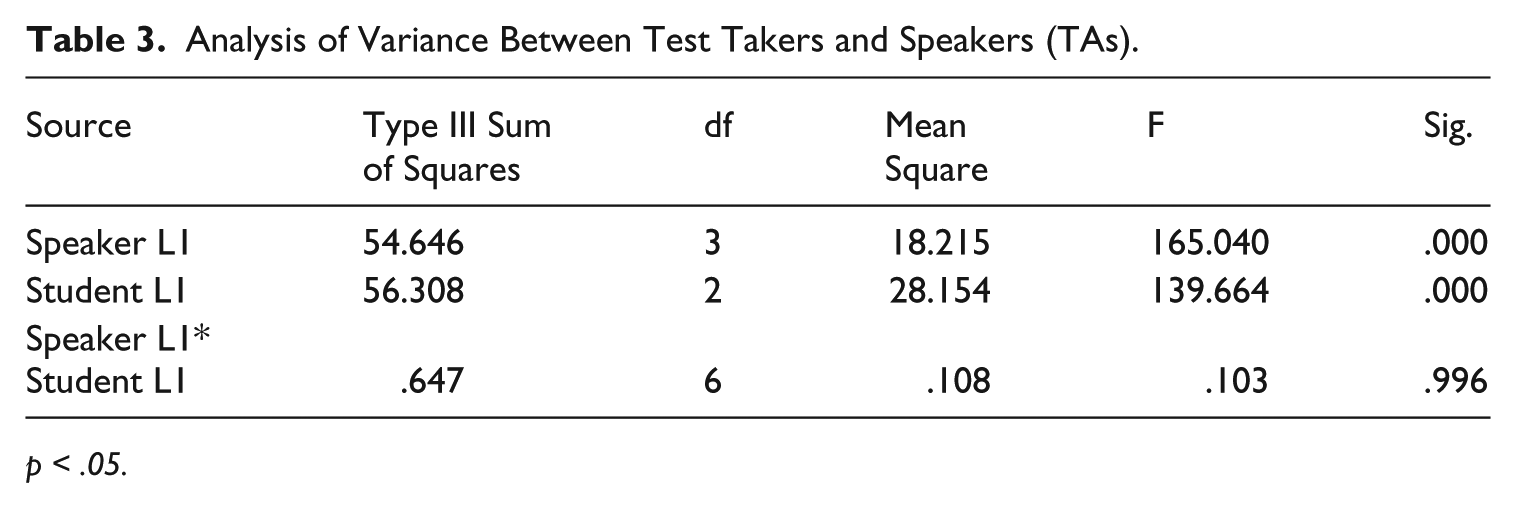
p < .05.
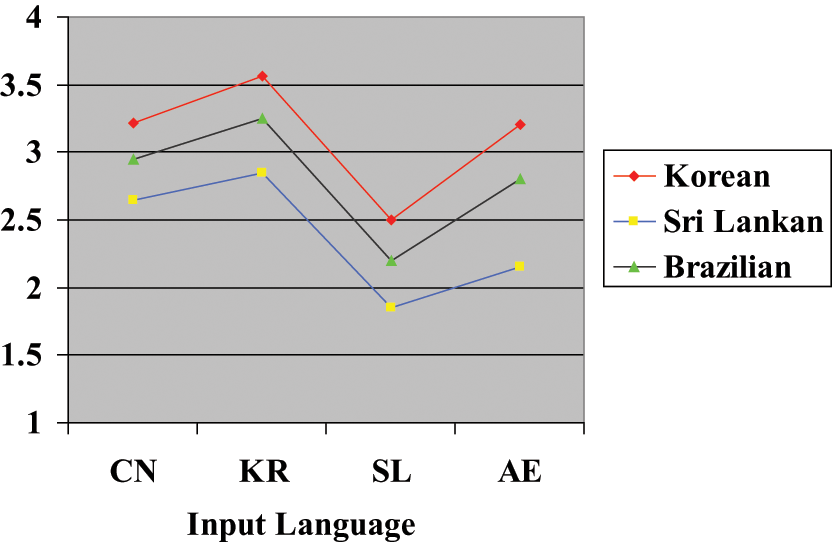
Mean Scores for Speakers (TAs).
The two main effects, that is the speaker’s L1 and test takers’ L1, were significant. As can also be seen in Figure 1, mean scores for speakers are different. For example, texts read by Korean speakers were easiest while texts read by Sri Lankan speakers were most difficult for all three groups. This explains why the first main effect, the input language, was significant. This is not to say however that Korean accented English is easier to understand than Sri Lankan accented English for example. The mean score was primarily the product of text passage/question difficulty and the accent difficulty and if there was any difficulty, may be confounded with text passage/question difficulty. Figure 1 also shows that mean scores are different across test taker groups; Korean test takers performed better overall while Sri Lankan test takers had the lowest performance, which explains why the second main effect, the test takers’ L1, was also significant.
Research Question 3
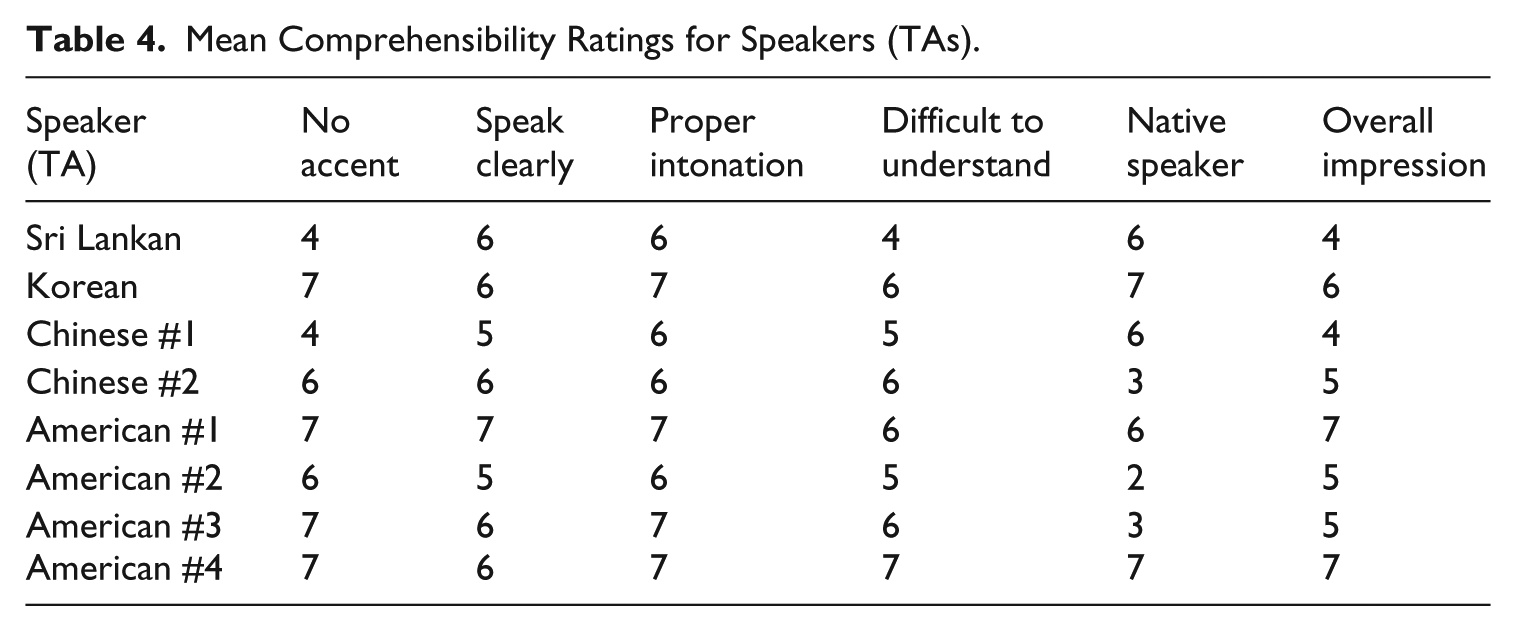
Research Question 3 attempted to get at test takers’ perceptions and attitudes towards using non-native varieties as test input. Interestingly, test taker responses to the comprehensibility questionnaire did not provide any clear indication of test taker perceptions of non-native speech as they were not consistent in their judgment of comprehensibility and were often not able to identify the cause of the difficulty in comprehensibility. See Table 4 for the mean comprehensibility ratings of the speakers. For example, some test takers tended to ‘strongly agree’ with most of the qualities describing the speaker input (e.g. no accent, proper intonation) but did not have a favorable overall impression of the speaker; or some test takers did not agree that the speaker had an accent but also did not agree that they were native speakers. A person with an accent may not necessarily speak a standard variety but could still be comprehensible. However, such a speaker could be judged negatively simply because his/her voice may not be favored by a test taker. Also it could be the case that other factors such as the passage content or the questions are difficult to understand and result in rating a speaker as being difficult to comprehend or rating a speaker non-native.
Mean Comprehensibility Ratings for Speakers (TAs).
While the comprehensibility questionnaire did not provide any useful information, the attitude questionnaire revealed some interesting findings. The main purpose was to find out how test takers felt about the use of non-native varieties as test input. The first question asked if they thought that it was good to use only American or British English rather than other varieties in listening tests. For this question, 28% of test takers responded positively because native varieties were easier to understand and 34% responded positively because American and British English are considered Standard English. However 32% gave a negative response to this question (because in real life we hear both native and non-native varieties of English). Thus more than 62% still responded that using a native variety was preferable. The next question asked test takers if it is important to use non-native varieties or accented English like Indian English, Singaporean English, etc in listening tests. The responses seem to favor non-native varieties with 46% saying yes (because in real life we also hear non-native varieties), 14% saying no (because non-native varieties are difficult to understand) and 11% saying no because listening tests should only have Standard English. With this question the use of non-native varieties seems to have risen in importance in the perceptions of test takers. However, when the next question asked test takers if using non-native varieties in listening tests made a difference in their test performance, test takers seemed certain that it did; 48% said performance is better with native English while 30% said their performance is better with non-native English and 10% said there would be no difference. A small percentage (12%) felt that the use of non-native English only mattered when the test taker was not proficient in English, which alludes to a test takers’ language proficiency as the issue rather than native or non-native speech. When asked if the type of speech input may cause test bias, almost 60% of the participants said that they thought Japanese test takers would better understand Japanese accented English than test takers from other countries (41% said they would not). Finally, test takers were asked even if a non-native variety was easy to understand if they prefer a native variety of English on a listening test, to which there was an overwhelming yes (65%), followed by no (21%) and it does not matter (14%).
Discussion
To the question ‘Why not non-native varieties of English as listening comprehension test input?’, this study suggests that non-native varieties of English can be used as listening test input though test takers may suggest otherwise. Specifically the test data do not show any significant differences between test takers’ performance when they listened to input produced by a native speaker or a non-native speaker. Thus for the Korean, Sri Lankan and Brazilian test takers in this study, the use of accented speech did not impede their performance. Furthermore, the test results did not show any bias when test takers listened to input by a speaker who shares the same language background as the test takers. In other words, Korean test takers did not perform better than either Sri Lankan or Brazilian test takers when the input was produced by a Korean speaker of English. The mean scores show that overall the Korean test takers did better than Brazilian test takers who also did better than the Sri Lankan test takers irrespective of the speaker input. The mean scores also match level of language proficiency of the test takers (Korean and Brazilian being high intermediate and Sri Lankan being low intermediate) and therefore support the validity of the score based inferences. Finally, test taker perceptions and attitudes towards using non-native varieties of speech in listening comprehension tests were found to be ambiguous. Test takers were not able to clearly indicate if they thought the input was produced by a non-native speaker or that the speaker had an accent. Some test takers also identified a native speaker’s English as being very difficult to understand and often times two of the four American TAs were identified as being non-native! Evidently, test takers were not able to perceive issues that made comprehensibility difficult and evaluate accented or non-native speech as expected. It is possible that other factors such as passage and/or question difficulty may have confounded test taker perceptions.
The results of the attitude questionnaire on the other hand go counter to the findings of the test performance data. Although some test takers acknowledged the presence of non-native or accented speech in their language use contexts and said that they should be included in listening tests, overwhelmingly test takers did not have a favorable attitude towards non-native speech. These findings support most of the research on accent and attitudes towards non-native speech.
Test takers’ preference still seems to be for American and British English as they deem them to be easier to understand and/or because they are considered ‘the standard’. Many test takers also felt that using a non-native variety of English would hamper their performance. This raises the question of negative affect in test takers if they encounter non-native speech in listening comprehension tests. Also an overwhelming majority felt that test takers would have an advantage in listening comprehension and intelligibility when the speaker shares the same L1 as the test taker. This closely relates to Kunnan’s (2004) Test Fairness Framework in which he discusses qualities such as equal access and absence of bias in tests. Test takers who have not been exposed or have had limited access to certain accents may see the use of those accents as being unfair. Test takers were also asked to give reasons for their preferences. Among them were the following responses:
Preference for a native variety:
Native variety is better because it is Standard English.
There should be some uniformity.
Yes, [because] native variety is the variety that we learn.
Most parts of the world accept native English.
Preference for a non-native variety:
Some native variety pronunciation is different from our pronunciation.
We can’t pronounce some words properly because our mother tongue is not English.
Indian or SL English is familiar with our own language. So it will be easier to understand.
Test takers who said that the variety did not matter said the following:
We should be able to understand any person talking in English.
If we can understand the person it does not matter if they are native or non-native speakers.
These responses are not surprising given the social and political position of English as an International language/lingua franca. In ESL contexts such as Sri Lanka, Singapore, Kenya, the educational and sociocultural factors reflecting local culture and languages provide for a more positive response for localized varieties of English. Yet, as Xu et al. (2010) reveal, the growing use of English as a lingua franca presses L2 users to both accept and adopt a standardized form. While there is evidence even in places such as Korea that a Korean variety of English can be found (Honna, 2006) or that learners in EFL contexts hold positive attitudes towards their variety of English in terms of marking solidarity and legitimacy (Bian, 2009; McKenzie, 2008), still the current standards of American and British English continue to be the models for global usage in EFL contexts (Yano, 2001). Also, research shows that second language learners in EFL context may lack an awareness of other varieties of English simply because they do not have exposure to such speakers (Friedrich, 2000; Tokumoto and Shibata, 2011), and the result is a leaning in favor of the standard varieties.
To sum up, while test takers were not unanimous in their perceptions and attitude of non-native or accented speech being used in listening tests, the overall findings from the attitude questionnaire was that test takers felt non-native or accented English should not be used and that by using a non-native variety a test taker who shares the same language as the speaker input will be at an advantage over others who do not share the same L1 background.
Conclusions
To answer the question put forward in the title of this study, ‘Why not non-native varieties of English as listening comprehension test input?’, the quantitative evidence response is ‘Yes’ because test takers do not perform differently in listening comprehension tests when the input consists of both standard American and other varieties of English. However when test takers were asked about the use of other varieties as test input, the answer to the title of the study is ‘No’, because test takers’ perceptions and attitudes still indicate a preference for a standard variety of English.
Even though our findings suggest the possibility of using accented or non-native varieties of English as test input, further research is necessary as there are a number of limitations in this study. First of all, the study was limited to only three non-native varieties of English. The ITA demographics in the introduction showed more than 50% of ITAs are from countries other than China, Korea, India and Japan. Thus, there is always the possibility that if different speakers (i.e. other accented or non-native varieties of English) had been used, the findings might have been different. Second is the issue of passage/question difficulty that was mentioned in the results above. Although the questions in each listening test had almost the same average difficulty (between .54 to .57 item difficulty) it was not possible to isolate the speaker input (non-native English or accented English) as the only within subjects factor. Another limitation of the study is the level of language proficiency of the test takers. In this study, all three groups of test takers (Korean, Brazilian and Sri Lankan) were fairly similar in that they were identified as being intermediate, but with different levels of language ability, it is possible that test takers may perform differently. A number of studies have raised language proficiency as a factor in research related to comprehension of not only oral skills but also literacy skills (see Grabe, 2004; Silva and Brice, 2004; Vandergrift, 2004 for an overview of relevant research).
Another question still remains whether it is appropriate to use non-native input even if most students still preferred a native variety. This may be an issue because the use of a non-native variety may cause a negative affect in test takers and as Swain (1984) quite rightly pointed out, as test developers we should ‘bias for best’. Furthermore, Taylor (2006: 52) says, ‘Applied linguists may see things differently but we should not ignore or override the attitudes and perceptions of learners themselves’. Having said that, though attitude and perception research shows a negative response towards accented English, test developers should be careful of excluding accented or non-native varieties of English as test input. Lindemann’s (2006: 38) research shows, ‘listeners may react negatively to certain accents (and thus claim to find them unintelligible) even when we would expect that the features of those accents themselves do not directly impede intelligibility’. Similarly Watson Todd and Pojanapunya (2009) examined both implicit and explicit attitudes towards both native English Speaking Teachers (NESTs) and non-native English Speaking teachers (NNESTs). While students expressed a desire for NESTs, their implicit attitudes did not show a statistically significant preference for NESTs or NNESTs. These studies seem to indicate that students express a certain preference because they think they should prefer it based on linguistic competence, or even race rather than teaching competence. Thus to make the case for using non-native varieties of English, not only do test developers need to provide evidence that such accented speech is not a source of test bias, but language users also need to be educated that at a certain level, non-native varieties of English and accented speech are comprehensible.
Until research shows that the use of non-native or accented English as input is not relevant to the construct of listening, we may not be able to use non native/accented English input in testing, especially in high stakes tests such as TOEFL and IELTS. At the same time we also cannot ignore the reality of English as it is used today. In order to address some of the issues of test usefulness, validity and authenticity in particular, we should perhaps use non-native varieties or accented English in low stakes tests such as placement, diagnostic or achievement tests in pedagogical situations. Taylor (2006) uses the term ‘fitness for purpose’ to explain this aspect of test validity, where tests should represent the accents and English varieties used in the contexts in which test takers are likely to find themselves. Furthermore, introducing accented speech and non-native varieties of English in the teaching of listening and speaking skills will expose learners to a wider range of linguistic models and may help them to move away from the attraction of the ‘standard’ and in making a NEST/NNEST dichotomy. As accented speech or non-native varieties gain recognition among language users, test takers and other stakeholders, the attitudes and perceptions towards the use of these non-native varieties of English will also hopefully change.
Footnotes
Appendix A
Sample TOEFL Listening Test
Appendix B
Perceived comprehensibility ratings
Please evaluate his/her accent and comprehensibility. For example, if you circle ‘7’, you agree with the statement. If you circle ‘1’, you do not agree with the statement.
Strongly agree…7 1 … Strongly disagree
There is no accent in the speaker’s pronunciation. 7 6 5 4 3 2 1
The way the speaker speaks is clear. 7 6 5 4 3 2 1
The speaker uses proper intonation. 7 6 5 4 3 2 1
The speaker’s English is very difficult to understand. 7 6 5 4 3 2 1
The speaker is a native speaker of English. 7 6 5 4 3 2 1
What is your overall impression? Easy to understand 7 6 5 4 3 2 1 Hard to understand
Appendix C
Questionnaire
Please explain why (you can write in your own language)________________
______________________________________________________________
______________________________________________________________
Any other comments(you can write in your own language): ___________
_____________________________________________________________________
_____________________________________________________________________
Funding
This research received no specific grant from any funding agency in the public, commercial, or not-for-profit sectors.