
Abstract
Microaggressions are daily insults to minority individuals such as people with disabilities (PWD) that communicate messages of exclusion, inferiority, and abnormality. In this study, we developed a new scale, the Ableist Microaggressions Impact Questionnaire (AMIQ), which assesses ableist microaggression experiences of PWD. Data from 245 PWD were collected using Amazon’s Mechanical Turk (MTurk) platform. An exploratory factor analysis of the 25-item AMIQ revealed a three-factor structure with internal consistency reliability ranging between .87 and .92. As a more economical and psychometrically sound instrument assessing microaggression impact as it pertains to disability, the AMIQ offers promise for rehabilitation counselor research and practice.
Definition of Microaggressions and Ableism
Sue et al. (2007) define microaggressions as brief slights and insults targeting persons of oppressed identities that communicate hostile, derogatory, or negative messages expressed through behavioral, environmental, or verbal means. Although the term microaggression was originally proposed to explain experiences of racial minorities, it has been used with other groups such as lesbian, gay, bisexual, and trans people (LGBT), women, and people with disabilities (PWD; Sue, 2010a, 2010b). Accordingly, there are three forms of microaggressions, the first form constituting an explicit expression while the last two involve implicit bias expressions.
The first form, micro-assault, involves a conscious awareness by the perpetrator that represents an explicit behavioral or verbal act such as name-calling, teasing, and bullying aimed to hurt the individual targeted. The second form, micro-insult, is often unconscious to the perpetrator and is expressed by interpersonal interactions or environmental clues demeaning to persons with marginalized identities. These messages express insults, rudeness, and slights about the identity of the targeted person but may also be presented in the form of a “compliment.” The third form, micro-invalidation, which is also often unconscious, occurs through verbal comments and behaviors that negate or nullify psychological feelings, thoughts, or reality of marginalized persons. Given the pervasive and automatic nature of microaggressions and perpetrators’ beliefs about themselves as being good and decent people, in these instances, microaggressions can be dismissed as “innocent” interactions (Sue, 2010a, 2010b).
To have an understanding of ableist microaggressions (AM), we need to have a basic understanding of how ableism is rooted in our culture (Olkin et al., 2019). Campbell (2009) states that ableism is a set of conscious or unconscious assumptions and practices leading to unequal treatment of PWD. This worldview mandates that disability is inherently negative and that any form of impairment should be ameliorated. Thus, ableism is a system of beliefs and practices that define a standard of perfect human body and self where having a disability represents a diminished way of being. Like other “isms,” ableism is projected on persons perceived as having disabilities. It can be hostile (including fear, denigration, and dehumanizing actions), benevolent (including sympathetic pity, protection, or charitable praise), or a mixture of the two, referred to as ambivalent ableism (Nario-Redmond et al., 2019). Compared to other isms such as racism, sexism, and ageism, ableism has a more adverse effect on overall health and well-being (Branco et al., 2019). Furthermore, while explicit ableism has been decreasing, implicit ableism has been increasing (Harder et al., 2019).
Ableist Microaggressions
The first analysis of AM conducted by Keller and Galgay (2010) theorized that there were 10 primary and two underdeveloped disability microaggression domains. Primary domains included denial of identity (diminishing persons to their disability), denial of disability (not recognizing the disability or minimizing the disability experience), spread effect (assuming that disability impacts other aspects of functioning not related to the disability), denial of privacy (inquiring personal information from the person, often pertaining to disability), helplessness (assuming that PWD need help), secondary gain (interacting with PWD for an extrinsic or intrinsic benefit), patronization (praising PWD for almost anything that they do), infantilization (treating PWD as children), second-class citizenship (not having equality, being ignored or overlooked), and de-sexualization (perceiving PWD as asexual or incapable of having a romantic partner). The two underdeveloped domains included exoticization (romanticizing aspects of having a disability) and spiritual intervention (perpetrators intentionally stopping PWD to pray for them). Since this initial work, other researchers have provided support for these domains but also expanded them to include symptoms not believed by medical professionals and being discounted by others based on looking healthy or young (Olkin et al., 2019). In addition, Dávila (2014) included domains pertaining to bullying, disregard, and low expectations.
Although the literature on microaggressions has proliferated, as it pertains to AM, there are only a few studies that have actually attempted to measure this phenomenon; most of which are limited to qualitative investigations (e.g., Kattari et al., 2018; Lee et al., 2019). In reviewing the literature, we identified two ableist microaggression scales. The first scale, by Conover et al. (2017), measured microaggressions toward people with physical disabilities. Consequently, persons with cognitive, developmental, and psychological disabilities were excluded. This limitation, in conjunction with a low reliability estimate (internal consistency) of .65, presents a problem as far as its utility, particularly if it is used more as a clinical rather than research tool. A second scale, developed by Kattari (2019), included a broader sample of persons who self-identified as having a disability but also included persons without disabilities (approximately one third of the sample). The initial scale development yielded a two-factor structure—Interpersonal (59 items) and Disability in Society (six items). Although this scale provided evidence of internal consistency reliability and convergent validity, given the number of scale items, survey fatigue is a consideration. Beyond these aforementioned restrictions, both scales only considered the frequency of microaggressions as the context to evaluate the extent of the AM. Neither scale directly asked respondents to comment on how individual AM behaviors impacted them personally. By asking questions in terms of their frequency, it fails to address microaggressions that could have been experienced infrequently but have greater impact than ones expressed more frequently but had less individual impact.
With these considerations in mind, the aim of this study was to develop and validate an economically reliable scale that assessed AM experiences of PWD. In addition, we were interested in how the scale’s factor structure was related to other mediating variables such as gender, age, education, visibility, and onset of disability.
Method
Procedure
After receiving institutional review board approval, participants were required to complete an informed consent form, demographic form, and three outcome measures, one of which was the experimental scale to assess microaggressions toward PWD. These forms were uploaded using Qualtrics© (Qualtrics, 2020). To collect data, we used Amazon’s MTurk platform (Amazon, 2019) via the Turk Prime (Litman et al., 2016). MTurk is a crowd-sourcing tool where workers can complete any task, such as transcribing, identifying pictures, and taking surveys on a computer and, in return, they receive a small amount of compensation (Buhrmester et al., 2011). Although using this platform offers convenience, rapid access, cost efficiency (Casler et al., 2013), and greater representation of the U.S. population (Buhrmester et al., 2018), its use has also been criticized for ethical reasons that have mainly centered on receiving fair compensation to people who are already financially insecure (Gleibs, 2016). This belief, however, has been challenged by Moss et al. (2020), who contend that this platform can still produce high quality and economically affordable data without sacrificing professional ethics (Moss et al., 2020). As applied to our study, research participants were compensated $1.00 for approximately 13 min on average to complete the measure.
Beyond the compensation issue expressed by some investigators (e.g., Fleischer et al., 2015; Rouse, 2015), additional concerns when using MTurk workers are participant attentiveness and response honesty. To address these concerns, two attention check questions and one question regarding the participant honesty were asked. Data from inattentive workers and those indicating they did not produce honest answers were excluded to ensure data set validity and reliability. To access MTurk workers, the Cloud Research platform (https://www.cloudresearch.com/) was used. The study was advertised as an academic study on disability stress, and on the informed consent form a question was asked regarding their disability status. Persons who indicated that they did not have a disability were removed and not able to complete the survey.
Participants
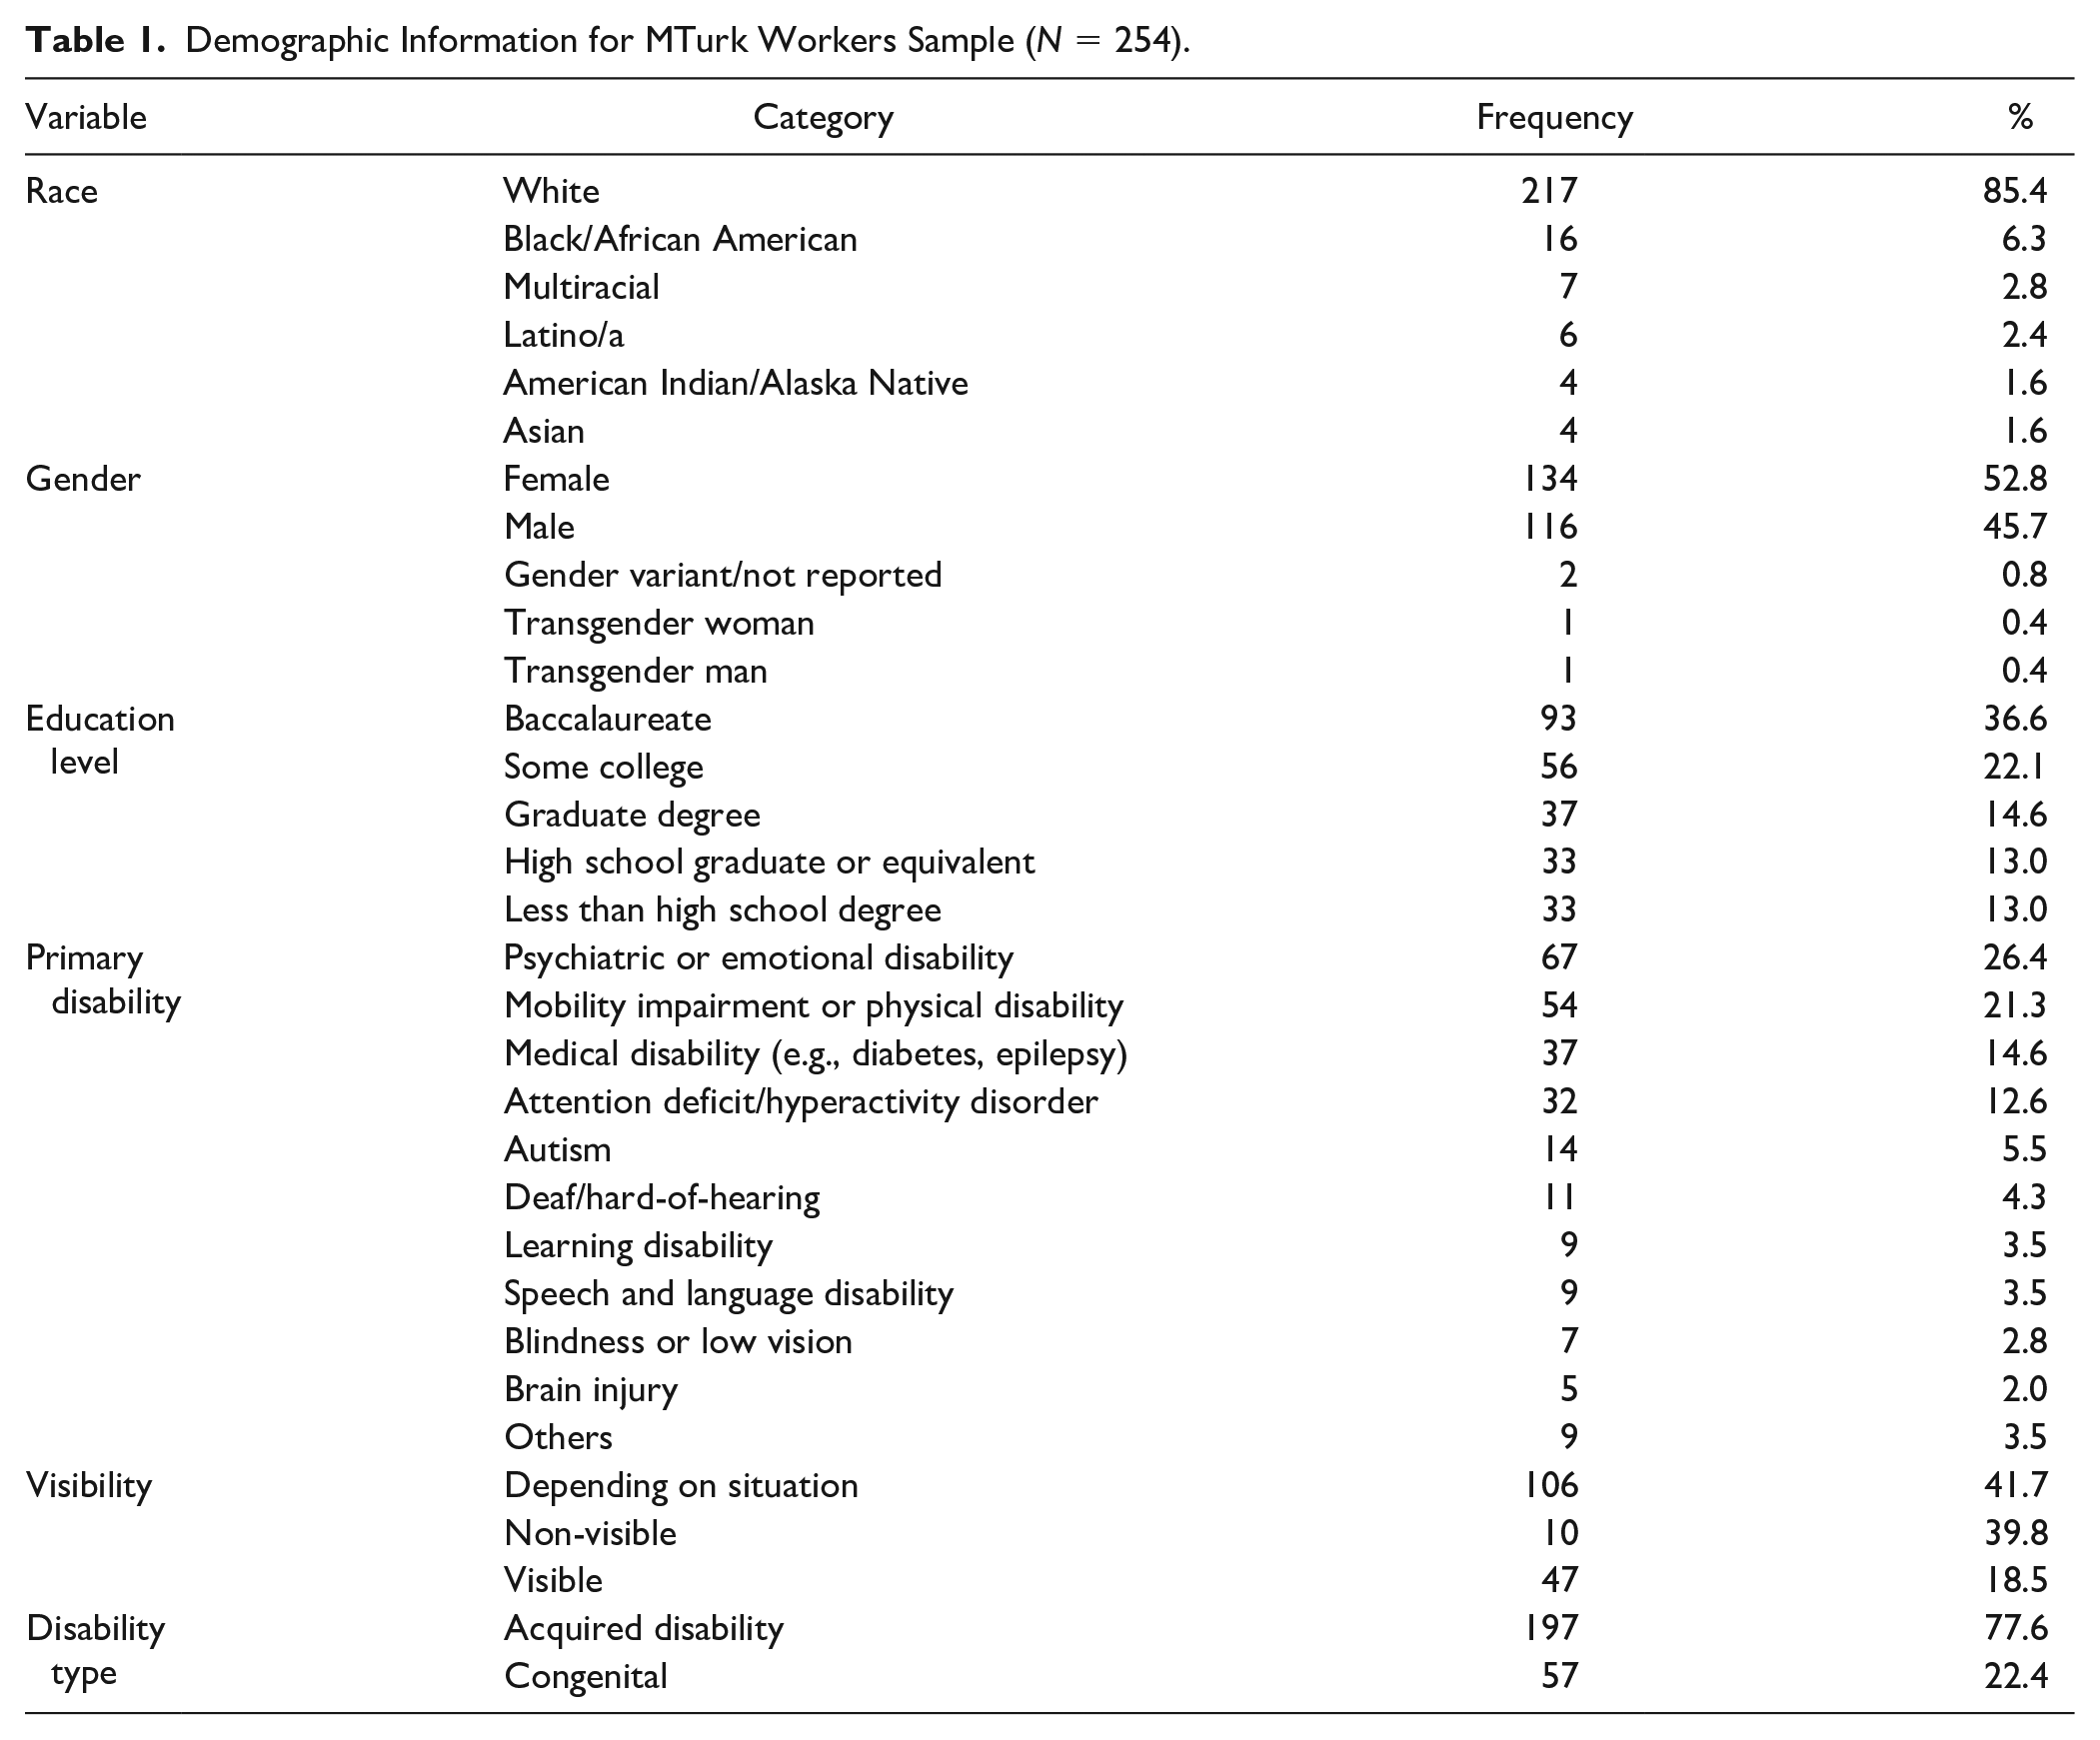
Sampling criteria were persons who (a) self-identified as a person with disability, (b) were at least 18 years of age, (c) lived in the United States, (d) possessed a fourth-grade English reading level (needed to complete measures), and (e) employed as a MTurk worker who had a 95% or higher approval rate on MTurk. Initially, 342 people completed the online survey but, after removing inattentive (82) and dishonest (6) respondents from the data file, the final sample was reduced to 254. The sample mean age was 38.3 years old (SD = 12.3) with most participants identified as White (85.4%) who had an acquired disability (76.6%) described as being either an emotional (26.4%) or physical disability (21.3%) (see Table 1).
Demographic Information for MTurk Workers Sample (N = 254).
Instruments
Demographic form
The demographic form included questions about age, formal education level, ethnicity/race, gender, and several disability aspects such as onset, duration, type, and degree of visibility as perceived by others (e.g., wheelchair user vs. someone with an emotional disability).
Validity scales related to adaptation to disability and stress
The first measure used to evaluate concurrent validity was the Brief Adaptation to Disability Scale–Revised (BADSR) (Lin et al., 2013). Based on the Adaptation to Disability Scale originally developed by Linkowski (1971), which was later revised by Groomes and Linkowski (2007), the current version has four subscales: (a) Enlarging the Scope of Values, (b) Subordinating the Physique Relative to Other Values, (c) Containing Disability Effects, and (d) Transferring Comparative Status Values to Asset Values. Using the shortened version by Lin et al., the scale consisted of 12 items with three items reflecting each of the four factors. Internal consistency reliability coefficients of subscales ranged from .65 to .84. For the current study sample, the internal consistency for the overall scale was .82, which is considered a “good” estimate of reliability (George & Mallery, 2003).
The second validity measure was the 10-item version of Perceived Stress Scale (PSS) developed by Cohen et al. (1983). This scale was validated with college students (Roberti et al., 2006) and persons with psychiatric disabilities (Hewitt et al., 1992). Internal consistency reliability for the overall scale was .89 (Roberti et al., 2006), which was identical to that found in this study. This estimate is considered “excellent” (George & Mallery, 2003).
Ableist Microaggressions Impact Questionnaire
The Ableist Microaggressions Impact Questionnaire (AMIQ) was developed to measure AM experiences of PWD. Initially, the major works by Sue (2010a, 2010b) and other empirical and conceptual studies as described in the introduction (e.g., Keller & Galgay, 2010) were used as a framework. During scale development, recommendations by DeVellis (2017) and Worthington and Whittaker (2006) were also followed (e.g., reading level between Grades 5 and 7, removal of double negatives or double-barreled statements and using the same prompt for each item [e.g., “I believe that . . . ”] that can falsely inflate test reliability).
Investigators drafted a list of possible items and then reviewed them as to how well each item addressed AM. Next, each item was categorized based on the 10 domains of AM proposed by Keller and Galgay (2010). Careful attention was paid to generate items that would apply across disability groupings. Any item having multiple-negative phrasing and items that involved reverse-scoring were restated to reduce confusion (DeVellis, 2017). Next, three academics serving as panel members reviewed each item for clarity, wording, and relatedness to the construct. Members consisted of one person with extensive expertise in social justice and multiculturalism, one person with significant work experience as a rehabilitation counselor, and a third person with multiculturalism research expertise. This input engendered minor editorial changes and adding two items, which resulted in a 60-item draft instrument. Finally, interviews with four people having different disabilities (blindness, mobility impairment, autism, and chronical health condition) identified through Facebook groups for PWD was conducted. This procedure was followed as we were seeking diversity in disability representation. We were specifically interested at this developmental stage if people with visible disabilities such as blindness and wheelchair users and people invisible disabilities such as autism and chronic health condition would have difficulty in understanding draft items similarly or perhaps raise concerns on how items were phrased. To get a better understanding of this concern, we used cognitive interviewing to identify items that should be modified or, if needed, eliminated.
Cognitive interviewing is defined as “administration of draft survey questions while collecting additional verbal information about the survey responses, which is used to evaluate the quality of the response or to help determine whether the question is generating the information that its author intends” (Beatty & Willis, 2007, p. 287). In a cognitive interview, the researcher focuses on question comprehension, information retrieval, judgment and estimation, and response (Willis, 2004). During interviews, participants are asked to respond to each item while thinking aloud and prompted to elaborate on what a particular item means to them (Willis, 2004). After using this process, eight items were removed because they lacked clarity, significantly overlapped with another item, or were not conceptually related to other scale items. For example, an item that read, “I have been told that I should be grateful to people who want to help me” was dropped because one participant expressed that feeling grateful for receiving help was not necessarily something relegated to having a disability. In addition, slight modifications to wording were made on several other items to clarify meaning.
The final 52-item version was then piloted with three other PWD who completed the online survey to ensure the format was working properly. The sample for the piloting consisted of one person with an emotional disability, one with hearing disability, and one with blindness. None of the pilot test participants expressed problems with respect to format or item content. The question format required participants to rate each item in terms of its impact, which was operationally defined as: “0 = This situation never happened to me”; “1 = It happened to me but it did not bother me at all”; “2 = It happened to me and it bothered me a little”; “3 = It happened to me and it bothered me moderately”; and “4 = It happened to me and it was very bothersome.”
Results
Exploratory Factor Analysis
Using the MPlus Version 7.4 (Muthén & Muthén, 2015), an exploratory factor analysis (EFA) was employed to examine how many latent variables accounted for AMIQ items (DeVellis, 2017). A maximum likelihood robust (MLR) was used as an estimator because it is robust in cases of non-normality (Muthén & Muthén, 2015). Varimax rotation was chosen as it provides a simpler factor structure (DeVellis). As far as determining how many factors should be retained, we used parallel analysis and Velicer’s minimum average partial (MAP) test given they are recommended methods when using EFA (DeVellis). Implementing these practices revealed that a three-factor structure was the best fit for the data.
In terms of individual item retention, a general practice used in EFA is to keep items that have a factor loading of at least .33 and limit the minimum difference between cross-loadings at .15 (Worthington & Whittaker, 2006). As a result of the first EFA, 16 items were dropped because they cross-loaded with two or more factors (e.g., “People ask me invasive questions about my disability”). After following these procedures, 36 remaining items were reanalyzed, which resulted in removal of 11 additional items; nine due to the lack of theoretical relevance to the overall factor term and two items because of low correlations with other items that did not exceed .35 or higher. After these procedures were followed, the EFA was conducted on the 25-item survey. The EFA resulted in a three-factor solution and accounted for 51.2% of the total variance. Internal consistency reliability for the overall scale was .92 with a mean of 2.32 and standard deviation of 0.83 across items.
As noted in Table 2, the first factor had 11 items with an overall mean of 2.12 and a standard deviation of 0.96. An item example for the first factor is “People ignore me because of my disability.” The common theme reflected by the first factor was Devalue and Undesirability, via Exclusion, Disrespect, and Undermining. The Cronbach’s alpha for the first factor was .89. The second factor had eight items with a mean of 2.74 and a standard deviation of 1.07. Cronbach’s alpha for Factor 2 was .87. An item example of this factor is “There have been times when others did not believe that I have a disability.” The shared theme of this factor was Minimization of the Disability Experience via Denial of Disability. The last factor had six items with a mean of 2.12 and a standard deviation of 0.87. An example item is “I have received praise for doing simple daily things.” The shared theme of the third factor was False Admiration and Under-Expectation via Over-helping and Patronizing. Cronbach’s alpha for this factor was .79.
AMIQ Factor Loadings for Exploratory Factor Analysis With Varimax Rotation.
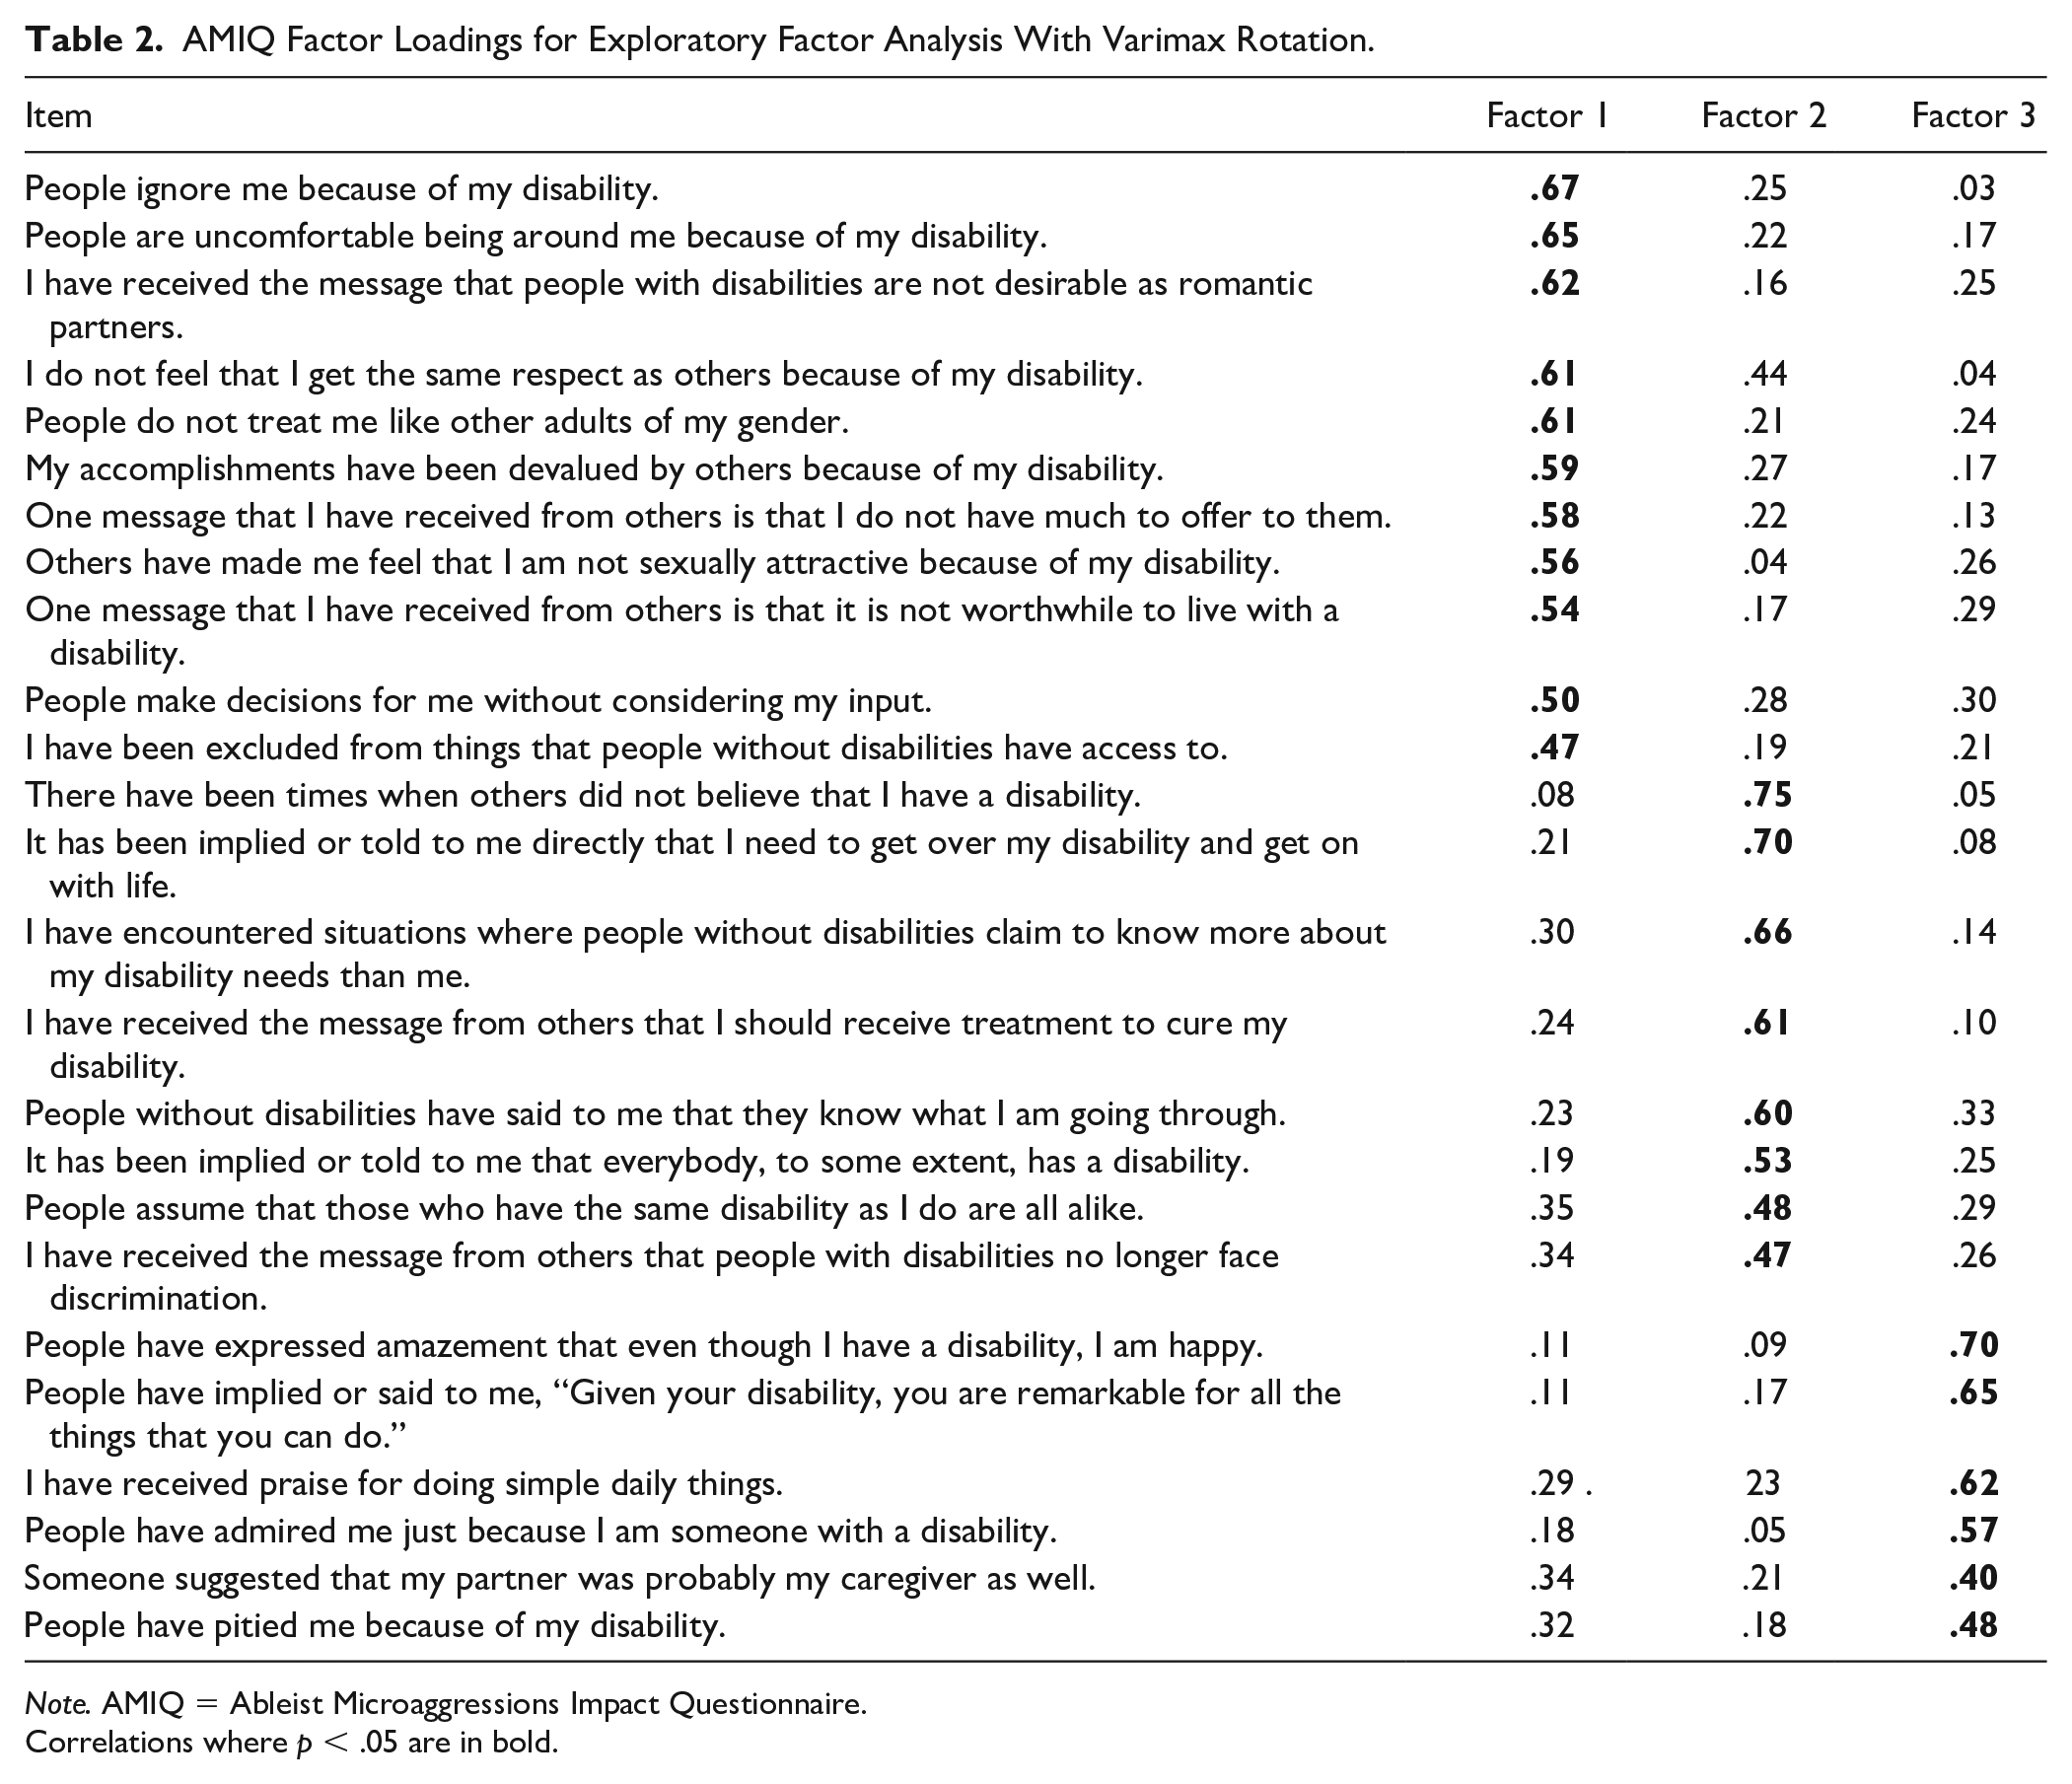
Note. AMIQ = Ableist Microaggressions Impact Questionnaire.
Correlations where p < .05 are in bold.
Concurrent Validity of the AMIQ
To establish concurrent validity with the AMIQ, participants were administered the PSS (Cohen et al., 1983) and the BADSR (Lin et al., 2013). Overall mean score from the AMIQ revealed it had moderate correlations with the PSS and the BADSR. The Pearson product-moment correlation value between overall AMIQ and PSS was .48 and between AMIQ and BADSR was −.35. In addition, each AMIQ subscale had statistically significant correlations with PSS and BADSR measures (see Table 3). Thus, the AMIQ demonstrated initial concurrent validity by correlating positively with the PSS and negatively with the BADSR.
Variable Intercorrelations Used in Regression Models and Measured Validity Constructs.
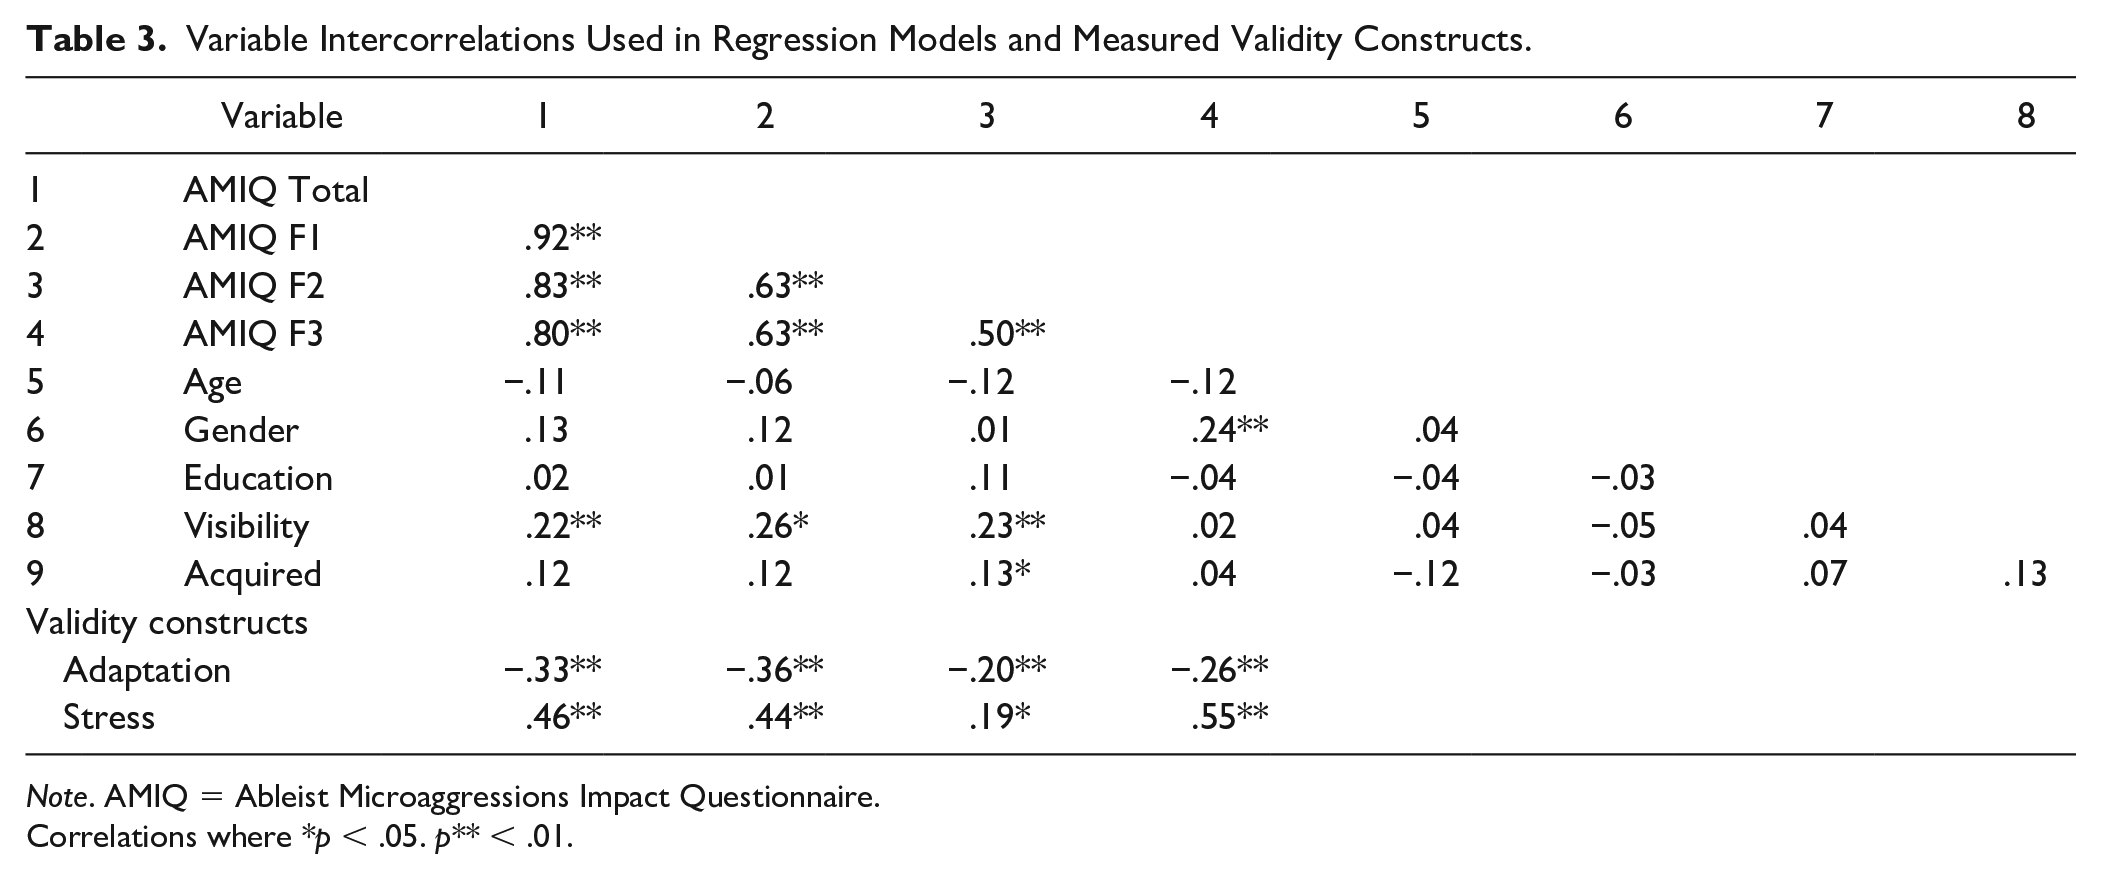
Note. AMIQ = Ableist Microaggressions Impact Questionnaire.
Correlations where *p < .05. p** < .01.
Relationship of AMIQ and Demographic and Disability-Related Variables
To explore predictive power of demographic and disability-related variables on overall AMIQ and its three subscales, a series of four multiple regressions and associated assumptions for the regression models were conducted (see Table 4). For the multiple regressions, MPlus 7.4 (Muthén & Muthén, 2015) and, for model assumption checks, SPSS 23 (IBM, 2015) were used. Although assumptions regarding multicollinearity, independence of error, and homoscedasticity were satisfied, the normality assumption had been violated with distributions slightly deviating from the normal distribution. This situation was addressed using MLR as an estimator for the regression models due to its robustness for non-normal distributions (Muthén & Muthén, 2015).
Regression Analysis Results (N = 254).
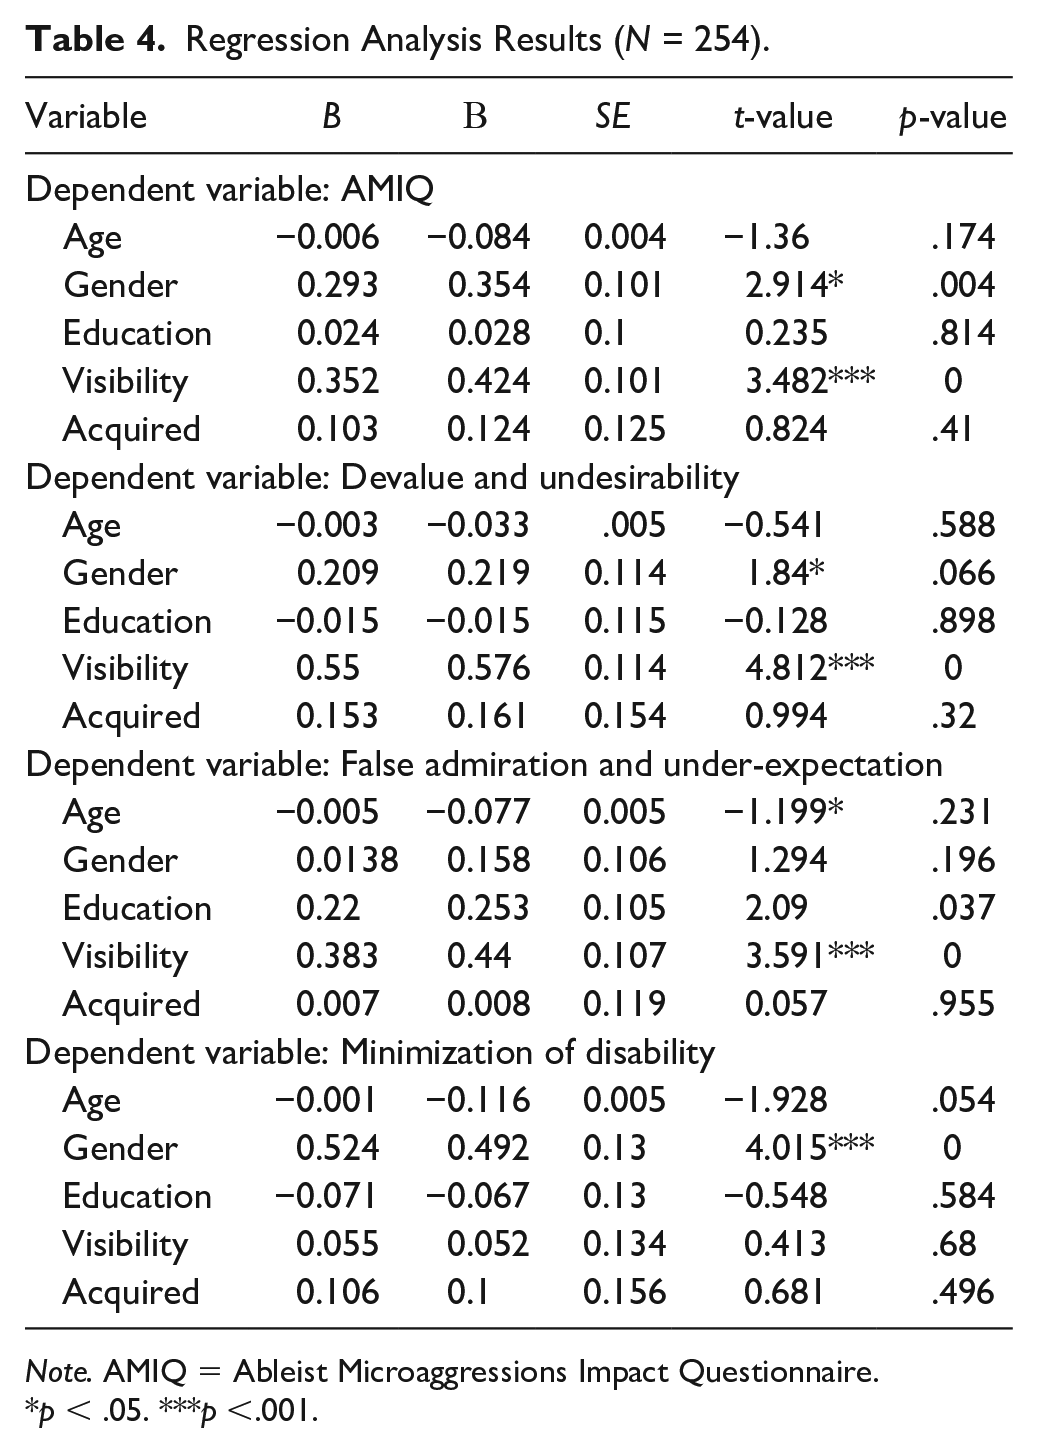
Note. AMIQ = Ableist Microaggressions Impact Questionnaire.
p < .05. ***p <.001.
In the first model, overall AMIQ score of participants was regressed on age, education (a dummy variable was created where up to bachelor’s degree was coded as “0” and bachelor’s degree and graduate degree was coded as “1”), gender (due to infrequent number of gender minority participants, only categories for men and women were included), visibility of disability (not visible as “0” and situationally visible and visible as “1”), and disability onset (acquired as “1” and congenital as “0”). The multiple regression model was statistically significant (R2 = .082, p < .05), indicating the model explained 8.2% of the total variance. Keeping all the other variables constant, visibility of disability was one of the significant predictors of the overall AMIQ (B = 0.35, p < .001, standardized difference = 0.42), the visibility of disability compared with invisibility resulted in a .35-unit difference in AMIQ. Thus, people with visible disabilities reported that they are bothered by the ablest microaggressions significantly more than people with invisible disabilities. Gender was another significant predictor of AMIQ (B = 0.29, p < .05, standardized difference = 0.35) where women had a unit of .29 higher than men.
The second multiple regression model was computed to explore the predictive power of age, gender, level of education, visibility of disability, and disability onset on the first factor, Devalue and Undesirability. This model was statistically significant (R2 = .10, p < .05), indicating that the model explained 10% of the total variance. Again, the significant predictor was visibility of disability (B = 0.55, p < .001, standardized difference = 0.58). There was a .55 unit difference between those having visible and invisible disabilities. Thus, people having visible disabilities reported that they are bothered by Devalue and Undesirability microaggressions significantly more than those having invisible disabilities.
Next, a multiple regression was computed with Minimization of Disability as criterion and age, gender, level of education, visibility of disability, and disability onset as predictor variables. The model was statistically significant (R2 = .08, p < .05). Gender appeared to be a statistically significant predictor (B = 0.52, p < .001, standardized difference = 0.49). Thus, being a woman was linked to a .52 increase in impact of Minimization of Disability Experience microaggressions.
Finally, a multiple regression was computed with age, gender, level of education, visibility of disability, and disability onset as predictor variables and False Admiration and Under-expectation as the criterion variable. This model was also statistically significant (R2 = .07, p < .05), which explained 7% of the total variance. Level of education was a significant predictor (B = 0.22, p < .05, standardized difference = 0.25). Thus, participants having bachelor’s degree and higher were bothered by a .22 unit more by False Admiration and Under-expectation microaggressions. Consistent with other results, visibility of disability was a statistically significant predictor (B = 0.38, p < .001, standardized difference = 0.44). Thus, participants with visible disabilities reported that they were bothered more by a unit of .38 than those with invisible disabilities.
Discussion
Preliminary evidence from this study indicates that the 25-item AMIQ offers promise as a research and educational training tool that could be used to better understand how AM impacts PWD. As a research tool, the instrument may have certain advantages over existing scales (i.e., Conover et al., 2017; Kattari, 2019) when considering: (a) economy of items, (b) high internal consistency reliability of overall scale and subscales, (c) AM effects assessed from perceived impact influences, and (d) a participant sample drawn from a broad representation of persons with lived disability experience. In trying to understand latent factors of ableist microaggressions, the AMIQ factor structure suggests that PWD experience them along three dimensions; the first occurs when perpetrators consciously or unconsciously communicate messages that tend to devalue, disrespect, or exclude them from engaging in the same social roles expected of persons without disabilities. A second type of microaggression occurs when PWD are either falsely admired or have lower expectations expressed by over-helping or patronizing behaviors promoted by their non-disabled peers. The third, and perhaps the most egregious transgression (based on mean scores), occurs in the form of micro-invalidation where perpetrators minimize the disability experience by simply denying its existence.
Results from this study also indicate that the impact of AM changes as a function of certain demographic and disability-related variables. Particularly, visibility of disability is a risk factor for being bothered by overall ableist microaggressions as well as specific domains pertaining to Devalue and Undesirability microaggressions and Under Expectation and False Admiration microaggressions. These results are consistent with Conover et al. (2017), who reported that visibility of disability was associated with these individuals experiencing more AM. In our study, gender was another significant predictor for overall ableist microaggression experience and minimization of disability microaggressions. This finding supports work noted by Olkin et al. (2019), who found that women with disabilities were more vulnerable regarding the impact of microaggressions. Due to their intersecting disadvantaged identities, they may experience greater invalidation and, as a result, their experience of disability might be questioned or downplayed more as compared with their male counterparts. The final predictor was level of education where having higher education was linked to being bothered more by the Under Expectation and False Admiration microaggressions. Given that the general public continues to perceive PWD as incompetent (e.g., Nario-Redmond, 2019), for persons who have achieved higher education levels (baccalaureate), our findings suggested that these individuals may be particularly bothered by microaggressions that patronize and under-value one’s capabilities.
With respect to psychometric properties of the scale, given the overall reliability estimate of .92 for the 25-item scale and subscale coefficients ranging between .79 and .89, it suggests this instrument is consistently measuring AM. An examination of correlations between AMIQ total test score and self-report measures of perceived stress and adaptation to disability were in expected directions and produced small to moderate correlation coefficients. It is also interesting to note that when examining the impact mean of each subscale, the Minimization of Disability Experience subscale had the highest mean (2.74). This finding supports the argument advanced by Sue (2010b), who indicated that microinvalidations are the most harmful type of microaggression. Furthermore, the negative correlation between the AMIQ and the Adaptation to Disability Scale–Revised indicates that one’s acceptance of disability might be a protective factor against the experience of AM. Although correlations found in this study were statistically significant, they were small and, as a result, further study using larger samples of people with varying years of lived disability experience to better understand the relationship between adaptation to disability and impact of AM is needed.
Implications for Research and Practice
This study is a preliminary step in validating a new scale to measure AM experiences of PWD. Although this study established the initial validity and reliability of AMIQ, further studies with larger sample sizes are needed to test the three-factor structure with confirmatory factor analytic methods. Investigating predictors and possible mediating and moderating factors linked to AM impact are also necessary. It may be, for example, that people with strong family and social support as well as certain personality traits in terms of openness to experience or extroversion mitigate this impact as noted in reviews of other marginalized groups (e.g., Ong & Burrow, 2017). Furthermore, investigations assessing the effectiveness of interventions to reduce AM may wish to consider using the AMIQ as a possible outcome measure.
As a clinical tool, reviewing individual items contained on the AMIQ could be used to explore and validate how each aspect has unique meaning to their personal experiences as part of counseling. Because AM are emotionally taxing for PWD (Kattari et al., 2018; Keller & Galgay, 2010), rehabilitation counselors can help clients develop coping strategies that ameliorate this impact using self-advocacy strategies. Counselors should be particularly mindful for clients with intersecting identities who are often marginalized because of ethnicity/race, gender, and/or sexual orientation. As we found in this study, intersecting identity may be particularly important for women with disabilities who are more negatively impacted as compared with men.
As an educational tool, the AMIQ could be used as part of supervised counseling. Given that examining counselor-client dynamics represents a basic component of good supervision practice (Herbert, 2018), the AMIQ might be included with other measures to address multicultural competence. For example, if the supervisee has lived disability experience, the respondent could answer questions as applicable. For supervisees without this experience, the instructions could be modified by asking the supervisee to respond to each item as to “how most people with disabilities might respond.” Asking the question in this manner may mitigate the problem of social desirability in terms of what people express and what they actually believe as part of clinical supervision.
Study Limitations
An investigation of personality traits by Chmielewski and Kucker (2020) found that while MTurk is considered “one of most important research tools in the past decade” (p. 464), it can also produce questionable or low-quality data. To address this threat, the authors recommend researchers implement validity checks, careful screening procedures, and monitor the number of participants who dropout. As noted in our study, we incorporated tasks intended to monitor participant inclusion criteria, attentiveness, and honesty and, in cases where violations occurred, these participants were eliminated from the study. These strategies resulted in losing one fourth of our sample, however. Furthermore, the decision to use MTurk as a data platform was partially made because it provided a useful alternative to conventional survey methods through disability advocacy groups, organizations, and registries. Recent studies (e.g., Buhrmester et al., 2018; Ipsen et al., 2021) indicated that, with few exceptions, MTurk closely approximated the racial demography of people in the United States. Our sample, however, revealed a somewhat higher percentage of Whites (85.4%) than what currently exists (76.3%) in the country (U.S. Census Bureau, 2019). Thus, one limitation that could be called into question concerns the representativeness as it pertains to race and, perhaps to a less extent, individual disability status. Representativeness by individual disability type could be questioned largely because of descriptors used in this study, which may be different from those used in surveys that use other disability terms. Given these demographic concerns, future investigations should include samples that more closely resemble nationwide racial demographics and, if using the AMIQ, retain the same disability descriptors used in this study so that legitimate comparisons are viable. In addition, Ipsen et al. recommend that MTurk be used to complement but not necessarily replace conventional recruitment methods.
A final limitation of the study is that while the regression model was statistically significant in terms of the AMIQ scores and demographics, it predicted a relatively small amount of the total variance (8%). Certainly, other salient variables not included in the prediction model should be examined in future studies that may account for a better understanding of AM. For example, beliefs regarding power and privilege (Sue, 2010a), personality traits (Lilienfeld, 2017), minority group identification (Jones & Galliher, 2015), and emotional reactivity (Nadal et al., 2015) are ones that have been cited in the general literature as it pertains to ethnic/racial, gender, and sexual identity microaggression (e.g., Sue, 2010b).
Conclusion
The social model of disability asserts that PWD are seen as a minority group who continue to experience oppression, prejudice, and discrimination (Mackelprang & Salsgiver, 2016). This study provides further evidence that these factors continue to exist within the disability community with women and those with visible disabilities being particularly vulnerable. For minority groups, microaggressions serve as ways to uphold marginalization, to keep voices silent and maintain status quo desired by majority members. Although counselor educators can play an important role in providing multicultural training to tackle microaggressions toward PWD, this effort constitutes an expected area of professional competence for certified rehabilitation counselors who provide clinical supervision to promote cultural diversity (Commission on Rehabilitation Counselor Certification, 2017). This study described the process of the development, refinement, and establishment of a promising tool that can assess microaggressions experienced by PWD. It is hoped that using this assessment tool will contribute to a greater understanding of making people who have been largely invisible not only become visible but heard.
Footnotes
Declaration of Conflicting Interests
The author(s) declared no potential conflicts of interest with respect to the research, authorship, and/or publication of this article.
Funding
The author(s) received no financial support for the research, authorship, and/or publication of this article.