
Abstract
This study aimed to test the validity and reliability of the Kessler Psychological Distress Scale-6 (K6) with a nationally representative clinical sample with various mental health disorders. The cross-sectional, nationally representative, and publicly available data were extracted from the 2014 Health Center Patient Survey (HCPS), which was sponsored by the Health Resources and Services Administration (HRSA). After excluding certain participants for the purpose of this study, we had a total of 1,863 participants. The highest and lowest psychological distress weighted scores were reported by individuals with bipolar disorder (M = 17.16) and individuals with schizophrenia (M = 16.09), respectively, although psychological distress interference was highest in individuals with schizophrenia (M = 2.44). Exploratory factor analysis (EFA) and confirmatory factor analysis (CFA) results yielded a unidimensional factor solution for K6 scale in all subgroups. The K6 is a brief, reliable, and valid measure of psychological distress in adults with panic disorder, generalized anxiety disorder, bipolar disorder, and schizophrenia.
Keywords
The Kessler Psychological Distress Scale (Kessler et al., 2002) is a widely used measure of psychological distress nationally and internationally. The 10-item (K10) version and reduced six-item (K6) version both were originally developed to assess the severity of psychological distress experienced among general population (Kessler et al., 2002, 2003). Due to brevity and reliability, the K6 has been often used as a screening tool to assess any psychological distress and serious mental illness in the community and primary care settings (Kessler et al., 2002, 2003, 2005, 2010; Mitchell & Beals, 2011). The K6 is used across various populations from adolescents/young adults (e.g., Bessaha, 2017; Mewton et al., 2016) to older adults (e.g., Kim et al., 2012), across various racial/ethnic groups (e.g., Furukawa et al., 2003; Kessler et al., 2010; Mitchell & Beals, 2011; Stolk et al., 2014), and various settings (e.g., Carrà et al., 2011; Peiper et al., 2015; Swartz & Lurigio, 2006). Studies have found that the K6 is a useful tool to identify individuals with serious psychological distress (Furukawa et al., 2003; Kessler et al., 2010).
Although the K6 is more often used for general populations, existing literature suggests that the K6 can be helpful for clinical samples from the community (Sunderland et al., 2012). For example, Staples and colleagues (2019) found the K6 is useful to assess improvement in symptoms of anxiety and depression after receiving Internet-delivered cognitive behavior therapy among Australian clinical samples experiencing symptoms of depression or anxiety. Ongoing assessment of symptoms may help clinicians understand progress of treatment and support quality in continuity of care among community-based clinical samples (Clark et al., 2018; Staples et al., 2019). Yet, the research using the K6 with clinical samples is limited in the United States and more research evidence, particularly studies around the K6 psychometric properties with clinical samples, beyond general populations is needed.
Various psychometric studies have been conducted to examine accuracy and utility of the K6 with various populations and settings. Many of existing studies suggest that the K6 is a reliable and valid measurement (Drapeau et al., 2010; Ferro, 2019; Kessler et al., 2002, 2003, 2010; Mitchell & Beals, 2011; Prochaska et al., 2012; Swartz & Lurigio, 2006). Yet, there are also studies inquiring further investigation about applying and interpreting the K6 because of variations in psychometrics depending on populations and settings, particularly variations with minority populations (Drapeau et al., 2010; Ferro, 2019; Stolk et al., 2014; Sunderland et al., 2012). For example, Mewton and colleagues (2016) found sex-based non-invariance among Australian adolescents while a study from Peiper and colleagues (2015) report measurement invariance across gender among Idaho adolescents. Some studies using general population samples report that the K6 has a single dimension (Green et al., 2010; Kessler et al., 2002, 2003, 2010; Mitchell & Beals, 2011; Peiper et al., 2015; Sunderland et al., 2012), while others suggest a two-factor model-depression and anxiety latent constructs (Bessaha, 2017; Lace et al., 2018). Studies using clinical samples are limited but have also found inconsistency in structure of the K6 (Arnaud et al., 2010; Ko & Harrington, 2016; Sunderland et al., 2012). Some studies claim that a two-factor model provides with a better fit, compared with a single-factor model (Arnaud et al., 2010; Ko & Harrington, 2016). Others support a unidimensional model (Sunderland et al., 2012). Given the limitations of studies examining the validity of the K6 with clinical samples (Stolk et al., 2014) and clinical samples often limited to people with primary diagnosis or comorbid depression and anxiety (Arnaud et al., 2010; Staples et al., 2019). Further research is needed to understand the psychometric properties of K6 with a clinical sample of adults experiencing various mental disorders to predict the utility and applicability of this tool (Sunderland et al., 2012).
The purpose of this study was to examine validity of the K6 with a nationally representative, community-based clinical sample of adults with various mental health disorders. This study particularly examined psychometric properties of the K6 in people diagnosed with panic disorder, generalized anxiety disorder (GAD), bipolar disorder, and schizophrenia spectrum disorder. Understanding psychometric properties across clinical samples with various mental disorders will inform rehabilitation and mental health practitioners and researchers about the validity of the K6 with various clinical samples, which may help them better assess and monitor mental health issues, and provide treatment that meet clients’ specific needs.
Method
Data Source and Study Population
This study is approved as an exempt study by the Instituonal Review Board of the University of Texas at El Paso. These cross-sectional, nationally representative, and publicly available data were extracted from the 2014 Health Center Patient Survey (HCPS) sponsored by Health Resources and Services Administration (HRSA). We have used this data to conduct research on health and rehabilitation outcomes (e.g., Brooks et al., 2020; Fortuna et al., 2020). The data include sociodemographic and health-related variables such as distress, mental health diagnosis, and activities of daily living. The total survey sample size was 7,002 patients receiving services from community health centers. Each participant was compensated $25 for their participation. A detailed data file user’s manual could be found at HRSA website: (https://bphc.hrsa.gov/datareporting/research/hcpsurvey/2014usermanual.pdf). For the purpose of this study, we excluded participants who (a) were less than age of 18, (b) did not report any of mental health disorder (i.e., panic disorder, GAD, bipolar disorder, and schizophrenia), and (c) were missing responses in variables of interest (e.g., all K6 items), resulting in a final sample size of 1,863.
Measures
Psychological distress
Psychological distress was measured with the six-item version of the Kessler Psychological Distress Scale (K6; Kessler et al., 2002). The scale consists of six items asking how frequent in the past 30 days participants had felt nervous, hopeless, restless or fidgety, depressed, that everything is an effort, and worthless. Responses were rated on a 5-point Likert-type rating scale ranging from 1 (none of the time) to 5 (all of the time). The total score ranged from 6 to 30, whereby higher scores represents greater psychological distress. The scale was reported to have an excellent internal consistency reliability (α = .89; Kessler et al., 2002) and a very good discrimination between individuals with serious mental illness and without serious mental illness, with a 0.86 (cutoff = 13) area under the receiving operating characteristic curve (Kessler et al., 2003).
Psychological distress interference
Psychological distress interference in participants’ daily life activities was measured with a single item (i.e., “How much did these feelings interfere with your life or activities?”) from the survey data set. Responses were rated on a 5-point rating scale ranging from 1 (a lot) to 5 (not at all), with higher scores reflecting lower distress interference in daily life activities.
Mental health disorders
Mental health disorders were measured with four items asking participants dichotomously (yes vs. no) whether they were ever told by a doctor or other health professional that they have a panic disorder (i.e., “Has a doctor or other health professional ever told you that you had panic disorder?”), GAD (i.e., “Has a doctor or other health professional ever told you that you had generalized anxiety?”), bipolar disorder (i.e., “Has a doctor or other health professional ever told you that you were bipolar?”), and schizophrenia spectrum disorder (i.e., “Has a doctor or other health professional ever told you that you had schizophrenia?”).
Activities of daily living
Activities of daily living (ADL) was assessed with five items from the data set. Items asked participants dichotomously (yes vs. no) whether they (a) have difficulty dressing or bathing, (b) need help with eating, (c) need help with getting in or out of bed or chairs, (d) help with using the toilet, including getting to the toilet, and (e) have serious difficulty walking or climbing stairs. Higher scores indicate greater limitations in ADL.
Instrumental activities of daily living
Instrumental activities of daily living (IADL) were assessed with a single dichotomous item (i.e., “Because of a physical, mental, or emotional condition, do you have difficulty doing errands alone such as visiting a doctor or shopping?”).
Health status
Health status was measured with a single item asking how participants rate their health in general, using a 5-point scale ranging from 1 (excellent) to 5 (poor). The health status scores were recoded so that higher scores reflect better health status.
Data Analysis
Prior to data analysis, we conducted several diagnostic tests to examine descriptive statistics and missing data. After we removed cases that did not have responses for at least four items of the K6 scale, we conducted a single imputation using mean replacement for missing data (Fox-Wasylyshyn and El-Masri, 2005). To cross-validate, similar to our previous research method (e.g., Umucu et al., 2019), a random split-half approach was adopted by performing a series of exploratory factor analysis (EFA) on the first split-half (N = 938) and a series of confirmatory factor analysis (CFA) on the second data set (N = 925). Descriptive statistics, EFA and CFA were conducted with SPSS 25.0 and R, lavaan and SemPlot packages (Epskamp, 2013; IBM Corp. Released, 2017; R Core Team, 2019 R Studio Team, 2020; Rosseel, 2012). A series of internal consistency reliability coefficients were calculated to determine reliability estimates of the K6 scale for each mental health disorder subgroup. By using STATA 16.0, we conducted (a) a correlation analysis to examine validity of the K6 in the total sample size by using “corr_svy” module and (b) a series of multiple regression analyses to examine the relationships between psychological distress and overall health status in the total sample size for each mental health disorder subgroup (StataCorp, 2019; Winter, 2001). To measure validity, we used the following variables: health status, distress interference, ADL impairment, and IADL impairment. All analyses (except EFA and CFA) were conducted using strata, cluster, and weight variables to account for complex sampling and procedure estimates that represent U.S. health center attendees (Health Resources and Services Adminitration, 2016).
Results
Descriptive Statistics
Participants were predominantly middle-aged, non-Hispanic White, female, and not married. The highest and lowest weighted psychological distress scores were 17.16 for individuals with bipolar disorder and 16.09 for individuals with schizophrenia although the highest and lowest weighted distress interference scores were reported by individuals with schizophrenia (M = 2.44) and individuals with panic disorder (M = 2.16). Interestingly, the lowest and highest weighted health status scores were reported by individuals with schizophrenia (M = 1.90) and individuals with panic disorder (M = 2.07). Table 1 represents the descriptive statistics.
Unweighted and Weighted Descriptive Statistics.
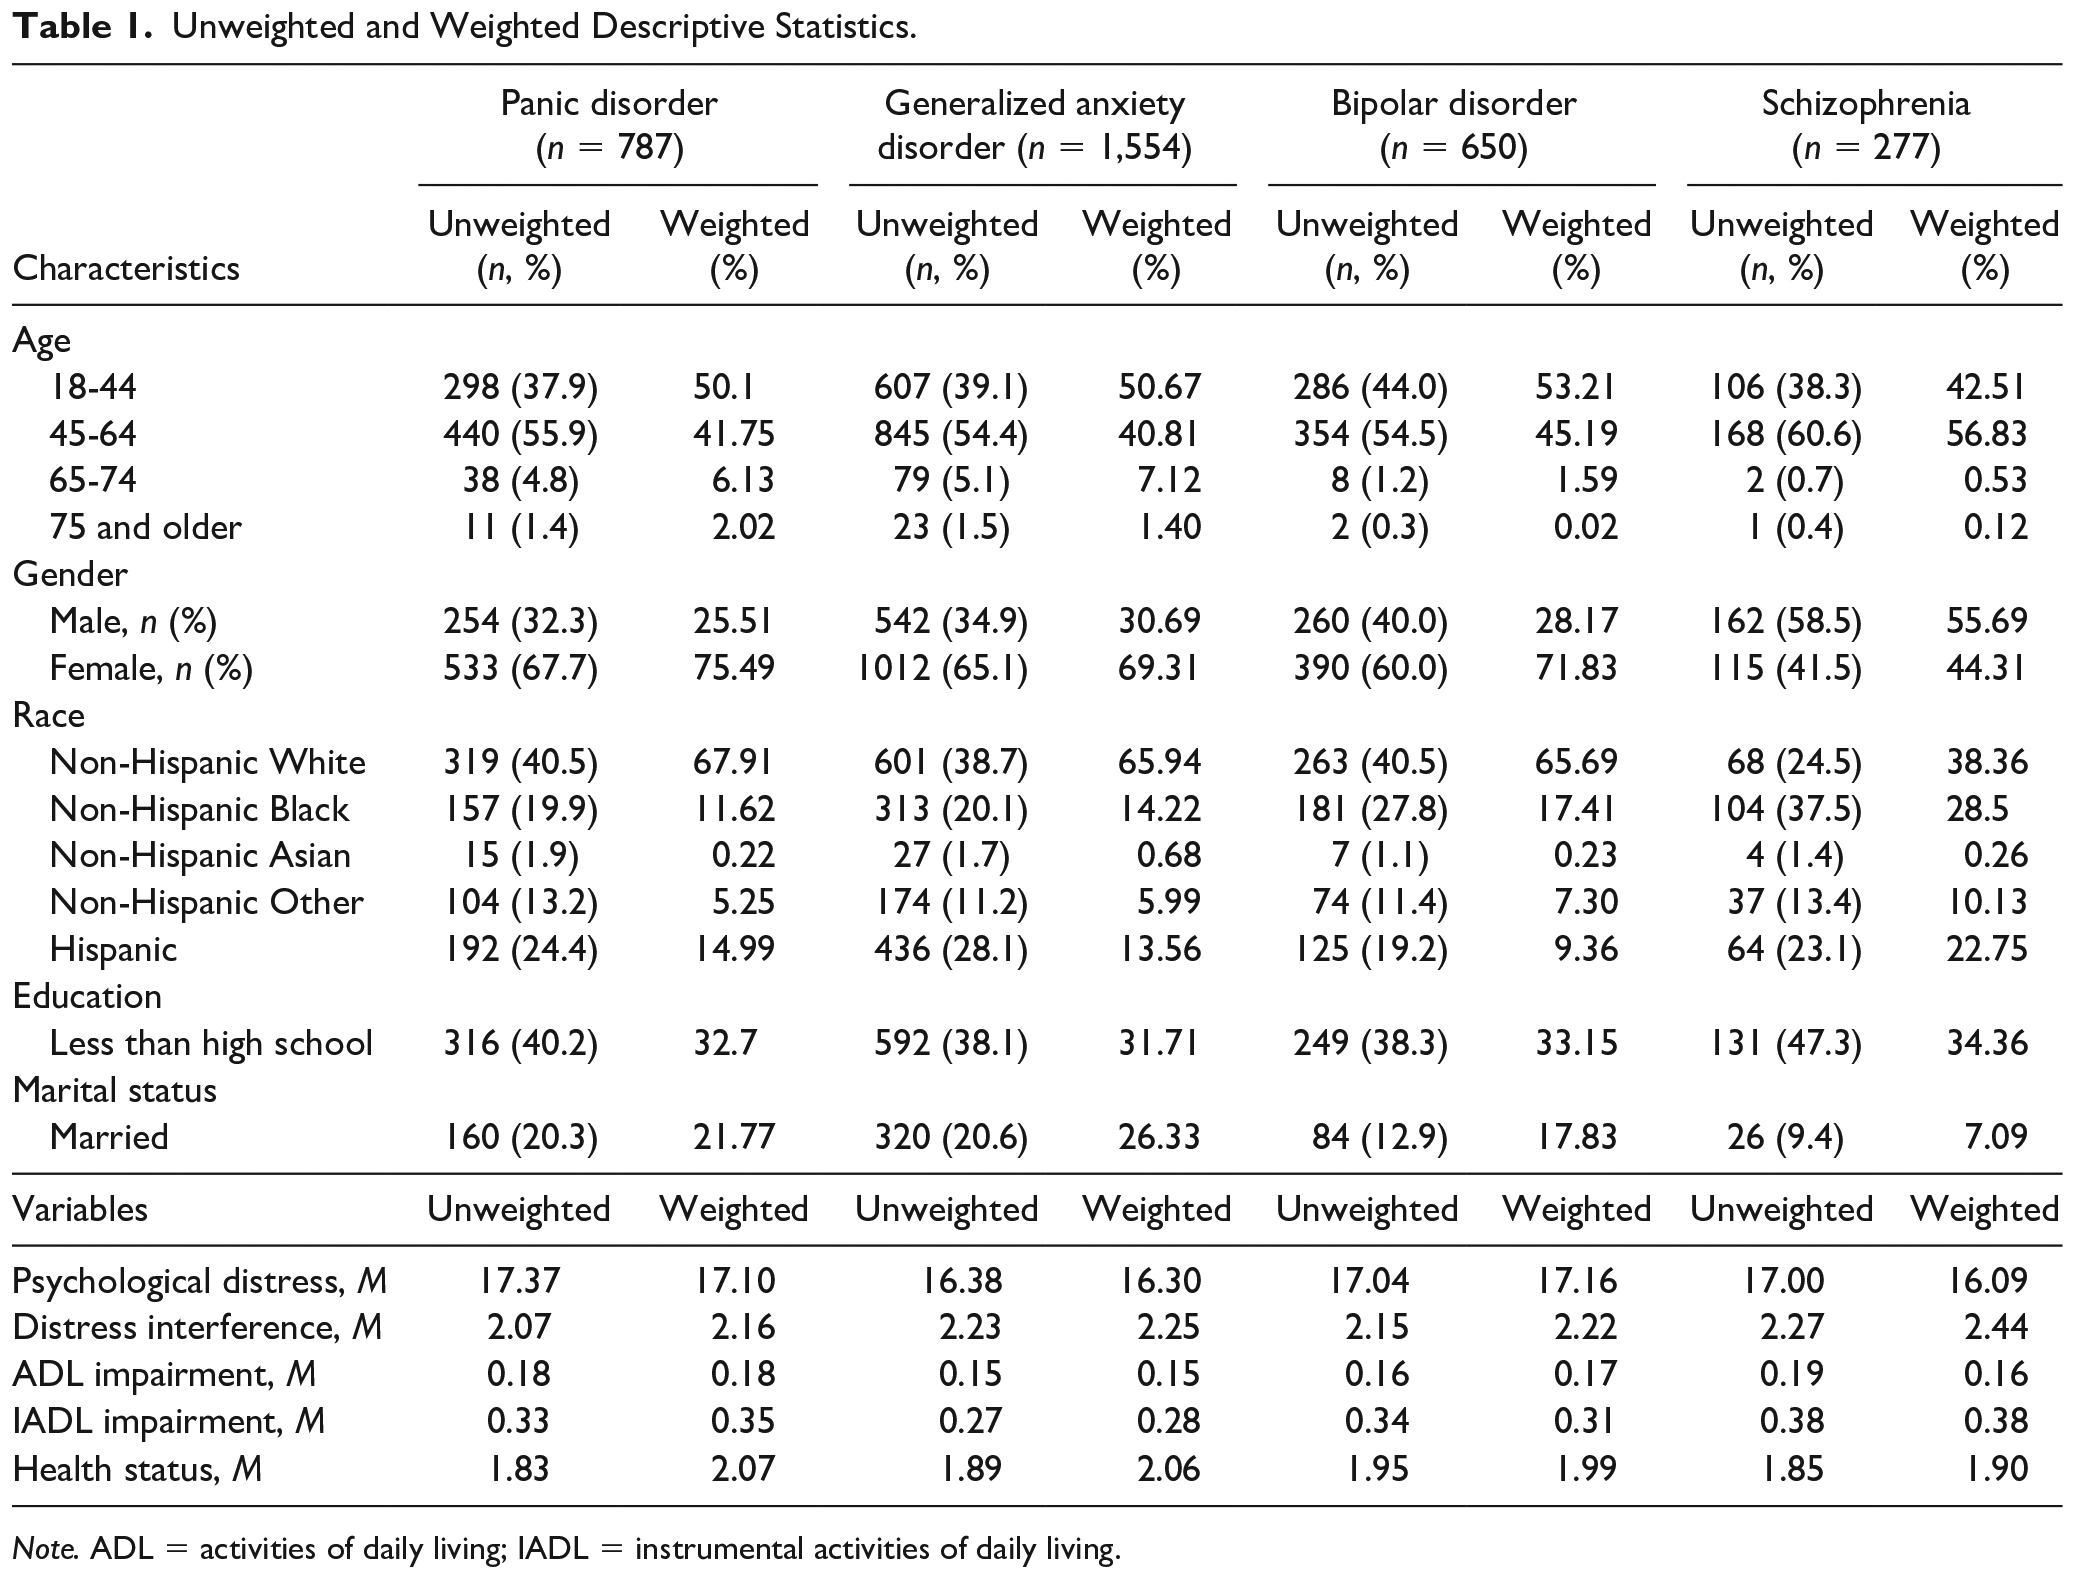
Note. ADL = activities of daily living; IADL = instrumental activities of daily living.
Exploratory Factor Analysis (EFA)
A total of four EFAs were conducted. The K6 scale was subjected to a principal axis factoring for each mental health disorder subgroup. The Kaiser–Meyer–Olkin value was .85 for panic disorder and bipolar disorder, .86 for GAD, and .84 for schizophrenia, indicating good degrees of common variance among the variables (Kaiser, 1974). The Bartlett Test of Sphericity was significant for all samples indicating that correlations in the data sets are appropriate for factor analysis (see Table 2). The Kaiser-Guttman rule (eigenvalue greater than one) was first used to determine the number of factors to be retained, followed by Cattell’s Scree test (Cattell, 1966). Analysis of the eigenvalues and scree plot indicated a one-factor measurement structure for all samples, accounting for 54.15% for panic disorder, 52.27% for GAD, 51.48% for bipolar disorder, and 50.54% for schizophrenia. Table 2 represents the details of EFA results.
Exploratory Factor Analysis Results.
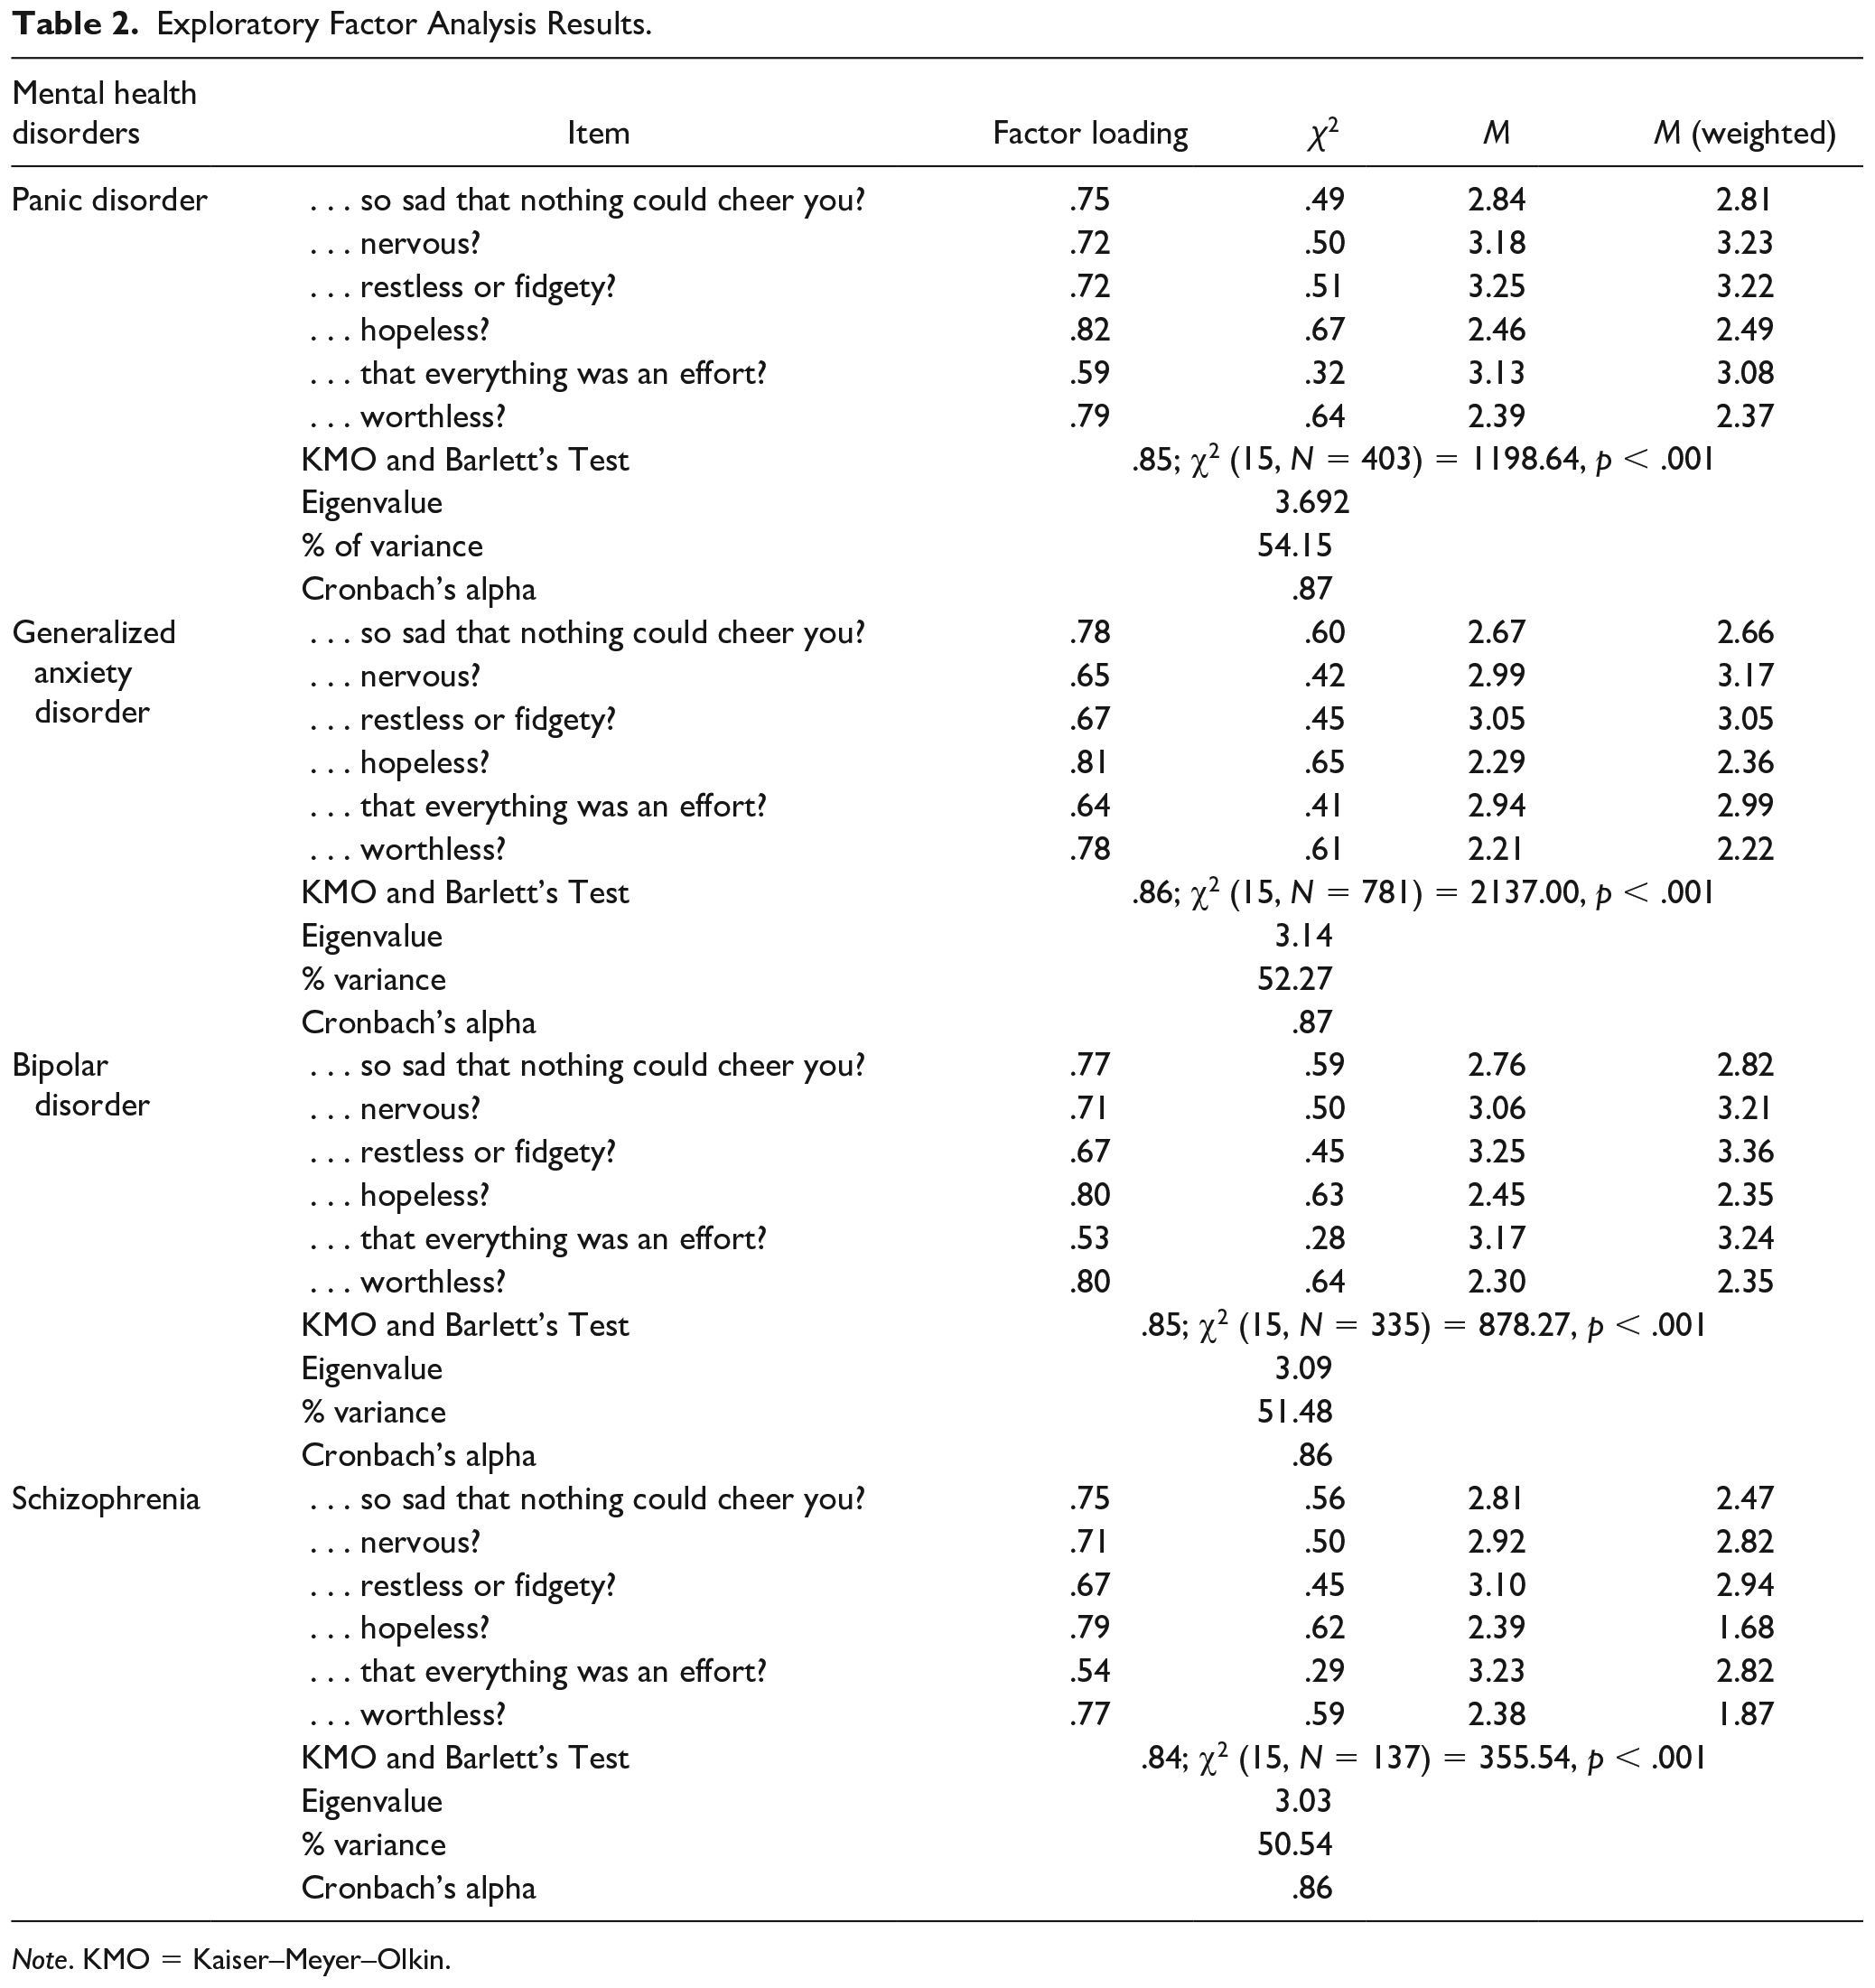
Note. KMO = Kaiser–Meyer–Olkin.
Confirmatory Factor Analysis (CFA)
A total of eight CFAs were conducted to cross-validate the factor structure of K6. The model-data fit was examined using the chi-square goodness-of-fit test (χ2; a nonsignificant p value), the χ2/df (a score of 1 to 3); root mean square error approximation (RMSEA; a score of less than 0.08), the standardized root mean square residual (SRMR; a score of less than 0.05), the comparative fit index (CFI; a score of more than 0.95), the Tucker–Lewis Index (TLI; a score of more than 0.95), and the Goodness of Fit (GFI; a score of more than 0.95) (Byrne, 2001; Hu & Bentler, 1999). Table 3 represents the details of CFA results.
Confirmatory Factor Analysis Results.
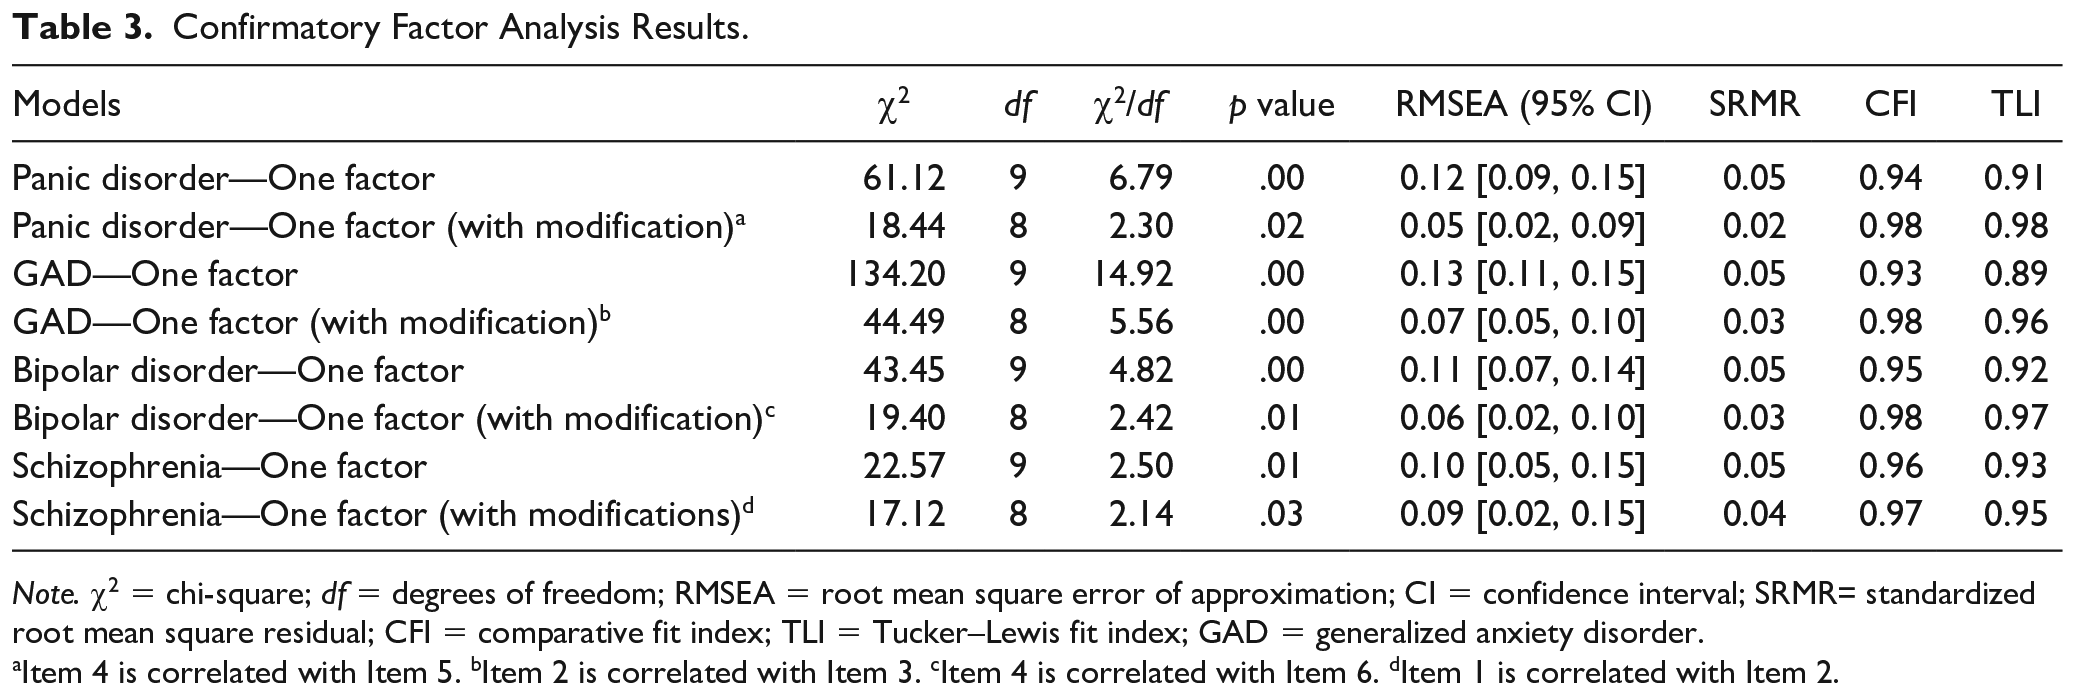
Note. χ2 = chi-square; df = degrees of freedom; RMSEA = root mean square error of approximation; CI = confidence interval; SRMR= standardized root mean square residual; CFI = comparative fit index; TLI = Tucker–Lewis fit index; GAD = generalized anxiety disorder.
Item 4 is correlated with Item 5. bItem 2 is correlated with Item 3. cItem 4 is correlated with Item 6. dItem 1 is correlated with Item 2.
Panic disorder
The initial one-factor CFA model indicated a relatively poor fit for the data: χ2 (9, N = 384) = 61.12, p < .001, χ2/df = 6.79, RMSEA = 0.12, 90% confidence interval (CI) = [0.09, 0.15], SRMR = 0.05, CFI = 0.94, TLI = 0.91, and GFI = 0.94. However, an examination of the modification indexes indicated that a pair of error terms should be correlated: (a) Item 4 (“During the past 30 days, how often did you feel hopeless?”) with Item 5 (“During the past 30 days, how often did you feel that everything was an effort?”). Results of the respecified one-factor model indicated a very good model fit: χ2 (8, N = 384) = 18.44, p < .01, χ2/df = 2.30, RMSEA = 0.05, 90% confidence interval (CI) = [0.02, 0.09], SRMR = 0.02, CFI = 0.98, TLI = 0.98, and GFI = 0.98.
GAD
The initial one-factor CFA model indicated a relatively poor fit for the data: χ2 (9, N = 773) = 134.20, p < .001, χ2/df = 14.92, RMSEA = 0.13, 90% confidence interval (CI) = [0.11, 0.15], SRMR = 0.05, CFI = 0.93, TLI = 0.89, and GFI = 0.94. However, an examination of the modification indexes indicated that a pair of error terms should be correlated: (a) Item 2 (“During the past 30 days, how often did you feel nervous?”) with Item 3 (“During the past 30 days, how often did you feel restless or fidgety?”). Results of the respecified one-factor model indicated a very good model fit: χ2 (8, N = 773) = 44.49, p < .001, χ2/df = 5.56, RMSEA = 0.07, 90% confidence interval (CI) = [0.05, 0.10], SRMR = 0.03, CFI = 0.98, TLI = 0.96, and GFI = 0.98.
Bipolar disorder
The initial one-factor CFA model indicated a relatively poor fit for the data: χ2 (9, N = 315) = 43.45, p < .001, χ2/df = 4.82, RMSEA = 0.11, 90% confidence interval (CI) = [0.07, 0.14], SRMR = 0.05, CFI = 0.95, TLI = 0.92, and GFI = 0.95. However, an examination of the modification indexes indicated that a pair of error terms should be correlated: (a) Item 4 (“During the past 30 days, how often did you feel hopeless?”) with Item 6 (“During the past 30 days, how often did you feel worthless?”). Results of the respecified one-factor model indicated a very good model fit: χ2 (8, N = 315) = 19.40, p < .01, χ2/df = 2.42, RMSEA = 0.06, 90% confidence interval (CI) = [0.02, 0.10], SRMR = 0.03, CFI = 0.98, TLI = 0.97, and GFI = 0.97.
Schizophrenia
The initial one-factor CFA model indicated a relatively poor fit for the data: χ2 (9, N = 140) = 22.57, p < .01, χ2/df = 2.50, RMSEA = 0.10, 90% confidence interval (CI) = [0.05, 0.15], SRMR = 0.05, CFI = 0.96, TLI = 0.93, and GFI = 0.95. However, an examination of the modification indexes indicated that a pair of error terms should be correlated: (a) Item 1 (“During the past 30 days, how often did you feel so sad that nothing could cheer you up?”) with Item 2 (“During the past 30 days, how often did you feel worthless?”). Results of the respecified one-factor model indicated a very good model fit: χ2 (8, N = 140) = 17.12, p < .01, χ2/df = 2.14, RMSEA = 0.09, 90% confidence interval (CI) = [0.02, 0.15], SRMR = 0.04, CFI = 0.97, TLI = 0.95, and GFI = 0.96.
Reliability
The internal consistency reliability coefficient (Cronbach’s α) for the K6 was computed to be .87 for both panic disorder and GAD and .86 for bipolar disorder and schizophrenia, indicating very good to excellent reliability.
Concurrent Validity
The K6 was associated with distress interference (r = −.69, p < .05), ADL impairment (r = .21, p < .05), IADL impairment (r = .23, p < .05), and overall health status (r = −.23, p < .05).
Incremental Validity
We explored incremental validity by testing whether psychological distress was associated with overall health status after controlling demographic variables. A total of four multiple regression analyses were conducted. Table 4 represents the details of multiple regression analyses results.
Incremental Validity of the K6 Scale.
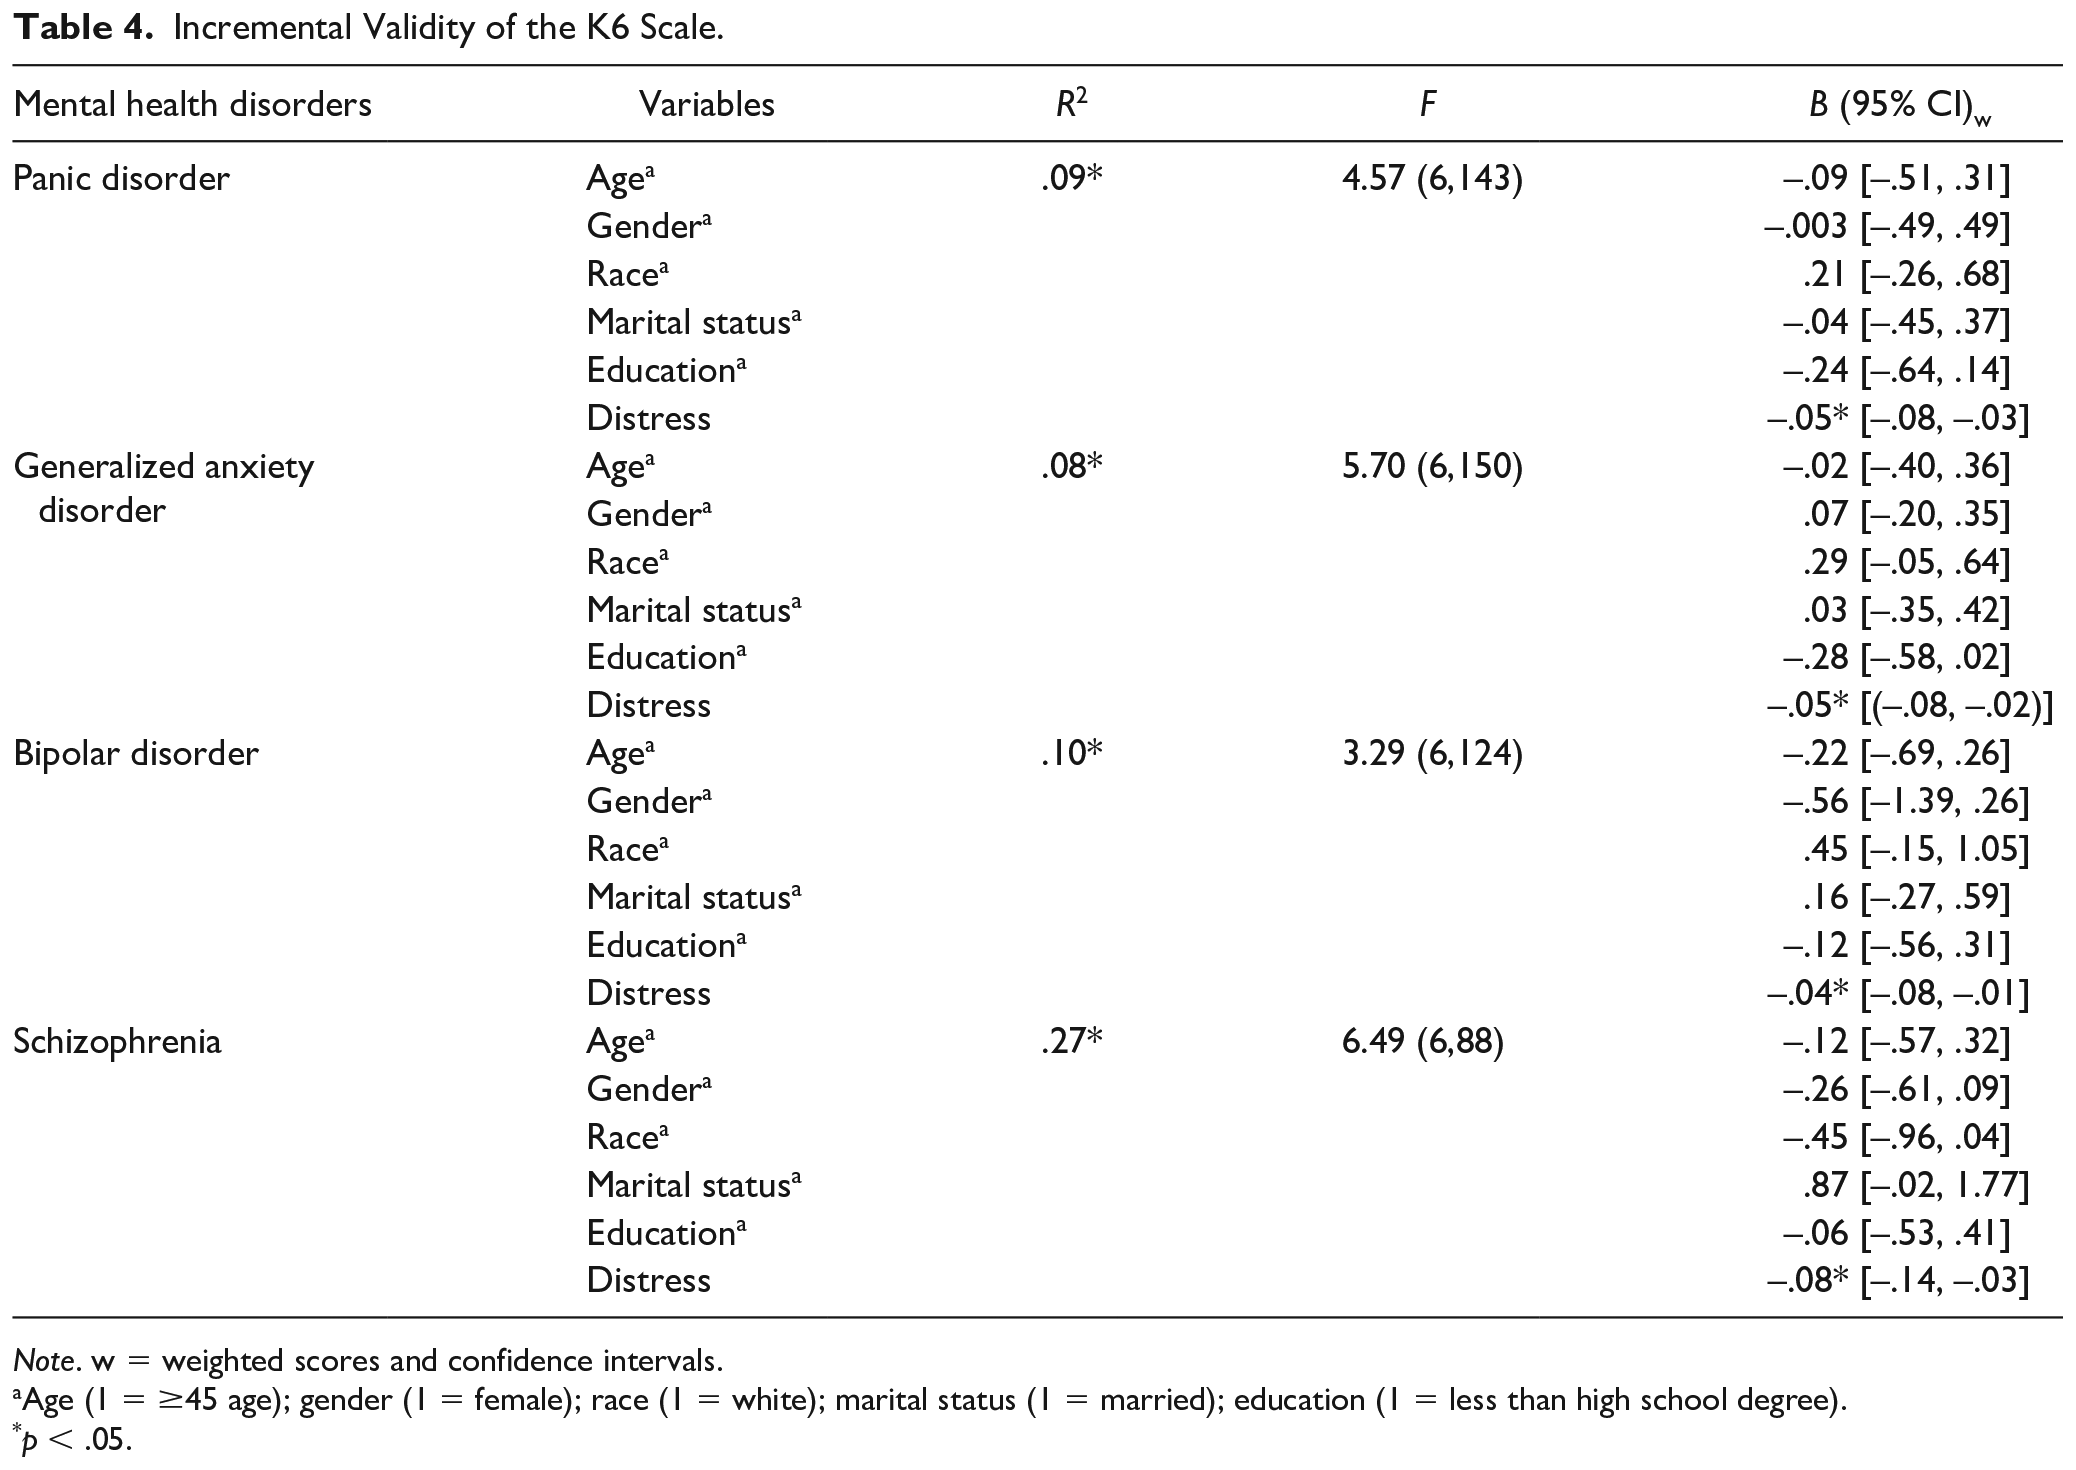
Note. w = weighted scores and confidence intervals.
Age (1 = ≥45 age); gender (1 = female); race (1 = white); marital status (1 = married); education (1 = less than high school degree).
p < .05.
Panic disorder
As seen in Table 4, entering age (1 = ≥45 age), gender (1 = female), race (1 = white), marital status (1 = married), education (1 = less than high school degree), and psychological distress accounted for a significant proportion of variance in health status in individuals with panic disorder, R2 = .09, F(6, 143) = 4.57, p < .05. The standardized regression coefficients were significant for only psychological distress (B = −.05, p < . 05).
GAD
After entering demographic variables and psychological distress, our model accounted for a significant proportion of variance in health status in individuals with GAD, R2 = .08, F(6, 150) = 5.70, p < . 05. The standardized regression coefficients were significant for only psychological distress (B = −.05, p < . 05).
Bipolar disorder
After entering demographic variables and psychological distress, our model accounted for a significant proportion of variance in health status in individuals with bipolar disorder, R2 = .10, F(6, 124) = 3.29, p < . 05. The standardized regression coefficients were significant for only psychological distress (B = −.04, p < . 05).
Schizophrenia
After entering demographic variables and psychological distress, our model accounted for a significant proportion of variance in health status in individuals with schizophrenia, R2 = .27, F(6, 88) = 6.49, p < . 05. The standardized regression coefficients were significant for only psychological distress (B = −.08, p < . 05).
Discussion
Using nationally representative data from the 2014 Health Center Patient Survey large epidemiological study of patients receiving services from community health centers, the purpose of this study was to examine validity and reliability of the K6 with a nationally represented clinical sample of individuals with various mental health disorders. We first examined psychometric properties of the K6 in groups with panic disorder, GAD, bipolar disorder, and schizophrenia. Second, we examined the interrelationships between psychological distress, distress interference, ADL impairment, IADL impairment, and health status. Finally, we explored whether psychological distress was uniquely associated with health status even after controlling demographic covariates in each subgroup of psychiatric disorders.
Our EFA and CFA findings have confirmed that the K6 is a unidimensional measure of psychological distress in panic disorder, GAD, bipolar disorder, and schzophrenia. In each mental illness subgroup, the one-factor CFA model required modifications to the factor structure of the K6 (i.e., correlated residuals between a pair of items in each sample) to achieve adequate fit. The required modifications were different in these four samples. This can be partially due to differences in the symptomatology presenting by patients within these subgroups. Overall, CFA findings revealed that unidimensional structure provided a very good fit across all fit statistics for the K6 data in our sample. Consistent with previous research, the K6 measures the non-specific psychological distress as a unidimensional construct in individuals with mental disorders (Ferro, 2019; Kessler et al., 2010; Mewton et al., 2016; Mitchell & Beals, 2011; Stolk et al., 2014; Sunderland et al., 2012). The scale has also demonstrated high internal consistency across clinical samples (ranging from .86 to .87), which is similar to previous research findings (Ferro, 2019; Kessler et al., 2003; Staples et al., 2019).
In contrast, previous research with clinical samples has argued that the K6 captures a two-factor model of psychological distress with all items loading on two correlated first-order factors representing depression and anxiety (Arnaud et al., 2010; Ko & Harrington, 2016). For instance, Ko and Harrington (2016) tested the factor structure and utility of the K6 scale for individuals with suicidal ideation. Their results revealed that the one-factor model, the two-factor model, and the higher-order two-factor model solutions fit the data well. Arnaud et al. (2010) tested the factor structure of both the K6 and K10 in individuals with alcohol use disorders. Their results demonstrated that K6 and K10 are each multidimensional measures of psychological distress in people with alcohol use disorders. These findings indicate that participants across different clinical populations may experience, evaluate, and perform quite differently with respect to measures of psychological distress. Besides, individuals across mental disorders may experience different levels of symptoms and psychological distress that change their responses to items, which ultimately cause differences in variances and factor structures.
We also explored concurrent validity of the scale by analyzing relationships between psychological distress, distress interference, functioning, and perceived health status. Results revealed that individuals with high scores on the K6 endorsed greater levels of distress interference and functional limitations, and worse overall health status, indicating an acceptable level of concurrent validity of the scale. Previous research reported that psychological distress was positively correlated with functional impairment (Fang et al., 2001; Kessler et al., 2003) and had adverse effects on health-related quality of life (Keles et al., 2007), which are consistent with our findings. It is important to note that the correlation coefficient between distress and distress interference was relatively higher compare with correlation coefficients between distress and other variables such as health status. Our distress interference item measures how much these feelings (asked in K6) interfere with participants life or activities. We believe this is due to the proximity of items measuring distress and distress interference.
In addition, we examined incremental validity of the scale by testing whether psychological distress was associated with overall health status after controlling demographic variables. Multiple regression analyses results demonstrated that psychological distress significantly predicted overall health status even after controlling demographic variables in all subgroups, indicating some evidence for incremental validity of the K6. Mitchell and Beals (2011) examined the incremental validity of the K6 by examining the relationship between K6 and physical and mental health status. Their results revealed that K6 significantly predicted participants physical and mental health status even after controlling demographic variables (Mitchell & Beals, 2011). Although our findings revealed that psychological distress significantly associated with overall health status even after controlling demographic variables in all subgroups, our regression coefficients were small, meaning that psychological distress is related to health status in all subgroups but this relathinship effect size is relatively small after adjusting for demographic variables. It is also important to note that we did not have a variable measuring symptom severity for each mental illness so that it is unclear whether psychological distress would be associated with health status if we used demographic variables and symptom severity as adjusting variables.
Researchers reported that K6 is a brief and psychometrically sound scale to assess serious mental illness in the general population (e.g., Kessler et al., 2003). With our findings, we may conclude that the K6 is a valuable and psychometrically sound scale to use in rehabilitation research and clinical practice. Given it is important to measure psychological distress among people with psychiatric disabilities, rehabilitation and mental health practitioners and researchers who work with individuals with psychiatric disabilities could consider using the K6 as a brief tool to measure psychological distress. Mesuring psychological distress in people with psychiatric disabilities may help clinicians and researchers understand how psychological distress are related to successful clinical outcomes. Given it is easy to administer, this scale could provide a meaningful and useful clinical information on psychological distress to clinicians and researchers working with those with psychiatric conditions.
While this study has notable strengths, there are some limitations which should be acknowledged. First, this study only focused on individuals with panic disorder, GAD, bipolar disorder, and schizophrenia due to the restrictions of the data set. Therefore, our results cannot be generalized to the all mental health disorders. Second, mental health disorders are self-reported so that there may be error in self-report such as not reporting the presence of mental illness potentially due to social bias. In addition, it is important to note that self-diagnoses (e.g., schizophrenia) were not confirmed via clinical interview and/or record review. Third, we did not evaluate determined cutoff scores. Thus, as an excellent psychometric characteristic of the K6 to monitor the severity of individuals’ distress beyond mental diagnosis (e.g., health status) was proved, the relevant clinical indicators of difference were not established. It is also important to note that some of our consturcts were measured via single item. Given the complexity of variables such as health status, future studies may consider measuring variables with a psychometrically sound scale that has multiple items. Finally, our design was not capable of evaluating the causal mechanisms that underlie the explored relationships. Future studies should utilize longitudinal designs to explore the temporal associations of these variables.
Overall, the K6 is brief, reliable, and valid psychological distress tool that can be used by mental health, rehabilitation, and health clinicians and researchers to screen and monitor symptoms of distress and intervene when appropriate. The K6 scale may provide significant clinical information regarding how psychological distress affects overall health status and daily functioning in clinical populations. By using the K6 scale, clinicians can screen not only distress onset, exacerbation, reduction, or remission (Ko & Harrington, 2016; Lace et al., 2018; Staples et al., 2019), but also the potential interrelated impact of mental health symptoms and disorders on everyday life and general health status.
Footnotes
Declaration of Conflicting Interests
The author(s) declared no potential conflicts of interest with respect to the research, authorship, and/or publication of this article.
Funding
The author(s) received no financial support for the research, authorship, and/or publication of this article.