
Abstract
It is with increasing importance that mathematics education research considers the role of noncognitive motivation variables alongside elements of the classroom context in investigations of student mathematics performance. This study uses a hierarchical linear modeling framework to predict mathematics achievement from three classroom variables, project-based learning, group collaboration, and student-driven curriculum, and two noncognitive factors, mathematics anxiety and mathematics self-concept, utilizing data from the 2012 Programme for International Student Assessment (PISA) United States sample. Findings suggest that mathematics classroom contexts that are student-driven and integrate project-based learning positively impact mathematics achievement, and that both mathematics anxiety and mathematics self-concept contribute significantly towards explaining variation in mathematics achievement after accounting for gender, race, socioeconomic status, truancy, and school-level poverty.
Keywords
Introduction
Longitudinal studies of mathematics education have found that students' mathematics motivation tends to decrease as students progress through school, particularly in regards to mathematics self-concept, utility value, and interest (Fredricks and Eccles, 2002; Jacobs et al., 2002; Nagy et al., 2010; Petersen and Hyde, 2017; Watt, 2004). Mathematics performance has been identified as a significant contributor to the developmental declines to students' motivation in mathematics (Gottfried et al., 2007). One explanation for this is that as content becomes more challenging, students may conclude that they are not interested in mathematics or that it is not important as a means of protecting their self-esteem (Fredricks and Eccles, 2002).
Theoretical self-regulation models postulate that a person's self-motivational beliefs impact the degree to which he or she chooses to employ self-regulatory strategies during learning (Eccles and Wigfield, 2002; Zimmerman, 2000). Self-concept of ability, expectancy of success, and value have been found to predict a number of outcomes in mathematics including course grades and standardized test scores (Parker et al., 2012; Simpkins et al., 2006; Watt et al., 2012). Achievement motivation literature places an individual's perception of academic competence as central to his or her motivation and performance in achievement settings. According to the expectancy-value theory of mathematics achievement (Eccles and Wigfield, 2002), the values that individuals hold about mathematics and their expectancies of success are what most strongly predict mathematics achievement. This theory asserts that mathematics self-concept predicts expectancy for future mathematics success (Frome and Eccles, 1998), and that both mathematics self-concept and expectancy predict value of mathematics (Jacobs et al., 2002). Not only does self-concept underlie expectations for success and failure and other important noncognitive motivation constructs, but it also has important implications for student behavior in mathematics achievement contexts, such as students' willingness to approach difficult tasks (Stipek et al., 1998). Mathematics self-concept is a strong predictor of achievement (Denissen et al., 2007; Marsh et al., 2005), and students with low mathematics self-concept are less likely to perform well on mathematics tasks and assessments (Crombie et al., 2005; Meece et al., 1990; Watt et al., 2012).
Mathematics anxiety refers to a state of discomfort that arises in response to performing mathematical tasks (Ma and Xu, 2004). Mathematics anxiety is considered as a distinct construct (Ashcraft and Ridley, 2005) that has an affective component, which concerns tension or nervousness associated with negative psychological reactions felt in evaluative contexts, and a cognitive component, which describes concerns about performance (Dowker et al., 2016; Wigfield and Meece, 1988). Mathematics anxiety has been found negatively to correlate with mathematics performance (Carey et al., 2016; Hembree, 1990; Ma, 1999), and students with mathematics anxiety are more likely to develop negative attitudes toward the discipline and demonstrate avoidance behaviors such as dropping out of or not taking mathematics courses (Ashcraft, 2002; Ma, 1999).
Teachers play a critical role in students' development of competency beliefs (Diemer et al., 2016; Eccles, 1994). Engagement and academic motivation research has identified authentic instruction, autonomy support, and collaboration promotion as key aspects of the learning environment that are central to students' mathematics achievement (Cleary and Chen, 2009; Patrick et al., 2011; Wigfield et al., 2006). Teachers who provide a classroom climate in which students are encouraged to express their opinions provide the type of socio-emotional support students require to engage with and persist in challenging tasks (Wang, 2012; Wigfield et al., 2006). Classroom norms and routines and teachers' practices contribute to students' perceptions of what constitutes success and the purposes for engaging in academic tasks (Patrick et al., 2011). Students are more likely to engage in maladaptive motivational behaviors (e.g. poor persistence and effort) when their competency beliefs are predominantly based upon the performance of their peers (Cleary and Chen, 2009; Zimmerman, 2000).
The teacher is often seen within the classroom as the source of information and authority (Oyler, 1996). Contextual changes to the way in which mathematics is introduced, as well as allowing students to influence the classroom discourse can positively alter students' perceptions of mathematics and their decisions for learning (Dunleavy, 2015; Franke et al., 2015). The delegation of authority to students, that is “the degree to which students are given opportunities to be involved in decision making and whether they have a say in establishing priorities in task completion, method, or pace of learning” (Gresalfi and Cobb, 2006) provides dialogical settings in which students can actively question the authority of knowledge and process of learning itself, facilitating the discovery and development of their own strengths (Dunleavy, 2015). Tan et al. (2012) advocate for practitioners to enter a transformative third space with students, where students' knowledge and experiences are validated and used in conjunction with traditional approaches. Through meaningful discourse, students can strengthen their procedural knowledge, become more creative and independent thinkers (Mercer, 2008), and develop deeper understandings of the mathematics (Cobb et al., 1992). Additionally, in the process of formulating an idea and then sharing it with others, students are able to recognize their own contradictions or errors in their reasoning more so than if they were expressing an idea to themselves alone (Whitebread et al., 2007).
Students are more engaged when teachers use instructional approaches that promote experimentation and real life contexts (Boaler, 2006; Schoenfeld, 2002). Takeuchi (2015) asserts that learning should take place and be understood in relation to relevant, surrounding contexts from which students should not be separated. Project-based learning (PBL) places high value on group learning and joint achievement (Wurdinger, 2016). It is considered to lead to meaningful learning experiences for students (Wurdinger et al., 2007) and has the potential to enhance both students' motivation and their academic performance (Barron et al., 1998; Liu and Hsiao, 2002). PBL is distinguished by the features of collaboration, communication, reflection, student autonomy, and constructive investigations within real-world practices. A primary component of PBL is that students work together to produce an end product that serves as the vehicle for students' demonstration of knowledge in response to the driving problem or question. The process of completing a project promotes problem-solving, creativity, self-direction, work ethic, and time management (Wurdinger, 2016). Authentic questions and problems that stem from within real-world practices provide the learning context (Al-Balushi and Al-Aamri, 2014) from which students can design and conduct investigations; gather, analyze, and interpret data; draw conclusions; and report their findings. Often developed under the guidance of a teacher, the project brings together both learning skills and academic content while simultaneously nurturing students' individuality, creativity, expression, and choice, emphasizing student-centered approaches to teaching and learning. In PBL, students move through the cognitively demanding process of identifying the problem, developing a plan, testing the plan against reality, and reflecting on results (Wurdinger, 2016). Completing a project usually entails multiple trial and error attempts as students work together to overcome the frequent challenges encountered throughout the process. The deliberate process of inquiry inherent to project work provides students with active, experiential learning opportunities as they work together to achieve a shared goal.
Purpose of study
Prior educational research has identified various demographic characteristics that can be attributed to explaining observed differences in mathematics achievement, such as race (Diemer et al., 2016; Harris and Herrington, 2006; Martinez, 2017), socioeconomic status (SES) (Crosnoe, 2009; Haynes et al., 1997; Langenkamp and Carbonaro, 2018; Palardy et al., 2015), and gender (Doolittle, 1989; Entwisle et al., 1994; Fryer and Levitt, 2010; Lee et al., 2011; Reardon et al., 2018). Beyond these demographic characteristics, research has investigated the effects of noncognitive factors on achievement, such as mathematics anxiety (Carey et al., 2016; Hembree, 1990; Ma, 1999) and self-efficacy (Zimmerman and Kitsantas, 2005), as well as mathematics teacher practices on mathematics performance. As mathematical education research continues to expand, there is an increasing need for research that brings together these noncognitive attributes with elements of students' classroom experience in investigations of mathematics performance. This study seeks to add to the existing literature on the positive effects of PBL (Barron et al., 1998; Boaler, 2001; Heyl, 2008; Liu and Hsiao, 2002; Newell, 2003), group collaboration (Boaler, 2001; Marshman and Brown, 2014; Moss and Beatty, 2010), and student-driven curricula (Dunleavy, 2015; Gresalfi and Cobb, 2006) on student mathematics achievement.
In order to investigate the impacts of student-driven, collaborative, and project-based forms of instruction on students' mathematics achievement, this study uses data from the Programme for International Student Assessment (PISA) 2012 United States sample to answer the following research questions:
1) To what extent is mathematics anxiety and mathematics self-concept associated with students' mathematics achievement? 2) To what extent does PBL, group collaboration, and student-driven curriculum predict students' mathematics achievement after accounting for students' mathematics anxiety and mathematics self-concept?
This study draws from literature on the achievement motivation and mathematics learning contexts as a guide for developing the following predictions. First, it is hypothesized that mathematics self-concept will be positively associated with mathematics achievement, and that mathematics anxiety will be negatively associated with mathematics achievement, as measured by the PISA 2012 Student Assessment. Second, it is hypothesized that the practices of interest to this study (PBL, group collaboration, and student-driven curriculum) will positively predict students' mathematics achievement.
Method
To investigate the effect of three teacher practices and two noncognitive variables on mathematics achievement, hierarchical linear modeling (HLM) analyses were conducted on 2012 PISA United States student and school data. HLM enables variable relationships occurring at the student level (level 1), school level (level 2), as well as across both levels. As students are nested within schools, HLM was utilized to account for this nesting and to investigate relationships among the level 1 and 2 variables.
PISA 2012 data
PISA is a trienniel international survey that assesses the knowledge and skills of 15-year-old students in order to evaluate education systems wordwide. PISA 2012 was conducted across 65 participating countries and economies, utilizing a two-stage stratified sample design. Level 2 sampling occurs with all eligible schools, with probability for selection proportional to size of school. Level 1 sampling within each school is random, with equal probabilities for each student. Approximately 35 students were selected per school. PISA 2012 assessed reading, mathematics, science, and problem-solving with a primary focus in mathematics for over 500,000 students.
A total of 4978 students from 162 schools formed the US subsample of the PISA 2012 data. PISA 2012 employed a rotated design for both the student assessment and student context questionnaires. Each student context questionnaire contained a common set of questions with largely demographic information and a rotated portion administered to one-third of students. The rotated portion contained questions about noncognitive and attitudinal constructs. Context questionnaire design was such that each construct was present on two of the three rotated forms resulting in approximately two-thirds of sampled students being asked about any given construct (see Organization of Economic Cooperation and Development, 2013 for a detailed explanation of how context questionnaires were developed).
Data preparation
Data were taken from the PISA 2012 Student Assessment, PISA 2012 Student Questionnaire, and PISA 2012 School Questionnaire. The Student Assessment contained mathematics assessment items, and the student questionnaire contained items on student attitudes toward mathematics, attitudes toward school, as well as demographic and family background information. The raw data of test and survey items used as outcome and independent variables, respectively, were downloaded from the National Center for Education Statistics (NCES) website. The independent variables included (a) survey items probing students' perceptions of their abilities and anxieties of mathematics; (b) survey items probing students about their mathematics lessons; (c) indices of parental education, parental occupation and number of home possessions; (d) index of student gender; (e) index of student race; (f) survey items probing students about their recent school and class attendance; and (g) schools' percentage of students on free or reduced-priced lunch. The outcome variable included students' mathematics performance on the 2012 PISA Student Assessment.
This study's analytic sample consists of 2801 students from 160 schools from the PISA 2012 United States data. It should be noted that while the differences between the analytic and full sample are minimal (see Table 1 for mean and standard deviation comparisons between the full and analytic sample), missing data introduce potential sample selection bias and findings from this study should be interpreted with caution.
Measures
Outcome variable
Mathematics performance
The PISA 2012 mathematics performance reflected students' achievement across four content categories: change and relationships, space and shape, quantity, and uncertainty and data, and three process categories: formulating situations mathematically; employing mathematical concepts, facts, procedures, and reasoning; and interpreting, applying, and evaluating mathematical outcomes (Organization of Economic Cooperation and Development, 2013). The mathematics portion of the paper-based assessment was comprised of 110 items. Mathematics assessment sampling design employed by PISA is such that students are given a subset of the total test items. Student performance is measured using their responses to their assigned subset questions and estimating test performance with five plausible values. The plausible values represent random elements and the variation within that could be attributed to each student from the set of scores and are representative at the individual student level. PISA 2012 estimates five plausible values for each content and process category as well as five plausible values for overall mathematics achievement. This study uses the overall mathematics achievement plausible values. The five plausible values were analyzed collectively as the dependent variable for all models. When conducting model fit comparisons, a mean value of the five plausible values was utilized for the outcome variable, as no deviance or log likelihood is reported during a plausible value analysis in HLM.
Contextual variables
Student beliefs
Survey Predictor Item Scales for Mathematics Self-Concept and Mathematics Anxiety
Descriptive statistics.
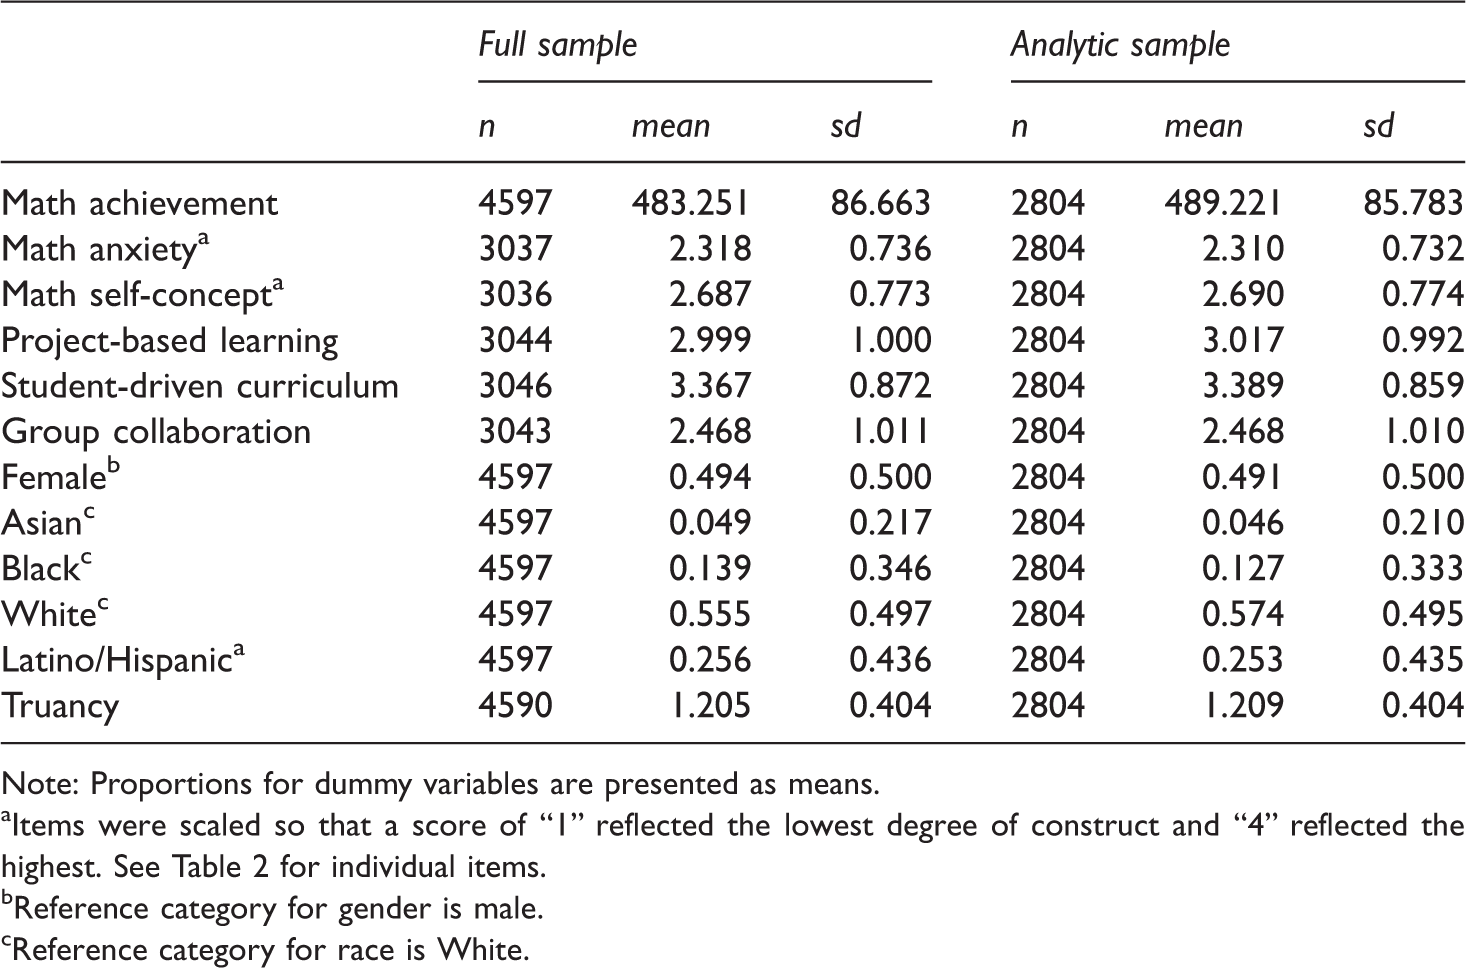
Note: Proportions for dummy variables are presented as means.
Items were scaled so that a score of “1” reflected the lowest degree of construct and “4” reflected the highest. See Table 2 for individual items.
Reference category for gender is male.
Reference category for race is White.
Statements on PISA 2012 Student Questionnaire for items comprising the Mathematics Self-concept and Mathematics Anxiety scales.
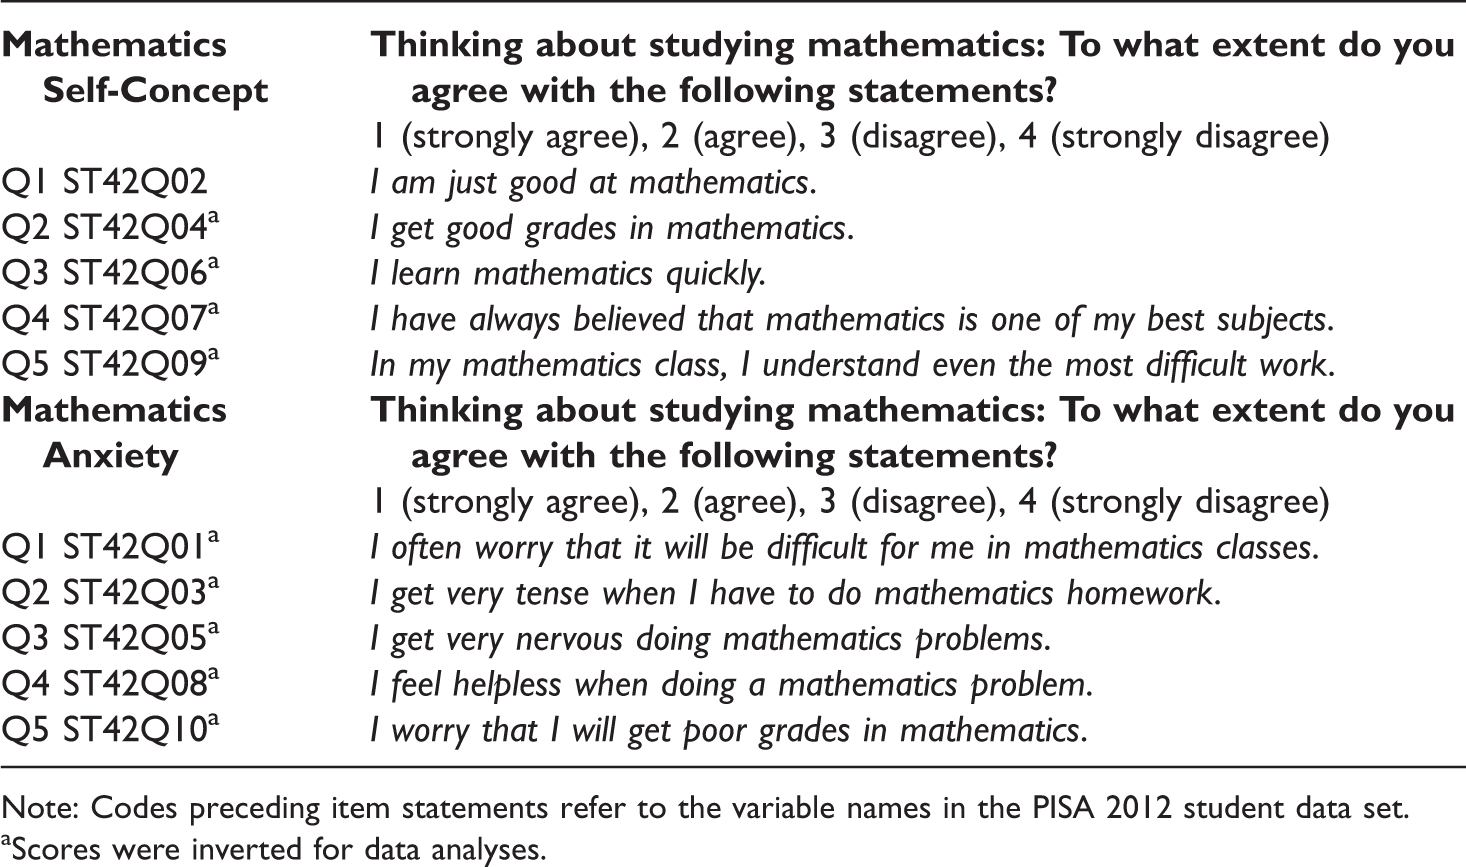
Note: Codes preceding item statements refer to the variable names in the PISA 2012 student data set.
Scores were inverted for data analyses.
Mathematics self-concept
Students were asked to read and respond to five statements such as “I learn mathematics quickly”, from “1” to “4,” “1” (strongly agree), “2” (agree), “3” (disagree), and “4” (strongly disagree). Items were scaled so that a score of “1” reflected the lowest possible degree of self-concept and a “4” reflected the highest. A mean value of the five items was then calculated to create a single mathematics self-concept variable.
Mathematics anxiety
Students were asked to read and rank five statements such as “I get very nervous doing mathematics problems” from “1” to “4,” “1” (strongly agree), “2” (agree), “3” (disagree), and “4” (strongly disagree). Items were scaled so that a score of “1” reflected the lowest possible degree of anxiety and a “4” reflected the highest. A mean value of the five items was then computed to create a single mathematics anxiety variable.
Teacher practices
Question 49 on the Student Questionnaire asks students to read and respond to a series of statements regarding the teaching practices that take place in their mathematics classroom (e.g. the teacher sets clear goals for our learning) from “1” to “4,” “1” (every lesson), “2” (most lessons), “3” (some lessons), and “4” (never or hardly ever). This study utilized three items from Q49 that were applicable to the three teaching practices of interest. Each item was re-coded such that a score of “1” reflected the lowest frequency of occurrence and a score of “4” reflected the highest.
PBL
The PBL variable was operationalized using the item “the teacher assigns projects that require at least one week to complete.”
Group collaboration
The group collaboration variable was operationalized using the item “the teacher has us work in small groups to come up with joint solutions to a problem or task.”
Student-driven curriculum
The student-driven curriculum variable was operationalized using the item “the teacher asks us to help plan classroom activities or topics.”
Control variables
Gender
Gender was included as one control for demographic characteristics of participants. Gender was coded 1 for females and 0 for males.
Race
Students' race/ethnicity (termed “race” in this study) is derived and reported by the NCES from two survey items of the US version of the PISA 2012 Student Questionnaire. Data report students as “White,” “Black or African American,” “Hispanic,” “Asian,” “Multiracial,” or “Other.” “Multiracial” and “Other” were dropped from this analysis due to the ambiguity of the categorization and limited sample size. The other four ethnic groups are henceforth referred to in this study as “White,” “Black,” “Hispanic/Latino,” 1 and “Asian.” White served as the reference race in this analysis. See Table 1 for proportion of sample for each race.
SES
The SES predictor was comprised from three PISA-derived factors: students' highest parental education, highest parental occupation, and number of home possessions. A confirmatory factor analysis derived the SES variable, with factor loadings of 0.74 for highest parental education, 0.75 for highest parental occupation, and 0.57 for number of home possessions. SES was standardized (M = 0, SD = 1) across all participants.
Truancy
Student truancy was included to control for student absence from school/class. Students were asked to respond to three questions about their attendance habits (arriving late, skipping the school day, and skipping classes) in the preceding two weeks. Answers were reported on a four-point scale: “1” (none), “2” (one or two times), “3” (three or four times), and “4” (five or more times). A single truancy variable was calculated by averaging the individual truancy question responses pertaining to skipping class and skipping school. Arriving late was omitted because school tardiness does not usually equate to absence from an entire class. Scale reliability for truancy was
School poverty
Percentage of students receiving free or reduced-priced lunch is used as a proxy for school poverty. One item on the US School Questionnaire asks the school principal to report the percentage of students receiving free or reduced-priced lunch. PISA reports a school's percentage of students receiving free or reduced-priced lunch on a five-point scale: “1” ( < 10%), “2” (≥10% but < 25%), “3” (≥25% but < 50%), “4” (≥50% but < 75%), and “5” (≥75% to 100%). The school poverty variable was grand-mean centered.
Analysis
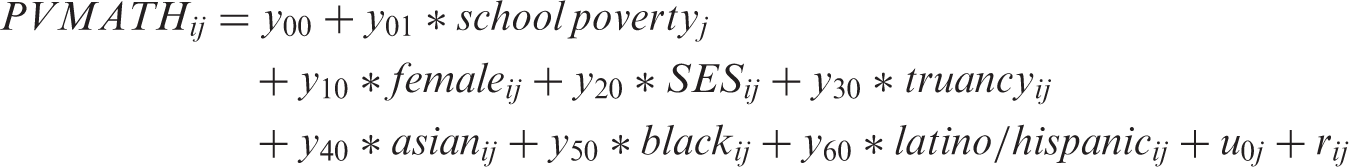
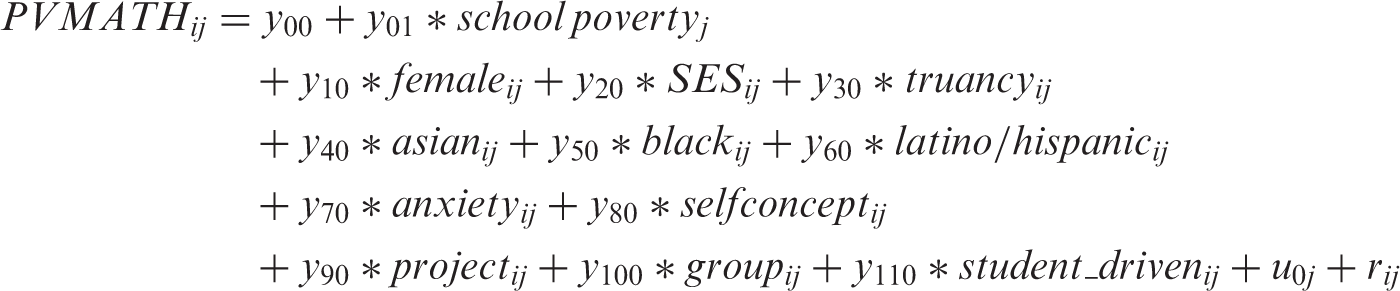
To determine whether students' mathematics anxiety, mathematics self-concept, and exposure to three teaching practices predict mathematics performance over and above the variability explained by SES, gender, race, truancy, and school poverty, three models were investigated in HLM using HLM7 and R statistical software version 3.4.3 (R Core Team, 2017). All models include a random intercept which allows overall mathematics achievement to vary across schools j.

Results
Descriptive statistics
Table 1 presents the means and standard deviations of all variables with the exception of SES and school poverty which were centered and therefore excluded. For the analytic sample, the values of SES ranged from −3.26 to 1.96. School poverty ranged from −1.26 to 1.74 (SD = 1.27). The proportion of females in the sample was 0.49. Students identifying as Asian, Black, or Latino/Hispanic comprised approximately 5, 13, and 25% of the sample, respectively, with White comprising the remaining 56%.
Bivariate analysis
Correlations among math achievement, gender, race, SES, truancy, and contextual predictors.
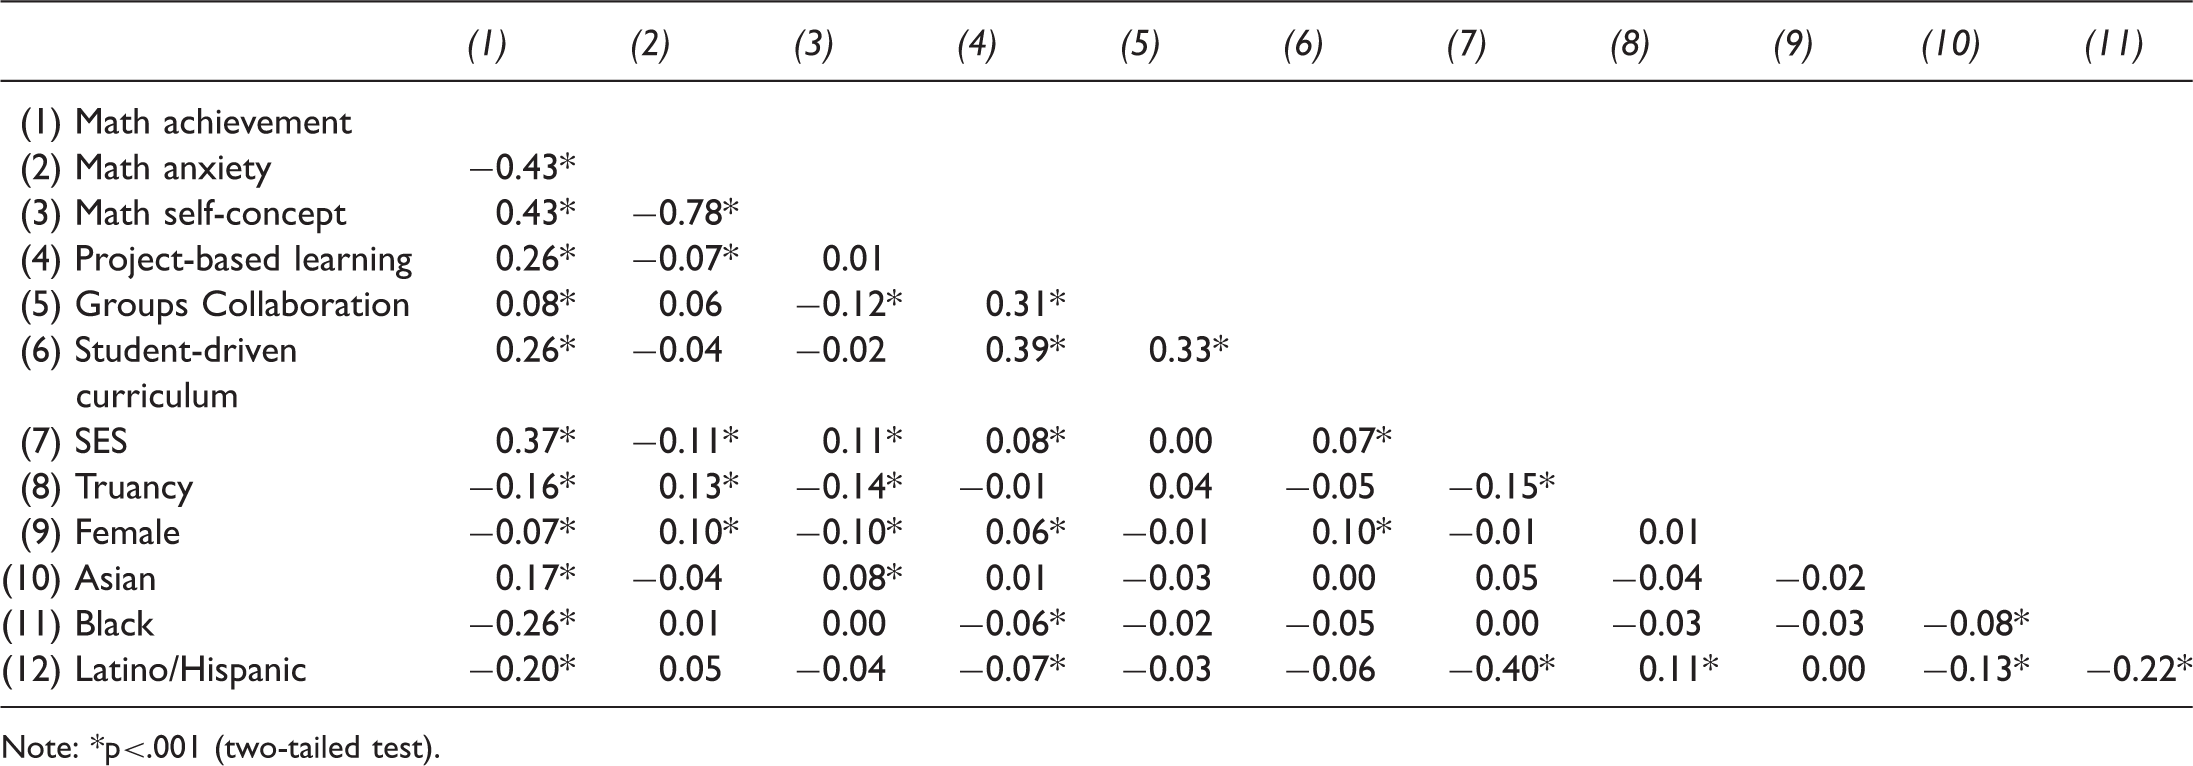
Note: *p<.001 (two-tailed test).
Results of two-level HLM.
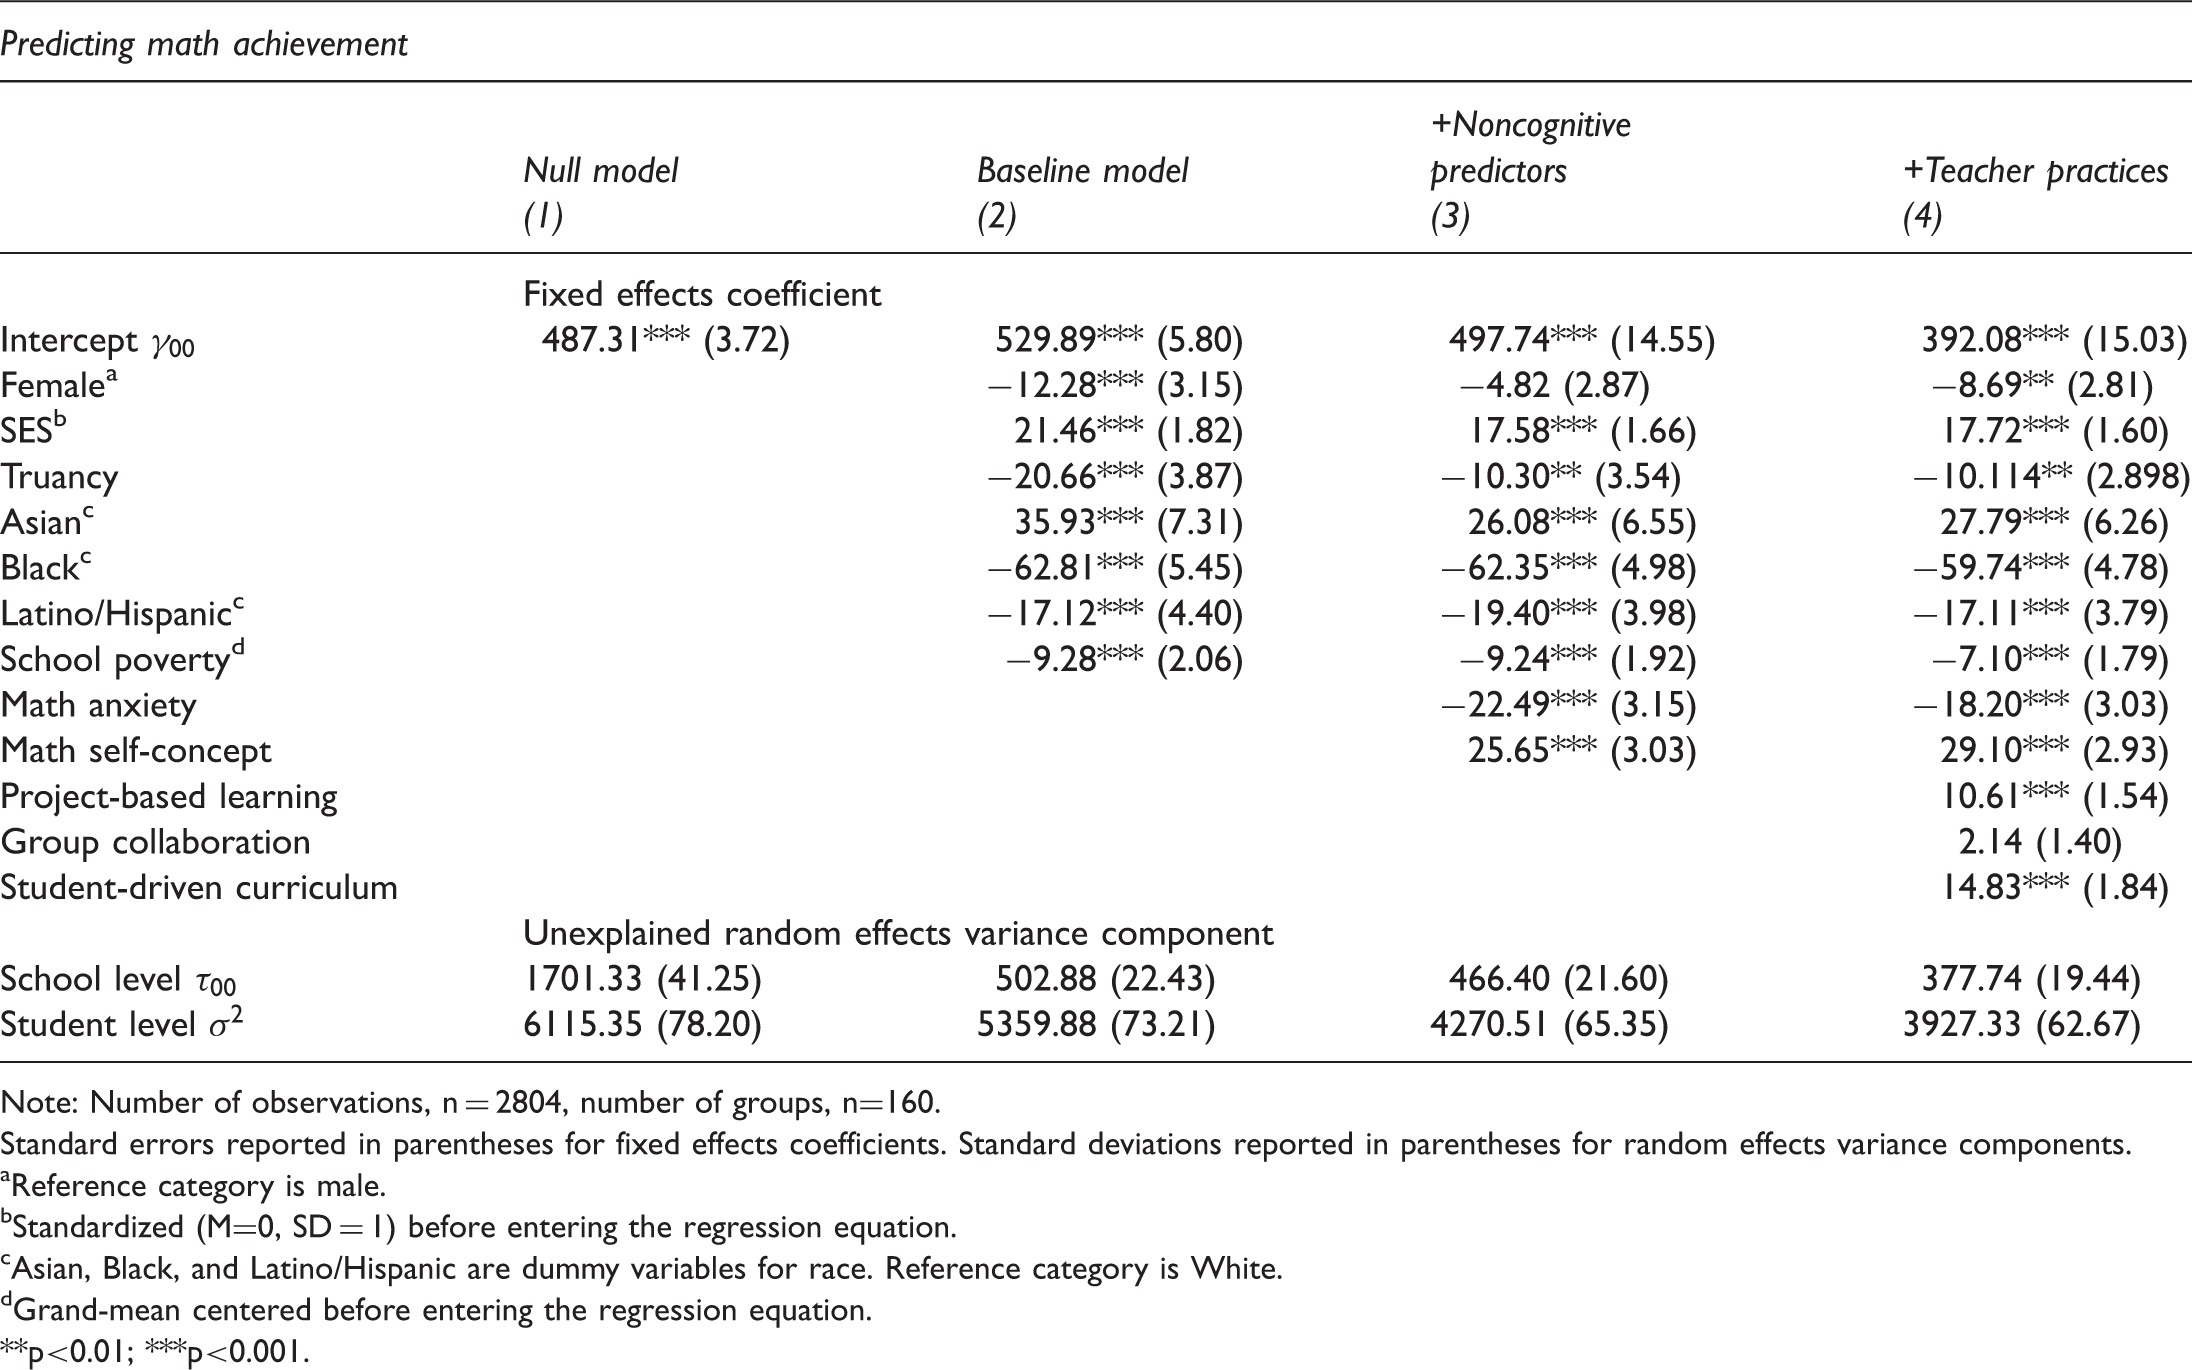
Note: Number of observations, n = 2804, number of groups, n=160.
Standard errors reported in parentheses for fixed effects coefficients. Standard deviations reported in parentheses for random effects variance components.
Reference category is male.
Standardized (M=0, SD = 1) before entering the regression equation.
Asian, Black, and Latino/Hispanic are dummy variables for race. Reference category is White.
Grand-mean centered before entering the regression equation.
**p<0.01; ***p<0.001.
An examination of the correlations between the independent variables showed a strong negative association between mathematics anxiety and mathematics self-concept, r = 0.78. Moderate positive correlations (0.30 < r < 0.40) existed between all three of the teaching practices, suggesting that higher scores with one teaching practice likely resulted in higher scores in the other two (and vice versa). Additionally a moderate negative correlation (r = −0.40) was observed between SES and race; Latino/Hispanic students were more likely to have a lower SES score than White students. All remaining significant correlations were weak (
Multilevel analysis
Table 4 presents the HLM results for each of the four models. The reliability for the null model was 0.80 indicating consistent and reliably different school mathematics achievement means. Approximately 21.8% (p<.001) of the observed differences in overall mathematics achievement were due to between-school variability. The observed multilevel nature of the data provides a rationale for the use of HLM to estimate additional models.
The baseline model (Model 2) accounted for 32.67% of the total variability observed by the null model. The inclusion of gender, race, SES, truancy, and school poverty reduced 70% of the between-school variability, and all independent variables were determined to be significant (p<.001) in predicting mathematics achievement. The negative coefficients for gender and the race categories Black and Latino/Hispanic indicated that after controlling for student truancy, SES, school poverty, and race, girls performed worse than boys, and that Black and Latino/Hispanic students achieved at lower levels than White students.
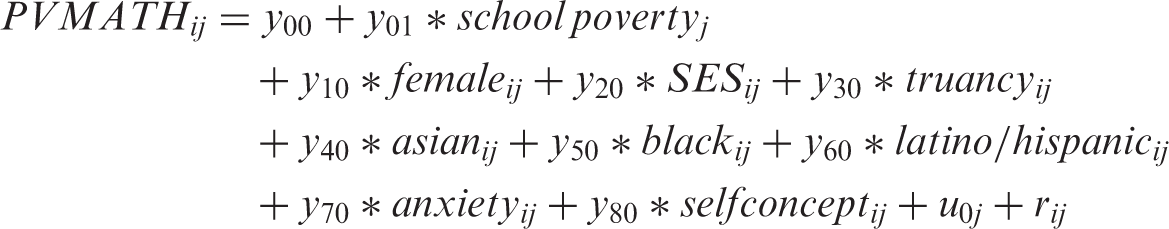
The addition of the mathematics anxiety and mathematics self-concept predictors (Model 3) explained 39.40% of the total variability in mathematics performance compared with the null model. Once student mathematics anxiety and self-concept were controlled for, the effect of gender on mathematics achievement became nonsignificant (p=.096), consistent with prior findings (Cheema and Galluzzo, 2013). Both mathematics anxiety and mathematics self-concept were strong predictors of achievement, despite the strong correlation between the two. After controlling for race, gender, SES, and school poverty, a one-point increase in mathematics anxiety predicted a 22.5-point decrease in performance, whereas a one-point increase to mathematics self-concept predicted a 25.7-point increase in performance. While still significant, the effects of truancy and SES on achievement decreased.
Model fit comparisons.
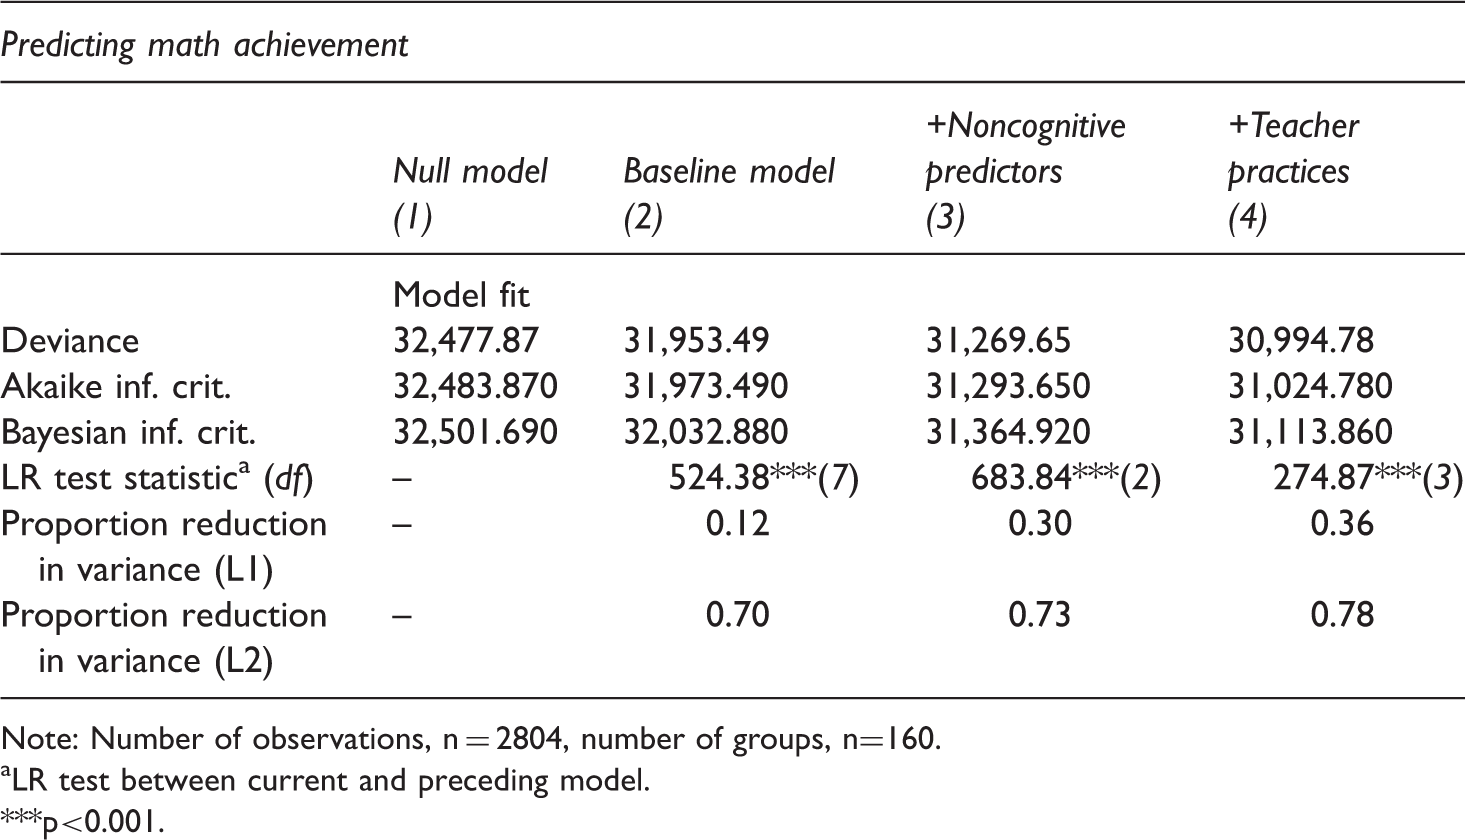
Note: Number of observations, n = 2804, number of groups, n=160.
LR test between current and preceding model.
***p<0.001.
Discussion
When seeking to understand and address the developmental declines to mathematics performance and motivation (Blackwell et al., 2007; Fredricks and Eccles, 2002; Priess-Groben and Hyde, 2017), it is important to consider both students' relationship with mathematics and aspects of the learning context. The primary objective of this study was to investigate the effects of three teacher practices on mathematics achievement after considering students' mathematics anxiety, mathematics self-concept, and other demographic characteristics that prior research has established to be significant in explaining variation in mathematics achievement. Findings suggest that mathematical learning contexts that are project based, collaborative, and student driven support students' mathematics achievement. Two of the three teacher practices—PBL and student-driven curriculum—positively predicted mathematics achievement after accounting for student mathematics anxiety, mathematics self-concept, and the control predictors of student SES, race, gender, student truancy, and school-level poverty. Furthermore, when investigated individually from the others, all three teaching practices positively predicted mathematics scores.
The observed gender differences in mathematics achievement in the baseline model became nonsignificant after the inclusion of students' mathematics anxiety and mathematics self-concept, suggesting that achievement differences between male and female students may be at least partially explained by these noncognitive factors. In comparison with girls, boys frequently report higher perceived mathematics ability (Crombie et al., 2005; Meece et al., 1990; Watt, 2004) and lower mathematics anxiety (Devine et al., 2012; Else-Quest et al., 2010; Hill et al., 2016). The differences in mathematics scores between boys and girls returned, however, once the three teacher practices were introduced to the estimation model. This indicates a need to investigate if and how PBL, group collaboration, and student-driven curriculum mediate the relationship between gender and mathematics performance.
Results indicated a persistent racial disparity in mathematics achievement consistent with established research (e.g. Diemer et al., 2016). After controlling for SES, school poverty, mathematics anxiety, mathematics self-concept, and the three teaching practices of interest, both Black and Latino/Hispanic students' mathematics scores are expected to be, on average, significantly lower than those of White students. In other words, a Black or Latino/Hispanic student of average SES, attending a school of average school poverty, with zero mathematics anxiety, zero mathematics self-concept, and no exposure to the three teacher practices, is expected to score significantly lower in mathematics achievement when compared to a White student with similar characteristics. Additionally, White students are expected to perform significantly worse than Asian students, all other predictors (e.g. SES, anxiety) being equal.
Implications and suggestions for future research
The three teacher practices (PBL, group collaboration, and student-driven curriculum) together explained a significant amount of the observed total variation in mathematics achievement above and beyond that of mathematics anxiety, mathematics self-concept, student truancy, school poverty, and the demographic factors of gender, SES, and race. These findings make a powerful implication regarding the impact of these practices on students' mathematics experiences in school. Knowledge building requires multiple voices and perspectives in order to break new ground and produce new knowledge. Allowing students to work collectively to contribute ideas to their continuously evolving understanding of content fosters varied forms of intellectual efforts from diverse populations of students. Contextual changes to the way in which content is introduced, as well as allowing students to influence the classroom discourse can positively alter students' perceptions of and decisions for learning.
While students' goal orientations are neither operationalized nor explicitly investigated in this study, the positive effects of PBL, group collaboration, and student-driven curriculum on achievement observed in this study can be explained in part by students' goal orientations. Motivation theorists distinguish between mastery and performance orientation goals in achievement contexts (Ames, 1992; Elliott and Dweck, 1988; Grant and Dweck, 2003; Hulleman et al., 2008; Nicholls et al., 1989; Pintrich, 2003; Priess-Groben and Hyde, 2017; Stipek et al., 1998). Individuals who subscribe to mastery goals tend to attribute failure or poor performance to inadequate effort, whereas those who subscribe to performance goals tend to attribute failure or poor performance to a deficiency in ability. Maladaptive responses to failure or academic setbacks (e.g. experiencing negative emotions, avoiding challenge, blaming low ability, loss of interest) would suggest an individual is guided by a performance goal (i.e. is focused on validating or demonstrating his or her competence) in that particular achievement context. Contrarily, a person that demonstrates adaptive behaviors in response to setbacks (e.g. remains optimistic, monitors progress, employs a variety of problem-solving strategies) is more likely focused on increasing competence (i.e. holds a mastery goal). According to Dweck and Leggett (1988) and Grant and Dweck (2003), students with mastery goals apply renewed effort after failure because they hold the belief that effort is constructive, whereas those with performance goals withdraw effort because they believe effort is inefficacious. Consistent positive associations have been found between classroom mastery goal structure and self-efficacy, the use of effective learning strategies, achievement, effort, satisfaction with learning, and positive school-related emotion (see Kaplan and Maehr, 2007 for a review). Stipek's (1998) and Stipek et al.'s (1998) work on students' goal orientations suggests that a mastery goal orientation is supported in learning contexts in which errors and incorrect solutions are viewed as are a helpful part of learning and as part of the process. The TARGET acronym (Patrick et al., 2011) encompasses the collection of practices considered to communicate mastery goals to students: T: tasks that are engaging, meaningful, and challenging, A: students share authority and responsibility for rules and decisions, R: recognition to students based on progress and effort that minimizes social comparison, G: heterogeneous and flexible grouping, E: evaluation interpreted in terms of improvement and effort, and T: flexible time use that provides students opportunities to pace themselves. There is substantial evidence that students' goals in achievement settings predict ability attributions (Ames and Archer, 1988; Grant and Dweck, 2003; Smiley et al., 2016). Expectancy-value theory suggests that achievement goals in a domain are dictated by an individual's perceived expectancy for success in that domain and value or importance of that domain (Wigfield and Eccles, 2000). There exists extensive research that supports this theory, especially in mathematics (e.g. Crombie et al., 2005; Meece et al., 1990). Further research that investigates the relationships between mathematics learning contexts, students' goal orientations, and mathematics performance is needed.
An achievement disparity between Black and White, Latino/Hispanic and White, and Asian and White students in mathematics performance persisted across all analyses, remaining present even after controlling for the effects of SES, truancy, school poverty, mathematics self-concept, mathematics anxiety, and all three teacher practices of interest. The occurrence of a racial difference is important as it further establishes a need for continued research in regards to the ways in which historically marginalized students are engaging with mathematics. While data regarding student achievement in mathematics are crucial in making sense of the larger picture of academic performance of students—especially among those that are underperforming—scholars that rely solely upon achievement data to inform their inquiry often commit to the deficit presuppositions of the achievement gap discourse (Ladson-Billings, 2006; Terry, 2010). The focus of mathematics education must expand to include both sociohistorical and sociocultural contexts in order to better understand the experiences of students (Stinson, 2008). Essentially all leading measures of achievement for mathematics class African American and/or Hispanic/Latino students as “underperforming” (Ladson-Billings, 1997; Lee, 2006; Lubienski, 2002; Rampey et al., 2009). The recognition by researchers and practitioners of race as a factor of the everyday experiences of students can shed light on ways in which authority and power in schools intersect with race in mathematics classrooms (Martin, 2006).
With regard to the effect on mathematics achievement, after race, mathematics self-concept and mathematics anxiety were the two most important predictors of achievement, followed by (in order of greatest predicted effect on achievement), SES, student-driven curriculum, PBL, truancy, gender, and school poverty. There is a need for continued research on teaching practices in the mathematics classroom and their impacts to these noncognitive factors.
Limitations
Data
In the case of the mathematics self-concept, anxiety, truancy, and teacher practice variables, ceiling effects were present. As a result, the range of data is limited for these variables, reducing the statistical power of the correlations between the variables. Furthermore, mathematics anxiety data showed a clustering of scores at the lower level (score of 1 before variable was centered). Additionally the PBL and student-driven curriculum were nonnormal with a left skew. This violated the HLM assumption of normality of variables. The mathematics anxiety variable also had a floor effect in addition to a ceiling effect. Missing data likely introduced some bias to the models as well.
Instrument measure validity
It must be noted this study relied on limited survey items to create variables for student mathematics self-concept, truancy, mathematics anxiety, and teacher practices, there are issues inherent to self-reporting beyond that of response bias. Construct validity can be a substantial limitation. Although mathematics self-concept and anxiety were validated by PISA, the construct for truancy drew from attendance survey items that had a low reliability and may not be a reliable proxy for student truancy.
Assumed homogeneity
The generalizability of a study's findings is limited when researchers attempt to generalize findings to beyond the scope for which their group of participants is representative. In this study, the analysis was such that groups of students were homogenized. This analysis can be problematic when attempting to explain observed differences in achievement as the broad organization of race obscures the diversity that exists within each group. For example, it should not be assumed that a Latino/Hispanic student who is a third-generation American from a middle-class background and a working-class, recent immigrant to the United States share the same levels of attitudinal, ideological, and linguistic characteristics. Thus, the findings of studies that assume homogeneity, particularly in regards to race, should be interpreted with caution and not be used to perpetuate deficit narratives of certain populations of students. Replication with samples that are more diverse in race, age, and geographical location is warranted in order to strengthen the validity of the conclusions drawn in the scope of this study.
Student-reporting of teacher practices
The values for each teacher practice item used in this study were student-reported and reflect the extent to which the student perceived his or her teacher to be implementing each practice. As a result, it is unlikely that the student-reported values perfectly reflect the actual frequency of each practice's occurrence, and therefore this study's findings reflect the relationship between students' perception of their teachers' practices and mathematics performance, and not necessarily the practices themselves. These results should only be used to suggest the possible impacts of these practices on mathematics interest and utility value; continued investigation is necessary.
Footnotes
Declaration of conflicting interests
The author(s) declared no potential conflicts of interest with respect to the research, authorship, and/or publication of this article.
Funding
The author(s) received no financial support for the research, authorship, and/or publication of this article.