
Abstract
A population’s weight conditioned on height reflects its current net nutrition and demonstrates health variation during economic development. This study builds on the use of weight as a measure for current net nutrition and uses a difference-in-decompositions technique as it relates to institutional change to illustrate how Black and White current net nutrition varied with the transition to free-labor. Adult Black age-related weight gain was greater with the transition to free-labor yet was not as large as the adult White age-related weight gain. Agricultural worker’s current net nutrition was better than workers in other occupations, but was worse-off with the transition to free labor. Birth place within the United States had the greatest effect with across and within-group weight changes and the transition to free-labor. Within-group weight variation was greater than across-group variation.
Introduction
When traditional measures for economic welfare are scarce or unreliable, stature and the body mass index (BMI) are now well accepted measures that reflect net nutrition during economic development (Deaton, 2008, 2013). A population’s average stature reflects the cumulative net difference between calories consumed and calories required for work and to withstand the physical environment. BMI is weight in kilograms divided by height in meters squared, and changes in BMI may reflect variation in current net nutrition (Fogel, 1994, p. 375). In both historic and modern samples, BMIs are also used to classify obesity at a point in time. However, because it does not distinguish between sinew, muscle, and fat, BMI is only a crude approximation for obesity (Baum & Rhum, 2009, pp. 635–648; Burkhauser & Cawley, 2008, p. 527). Moreover, interpreting BMI variation is more problematic than interpreting stature variation because BMI variation depends on when privation occurs. For example, a child deprived of nutrition is less likely to reach their genetically pre-determined adult stature (Steckel, 2009, p. 6), their weight is distributed over smaller physical dimensions, and shorter individuals are more likely to be obese in later life. Alternatively, well-fed individuals grow to taller statures, have greater physical space to distribute weight, and have lower adult BMIs. This lagged or mis-matched relationship between BMI and height indicates a complement to BMI for current net nutrition is necessary. On its surface, holding current net nutrition constant, there is a positive relationship between stature and weight because taller statures require body mass, indicating that weight alone is not the only measure that isolates variation in current net nutrition because it depends on height. Moreover, weight is more plastic and responsive to the immediate effects of privation compared to BMI and height, subsequently, better isolates the changes to current net nutrition. A population’s average weight varies when there is an imbalance between calories consumed, physical activity, and the physical environment. Moreover, the 19th-century transition from bound to free labor is among the most important events that influenced the weights of African and European descendants in the United States. The term “bound labor” represents birth during the period of slavery and not that Europeans were subject to slave labor. To isolate how net nutrition varied with economic conditions, this study uses weight after controlling for height, demographic characteristics, and socioeconomic status to illustrate how weights varied with the transition from bound to free-labor. 1 Weight is more plastic and responsive to the immediate effects of privation than BMI and height and varies with the type of calories consumed (Riera-Cricton & Tefft, 2014). Subsequently, weight is used here to evaluate how current net nutrition varied with the institutional change from bound to free-labor.
Given its importance relative to other physical measures, weight has received little attention in historical health studies. Komlos (1987, p. 906) and Coclanis and Komlos (1995) show that the decrease in 19th century weight and heights was geographically widespread, and farmer’s weights were greater than workers in other occupations. Student weights at The Citadel decreased between the 1880s and 1900s and the Southeast was among the poorest geographic regions in the 1880s and 1890s (Coclanis & Komlos, 1995, pp. 104–106). 2 However, these studies are for military recruits, which are exclusive to Whites (Coclanis & Komlos, 1995, p. 93; Ellis, 2004, p. 27; Komlos, 1987; Sokoloff & Villaflor, 1982, pp. 456–458). Farmers had greater weight than workers in other occupations, and height varied across regions. Individuals residing in the South and West had greater weights than individuals living elsewhere.
This study uses Black and White weight as a proxy for net nutrition and the transition to free-labor. The current study contributes to the existing literature in at least three ways. First, how did the sources of Black and White weight variation change with the transition from bound to free-labor? White relative to Black weight increased with the transition to free labor, and White within-group socioeconomic status weight returns increased with the transition. Second, how did Black and White youth and adult weights vary by age with the transition to free-labor? Adult Black age-related weight gain was greater with the transition to free-labor yet was not as large as the adult White age-related weight gain. Third, what were the greatest sources of Black-White weight variation with the transition to free-labor? Nativity had the greatest effect with weight changes with the transition to free-labor, and after controlling for height, Black weights were greater under bound-labor.
The manuscript proceeds as follows. Section “Materials and Methods” reviews the materials and methods used to evaluate current net nutrition and how it varied with the labor market transition from bound to free-labor. Section “Empirical Analysis” presents the empirical results for Black and White weights changed and how sources varied with labor market transformation. Section “Decomposing Black and White Weight for Bound and Free-Labor” presents results for weight variation with the labor market transition. Section “Conclusion” concludes.
Materials and Methods
Data
Military and prison records are the primary sources for historical weight and height data. Military records provide the largest source of recorded heights; however, because military participation likely reflects conditions among the upper class, military weight records probably reflects current net nutrition among higher socioeconomic groups (Bereczki et al., 2019, p. 190; Ellis, 2004, p. 27; Fogel et al., 1978; Meinzer et al., 2019, p. 239; Sokoloff & Villaflor, 1982, pp. 456–458). Fortunately, prison records complement military records; nevertheless, prison records are not above scrutiny. For example, because prisoners may have committed crimes out of material privation, prison records more likely represent conditions among lower socioeconomic groups. However, lower socioeconomic status net nutrition may be more sensitive to net nutritional variation. Prison records also have a considerable portion of individuals recorded with weight, which is the purpose of this study. Because this study considers only male statures during the transition from bound to free labor, women are excluded from the analysis but are considered elsewhere. Consequently, prison records are more likely to reflect biological conditions among the working class, however, also include information among skilled workers and African-Americans.
Data to assess late 19th and early 20th century weight variation are the result of an extensive effort to collect, collate, and examine net nutrition and health during U.S. economic development. Each state prison archive was contacted on multiple occasions, and available and affordable records were acquired and entered into a master data set. While not all prisons recorded both weight and height, the majority did, and Arizona, Colorado, Idaho, Illinois, Kentucky, Missouri, Montana, Nebraska, New Mexico, Oregon, Pennsylvania, Philadelphia, Tennessee, and Texas prison records are used here to evaluate how weight varied with the U.S. transition from bound to free-labor. 3 At the time of incarceration, prison enumerators recorded a broad set of individual characteristics, which includes weight, height, race, age, nativity, occupations, and reception date. Each individual’s weight and height were recorded as a means of identification within prisons and were used for identification in case they escaped and were recaptured.
At the time of incarceration, an individual’s complexion was recorded by prison enumerators and used to identify individuals in prisons. Complexions for individuals of African descent were recorded as Black, dark Black, and light Black. The complexion of individuals of European descent were recorded as light, medium, dark, and White. This European classification scheme is further supported by European-born immigrants in U.S. prisons who were also recorded as light, medium, dark, and White. In both the US population census and prison records, until the 1930s, it was standard to refer to individuals of mixed European and African descent as “mulatto,” but are referenced here as mixed-race. Because individuals of African and European descent were most affected by the transition to free-labor, only U.S.-born Blacks and Whites are considered in this study. Only individuals with complexions consistent with African and European ancestry are included in this study, and data are measured for each individual only once, therefore, is cross-sectional data.
Occupations are a reasonable measure to assess how physical conditions varied by socioeconomic status. Occupations were recorded at the time an individual was admitted to prison and reflect pre-incarceration conditions, not conditions within prisons. Occupations are classified into seven broad categories: no-occupations, common unskilled, farm laborers, farmers, ranchers, skilled, and White-collar workers. Common unskilled workers were recorded as teamsters, railroaders, and painters and were more likely to come to maturity in urban areas, where access to nutrition was limited and virulent disease environments more common (McGuire & Coelho, 2011, pp. 52–53). However, farm laborers were more likely to reach maturity in rural environments where there was easy-access to nutrition and mild disease environments. The distinction is important because combining common and farm laborers overestimates the biological benefits of being a common unskilled worker and underestimates the benefits of being a farm laborer. General farmers and dairymen are recorded as farmers, while ranchers and stockmen are recorded as ranchers. Blacksmiths, tailors, and stonecutters are recorded as skilled workers, while physicians, the clergy, and bankers are recorded as White-collar workers. 4
Four categories are used to evaluate the transition to free-labor: Blacks and Whites born before 1866, and Blacks and Whites born after 1865. Table 1 presents descriptive statistics for each category. Birth decades begin as early as the 1730s and continued through the 1920s. Reception dates began in 1803 and lasted through the 1940s. For births before 1866, most Blacks were native to the south, while most Whites were native to the Middle-Atlantic, Southeast, and Great Plains. While unskilled labor was the most common occupation, there were considerably more White skilled workers, and Whites were about 5 times more likely than Blacks to be White-collar and skilled workers. For birth before 1866, there was about the same proportion that reported their occupation as farmers. Black and White farmers were unlikely to be incarcerated; however, Whites were more likely to be farmers before and after the transition to free-labor. As is common today, historical crimes were committed by the young (Freeman, 1999; Gottfredson & Hirschi, 1990, p. 353; Hirschi & Gottfredson, 1983), and over half of young Black males born under bound labor were in their teens and 20s. While the majority of Whites were incarcerated in their 20s, proportionally more Whites were in their 30s, 40s, and 50s than in their teens. Although the proportion in the Southwest increased with westward expansion, Black nativity under free-labor remained mostly in the South.
Average Black and White Characteristics Between Bound and Free Labor.
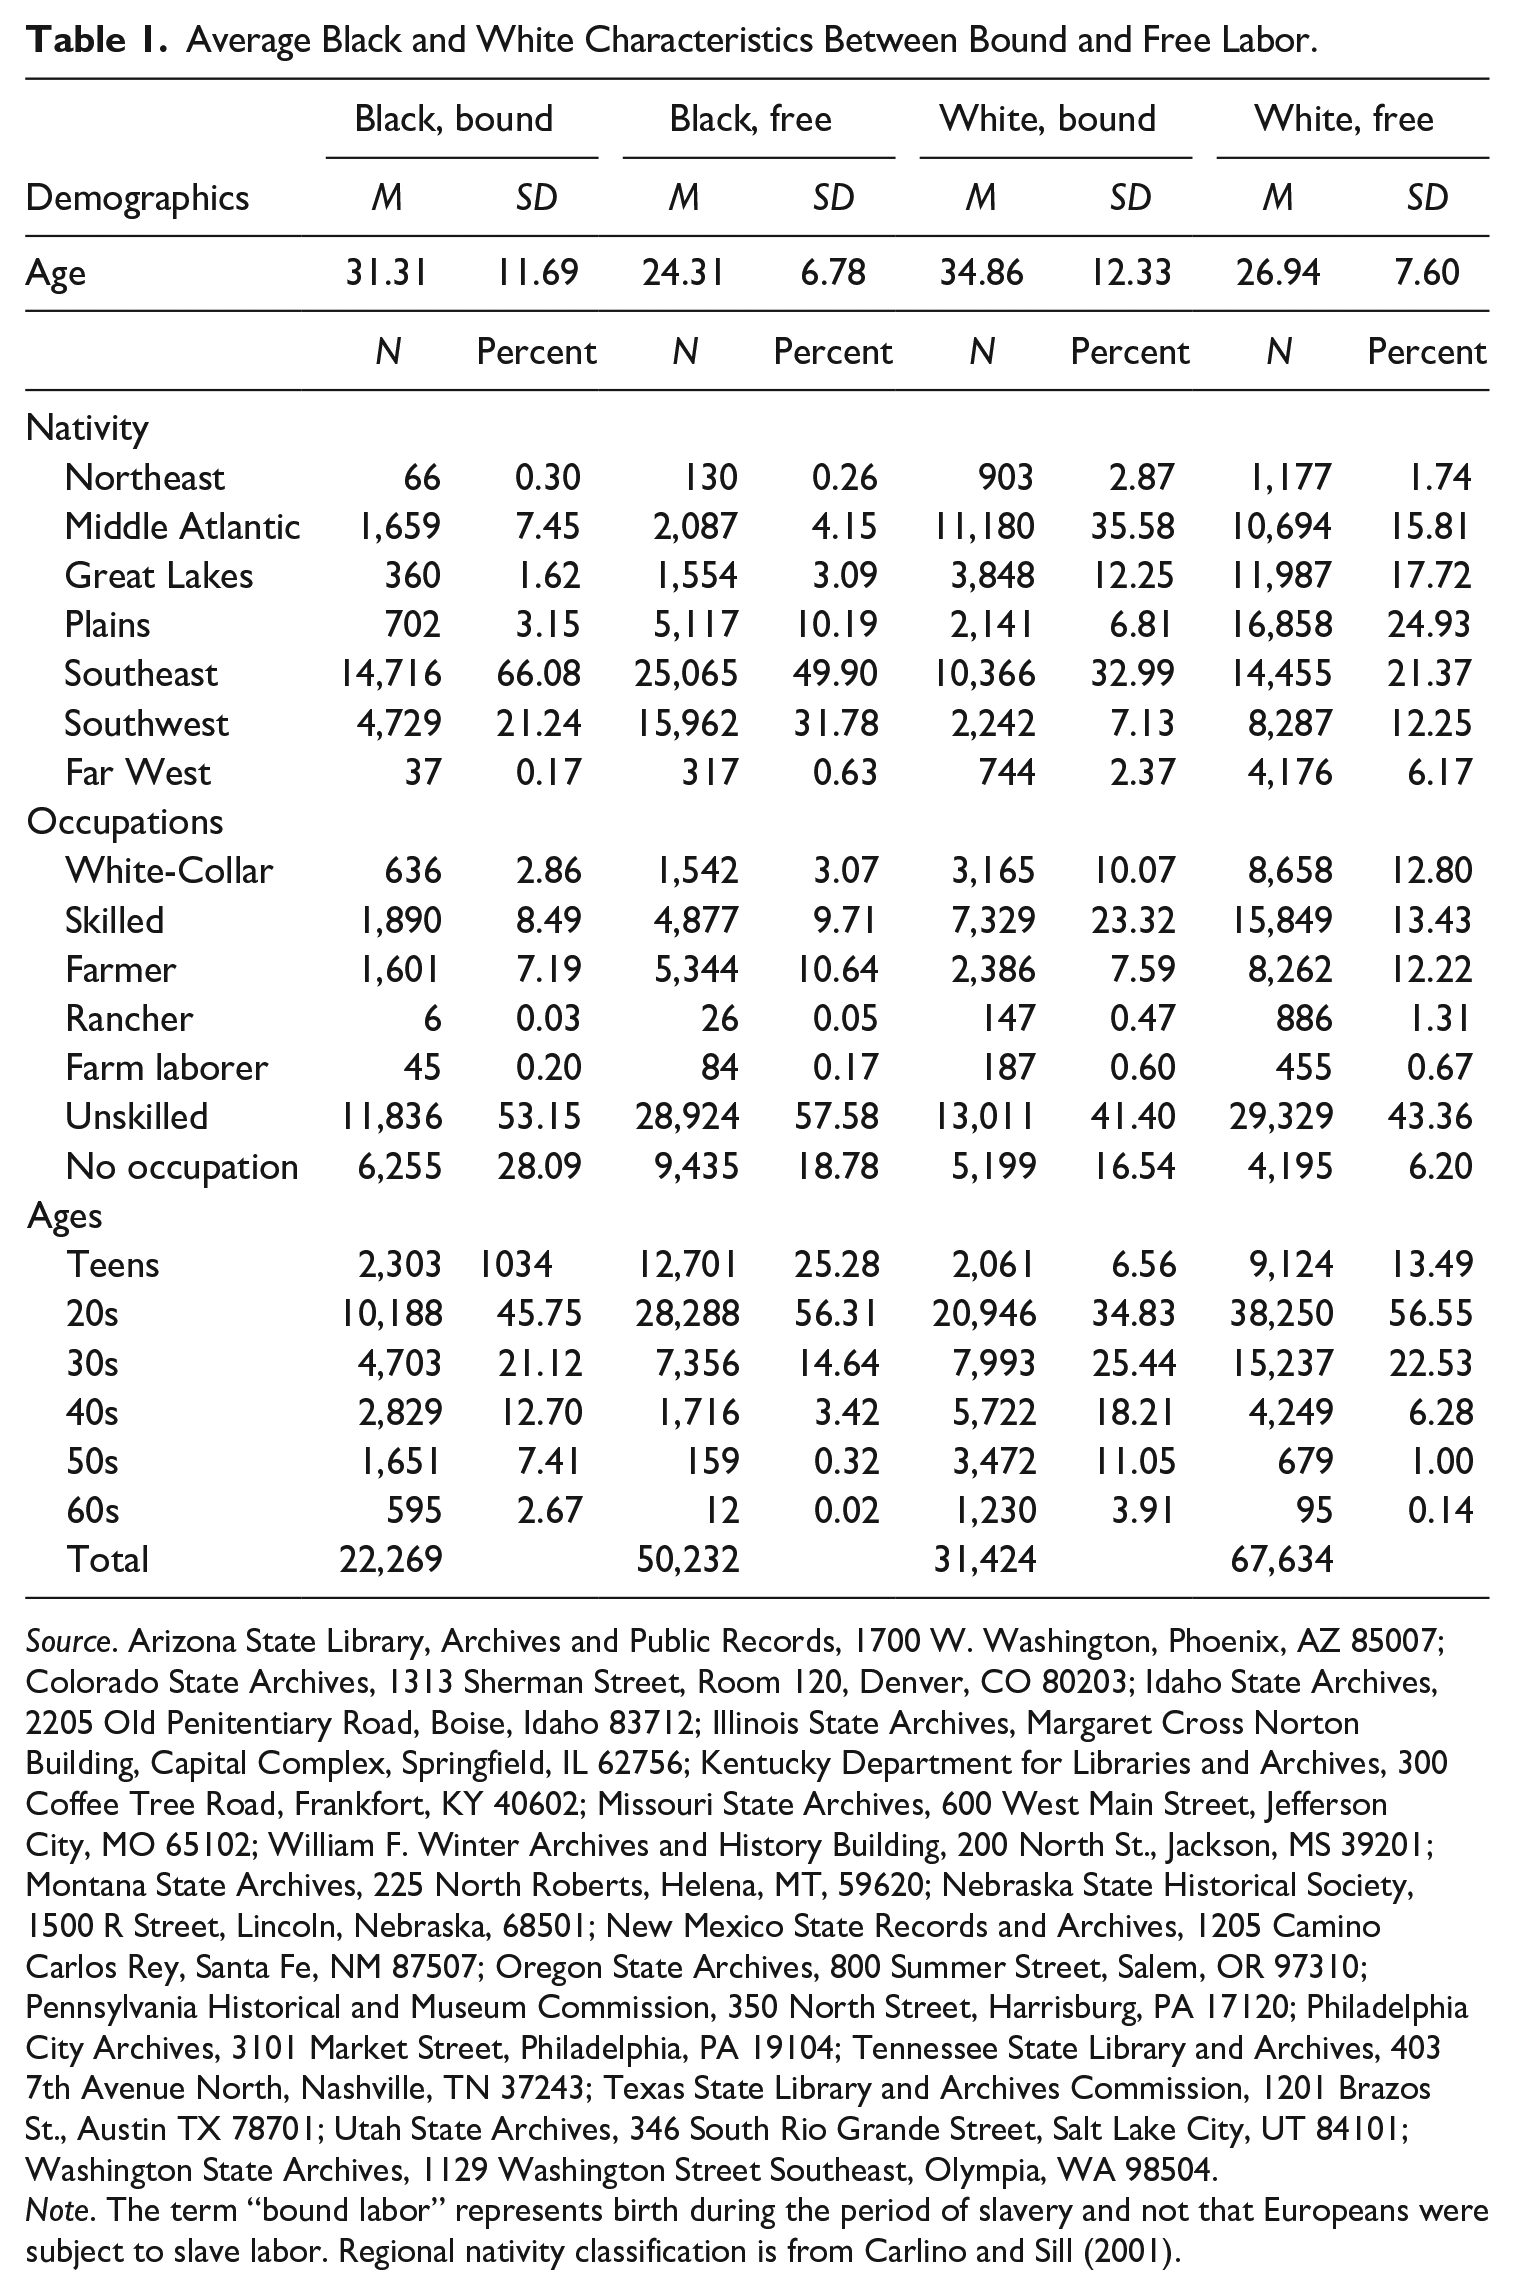
Source. Arizona State Library, Archives and Public Records, 1700 W. Washington, Phoenix, AZ 85007; Colorado State Archives, 1313 Sherman Street, Room 120, Denver, CO 80203; Idaho State Archives, 2205 Old Penitentiary Road, Boise, Idaho 83712; Illinois State Archives, Margaret Cross Norton Building, Capital Complex, Springfield, IL 62756; Kentucky Department for Libraries and Archives, 300 Coffee Tree Road, Frankfort, KY 40602; Missouri State Archives, 600 West Main Street, Jefferson City, MO 65102; William F. Winter Archives and History Building, 200 North St., Jackson, MS 39201; Montana State Archives, 225 North Roberts, Helena, MT, 59620; Nebraska State Historical Society, 1500 R Street, Lincoln, Nebraska, 68501; New Mexico State Records and Archives, 1205 Camino Carlos Rey, Santa Fe, NM 87507; Oregon State Archives, 800 Summer Street, Salem, OR 97310; Pennsylvania Historical and Museum Commission, 350 North Street, Harrisburg, PA 17120; Philadelphia City Archives, 3101 Market Street, Philadelphia, PA 19104; Tennessee State Library and Archives, 403 7th Avenue North, Nashville, TN 37243; Texas State Library and Archives Commission, 1201 Brazos St., Austin TX 78701; Utah State Archives, 346 South Rio Grande Street, Salt Lake City, UT 84101; Washington State Archives, 1129 Washington Street Southeast, Olympia, WA 98504.
Note. The term “bound labor” represents birth during the period of slavery and not that Europeans were subject to slave labor. Regional nativity classification is from Carlino and Sill (2001).
In health studies, weight can be measured by observation or birth period. Measured from birth period, weight summarizes the cumulative net nutrition as a cohort ages over time because birth cohorts experience similar social, economic, and technological events throughout life. By contrast, weight by observation period summarizes the current net nutrition experienced by different cohorts at a point in time. Moreover, because weight is positively related to height, measuring weight by birth sheds light on net nutrition during the transition to free-labor. Results examined here are by birth cohorts and therefore summarize cumulative net nutrition since birth during the transition to free labor.
It is also important to describe the composition of the sample partitioned by prison and period of measurement. Table 2 demonstrates that Kentucky, Pennsylvania, and Tennessee were large sources of early 19th century weight and height measures. Nebraska is the prison that extends through the 1940s.
Sample Description for Prison by Observation Decade Year.
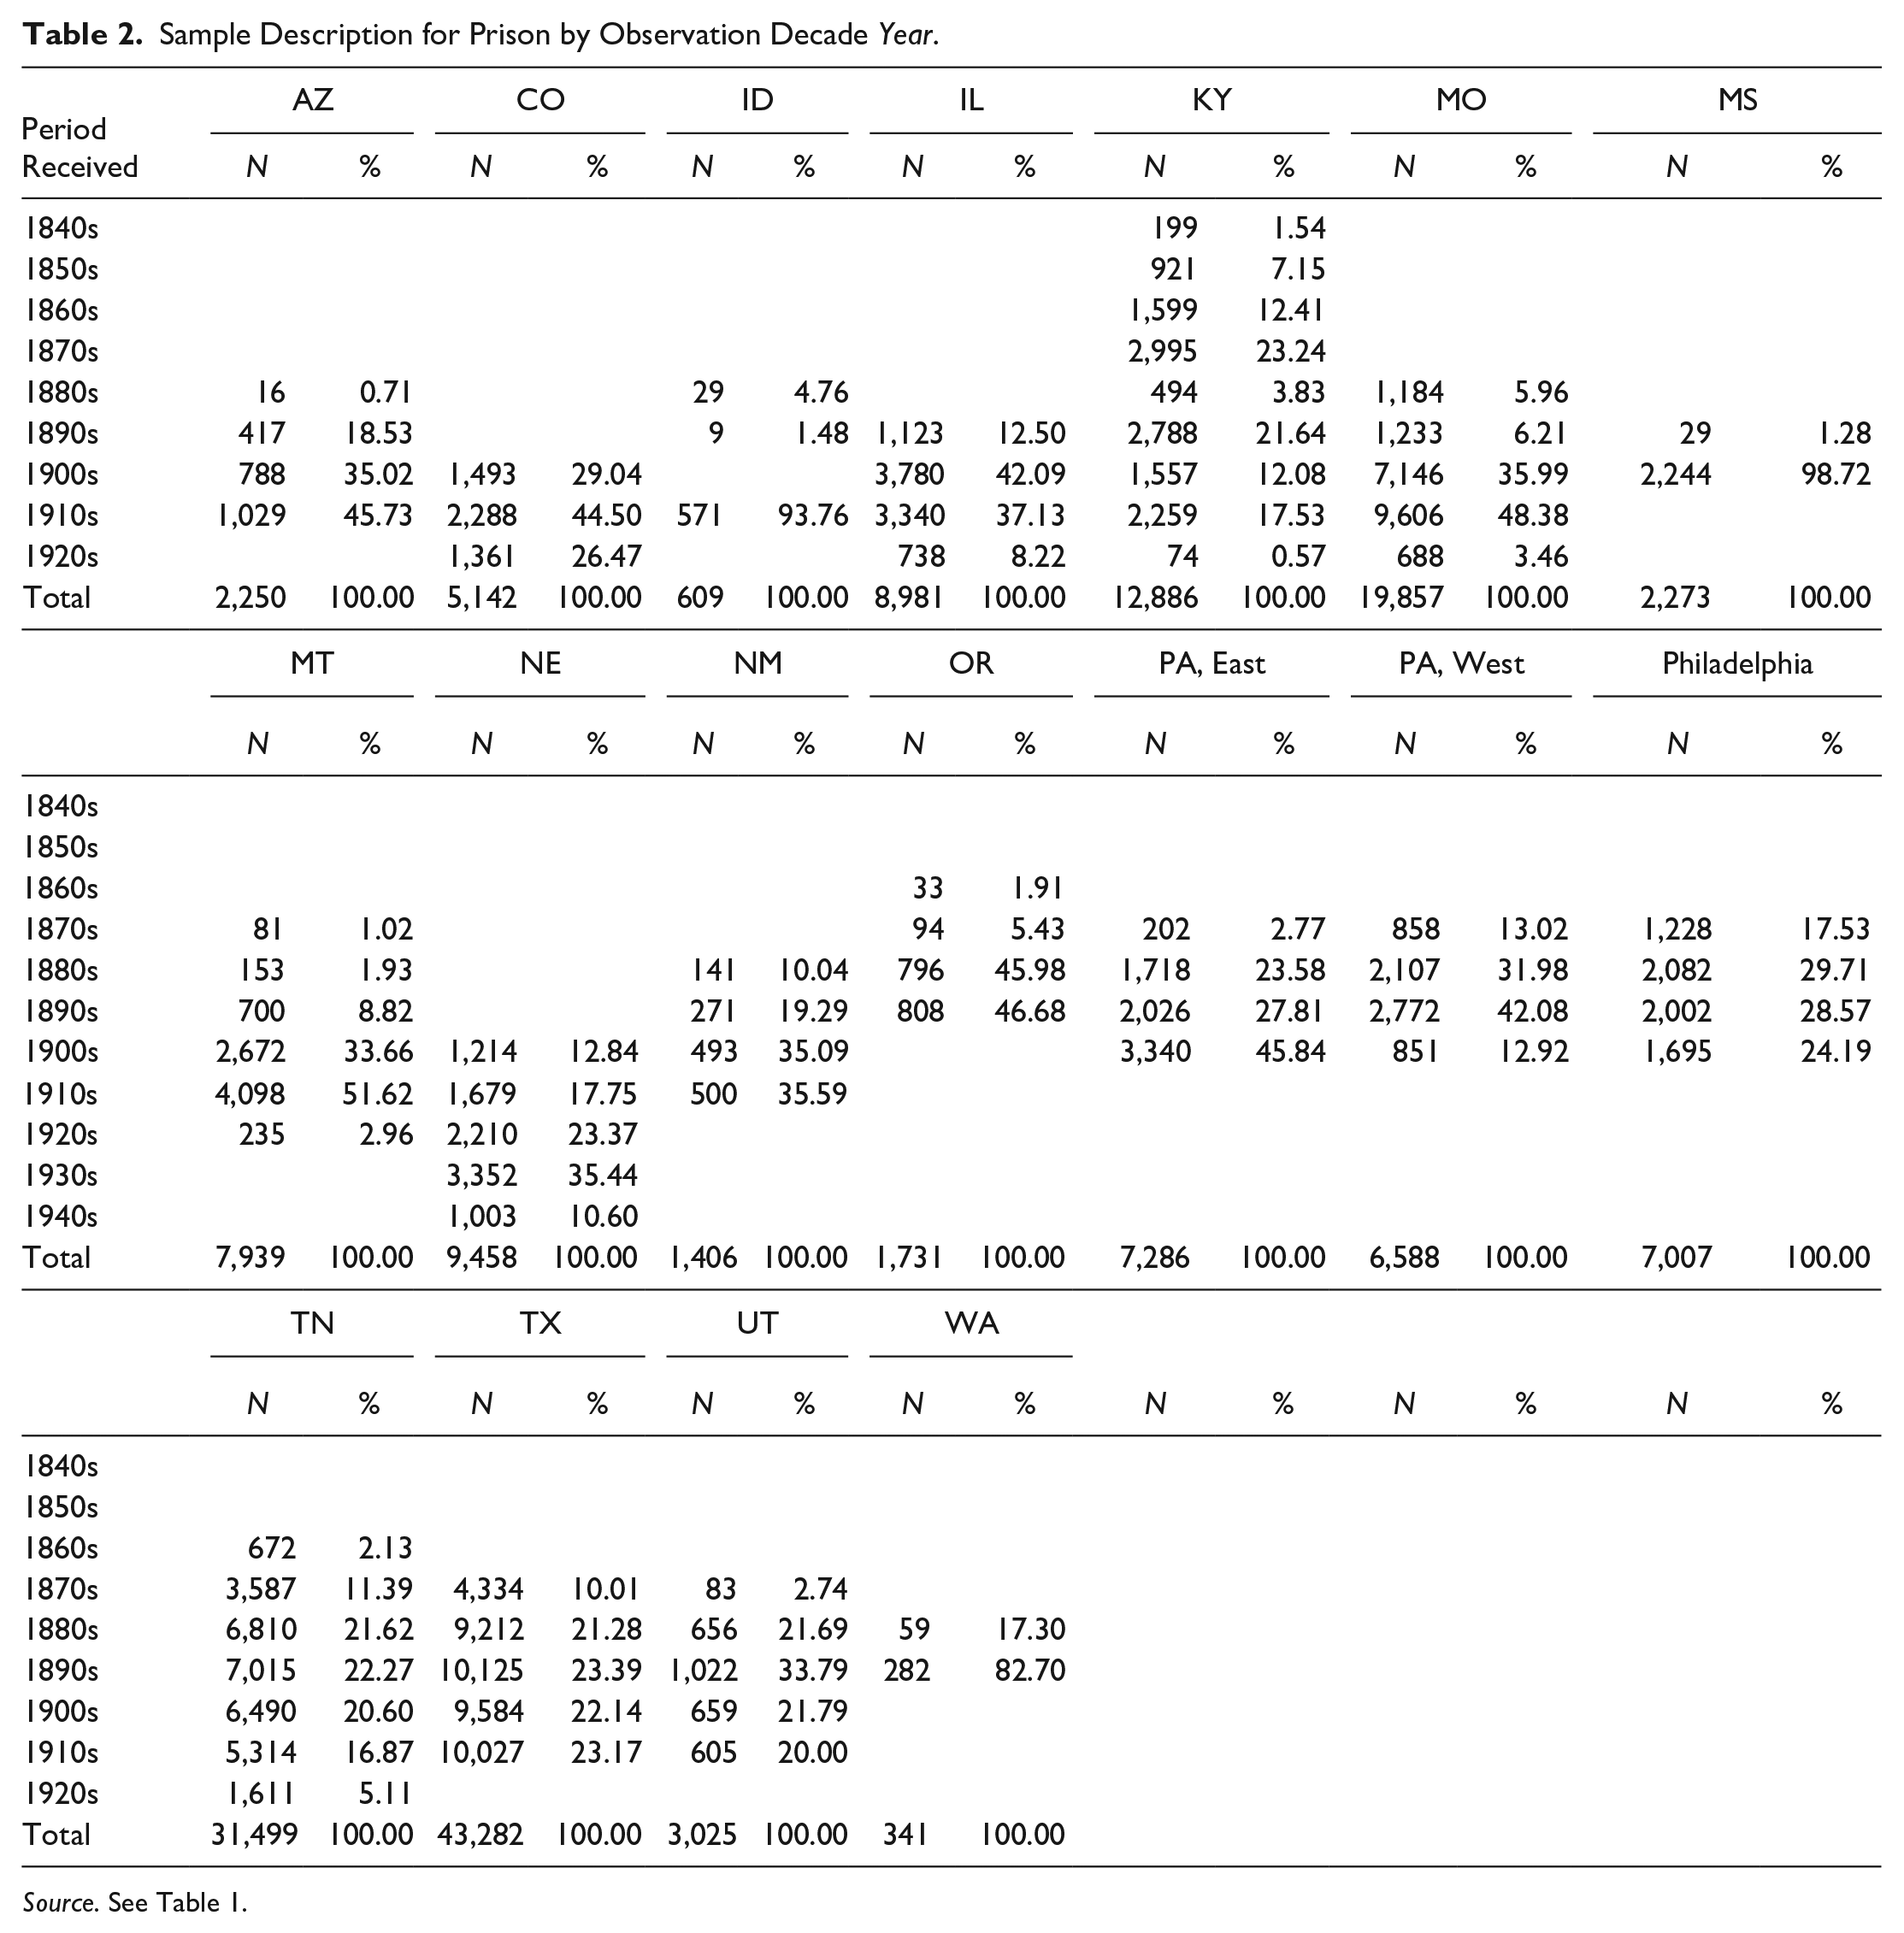
Source. See Table 1.
Figure 1 plots Black and White average weights between 1840 and 1940 by observation decade. Black weights were greater than White weights, and Black and White greatest average weight difference was during the early 19th century. There was a small antebellum weight difference in 1860, which was followed immediately in 1870 by the largest weight difference. Given weight variation in Figure 1 and 19th century political events, the most reasonable period to partition weight is in 1865 around the time of emancipation.
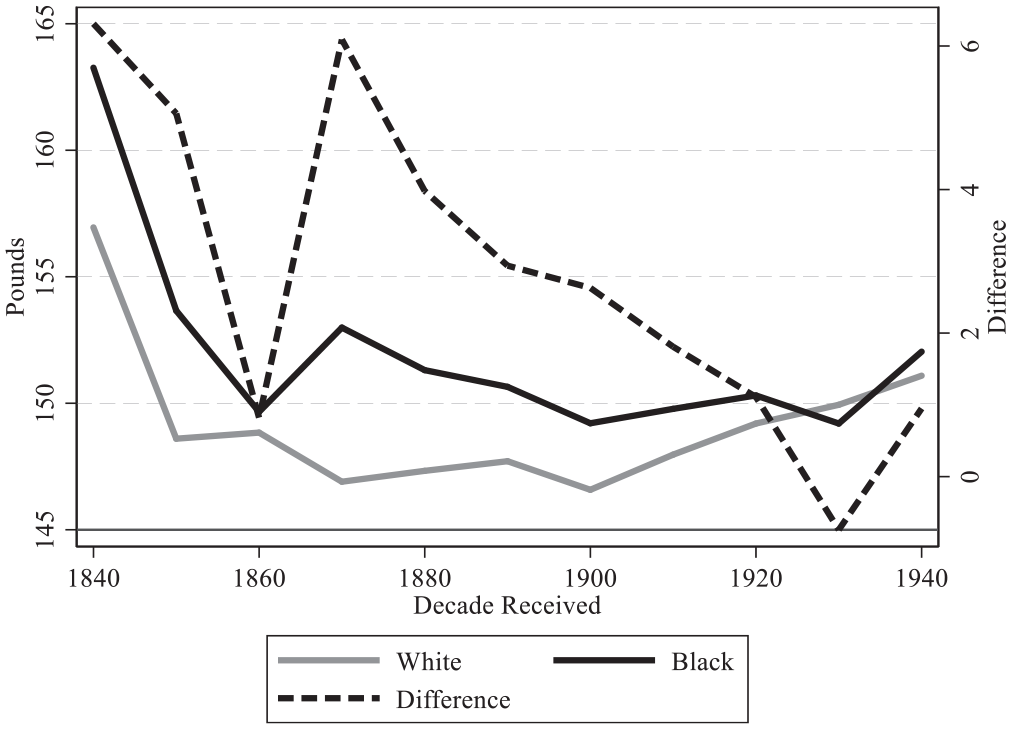
Late 19th- and early 20th-century weight variation by observation period.
Econometric Model
A Blinder-Oaxaca decomposition is a statistical technique that isolates differences between dependent variables that are due to structural and composition effects (Blinder, 1973; Oaxaca, 1973; Schneewies, 2011). To isolate causal effects, a difference-in-difference estimator is a widely used method in the quasi-experimental literature (Card & Krueger, 1993). These two methods are combined here to separate and distinguish between Black and White weight differences by returns and average characteristics associated with the transition to free-labor. A difference-in-decompositions is constructed to determine how Black and White weights varied across and within groups with the transition to free labor. If there are large differences between characteristic returns associated with dependent variable differences before and after an event but small differences associated with average characteristics, greater causal interpretation is attributable to characteristics. If, however, there is little difference between characteristic returns and large differences between average characteristics, differences are associated with sample compositions. 5 There are two ways to evaluate the difference in dependent variable relationships and their associations with observable characteristics: across and within groups.
Across group
The across-group decomposition identifies Black and White weight differences across racial groups attributable to returns to characteristics and average characteristics with the transition to free-labor. The across-group decomposition is calculated by decomposing weights across racial groups after and before bound-labor, and Black weights are assigned as the base structure.
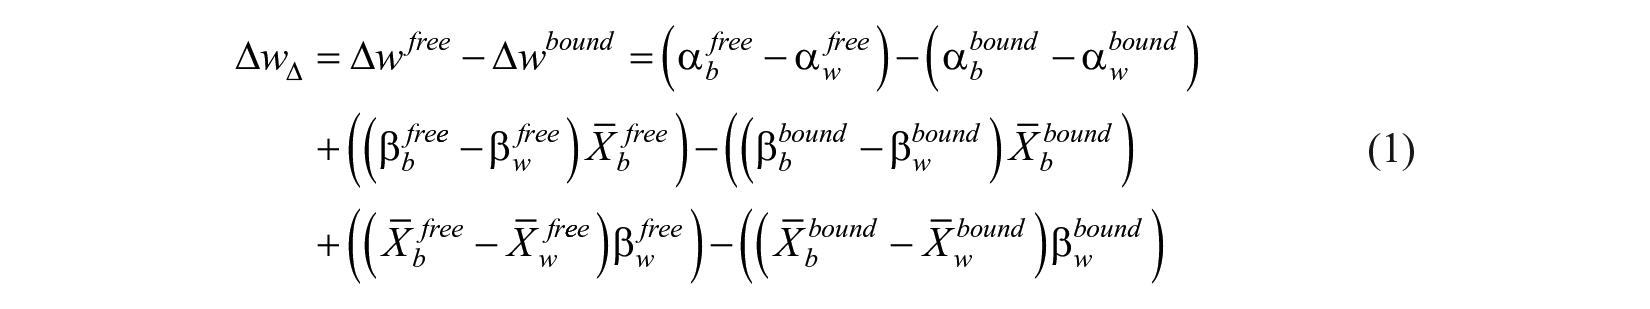
Equation 1 is derived in the Appendix, Equation A12.
Within group
There was also a Black and White within-group weight differences with the transition to free-labor and illustrates how weight returns varied within racial groups with the transition. The within-group decomposition is calculated by decomposing weights within racial groups after and before bound-labor, and free-labor weights are assigned as the base structure.
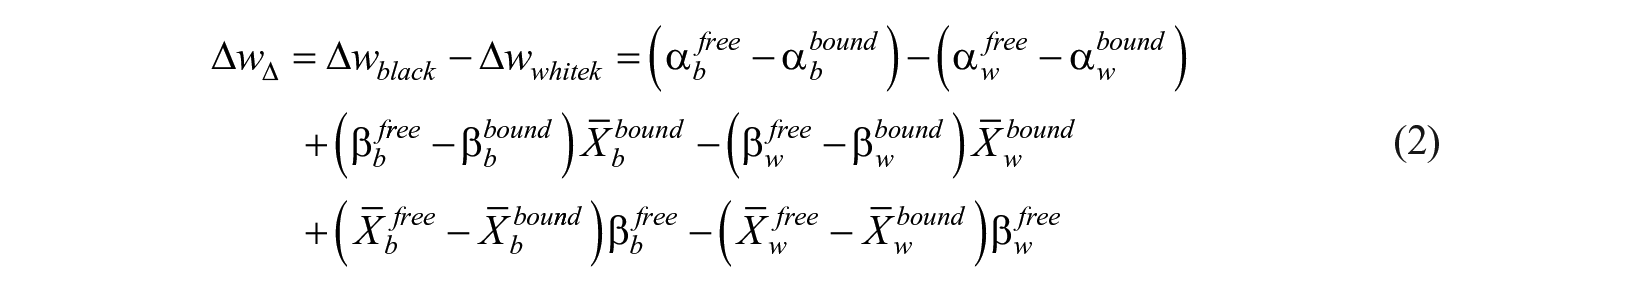
Equation 2 is derived in the Appendix, Equation A16.
Empirical Analysis
Table 3 presents bound and free-labor weight regressions by race. Model 1 presents Black weight for individuals born before 1866, while Model 2 does the same for Whites. Model 3 presents the Black weight model for individuals born after 1865, while Model 4 does the same for Whites.
Black and White Bound and Free Labor Weight Models by Demographics, Socioeconomic Status, and Nativity.
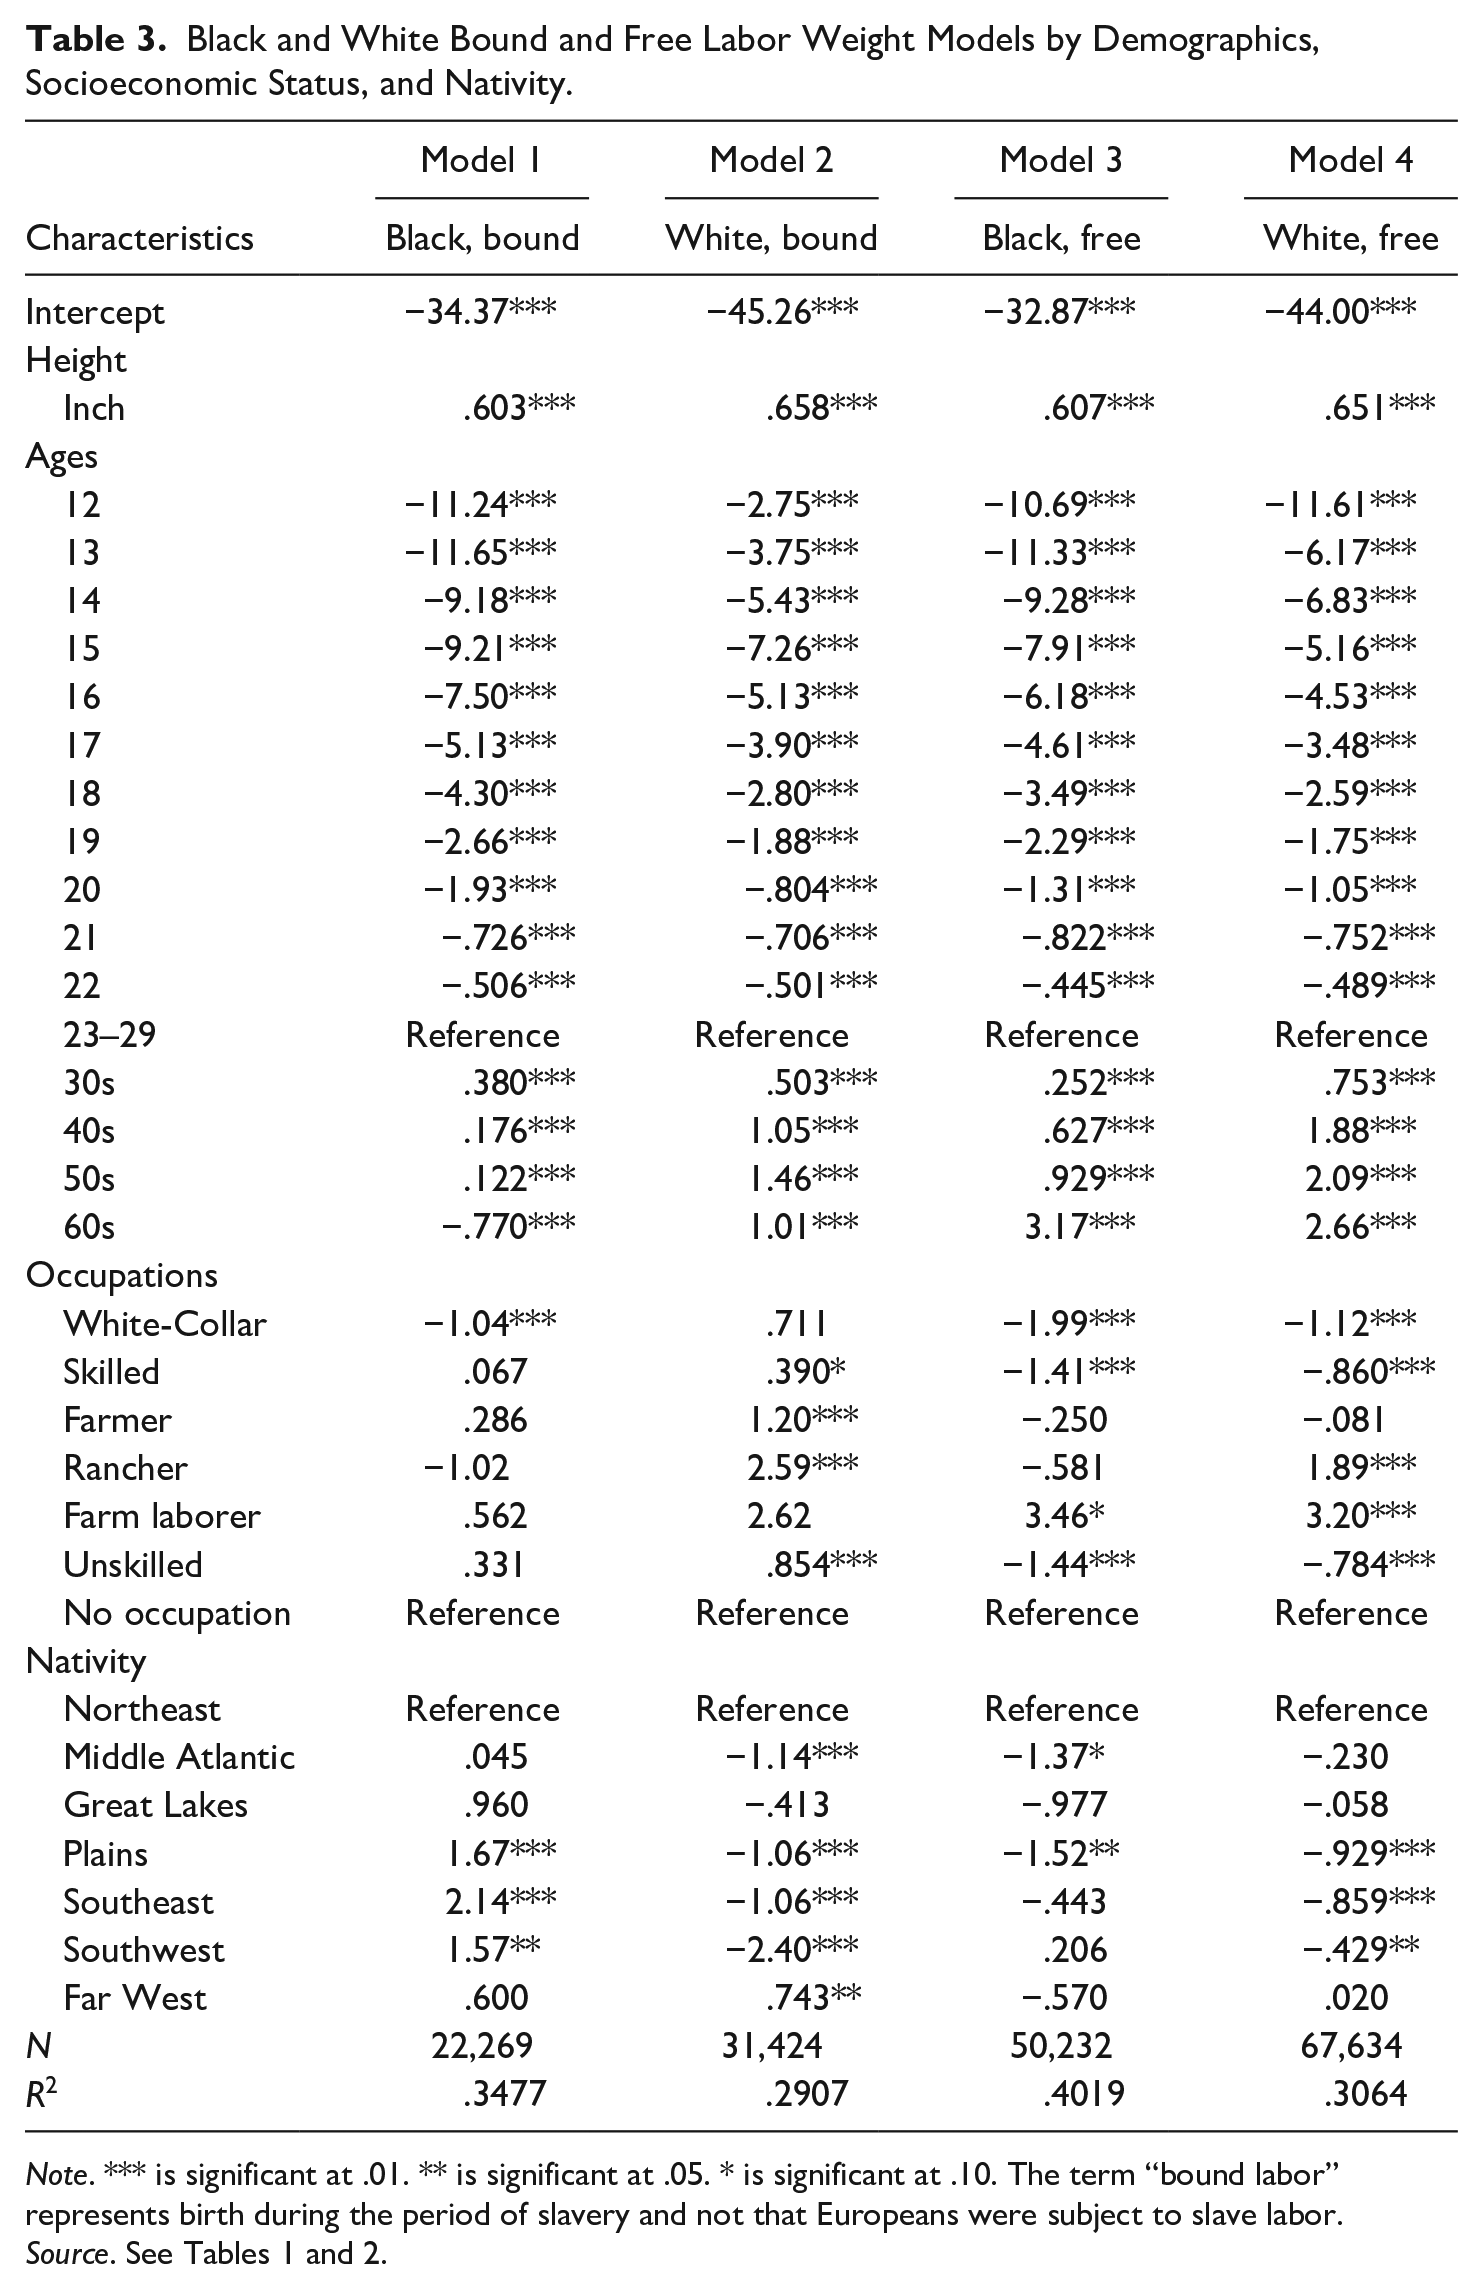
Note. *** is significant at .01. ** is significant at .05. * is significant at .10. The term “bound labor” represents birth during the period of slavery and not that Europeans were subject to slave labor.
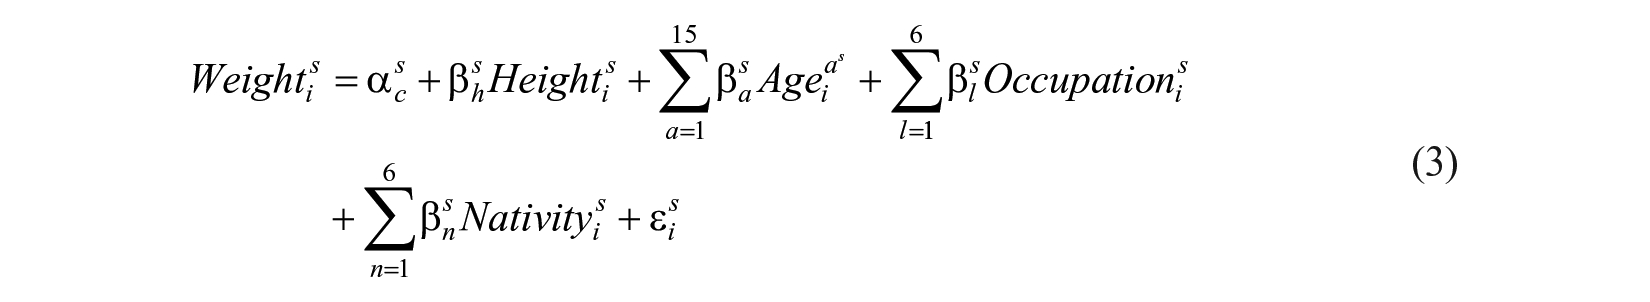
The dependent variable is weight for the ith individual measured in pounds during the s period (Equation 3). Height is included in inches to account for the positive relationship between weight and height. Youth and adult age dummy variables are included to measure how weight increases with adult age during early years, and adult decade dummy variables are included to measure weight increases with adult age. Occupation dummy variables are included for White-collar, skilled, farmers, ranchers, farm laborers, and unskilled workers. Nativity dummy variables are included for Middle Atlantic, Great Lakes, Plains, Southeast, Southwest, and Far West.
Bound Labor and the Antebellum Period
For Blacks and Whites across all periods, there was a remarkably stable relationship between weight and height (Table 3). A well-known result in late 19th and early 20th century African American youth stature studies is that slave children had shorter statures compared to their White counterparts (Steckel, 1986a, 1986b, 2016, p. 41). Steckel (1986a, pp. 732–733) illustrates that much of this disparity was attributable to fetal and infant growth restrictions, when neonate nutrition was restricted, and mother’s diets transitioned away from proteins, calcium, and iron. 6 Until they approached entry into the adult slave labor force, slave masters were uncertain which children would survive to adulthood and were judicious when allocating plantation resources to youth nutrition, and slave children persistently had shorter statures compared to Whites (Komlos, 1992, p. 300; Schneider, 2017, pp. 4–7; Steckel, 1986a, 1986b). Nothing is known, however, about how Black youth weights varied by age and how their weights compared to White youth weights. During the antebellum period, Black youth weights were consistently lower than Whites, though converged with adult Black weights as Black youths approached adulthood and entry into the adult labor force. Nonetheless, the Black free-labor youth weight gain with age was similar to the Black bound-labor youth weight gain with age, indicating the Black youth weight gain may not be unique to the transition to free-labor (Komlos, 1992, p. 300). At older ages, adult slave weight gain was lower than White under bound-labor, extending a new pattern in Black– White biological studies. Under the discretion of slave masters, antebellum adult Black weight gain under free-labor was less than for Whites.
Under bound-labor, there was little Black weight variation by occupations, and masters allocated plantation nutrition to slaves just enough to keep slaves in sufficient health to withstand plantation labor but did not feed them to excess. To the degree that skilled and White-collar slaves were trained in skilled occupations (Fogel, 1974, pp. 41–43), unskilled field hands and common laborers did not receive excess net calories compared to workers in other occupations (Steckel, 2016, p. 42). However, under bound-labor, White ranchers, farmers, and farm laborers had greater weight returns than slaves and received above average calories relative to work effort. Antebellum current net nutrition varied regionally, and Blacks in slave holding states had significantly greater weights compared to their White counterparts. However, slaves were located in the South, which was agriculturally more productive than other regions (Hilliard, 1972). Under bound-labor, Whites from the Northeast had greater weight returns than elsewhere within the United States.
Free-Labor and the Postbellum Period
Under free-labor, adult Black age-related weight gain was higher than Black returns during the antebellum period. However, Black adult weight gain with age was lower than Whites. Under free-labor, Black and White skilled and White-collar worker weights were lower than workers in other occupations, and White agricultural worker’s weights continued to be high. Moreover, unskilled Black and White worker weights under free-labor were lower than unskilled workers under bound-labor, indicating that unskilled workers’ net nutrition was likely higher with industrialization. White weights during free-labor also varied by nativity, and Black nativity demonstrated little regional variation under free-labor, whereas, there was a strong Black nativity effect under bound labor in slave holding states. That there was little Black free-labor weight variation by nativity but considerable bound-labor Black weight variation indicates that without respect to slave occupations, slave-owners and overseers had greater incentives to allocate plantation nutrition to slaves independent of their occupations to maintain their investments in slave property. Alternatively, White free-labor weight in current or former slave holding states were lower than Blacks but improved under free-labor.
Decomposing Black and White Weight for Bound and Free-Labor
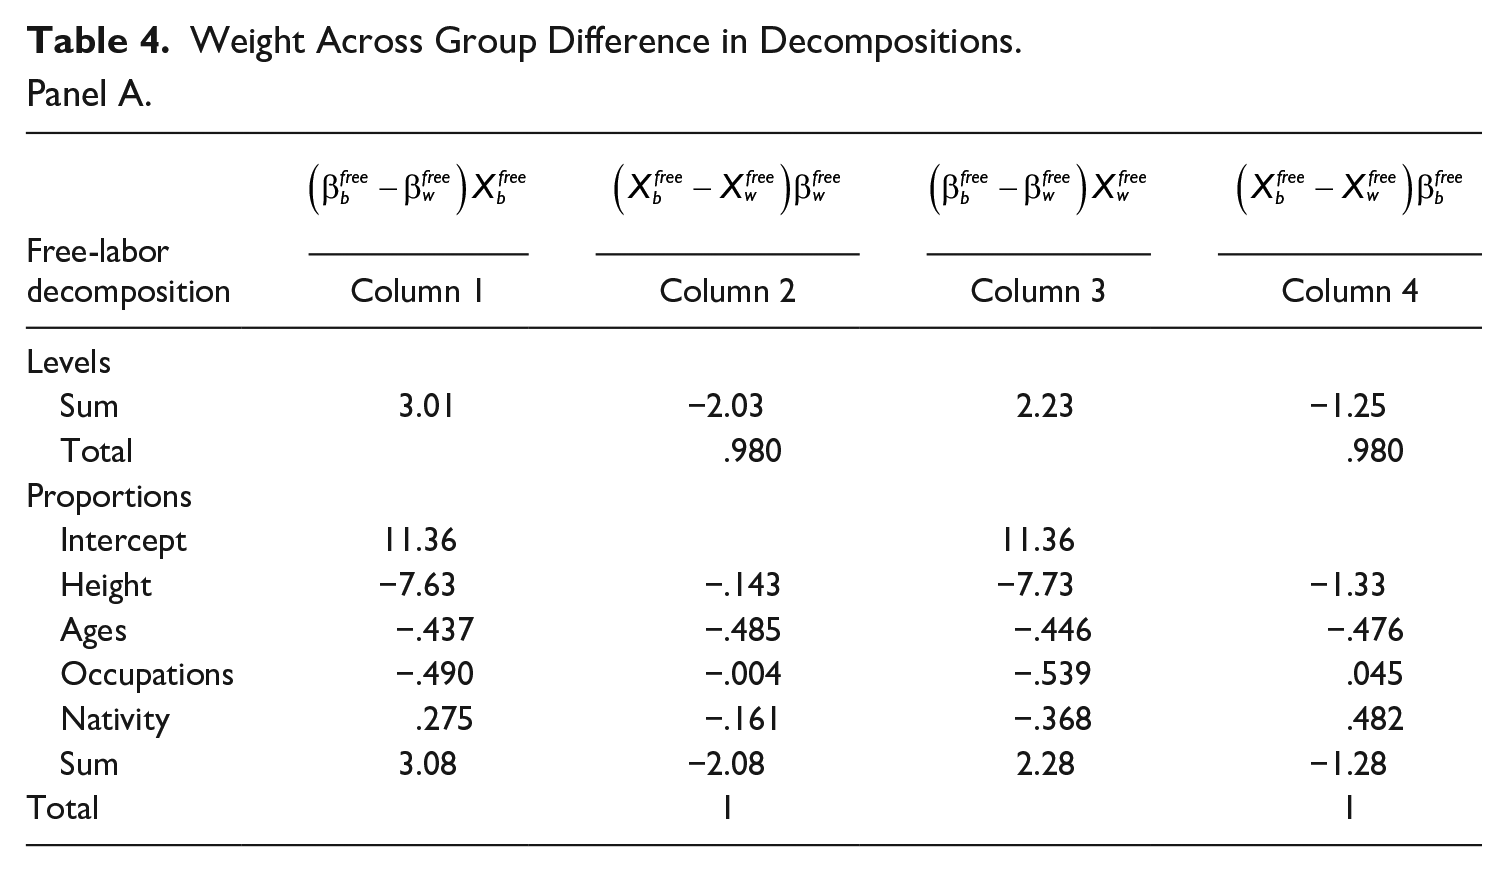
Table 4’s Panel A is the Black–White free-labor across-group weight decomposition (Equation A.9). Panel B is the Black–White bound-labor across-group weight decomposition (Equation A.10). Panel C is the weight difference-in-decompositions between Panels A and B and separates changes in the Black–White across-group difference into returns to characteristics and average characteristics (Equation A.12). Panel C’s elements are positive if Black weights were greater than Whites with the transition to free-labor and are elements are percent differences between Blacks and Whites associated with the transition to free-labor.
Weight Across Group Difference in Decompositions.
Panel A.
Panel B.
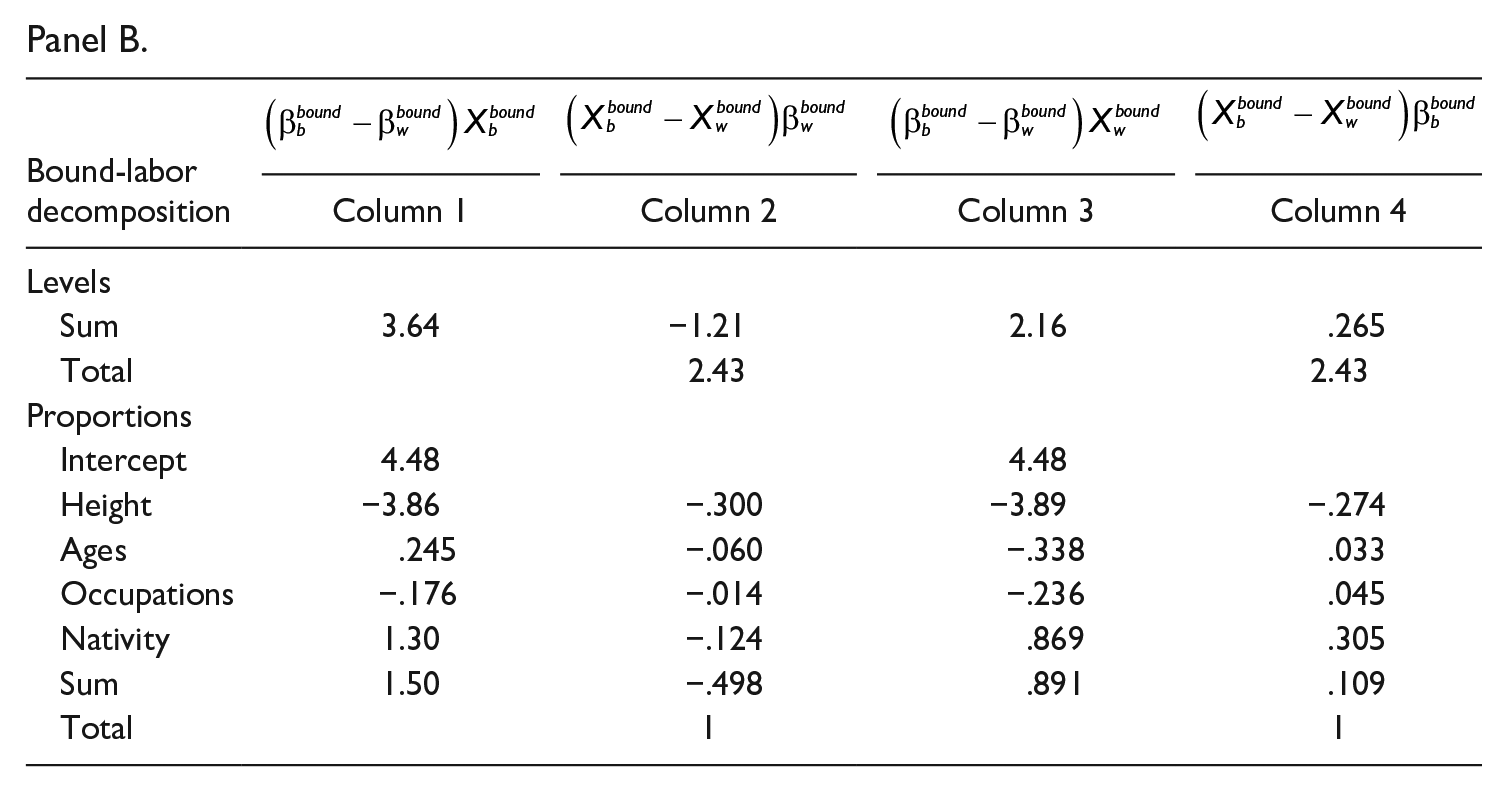
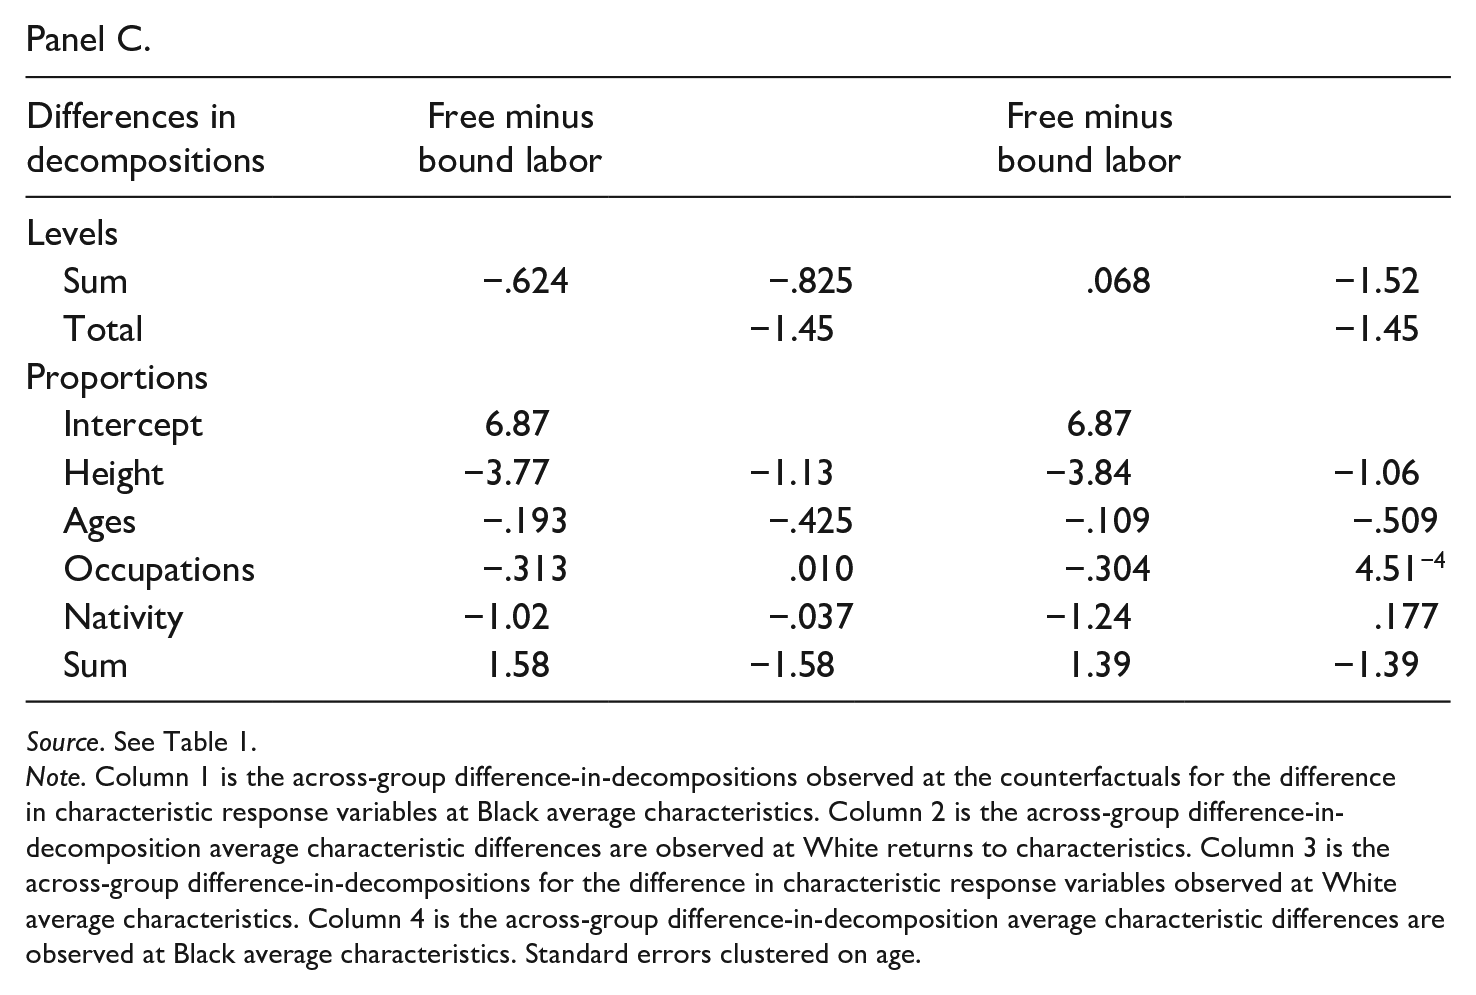
Panel C.
Source. See Table 1.
Note. Column 1 is the across-group difference-in-decompositions observed at the counterfactuals for the difference in characteristic response variables at Black average characteristics. Column 2 is the across-group difference-in-decomposition average characteristic differences are observed at White returns to characteristics. Column 3 is the across-group difference-in-decompositions for the difference in characteristic response variables observed at White average characteristics. Column 4 is the across-group difference-in-decomposition average characteristic differences are observed at Black average characteristics. Standard errors clustered on age.
Across-Group Free-Labor Decomposition
Table 4’s Panel A’s positive intercept, 11.36 pounds, indicates that Black weights were independently greater under free-labor, and Black weights associated with unidentified characteristics were greater with the transition to free-labor. However, sources of the across-group free-labor decomposition were important. White weight returns associated with height were considerably greater under free-labor, and the difference in average sample heights was small, indicating White weight returns to height were large under free-labor. Although not as large, White free-labor age and socioeconomic status were also greater than Blacks. Results are mixed for free-labor nativity and the relationship between Black and White weight returns. Measured at average Black characteristics and White means, Blacks had greater weight returns associated with nativity (Column 1); nonetheless, Whites had a large off-setting effect associated with mean characteristics (Column 2). Measured at average White returns to characteristics and Black average characteristics, Whites had greater weight returns associated with nativity; however, Black average weights offset the White returns advantage. The majority of greater Black weights was due to returns to weight rather than compositional effects.
Across-Group Bound-Labor Decomposition
Table 4’s Panel B’s bound-labor decomposition illustrates that Black relative to White weights were greater under bound-labor; however, the Black autonomous weight component was larger under free labor (Table 4, Panel A). The Black weight advantage was also associated with characteristics under bound-labor. The weight-age returns result is mixed for bound-labor. Measured at average Black characteristics and White returns, Blacks had greater weight returns associated with age (Column 1); however, Whites had greater weight returns associated with average characteristics (Column 2). Measured at average White characteristics and Black returns (Column 3), Whites had greater weight returns associated with age; nevertheless, Blacks had greater weight returns associated with average age (Column 4). Weight returns associated with socioeconomic status favored Whites during bound-labor, when the institution was most entrenched. Black weight-nativity returns were greatest under bound-labor, when owners and slave masters had incentives to provide sufficient calories to maintain their slave property. The majority of greater bound-labor Black weight was due to returns to characteristics rather than composition effects.
Across-Group Differences-in-Decompositions
Table 4’s Panel C is the Black–White across group’s weight differences-in-decompositions and illustrates how net nutrition varied between Blacks and Whites with the transition to free-labor. From its beginning, U.S. economic arrangements were based on inequality, and Whites were at an institutionalized advantage to Blacks (Steckel, 1979). This material inequality may have extended to nutrition; nonetheless, slaves were more physically active and required more calories per day to maintain health (Fogel, 1974, p. 112; Wagner & Heyward, 2000). Aside from the Civil War itself, the greatest race conflagration during U.S. economic development was the 1863 Manhattan race riots when lower socioeconomic status Whites—many of them poor Irish immigrants—refused to fight to free former slaves because former slaves were perceived as competing with Whites for unskilled occupations (Chernow, 2017, p. 298). Arnold Plant (1974, pp. 3–16), C. Vann Woodward (1951, p. 134), and Keith Tribe (2009, pp. 88 and 92) propose that lower socioeconomic status Whites in U.S. labor markets were made worse-off when they had to compete with free-Blacks after the transition to free-labor (Donald, 1995, p. 24; Myrdal, 1994; Smith & Welch, 1989). Alternatively, if whites acquired and demonstrated a taste for discrimination, Blacks did not make significant progress in the immediate aftermath of the transition to free-labor (Becker, 1957, pp. 75–80; Becker, 1966, pp. 188–190; Higgs, 1977, pp. 8–10). Subsequently, if White workers’ taste for discrimination increased with the transition to free-labor, lower socioeconomic status White weights would have increased relative to Blacks with the transition to free-labor.
However, rather than being worse off with the transition to free-labor, the −1.45 level intercept difference indicates White’s current net nutrition improved relative to Blacks with the transition to free-labor, and the source of the advantage varied with the transition. Notably, more of the Black weight advantage was due to non-identifiable sources in the intercept under free-labor. While overall White stature and net nutrition was greater with the transition, the positive autonomous intercept indicates that Black weights due to non-identified sources in the intercept increased with the transition to free-labor. However, Black weight returns to height, age, occupation, and nativity were greater relative to Whites under bound-labor, when slave masters and owners had vested interests to maintain investments in slave net nutrition, and it was bound-labor returns to characteristics that made Black weights higher under bound-labor.
As a robustness check, Table 4 presents across-group differences-in-decompositions at different Black and White counterfactuals. Differences in Black and White weights are comparable across model specifications and indicate across-group differences-in-decomposition results are robust across counterfactuals (Figure 2). Differences in the weight intercept is the greatest source of Black–White across group differences, which includes differences in nutrition, protein in muscle tissue, education, and access to nutrition. Moreover, Black weight characteristic returns were greater under bound-labor and were greater than differences in average characteristics, indicating the transition to free-labor had significant structural differences across-groups for weight by race.
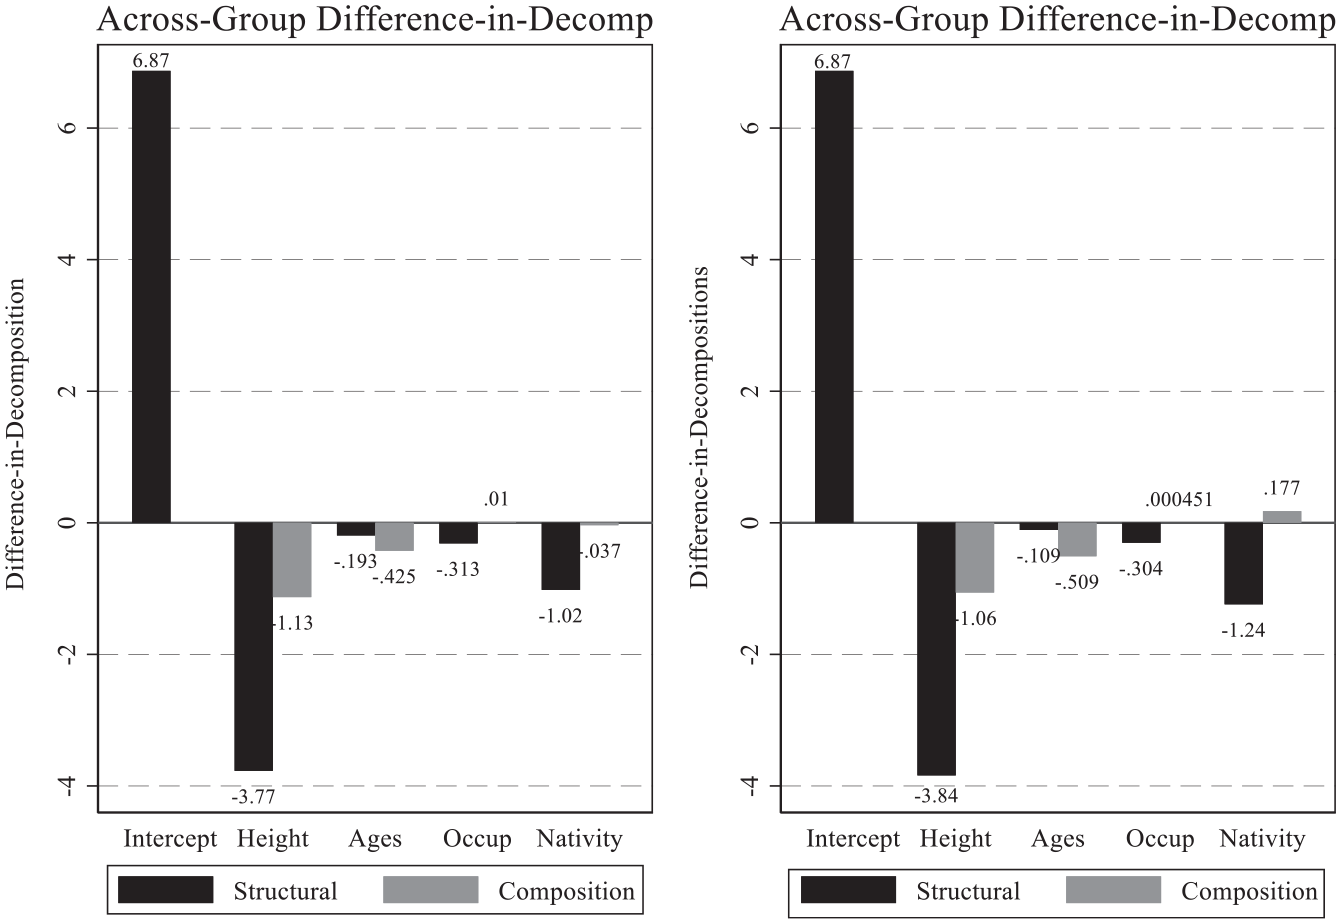
Black-White across-group weight difference-in-decompositions.
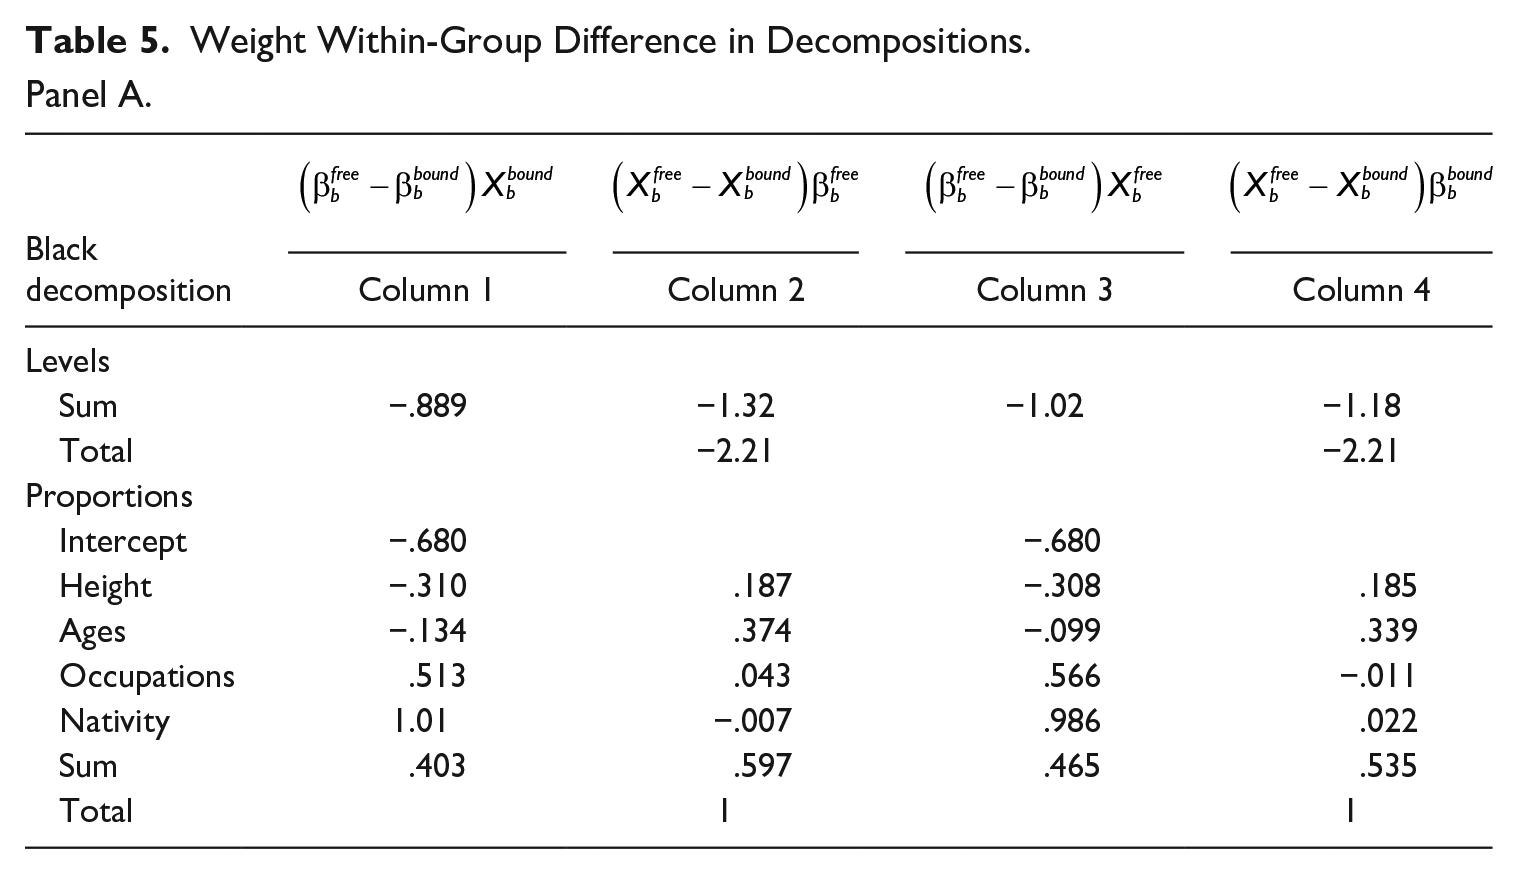
Black Within-Group Decomposition
Table 5’s Panel A is the Black within-group decomposition, and African American within-group net nutrition was greater under bound-labor. Independent of characteristics, Black within-group net nutrition was higher under bound-labor; nonetheless, the source of within-group variation was important. Black weight returns to height and age were greater under bound-labor, yet was off-set, at least in part, by taller average Black height and proportionally younger Black workers under free-labor. Black weight-socioeconomic returns were greater under free-labor, indicating that Black net nutrition returns were greater with the transition to free-labor. The Black within-group weight decompositions were related to nativity, and nativity weight returns were greater under free-labor, after the institutionalized advantage to Whites was eliminated. The Black transition to free-labor for weights was nearly equally distributed to returns to characteristics and average characteristics.
Weight Within-Group Difference in Decompositions.
Panel A.
Panel B.
Panel C.
Source. See Table 1.
Note. Column 1 is the within-group difference-in-decompositions observed at the difference in characteristic response variables observed at free and bound-labor bound average characteristics. Model 2 is the within-group difference-in-decomposition average characteristic differences are observed at free-labor returns to characteristics. Model 3 is the within-group difference-in-decompositions is presented for the difference in White returns to characteristics observed at free average characteristics. Model 4 is the within-group difference-in-decomposition average characteristic differences observed at bound returns to characteristics (Table 5, Mode1 4). Standard errors clustered on age.
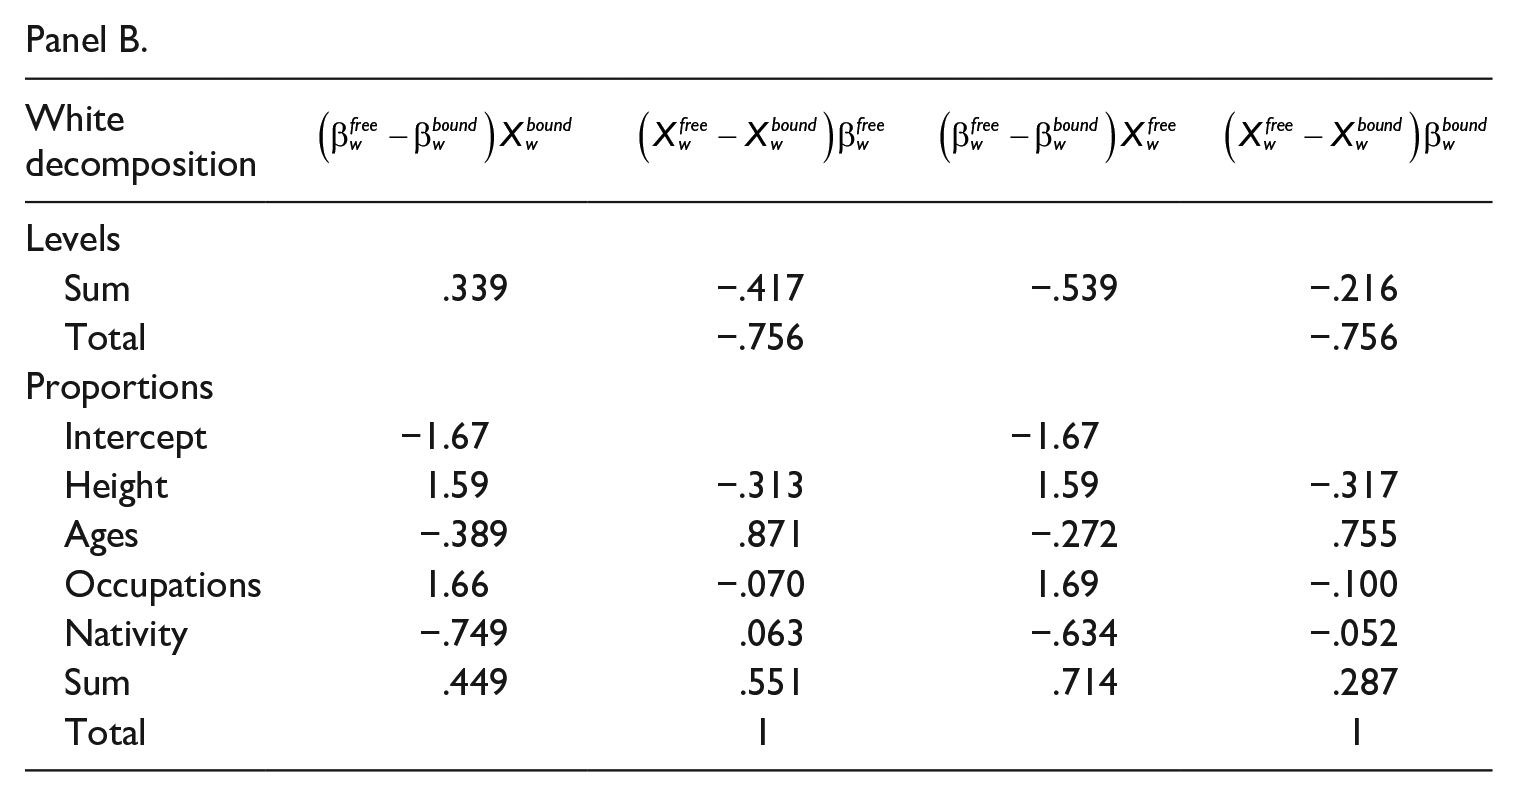
White Within-Group Decomposition
Table 5’s Panel B is the White weight within-group decomposition with the transition to free-labor. Like Blacks, White weights were greater under bound-labor (Columns 2 and 4); however, the White within-group decrease in net nutrition was smaller than Blacks. The source of White weight returns varied with the transition to free-labor, and the White bound-labor autonomous source of differences was greater under bound-labor. Nevertheless, the White, free-labor weight return associated with height was greater after the transition; conversely, average White statures were taller under bound-labor. The White weight-age return was greater under bound labor; however, older Whites were also incarcerated under free-labor. Socioeconomic status was the largest source of the White free-labor weight advantage, and Whites were in occupations with greater weight returns under free-labor. White within-group nativity returns were higher under bound-labor. Like Blacks, White within-group weight differences between free and bound-labor were nearly equally distributed between returns to characteristics and average characteristics.
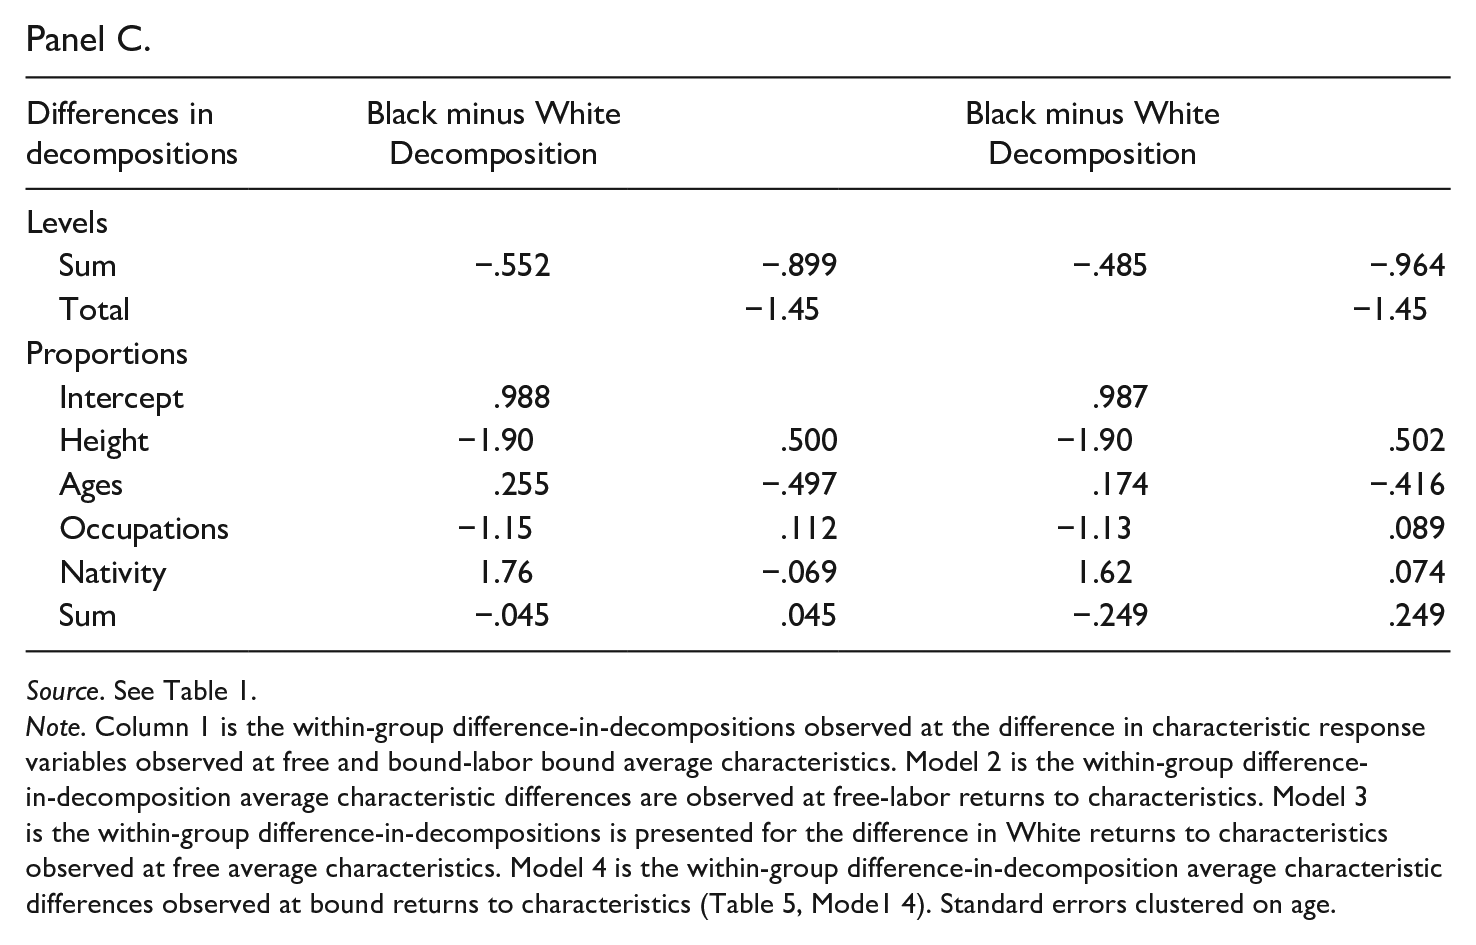
Within-Group Difference-in-Decompositions
Decomposing Black and White weight within-group differences is insightful, and Table 5’s Panel C shows the Black within-group weight advantage decreased with the transition to free-labor. Like the across-group difference-in-decompositions, the source of the difference varied across characteristics. While overall White within-group net nutrition was higher with the transition to free-labor, the within-group autonomous intercept indicates that Black unidentified within-group weight sources improved with the transition to free-labor. The White within-group weight-height advantage was greater under bound-labor, while the Black within-group weight-height advantage was due to relatively taller Blacks incarcerated under free-labor. The Black within-group weight returns advantage with ages and nativity increased more than Whites with the transition; however, composition results are mixed between bound and free-labor. During both periods, Whites were comparatively older, yet the difference is small and varies across nativity. Black–White weight return differences by socioeconomic status favored Whites with the transition to free-labor. In sum, White within-group weight variation was greater for stature and socioeconomic status, nonetheless Black free-labor weight returns were greater for nativity.
As a robustness check, Figure 3 presents within-group difference-in-decompositions at different Black and White counterfactuals. Differences in Black and White weights are comparable within-group model specifications and illustrates that the within-group difference-in-decompositions is robust (Figure 3). Within-group differences are greater with the transition to free-labor. Height is the largest source of weight differences, along with occupations, and Whites had a greater within-group weight advantage under bound-labor. Alternatively, Black weight structural returns were greater under free-labor for nativity and the intercept, indicating the transition to free-labor had significant structural differences within-groups by race.
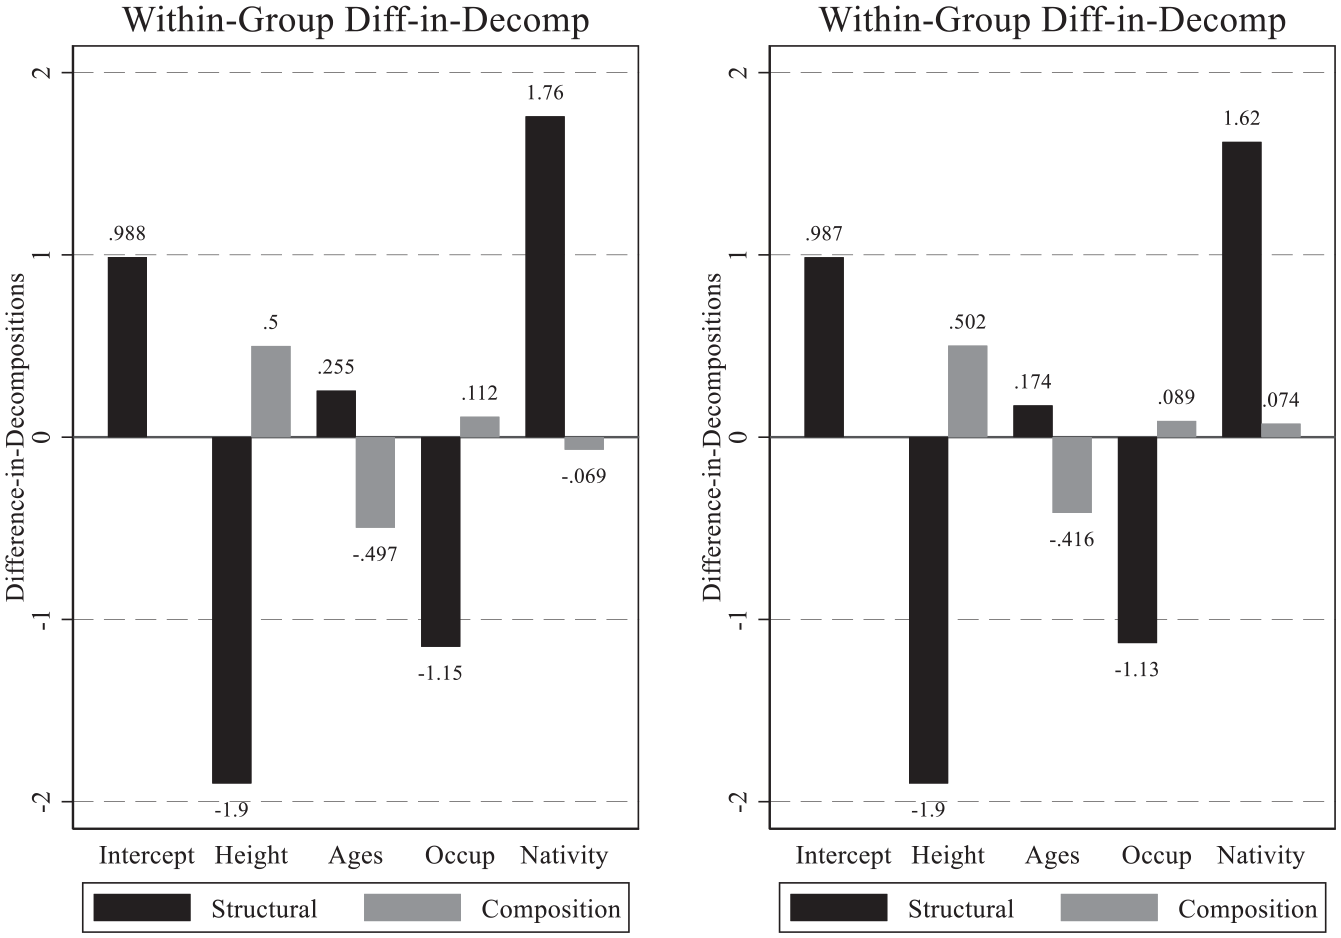
Black–White within-group weight difference-in-decompositions.
Conclusion
In this article, weight is used as a measure for current net nutrition to illustrate the effects of the 19th-century transition from bound to free labor and how it exposed working class Whites to competition from recently freed African-Americans. At the time, there was considerable concern what the labor market effect would be to low skilled Whites. Away from the Civil War itself, the greatest race-related conflagration in U.S. history was the 1863 summer race riot in lower Manhattan, where lower socioeconomic status Whites—many of them recently arrived Irish immigrants—were unwilling to fight to free African-Americans, in part, because they believed free-Blacks would increase competition with them for low skilled occupations. Nonetheless, this study shows that working class Whites was better-off with the transition to free-labor, both across and within racial groups. Slave children’s weight increased more than Whites as they approached entry into the adult slave labor force, and older Black weight gain under bound-labor was lower than under free-labor. At older ages, adult slave weight gain was lower than Whites under bound-labor, extending a new pattern in Black–White biological studies. Under discretion of slave masters, antebellum Black weight gain under free-labor was less than Whites. Agricultural worker’s net nutrition were better than workers in other occupations but were worse-off under free-labor. Nativity had the greatest effect with weight changes and the transition to free-labor, and Black weights after controlling for height and weights were greater under bound-labor. Across-group weight changes were greater than within-group weight changes. For both the across and within-group difference-in-decompositions, Black weights decreased with the transition to free-labor. Therefore, rather than being worse off with the transition, free Whites were made better off with the transition to free-labor.
Footnotes
Appendix
Acknowledgements
I appreciate comments from John Komlos, Lee Carson, and Paul Hodges. Shahil Sharma, Chinuedu Akah, Meekam Okeke, Ryan Keifer, Tiffany Grant, Bryce Harper, Greg Davis, Kellye Manning, and Brandon Hayes provided research assistance.
Declaration of Conflicting Interests
The author(s) declared no potential conflicts of interest with respect to the research, authorship, and/or publication of this article.
Funding
The author(s) received no financial support for the research, authorship, and/or publication of this article.