
Abstract
The current wave of technological change is driven by automation, the process of using computers to improve the labor process, viz., increasing the quantity and quality of work “by means of computer-controlled equipment.” Automation has had and will continue to have heterogeneous economic effects across alternative social groups—altering racial and gender inequality. This study empirically examines the relationship between the racial and gender density of occupations and the probability of automation of both minor and broad occupations. Regression analysis is used to uncover correlations between future employment change and the current racial and ethnic composition of occupations, alerting us to whether future employment growth will have a negative or positive association with occupations where each racial group of workers is currently concentrated. Increases in automation are correlated with increases in labor income inequality and increases in racial and gender employment differences. Male jobs may suffer more technological unemployment than female jobs. Specifically, within each racial group high density male jobs have a greater probability of automation (and lower probability of future demand) than high density female jobs. High density White female jobs appear to be most complementary to automation, while the high density occupations of racial minority men appear to be least complementary to automation.
Persistent, rapid, and ubiquitous technological change is a defining characteristic of capitalist economies (Marx, 1887; Schumpeter, 1942). Technological change increases productivity, profitability, and revolutionizes the knowledge, skills, and abilities required of workers. The productivity growth caused by technological change establishes higher limits for workers to bargain for higher wages, a greater of volume of employment, and a reduction in racial inequality (Autor, 2014; Botwinick, 2018; Williams & Kenison, 1996). For example, during 1945–1973, worker earnings increased with technological change and concomitant productivity growth; and, there was a decrease in racial inequality. But, productivity growth is not always accompanied by an increase in the average earnings of workers and a decrease in racial and other inequality. During the years since the 1974–1975 and 1981–1982 recessions, worker earnings have failed to keep pace with productivity growth and racial inequality has increased. Technological change alters the distributions of occupations and tasks as new occupations expand throughout the economy, obsolete occupations are pushed out of the economy, and demand increases for some occupations. Changes in the composition of occupations and tasks might have uneven effects on different groups of workers.
The current wave of technological change is driven by automation, the process of using computers to improve the labor process, viz., increasing the quantity and quality of work “by means of computer-controlled equipment (Frey & Osborne, 2017).” Automation will continue to change the nature of work (the distribution of tasks and the demand for worker capabilities), the composition of employment, and the distribution of income (Bakhshi et al., 2018; Frey & Osborne, 2017; U.S. Bureau of Labor Statistics, 2017a,b). Automation has had and will continue to have heterogeneous economic effects across alternative race–gender groups. This is so because the distribution of occupations varies by the race–gender identity of workers.
We were unable to locate a prior empirical study examining the impact of automation on the racial composition of occupations, though there are studies that have examined the impact of automation on the gender composition of jobs (Brussevich et al., 2019; Hegewisch et al., 2019; Madgavkar et al., 2019). For example, Brussevich, et al., report that for a sample of 30 countries (28 OECD countries plus Cyprus and Singapore), women face a higher probability of automation than men. Japanese, Singaporean, and South Korean women face a higher probability of technological displacement than men. Male workers face a greater likelihood of automation than women workers in Sweden and Finland. Similar proportions of men and women in France, the United Kingdom, and the United States are at risk of automation. Based on analysis of 10 countries that account for about 60% of global GDP (Canada, China, France, Germany, Japan, Mexico, India, South Africa, the United Kingdom, and the United States), Madgavkar et al. (2019) find that automation will cause about 20% of both men and women to lose their jobs. Similarly, the rising demand for labor caused by automation will generate about 20% employment growth for both men and women. Madgavkar, et al., also conclude that the demand for high-wage workers is expected to increase, while the demand of medium- and low-wage workers may decline. Women are employed disproportionately in low-wage occupations. The studies of automation and gender are not disaggregated by race and ethnicity.
This study adds to the literature on automation and the future of work by examining the relationship between automation and race–gender differences in access to employment in the American labor market. In particular, this study identifies the relationship between automation and the race–gender density of occupations during 2014–2034 for African American, Latinx, Asian and Pacific Islander, Native American and Other, and White workers. Latinx is treated as a mutually exclusive racial category, rather than as an ethnic category. After the literature review (section I), the American Community Survey (U. S. Census, 2018), a large nationally representative dataset, is used to document the distribution of occupations by race and gender (section II). We use survey years 2014–2016 to ascertain the racial and gender density of occupations. Secular estimates of the impact of automation on occupations are supplied by published studies on the impact of computerization on the composition of occupations. Expected occupational changes due to automation are matched against the racial and gender densities of occupations (section III). Section IV concludes with a discussion of the study's results.
Automation and Labor Market Outcomes
Some production tasks are easier to automate than others. Tasks “most amenable to computerization are those that follow explicit, codifiable procedures—such as multiplication—where computers now vastly exceed human labor in speed, quality, accuracy and cost efficiency (Autor, 2014, p. 129).” On the other hand, tasks that “demand flexibility, judgment and common sense—skills that we understand only tacitly—for example, developing a hypothesis or organizing a closet” are far less amenable to automation (Autor, 2014, p. 129). The latter tasks are complementary to automation.
Manyika et al. (2017) divide the U.S. labor force into 800 occupations with 2,000 tasks or activities. They use O*NET to synthesize 18 worker capabilities to produce each task.
1
These capabilities are grouped into five broad areas: sensory perception; natural language processing (natural language generation, natural language understanding); social and emotional capabilities (social and emotional sensing, social and emotional reasoning, emotional and social output); physical capabilities (fine motor skills/dexterity, gross motor skills, navigation, mobility); and, cognitive capacities (retrieving information, recognizing known patterns/categories {supervised learning}, generating novel patterns/categories, logical reasoning/problem solving, optimizing and planning, creativity, articulation/display output, coordination with multiple agents).
Advances in robotics, artificial intelligence, and machine learning affect the pace of automation and which tasks will be automated. Manyika, et al., find that less than 5% of occupations consist of activities (tasks) that are fully automatable. But, 62% of occupations have tasks that are at least 30% automatable and 42% of occupations have activities that are at least 50% automatable. Processing or collecting data or performing physical activities and operating machinery in a predictable environment are activities with a high potential for automation. Activities requiring face to face interactions with customers, expert decision-making, planning and creative tasks, and managing and developing people are far less susceptible to automation.
The accommodations and food services, manufacturing, transportation and warehousing sectors have a high percentage of occupations requiring predictable physical activities; hence, 73%, 60%, and 60%, respectively, of activities performed in these sectors have potential for automation (Manyika et al., 2017, p. 7). Fifty-seven%, 53%, and 51% of tasks in agriculture, retail trade, and mining, respectively, have potential for automation. Sectors with the least potential for automation include: real estate (40%), administrative (39%), health care and social assistances (36%), information (36%), professionals (35%), management (35%), and educational services (27%). This study concludes that one-half of today's economic activities may be automated by 2055, or roughly sometime between 2035 and 2075.
Machine Learning
Developments in machine learning strongly suggest that computing algorithms will be developed with the sophistication to substitute for nonroutine cognitive and manual tasks. The employment of “skilled knowledge workers whose jobs involve data-driven decision-making” will also be affected by artificial intelligence (Henry-Nickie, 2017, p. 1). Consider chess, a complex game of strategy. It requires spatial thinking and the ability to think many interactions forward for each of one's own 16 pieces and the 16 pieces of one's opponent. On May 11, 1997 IBM's computer Deep Blue defeated Garry Kasparov, considered by some to be the greatest chess champion of all time (IBM, 2011). IBM moved on from building a computer capable of complex computational calculations in a strategic environment to building Watson, a competitive question answering computer. On January 13, 2011 Watson participated in Jeopardy, an elite game show requiring rapid answers to unanticipated questions from broad areas of history, culture, sports, politics, books, mathematics, science, etc. Watson defeated Jeopardy's two greatest champions. The team that built Watson “initially said no, it's a silly project to work on, it's too gimmicky, it's not a real computer science test, and we probably can't do it anyway (Best, 2018).” They thought a quiz-answering computer could not compete with humans. They were wrong. Project Debater, another IBM computer, debated two world renown debate champions on June 18, 2018. “An audience survey taken before and after each debate found that Project Debater better enriched the audience's knowledge as it argued in favor of subsidies for space exploration and in favor of telemedicine, but that the human debaters did a better job delivering their speeches (Newcomb, 2018).” Project Debater even made jokes during the debate. The computer received its knowledge from hundreds of millions of journal articles. Deep Blue, Watson, and Project Debater are computers with the capacity to disrupt the labor process of workers with the highest capabilities, viz., doctors, lawyers, engineers, economists, game theorists, etc.
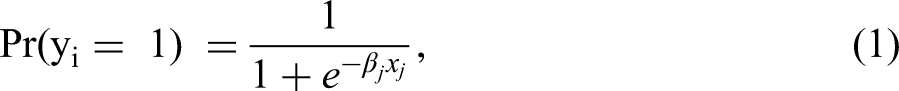
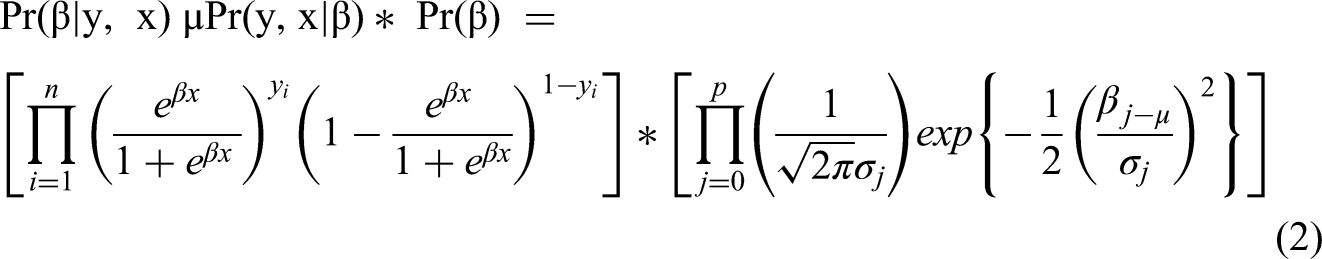
A collection of economists, computer scientists, and engineers affiliated with Oxford University have pioneered new mathematical models for understanding the impact of automation on labor market outcomes (Bakhshi et al., 2018; Frey & Osborne, 2017). The objective is to use worker capabilities or “features” to predict the probability an occupation is automatable. One way to accomplish this goal is to fit a logistic probability distribution function to estimate the probability an occupation is automatable,
Frey and Osborn predict fewer occupations in the middle range of capabilities. In contrast to Autor et al. (2003), Frey and Osborn (FO, hereafter) argue that technological change (automation) affects both routine and non-routine jobs and manual and cognitive jobs. Automation of occupations is limited only by engineering blockages in the use of computers to carry out some tasks associated with jobs. FO argue that the elimination of engineering bottlenecks will allow computers to substitute for nonroutine tasks. The ability to eliminate such bottlenecks sets the limit on the ability of computers to substitute for nonroutine tasks.
FO identify three classes of engineering bottlenecks: perception and manipulation tasks, creative intelligence tasks, and social intelligence tasks. 2 Some of these engineering bottlenecks may be eliminated via the simplification of tasks. O*NET is employed to find empirical proxies of these engineering bottlenecks and then these proxies are used to predict the probability an occupation is automatable. FO use the 2010 O*NET to pair occupational characteristics with 702 six-digit Standard Occupational Classificaiton (SOC) codes. 3 They also link SOC wage and employment data to the 702 six-digit occupations.
Frey and Osborn (together with a group of machine learning researchers) “hand-labeled 70 occupations, assigning 1 if fully automatable and 0 if not (Frey & Osborne, 2017, p. 263).” Labels were based on visual examination of O*NET tasks and job description of each occupation. An occupation was considered fully automatable if there was an affirmative answer to the question, “Can the tasks of this job be sufficiently specified, conditional on the availability of big data, to be performed by state of the art computer-controlled equipment (Frey & Osborne, 2017, p. 263).” Labels were assigned only to occupations about which researchers were most confident.
The conceptual bottlenecks to automation and associated O*NET proxies are: perception and manipulation = {finger dexterity; manual dexterity; cramped work space, awkward positions}; creative intelligence = {originality, fine arts}; and, social intelligence = {social perceptiveness, negotiation, persuasion, assisting and caring for others}. Each O*NET variable has “importance” and “level” ratings. Importance ratings are low, medium, and high with a range of 1–5. FO use the level rating to establish rank occupational features. Although the level scale has a range of 0–7, O*NET standardizes these rating to a score between 0 and 100. The 70 occupations, labeled automatable (y = 1) or non-automatable (y = 0), and 9 O*NET occupational features are the training data used to generate the optimal weights for combining occupational features to predict the probability an occupation is automatable. The feature weights from the training data are applied to the features of all other occupations to derive the probabilities of computerizing all 702 occupations.
Bakhshi, Downing, Osborne, and Schneider (BDOS hereafter) also use a sample of occupations labeled by machine learning experts as automatable or not automatable. Rather than limiting their analysis to 9 O*NET features to measure three bottlenecks to automation, BDOS use 120 O*NET features to predict the probability of automation. The training dataset, that is, the subset limited to the sample of occupations labeled as automatable or not automatable by experts, contains labels for each occupation from each individual expert, rather than a group consensus. Additionally, BDOS capture expert uncertainty in their model. Each expert described the confidence of their label by using a choice from an ordinal list {0, . . ., 9}. This uncertainty is incorporated into the classification algorithm. The BDOS analysis yields predictions for the probability of future demand, the average derivative of worker features, complementary and anti-complementary features, and new occupations likely to arise in the future utilizing features that are increasing in demand.
The Standard Occupational Classification (SOC) system was established by the US Bureau of Labor Statistics. Military jobs are included within SOC categories, but they are excluded from this study. The most general level of occupations are the 23 major occupational groups. The major SOC codes are 11-0000, 13-0000, 15-0000, 17-0000, 19-0000, …, 55-0000, which are Management Occupations, Business and Financial Operations Occupations, Computer and Mathematical Occupations, Architecture and Engineering Occupations, Life, Physical, and Social Science Occupations, …, Military Specific Occupations, respectively. The major occupations are separated into 98 minor occupational groups. These minor groups are further decomposed into 459 broad occupations. Finally, the 459 broad occupations are decomposed into 867 detailed occupational groups. There is an increase in descriptive specificity as SOC codes expand from the major to minor to broad to detailed occupations. Higher values of the BDOS probability of future demand due to automation means that a minor occupation is either resistant to automation or employment increases with the automation of other occupations. The FO probability of automation indicates the likelihood a broad occupation is “potentially automatable over some unspecified number of years, perhaps a decade or two (page 38).”
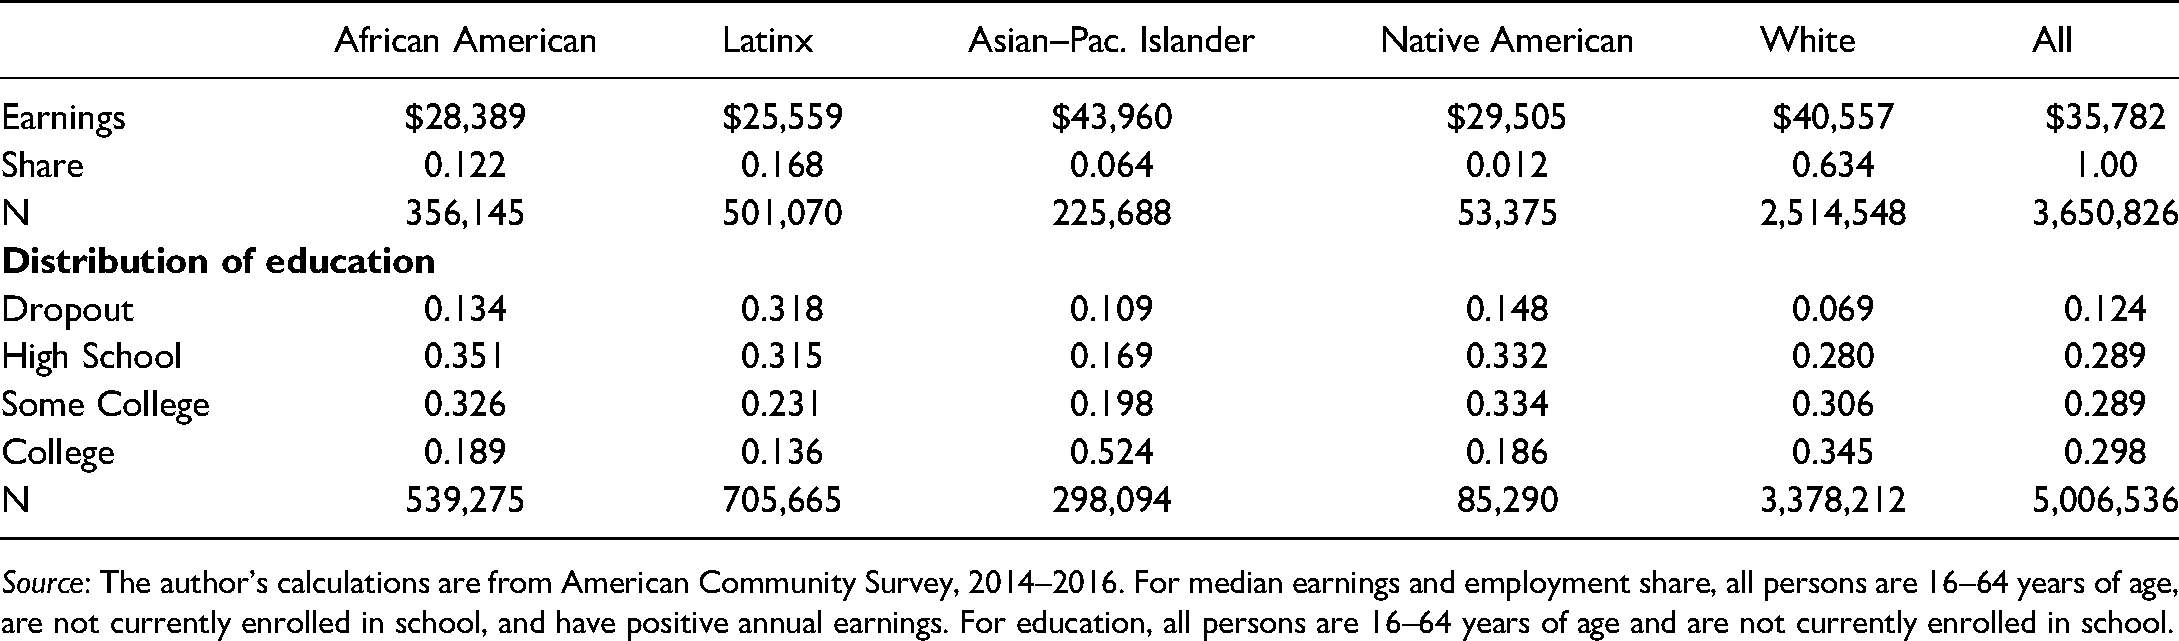
African Americans and Latinx are 12.2% and 16.8% of the United States workforce, respectively, while Asian–Pacific Islanders and Native Americans are 6.4% and 1.2%, respectively (Table 1). White workers are 63.4% of the workforce.
Population Share, Mean Annual Earnings, and Educational Distribution by Race.
Population Share, Mean Annual Earnings, and Educational Distribution by Race.
Source: The author's calculations are from American Community Survey, 2014–2016. For median earnings and employment share, all persons are 16–64 years of age, are not currently enrolled in school, and have positive annual earnings. For education, all persons are 16–64 years of age and are not currently enrolled in school.
Latinx ($25,559), African American ($28,389), and Native American ($29,505) workers have below average median earnings. Asian–Pacific Islanders and Whites have the highest median earnings, $43,960 and $40,557, respectively. The median African American, Native American, and White worker has more than 12 years of education (“Some College”), though the median Latinx worker has 12 years of education (“High School”). The median Asian–Pacific Islander has at least 16 years of education (“College”).
Native American (−0.365), Latinx (−0.590), and African American (−0.466) employment densities have a strong negative correlation with the median wage of minor occupations (Table 2). White and Asian–Pacific Island employment densities have positive correlations with the median wage of minor occupations, 0.643 and 0.246, respectively. African American and Latinx employment densities have the largest positive correlation (0.255), while White and Latinx employment densities have the largest negative correlation (-0.818).
Correlation Matrix: Employment Density and Median Wage, minor Occupations.

Source: The author's calculations are from American Community Survey, 2014–2016.
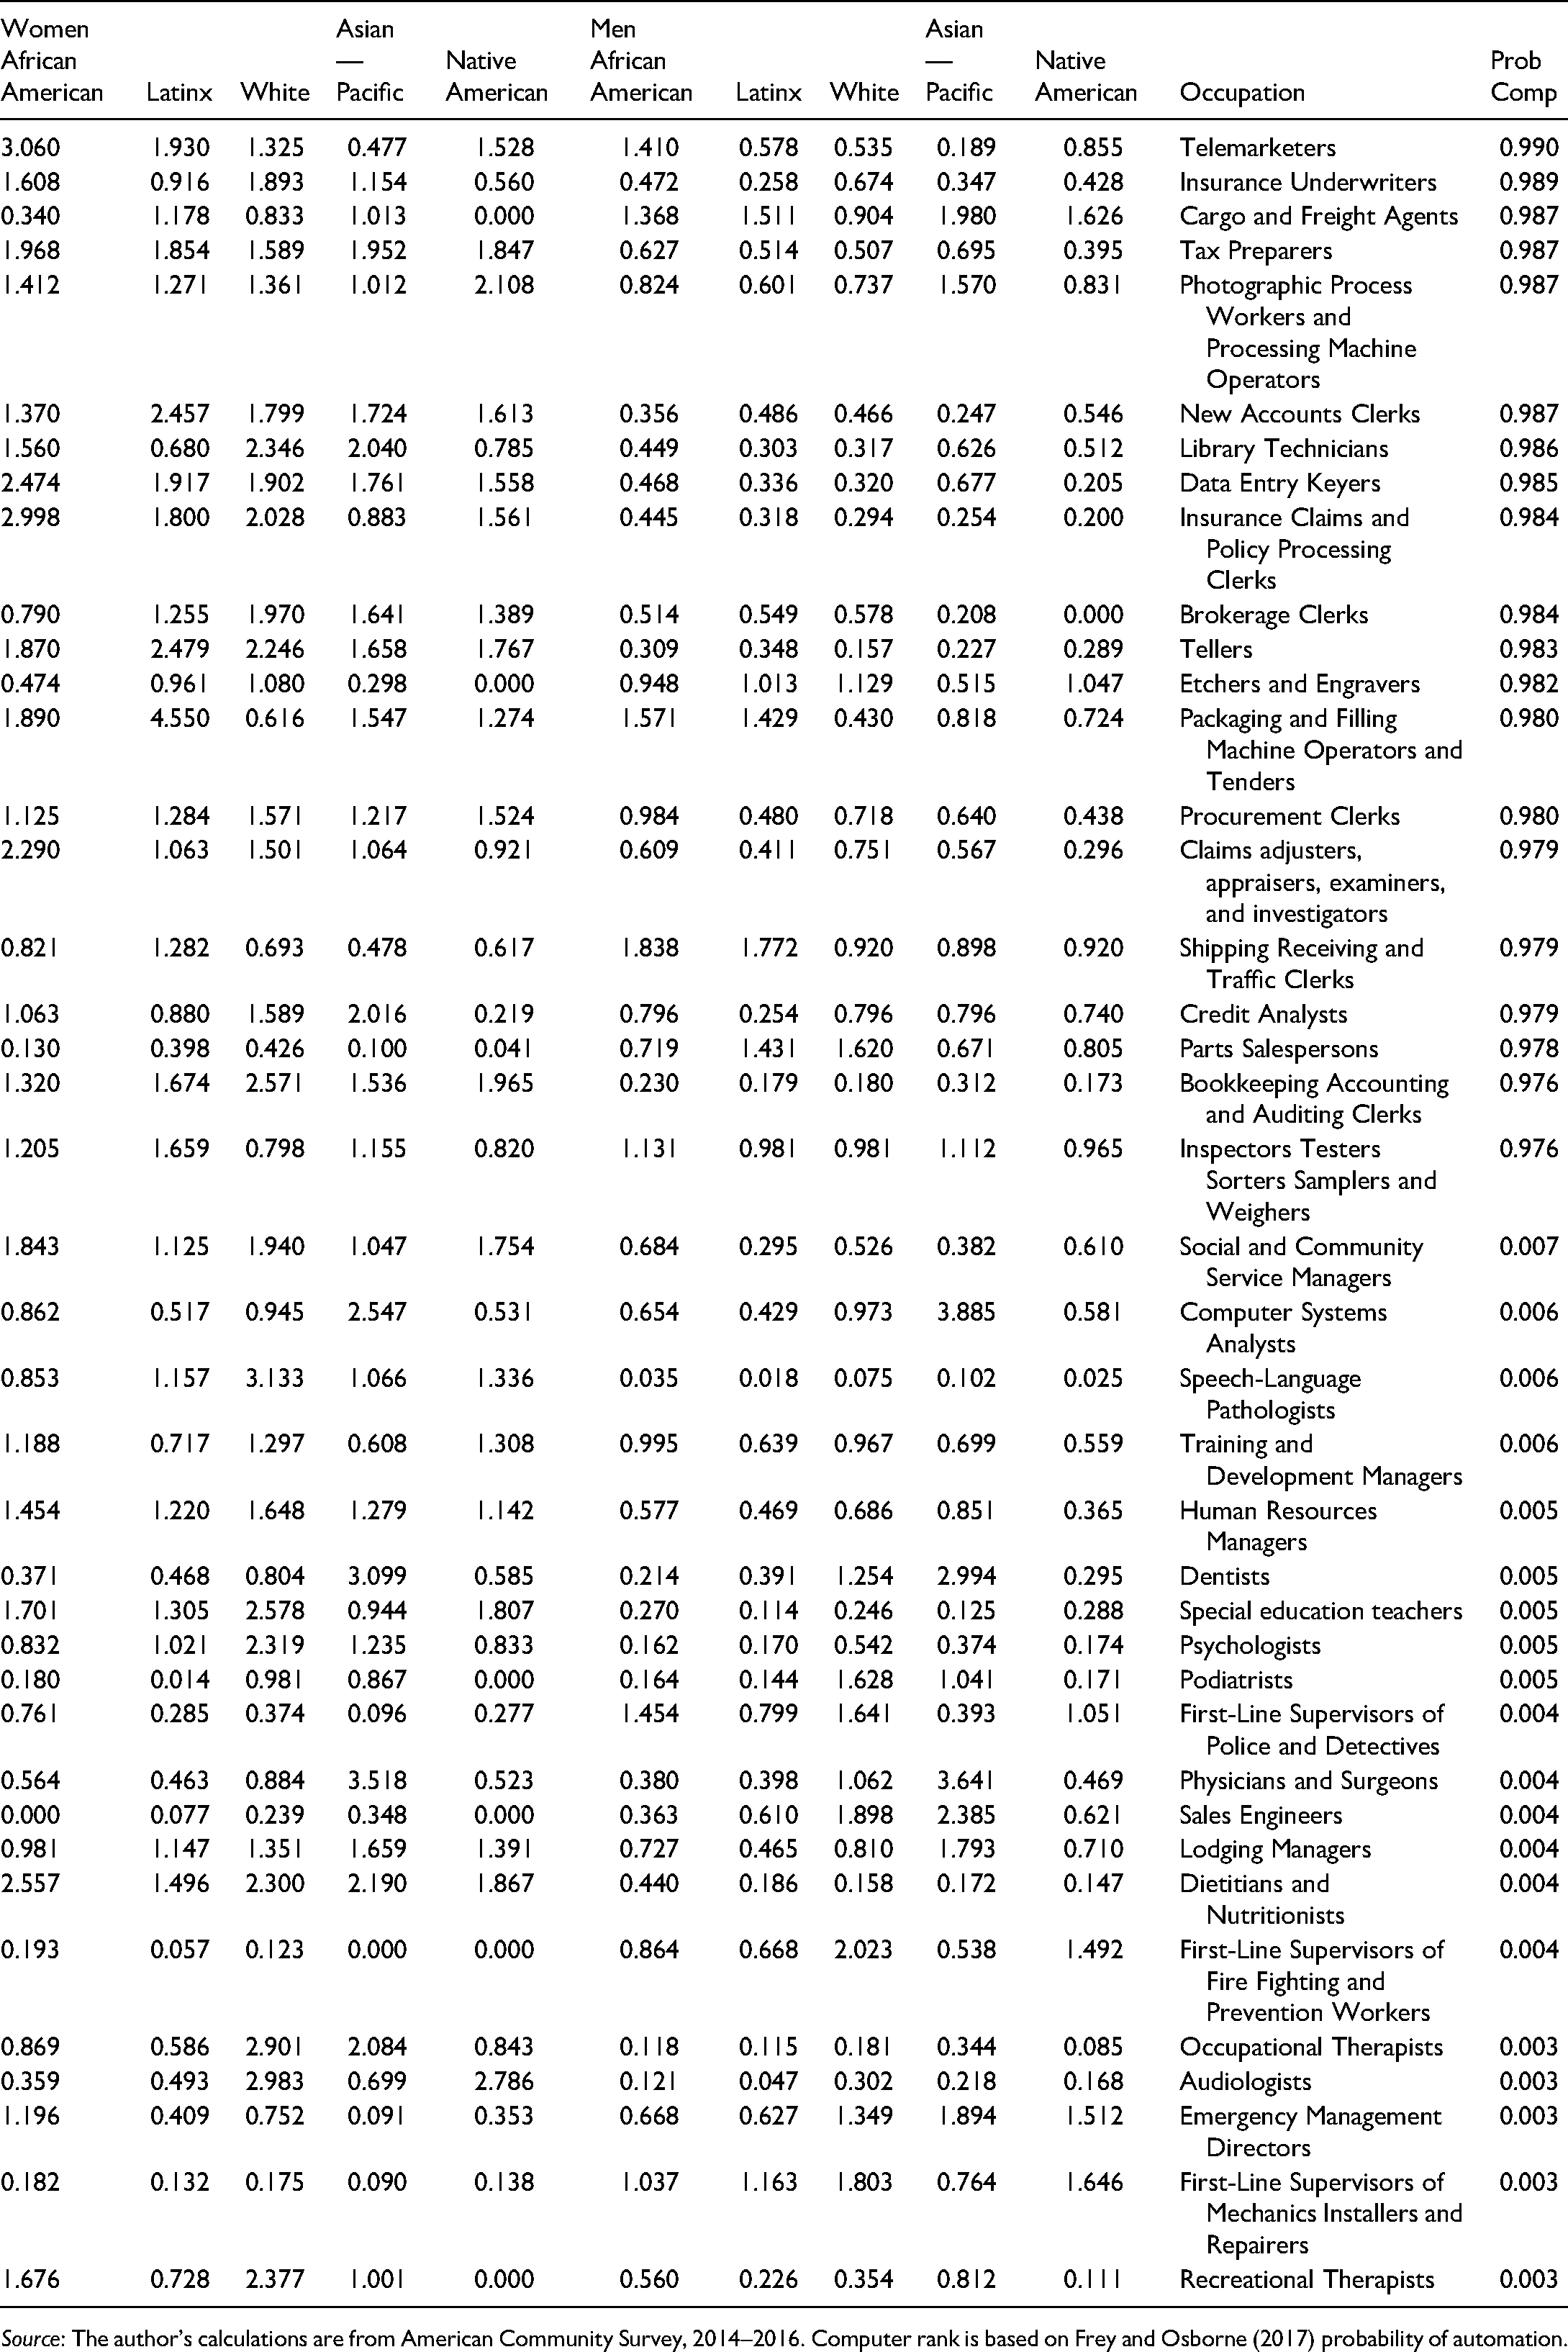
For the 20 occupations with the highest probability of automation and the 20 occupations with the lowest probability automation, relative employment representation by race–gender groups is presented in Tables 3 and 4. For each occupation, the group's employment share is divided by the group's representation in the labor force. Each detailed occupation is assigned the Frey-Osborn probability of computerization. For example, the probability of computerizing telemarketers is 0.99. African American women are strongly over-represented among telemarketers; their share of telemarketing jobs is three times their share of the labor force. For each race–gender group, women are two–three times as likely to be telemarketers as men. Hence, computerization of telemarketers will have a disproportionately negative effect on women, especially African American, Latinx, White, and Native American women. By contrast, men are over-represented among cargo and freight agents. Asian–Pacific Islander males are nearly twice as likely to be cargo and freight agents as they are to be represented in the labor force, while Asian–Pacific Islander women's employment share as cargo and freight agents is about the same as their representation in the labor force. Computerization of this occupation will have a higher effect on men than women.
Employment Representation by Race–Gender and Occupation: High Probability of Computerization.
Employment Representation by Race–Gender and Occupation: High Probability of Computerization.
Source: The author's calculations are from American Community Survey, 2014–2016. Computer rank is based on Frey and Osborne (2017) probability of automation.
Social and community service managers is an occupation with a low probability of computerization. For each race–gender group, women are two–three times as likely to be employed in this occupation as men. First line supervisors of police and detectives is also an occupation with a low probability of computerization. Men two–four times more likely work in this occupation than women of the same racial group. In particular, African and White men are strongly over-represented relative to their share of the labor market and relative to their female counterparts. American and White males are more likely to benefit from the fact that this is an occupation with a low probability of computerization. Finally, recreational theorists is the occupation with lowest probability of computerization and women are over-represented in this occupation, especially African American and White women.
We combine information on the racial and gender composition of occupations with the FO probability of automation of detailed occupations and the BDOS probability of increase in demand for the occupational share of each minor occupation. The occupational employment density for each group is alternatively regressed against the FO probability of automation and the BDOS probability of future demand. These are not causal regressions. Rather, the regressions uncover correlations between future employment change and the current racial and gender composition of occupations, alerting us to the nature and extent of correlations between automation-induced changes in future employment and the racial and gender densities of current occupations.
Each percentage point increase in the FO probability of automation of a detailed occupation is associated with higher employment densities of African Americans (0.0515% points), Latinx (0.105% points), and Native Americans (0.004) ( Table 5). 4 The employment density of Whites and Asian–Pacific Islanders declines by 0.125% points and 0.035% points, respectively, for each percentage point increase in the FO probability of automation of a detailed occupation. There is a negative relationship between the BDOS probability of future demand for workers in minor occupation and the employment densities of African Americans (−0.0516% points), Latinx (−0.139% points), and Native Americans (−0.0177). However, White and Asian–Pacific Island employment densities increase by 0.144% points and 0.% points, respectively, for each percentage point increase in the probability of growth in the occupation's share of employment.
Density Regressions by Occupation and Probabilities of Automation and Future Demand.
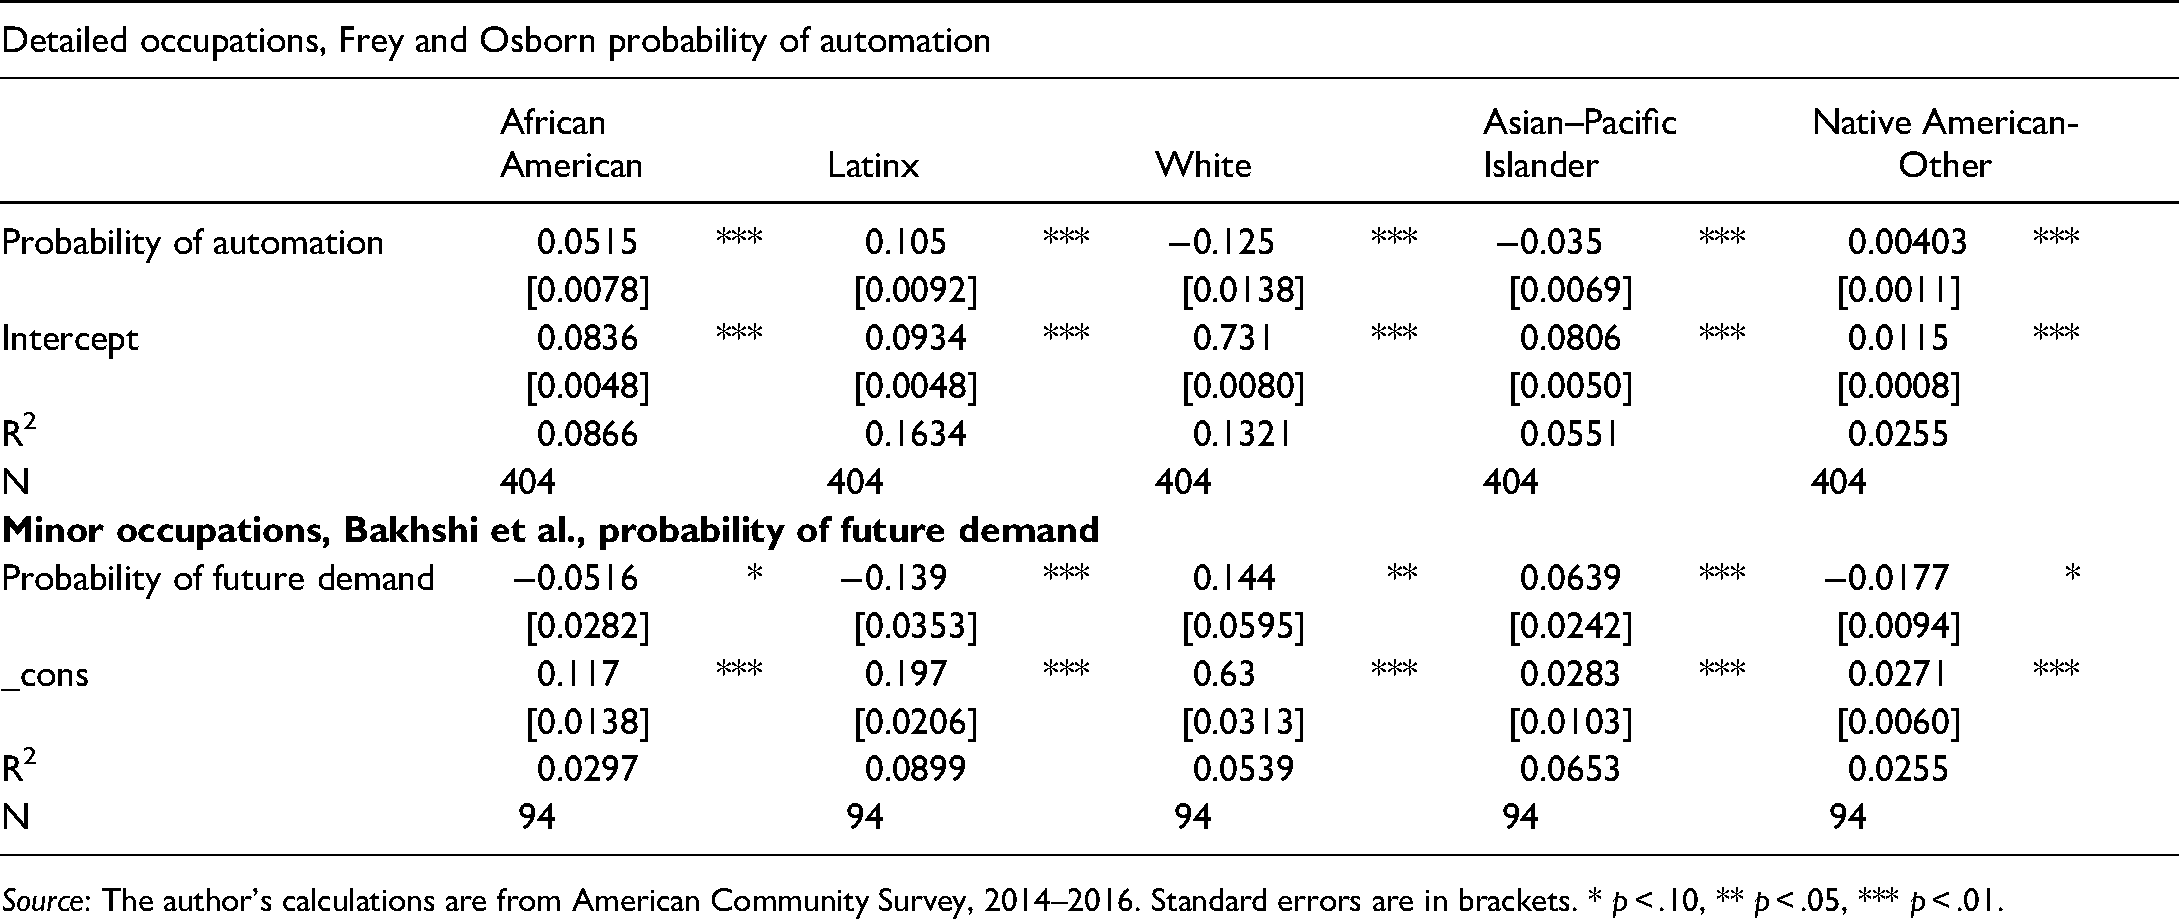
Source: The author's calculations are from American Community Survey, 2014–2016. Standard errors are in brackets. * p < .10, ** p < .05, *** p < .01.
Race–Gender Density Regressions by Occupation and Probabilities of Automation and Future Demand.
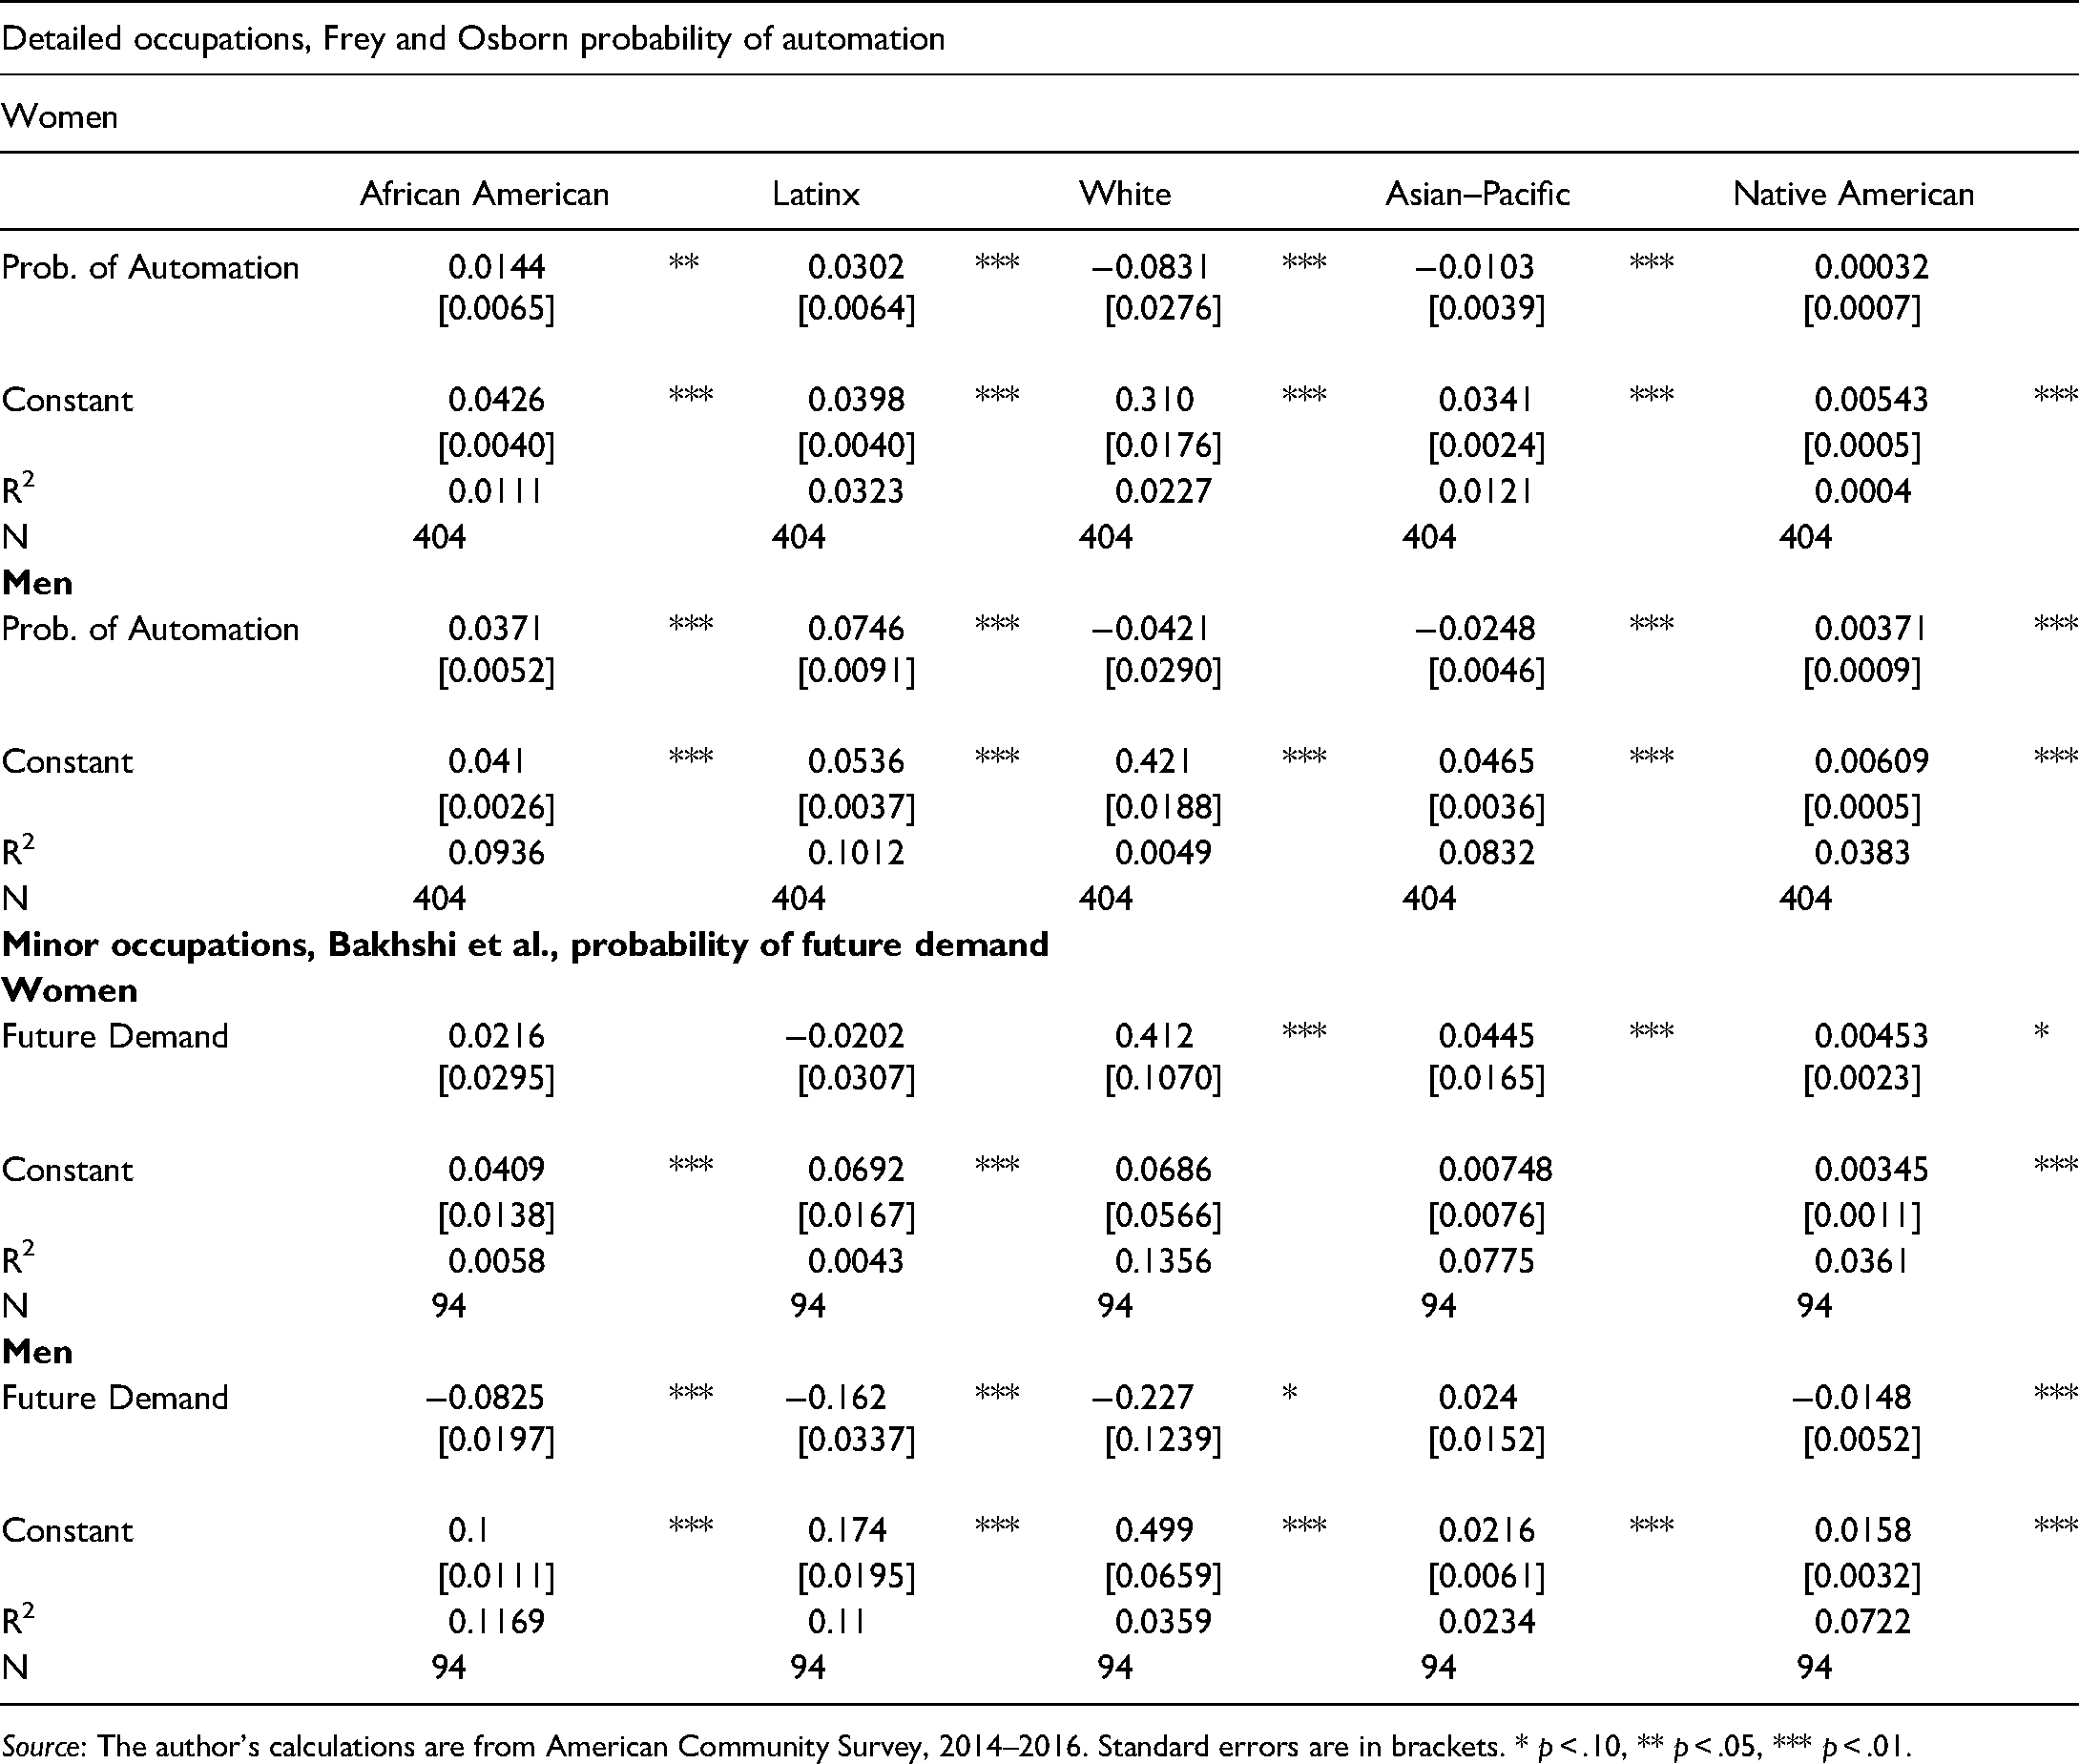
Source: The author's calculations are from American Community Survey, 2014–2016. Standard errors are in brackets. * p < .10, ** p < .05, *** p < .01.
Median ln(Wage) Regressions.
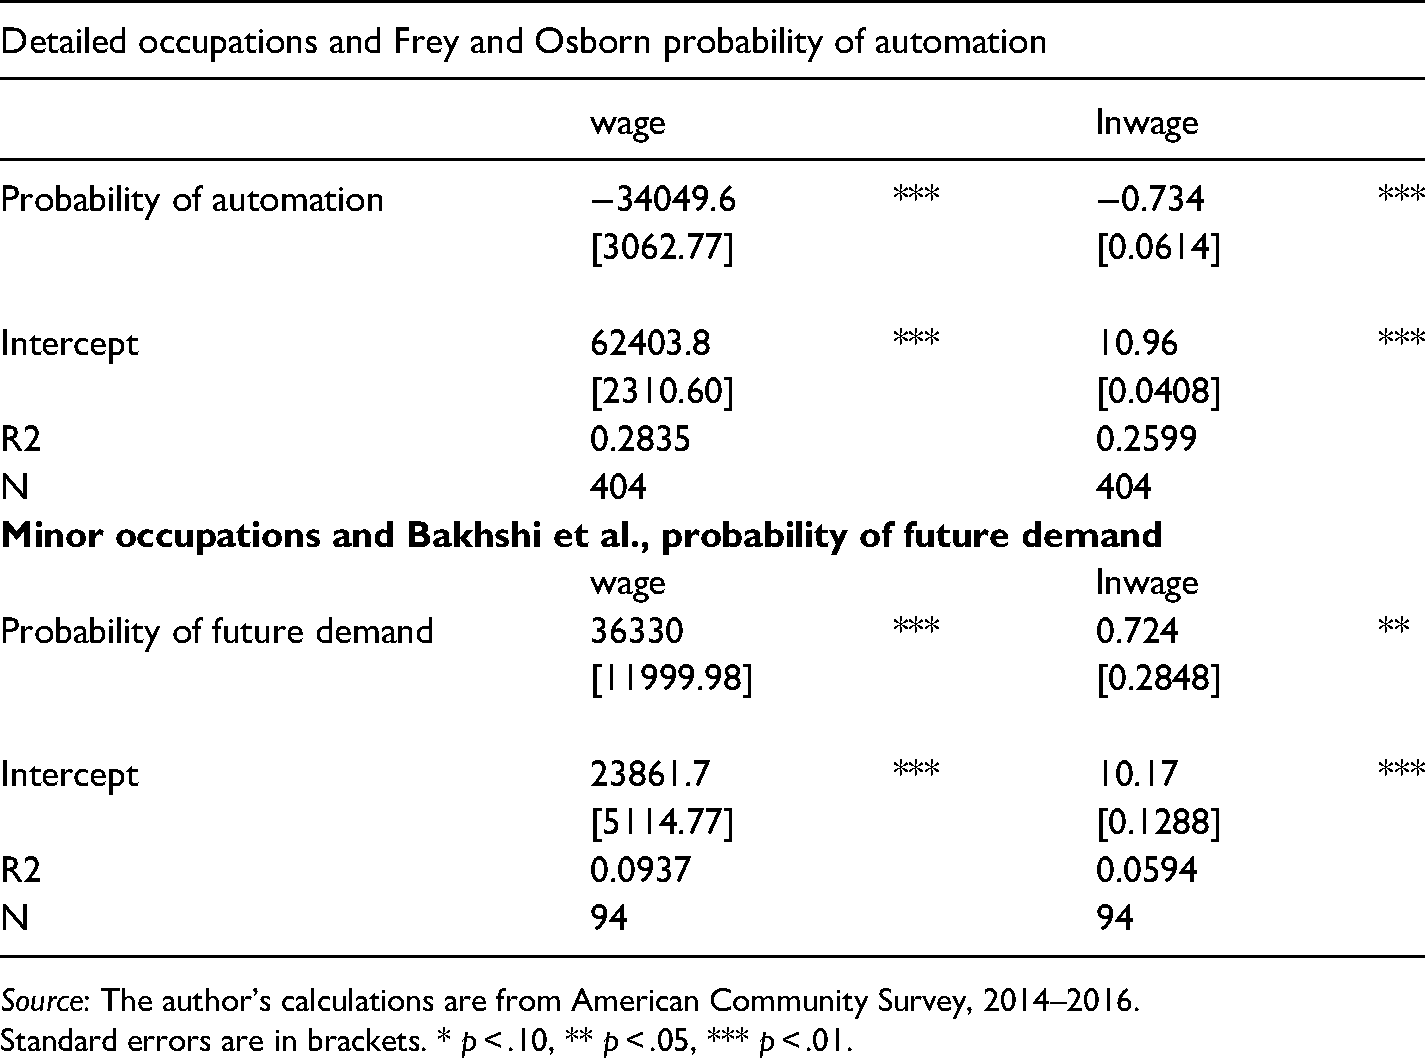
Source: The author's calculations are from American Community Survey, 2014–2016.
Standard errors are in brackets. * p < .10, ** p < .05, *** p < .01.
Computerization is correlated with larger employment reductions for men than for women (Table 6). Each percentage point increase in the FO probability of automation of a detailed occupation is associated with higher employment densities of African American women (0.0144% points) and Latinx women (0.% points). There is no significant effect on the employment density of Native American women. The employment density of White and Asian–Pacific Island women declines by 0.0831% points and 0.% points, respectively, for each percentage point increase in the FO probability of automation of a detailed occupation. By comparison, each percentage point increase in the FO probability of automation of a detailed occupation is associated with much higher employment densities of African American men (0.0371% points), Latinx men (0.0746% points), and Native American men (0.0071). The employment density of White men is uncorrelated with the probability of automation, while Asian–Pacific Island male employment density declines by 0.0421% points (one-half the size for Asian–Pacific Island women) for each percentage point increase in the FO probability of automation of a detailed occupation.
There is a negative relationship between the BDOS probability of future demand for workers in minor occupation and employment densities of African American men (−0.0825% points), Latinx (−0.162% points), and Whites (−0.277). There is no significant effect for Native American men. There is a positive relationship between the BDOS probability of future demand for workers in minor occupation and employment densities of White women (0.412), Asian–Pacific Island women (0.0445), and Native American women (0.0045). There is no significant effect for African American and Latinx women.
There is negative correlation between the FO probability of automation and median wages for detailed occupations (Table 6). Each percentage point increase in the FO projected probability of automation is associated with a 0.73 lower median wage, suggesting greater automation among detailed occupations with lower median wages. There is positive correlation between the BDOS probability of future demand and median wages for minor occupations in the city of Gary. Each percentage point increase in the BDOS probability of future demand is associated with 0.72% higher median wage, suggesting automation will yield faster employment growth among occupations with higher median wages.
Increases in automation are correlated with increases in labor income inequality and increases in racial and gender employment differences across occupations. There is no reason to believe that these increases in inequality outcomes will be temporary changes that are quickly corrected by self-adjusting market forces. Previous research has shown that automation has a standardization bias, that is, the routine elements of both manual and cognitive tasks of occupations have the greatest probability of being automated. Non-routine—cognitive tasks are complementary to automation.
The FO probability of automation has a positive correlation with the employment densities of racial groups with the lowest median wages (African Americans, Latinx, and Native Americans) and a negative correlation with the employment density of racial groups with the highest median wages (Asian–Pacific Islanders and Whites). Similarly, the BDOS probability of future demand has a negative correlation with African American, Latinx, and Native American employment density, which indicates that it is likely that there will be greater employment growth in occupations with relatively fewer African Americans, Latinx, Native American workers but relatively more White and Asian–Pacific Islander workers.
Male jobs may suffer more technological unemployment than female jobs. Specifically, within each racial group high density male jobs have a greater probability of automation (and lower probability of future demand) than high density female jobs. High-density White female jobs appear to be most complementary to automation, while the high density occupations of racial minority men appear to be least complementary to automation.
The probability that an occupation is automated decreases with the median wage of an occupation, while the probability of future demand is positively correlated with the median wage of an occupation.
Automation will produce an expansion of some occupations and an increase in unemployment for some persons. Some of those subject to technological joblessness may match the characteristics of workers in expanding occupations. Likewise, some workers are employed in occupations subject to technological unemployment do not match the characteristics of workers in expanding occupations. These workers will need employment training and employment creation.
Computers will continue to substitute for laboring tasks; hence, workers need employment flexibility. There is a well-developed professional literature documenting the positive relationship between formal years of education and labor market outcomes, in particular, wages, occupational mobility, and the probability of employment. There is a strong positive correlation between years of education and worker characteristics that are complementary to automation. Hence, as a first step to protect workers whose features are anti-complementary to automation, governing bodies must commit themselves to totally creating jobs and eliminating high school dropouts. The African American dropout rate is about 5% points higher than the White dropout rate, while the dropout rate for Latinx is exceptionally high in all cities. Additionally, municipalities must improve access to post-secondary education, perhaps with free public education for 14 years (high school plus 2 years of college). This might be accomplished in part by municipalities engaging in joint ventures with other cities and universities to provide extensive computerized education. YouTube does this already. Finally, curriculum content should be developed to increase the quantity and quality of high demand features.
Footnotes
Declaration of Conflicting Interests
The author(s) declared no potential conflicts of interest with respect to the research, authorship, and/or publication of this article.
Funding
The author(s) disclosed receipt of the following financial support for the research, authorship, and/or publication of this article: Research for this study was conducted under the direction of the African American Mayors Association, Future of Work Initiative sponsored by Google.org.