
Abstract
The inquiry in this paper has two parts: (1) an examination of potential disparities in exposure to airport noise pollution between Blacks (non-Hispanic) and Whites (non-Hispanic) around the Atlanta Hartsfield-Jackson airport (AHJA) area, and (2) a binary logistic regression analysis studying factors contributing to these disparities. The proposed model is that the difference in noise exposure measured by Net Exposure Difference score is a function of the degree of Black-White residential segregation; differences in poverty rates between Blacks and Whites; some socio-economic-demographic variables and four health indicators - noise annoyance (NA); sleep disturbance (SD); hearing impairment (HI); and cardiovascular disorder (CVD).
A stratified random sampling method and telephonic survey using a 43-questions questionnaire among the adult households around the AHJA area produced 237 observations on Black and White households over a period of 2 years.
Parameter estimates reveals disparities in exposure to aircraft noise exposure between the Black and White households within the 10-mile radius of the airport area indicating environmental injustice. The odds-ratios from the binary logistic regression suggests residential segregation, difference in poverty rates, race, education, as well as health conditions like hearing impairment and sleep disturbances have a statistically significant association with this disparity in noise exposure.
Background
For several decades, there has been efforts to study the relationship between race, ethnicity, income, and potential exposure to environmental hazards or problems (Sheppard et al., 1999). Some micro-area studies comparing tracts or block groups having one or more environmental hazards with tracts that have none—have found that race is not a significant factor in these settings, but income especially low-income tracts tend to be associated with an undesirable pollution source (Anderton et al., 1997). However, if the exposure area is meso-area, expanded to include census tracts adjacent to the facility in question, then race and ethnicity appear more important and low income recedes as a risk factor (Lopez, 2002). It is time to explore the link between segregation and health disparities!
The Center for Disease Control and Prevention (CDC, 2015) defines health disparities (HD) as preventable differences in the burden of disease, injury, violence, or opportunities to achieve optimal health that are experienced by socially disadvantaged populations. Health disparities is based on two theories—(1) Spatial Assimilation Theory (SAT) and (2) Place Stratification Theory (PST). The SAT claims that people live in a non-assimilated way because of socio-economic and cultural deprivation. On the other hand, PST indicates that residential segregation is the result of racial discrimination and not of socio-economic disparities. Because of discriminatory ideas and policies of dominant social groups, minorities end up living segregated with resources and opportunities (Iceland & Wilkes, 2006).
Several studies have examined the impact of segregation on the health of Blacks. Most of these studies postulate that increased segregation leads to increased stress, which in turn leads to ill health, or that segregation results in a lack of services that eventually affects the health of Blacks (Acevedo-Garcia, 2000; Collins & Williams, 1999; Fiscella & Franks, 1997; Kennedy et al., 1997; Peterson & Krivo, 1999; Polednak, 1991; Smith, 1996). Yet, segregation has not been found to be a popular dimension to be included in the study design of environmental justice researchers. The only study that was found to be examining the relationship between segregation and exposure to pollution is that of Lopez (2002). Lopez measured the inequalities in potential exposure to air pollution between Blacks and Whites in large U.S. metropolitan areas and found that in every large metropolitan area, Blacks are more likely than Whites to live in census tracks with higher air toxic concentrations.
In addition to air, water, and land pollution, noise pollution is also an environmental hazard that can have serious health effects. Some of the common noise problems encountered by societies are caused by automobile traffic, factory production, and airplane trafficking around the airports (Berglund & Lindvall, 1995; Karsdorf & Klappach, 1968). Aircraft noise causes more annoyance compared to noise from road and railway traffic because of its intermittent and unpredictable character (Miedema & Oudshoorn, 2001). Noise exposure increases with urbanization and most industrialized nations as well as developing nations in the twenty-first century will be experiencing high degree of noise exposure from all sources of modernization (Sebastian, 2007; Stansfeld et al., 2000). Several studies have been conducted to measure the perceived health risks associated with airport noise exposure (Alkaabi, 2017; Aydin & Kaltenbach, 2007; Franssen et al., 2004; Haralabidis et al., 2008; Shreckenberg et al., 2016).
Some others have found that for adults, continued exposure to airport noise or occupational noise augment annoyance, hearing impairments, sleep disorders and cardiovascular disorders (Morrell et al., 1997; Passchier et al., 2000; Passchier-Vermeer & Passchier, 2000; Porter et al., 1998). Others have measured the impairment of cognitive performances in children due to exposure to high levels of traffic noise (Cohen et al., 1980; Stansfeld & Clark, 2015). Is there any relationship between health disparity, segregation, and environmental justice such as exposure to noise pollution?
Environmental justice is defined as the fair treatment and meaningful involvement of all people regardless of race, color, national origin, or income with respect to the development, implementation, and enforcement of environmental laws, regulations, and policies (EPA, 2017) With respect to noise pollution, Cohen and Coughlin (2009) define normal noise in urban areas to be 50–60 decibels (dB) during daytime and 40 decibels at night and posit that at 65 decibels and above, exposed groups experience a disruption of normal activities that include speaking, listening, learning, and sleeping and at 75 decibels or more, single family living conditions are deemed to be incompatible.
Adler and Newman (2002) posit that exposure to damaging agents in the environment are proportional to a group's hierarchal status on the socioeconomic status (SES) ladder. Groups lower on the ladder, which according to CNN Money (CNN, 2015) is disproportionally Blacks (non-Hispanics), are more likely to live and work in worse physical environments and live closer to the highways and noise ridden areas. In more recent studies by Banzhaf et al. (2019a, 2019b), the authors explored the wide range of environmental justice studies related to race and income and explored how inequitable exposure arises from a policy perspective. They posit three main explanations for environmental injustice—“siting”, “sorting” and “Coasean bargaining” that may leave the disadvantaged race never able to express their true preference for a cleaner environment.
Considering these prior studies, the objective of this paper is to explore to what extent the segregation between Blacks (non-Hispanic) and Whites (non-Hispanic) with respect to their SES, contributes to the potential disparities in noise pollution exposure near the Atlanta Hartsfield-Jackson airport (AHJA) area. The study has two parts: (1) an examination of potential disparities in exposure to airport noise pollution between Blacks and Whites, and (2) a binary logistic regression analysis to study what factors may contribute to these disparities. The proposed regression model is that the difference in overall exposure between Black and White populations in AHJA area characterized by a binary variable, is a function of the degree of Black-White residential segregation; differences in poverty rates between Blacks and Whites; some SES variables and four health indicators—perceived level of annoyance; sleep disturbance; hearing impairment; and cardiovascular disorder. This research is an attempt to fill in the void in exploring the relationship between residential segregation, environmental justice, and health disparities.
The rest of the paper is structured as follows: section 2 describes the study area followed by the section of data collection and data description. Section 4 describes the method of research followed by the section on regression results. The final section concludes with a discussion of the shortcomings of the paper and suggestions for further research.
Study Area
The Atlanta Hartsfield-Jackson airport (AHJA) is located 7 miles south of downtown Atlanta, in Georgia, US. It serves as a major hub for many flights throughout the South and the East of the United States, and to Central and South America, Europe, Asia, and Africa. After going through several rounds of land-leasing and acquisitions by several Atlanta Mayors since 1925, the airport in its current form with 2 terminals, 7 concourses, and 5 parallel runways remains the country's busiest airport since 1961 (Wikipedia, 2021). Figure 1 shows the noise contour (measured in day-night decibels) map for the AHJA covering some of the densely populated cities like East Point, Hapeville etc. located south of Atlanta.
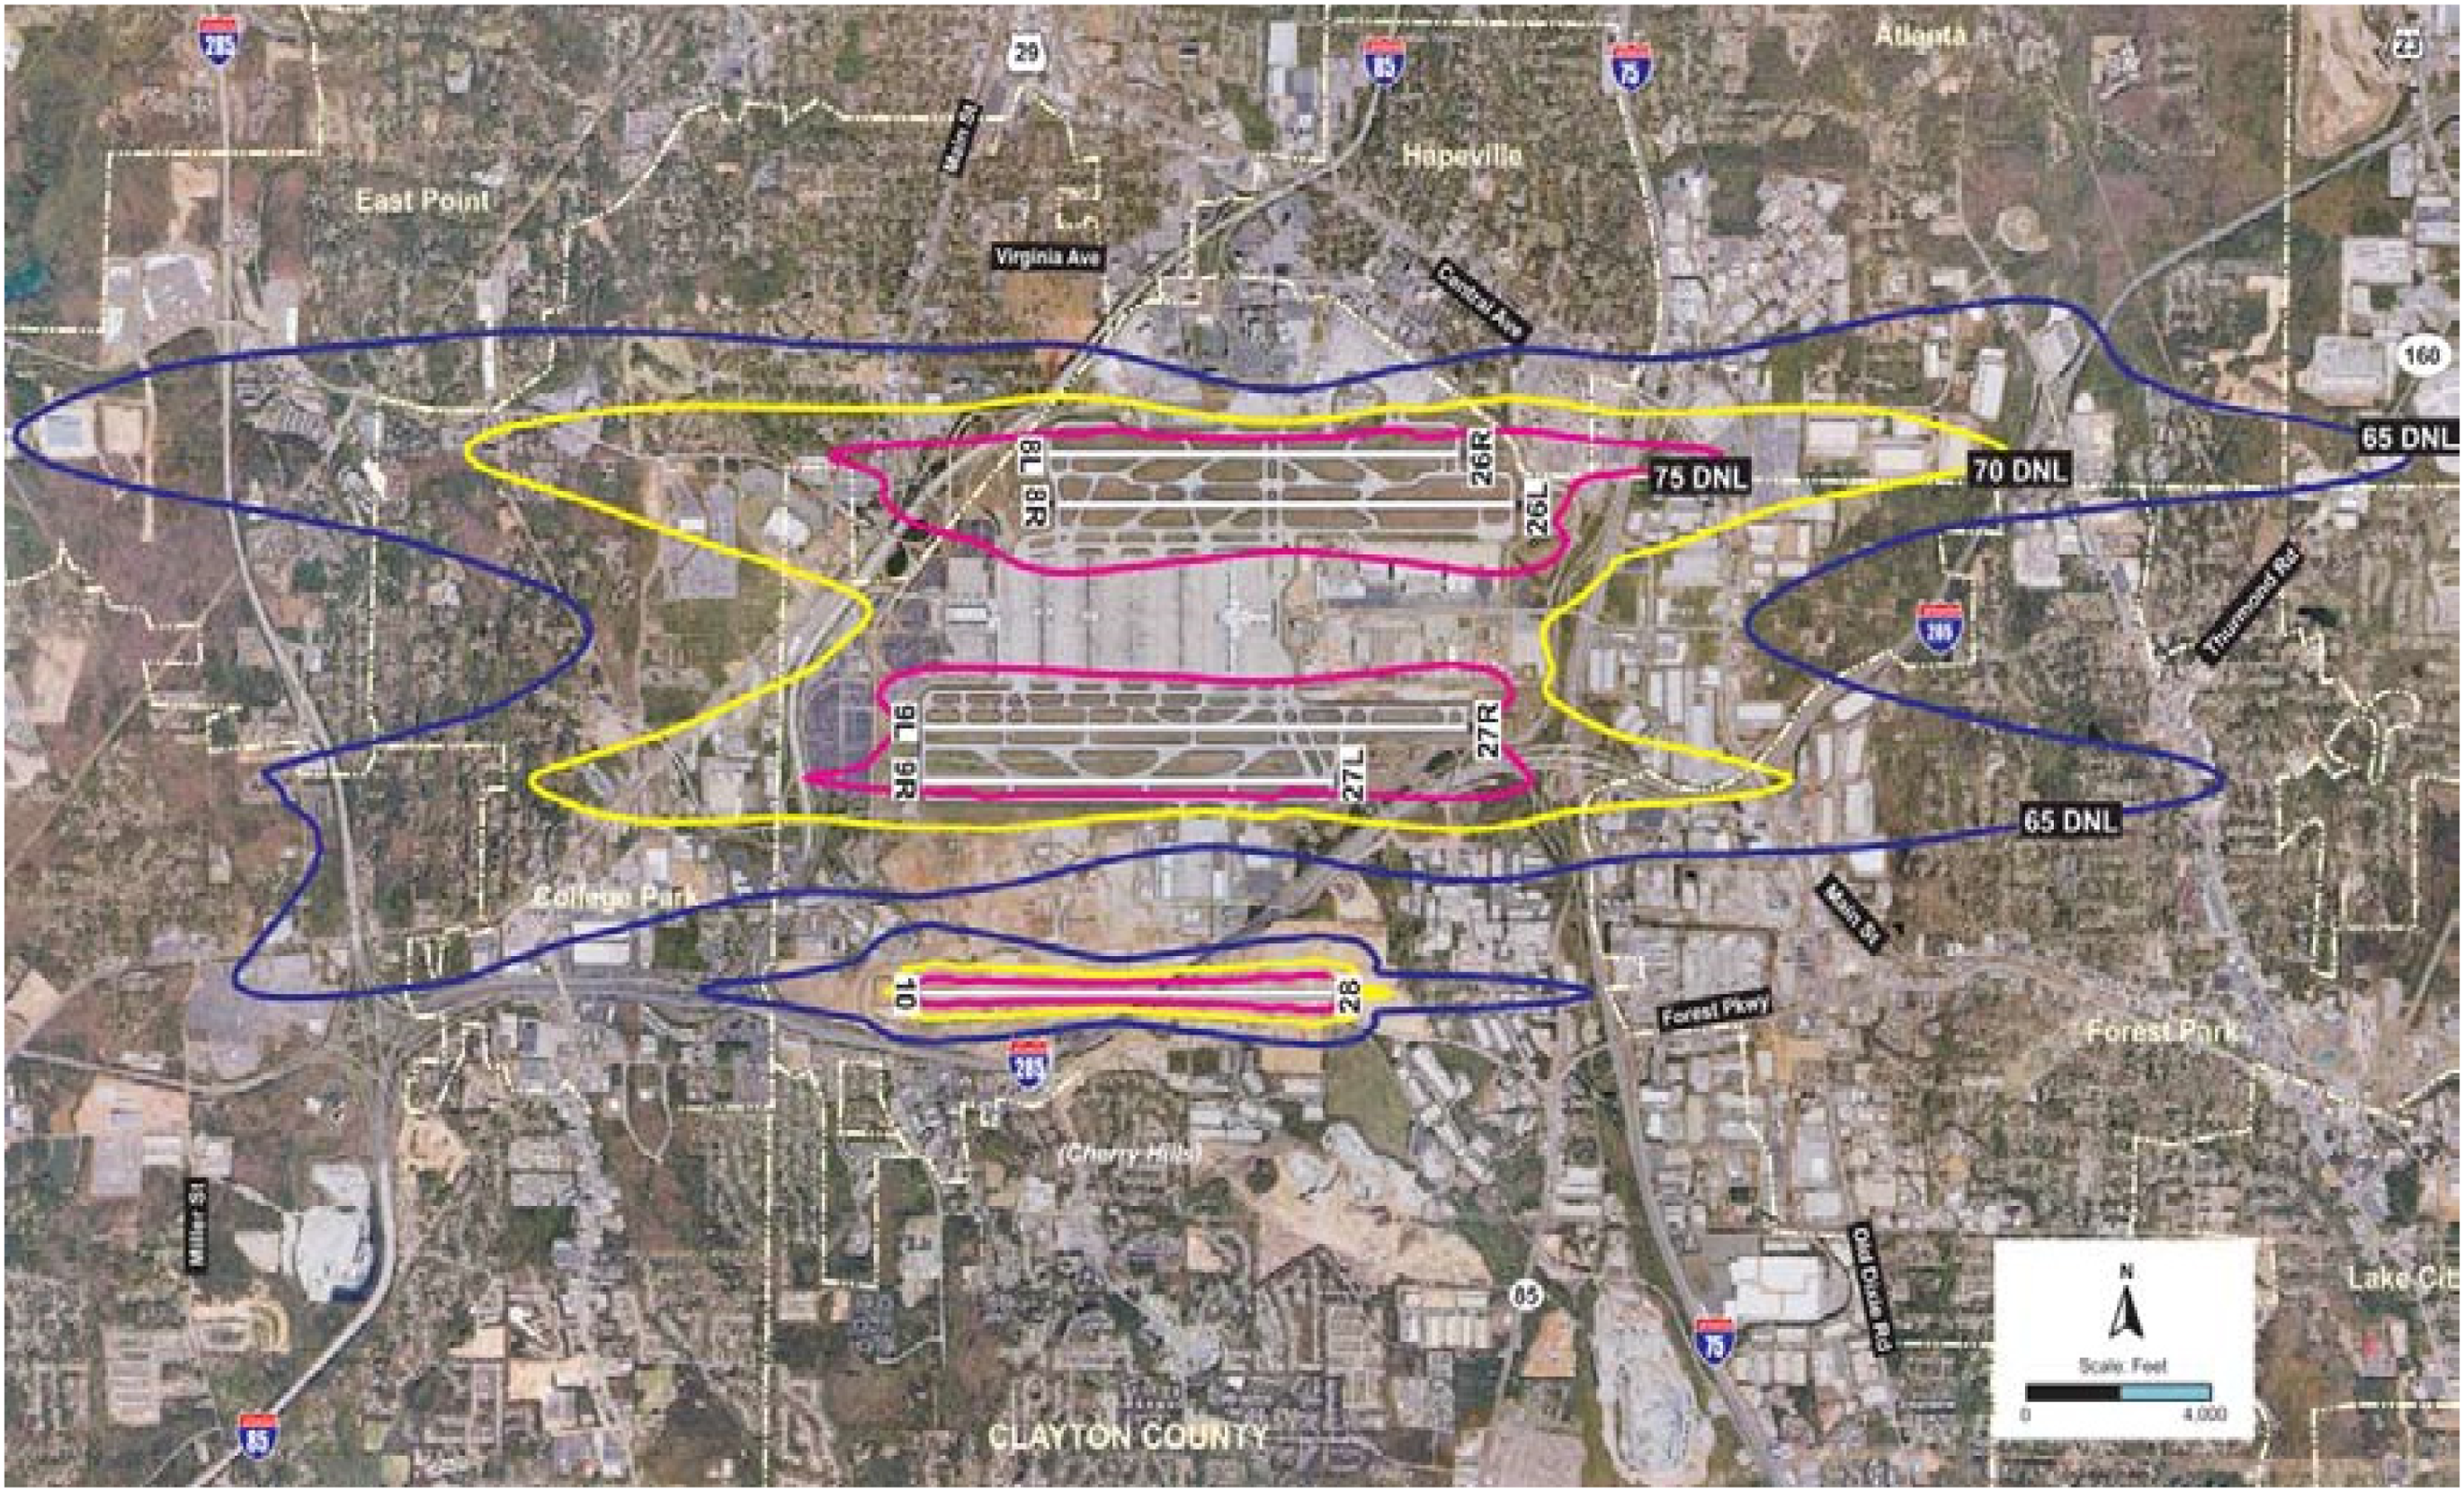
Aircraft noise contour Map around atlanta hartsfield-Jackson international airport. Source: http://www.atlanta-airport.com/.
Using GIS (ArcGIS Pro 2.9) and the noise contour map, Figure 2 was created to trace out the 25-miles radii around the AHJA in 5-miles progression. The zip codes in each of these radii were also identified to map the proximity and thereby the exposure to the intensity of airport noise. The 5-mile and 10-mile radii mostly covered the zip codes that overlaid the 75 and 70 decibel noise contours whereas the 65-decibel contour covered mostly the 15-mile radius and some portion of the 20-mile radius. Thus, to be consistent with the noise contours, the study area focused on the zip codes encompassing only the 20-mile radii around the AHJA.
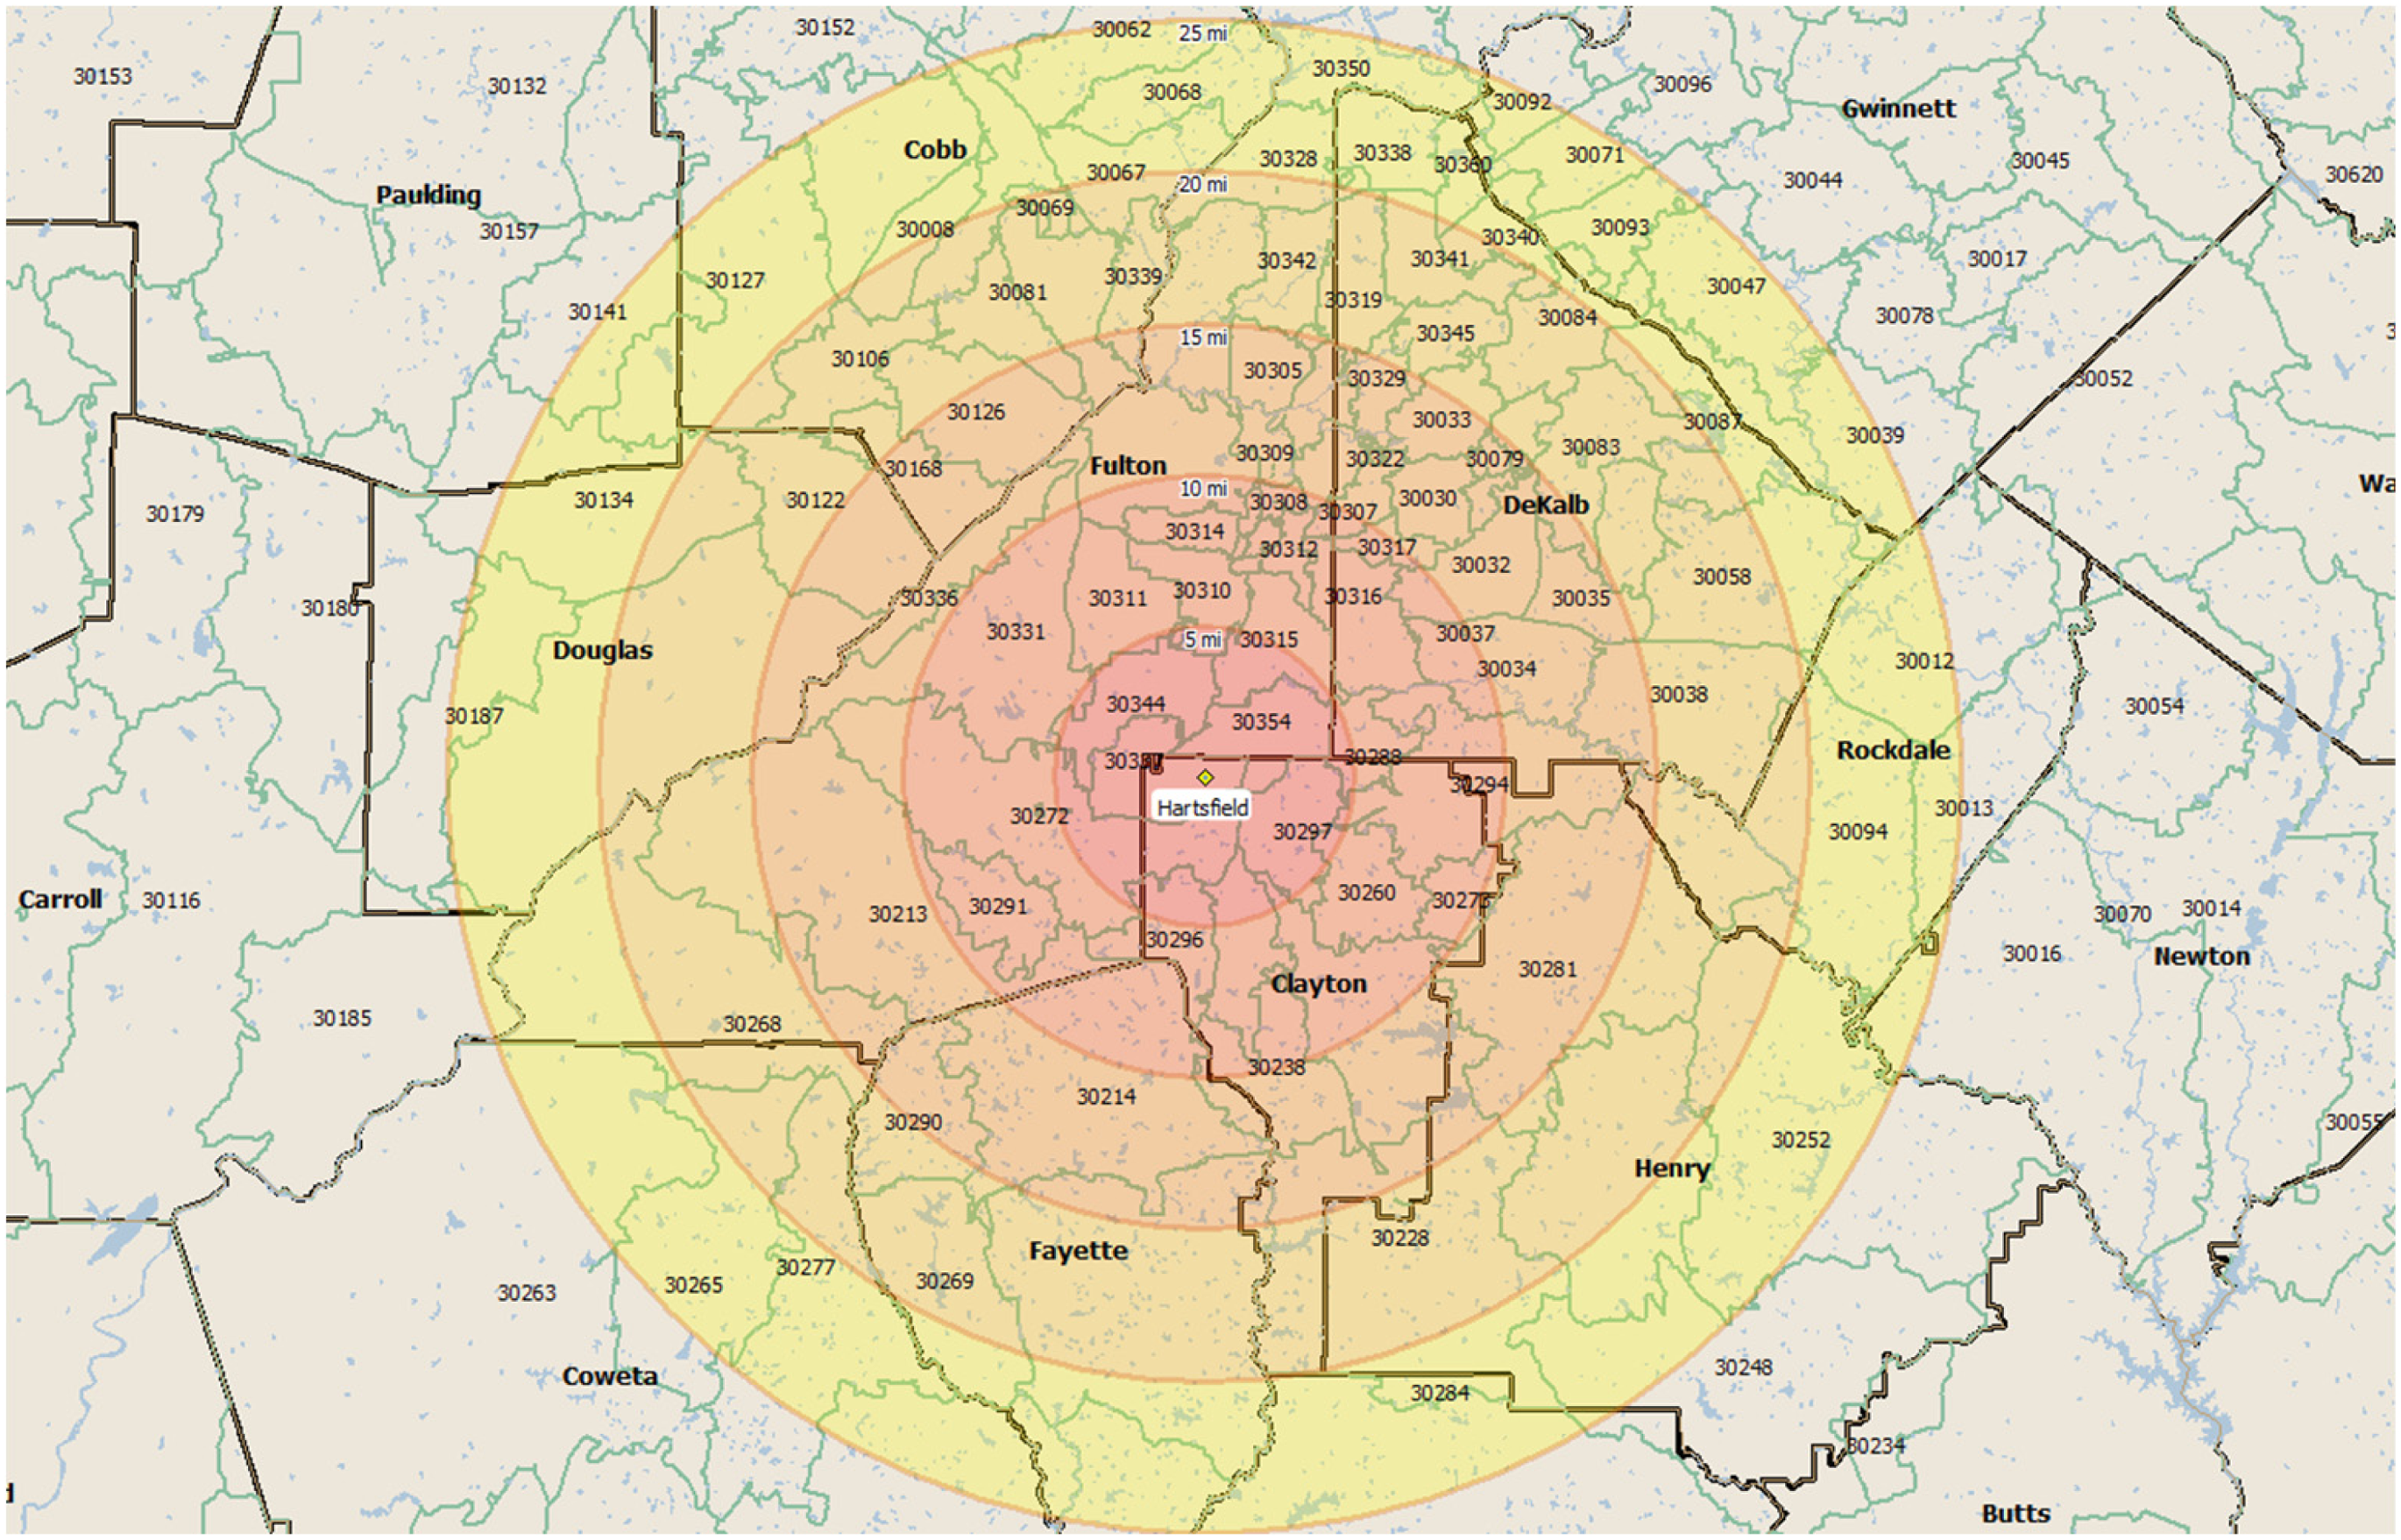
Areas within the 25-miles radius of atlanta hartsfield-Jackson international airport. Source: Created by the author using ArcGIS.
Data Collection Method and Description
A stratified random sampling method was used to collect data. To apply the sampling method, first the radii were defined as follows. Radius 1 was defined as areas within 0 to 5 miles away from the airport; radius 2 consisted of areas more than 5 miles and up to 10-miles away from the airport. Similarly, radius 3 covered areas located more than 10 miles and up to 15-miles away from the airport and radius 4 covered areas beyond 15-miles and up to 20 miles away from the airport. These radii synchronized with the noise contours of 75, 70, 65, and 60 decibels respectively. After such synchronization, within each radius households were identified by zip codes. Finally, within each zip code, households were randomly selected from the three income-strata identified as low (15K < 35K); middle (35K < 55K); and high (55K& above), following the definitions of US Census Bureau (2017). For the sample to proportionately represent households from the three income groups a Power calculation of 80% with a significance level of 5% showed that a sample size of 7,000 households would be sufficient within the 20-mile radius. Given an expected response of 25–35%, a random sample of 10,000 households was decided.
A survey questionnaire was constructed by the author for telephonic survey to be conducted among adult household members (18 years and older). The questionnaire contained 12 socio-economic and demographic questions; 13 questions related to the household member's perception of aircraft noise annoyance; and 18 questions related to the participant's health condition. Upon receiving IRB approval, telephonic surveys were conducted by trained students on 1264 households in radius 1; 3678 from radius 2; 6820 from radius 3; and 7187 from radius 4 during the period of February 2015 to March 2017. The complete sample size contained 261 observations, of which 237 observations were identified as Black or White respondents. Table 1 describes the sample demographic data.
Sample Data Description.
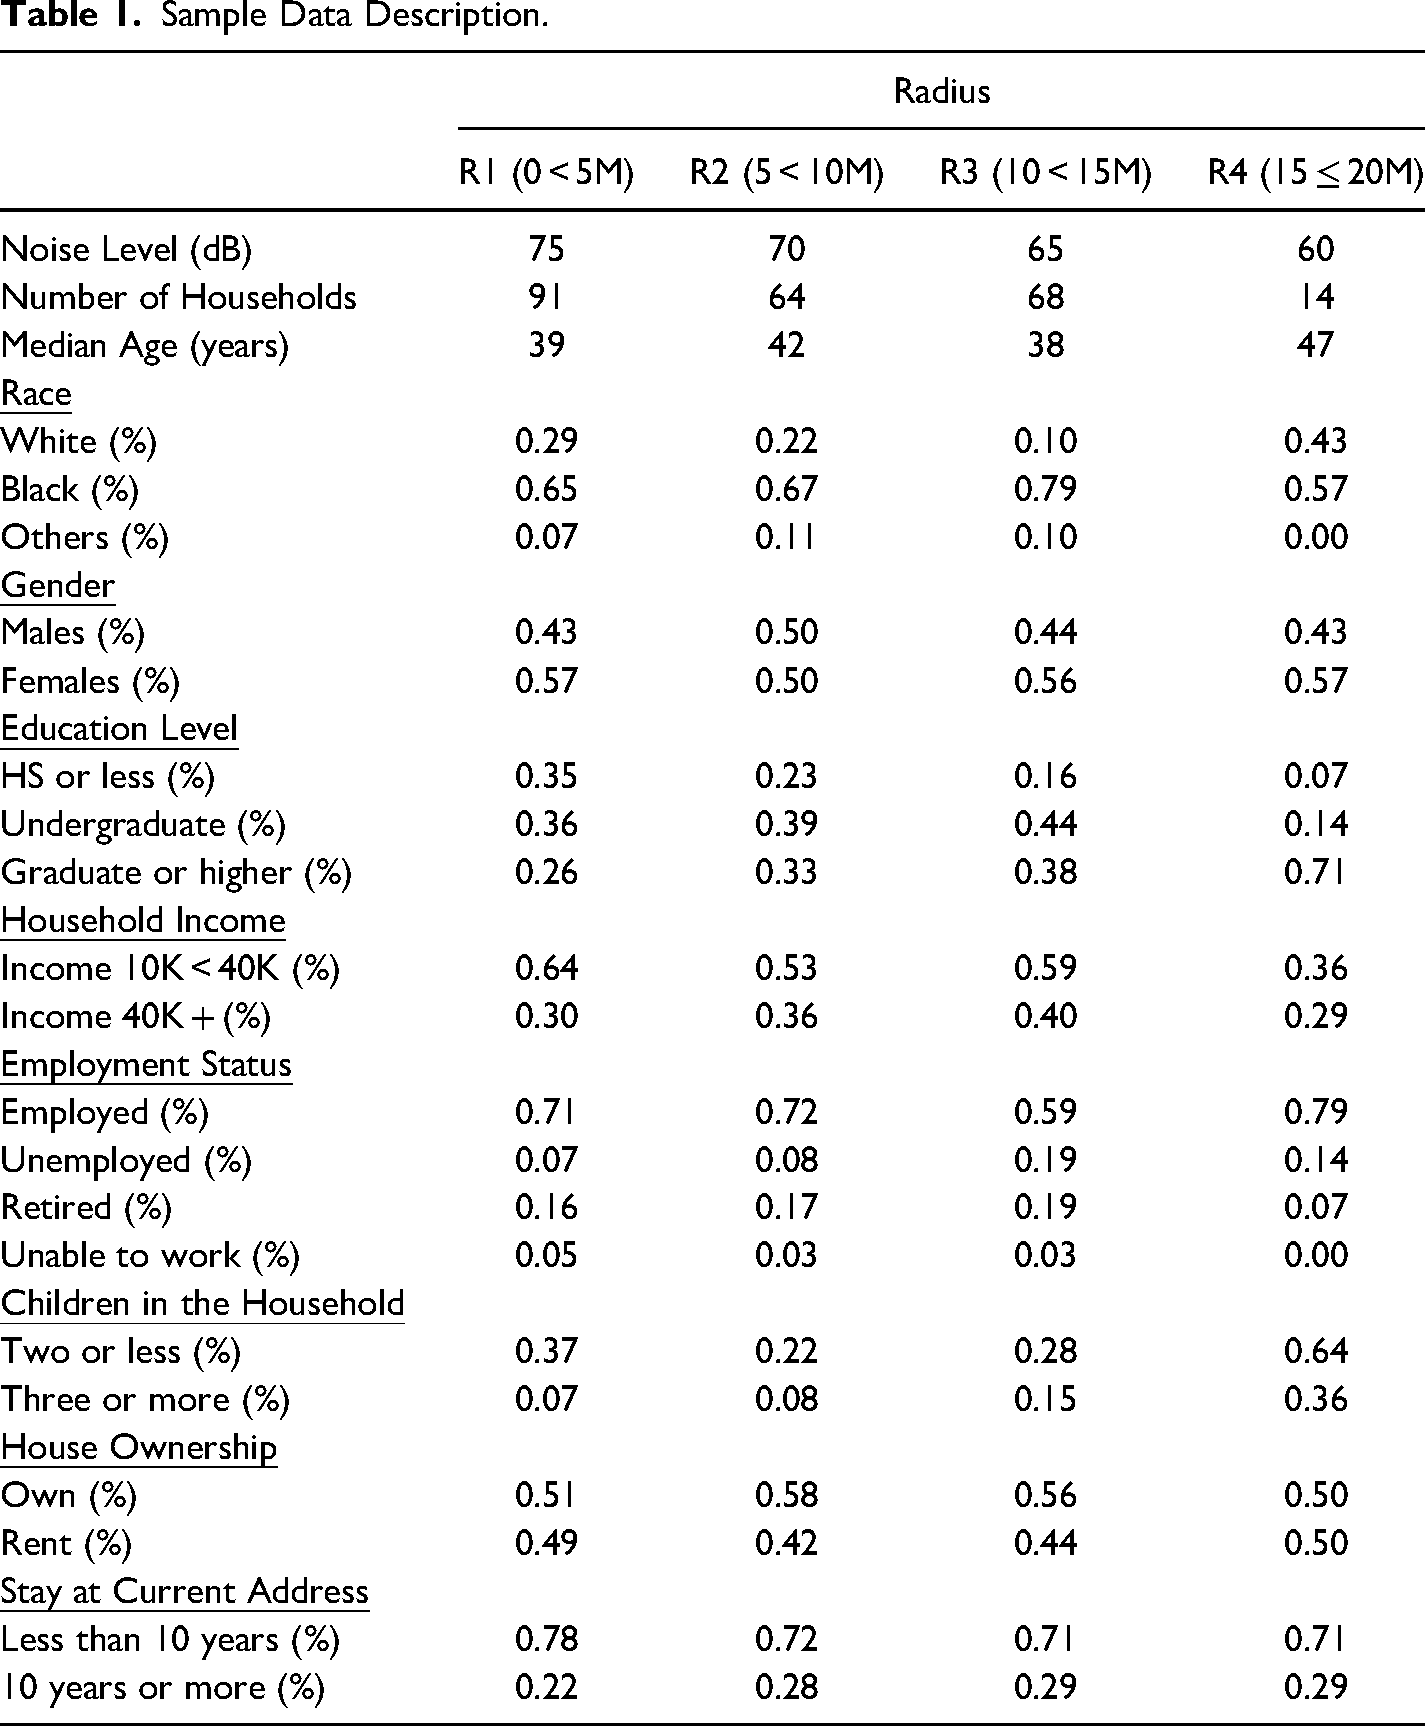
In the sample, the median age of the surveyed household members ranged from 38 years (radius 3) to 47 years (radius 4). The percentage of Black households, in all the radii were greater than the percentage of White households. In this research, only non-Hispanic Whites and non-Hispanic Blacks were included for statistical analysis. The proportion of households with a high school degree or less was highest in radius 1 (35%); the proportions of households with an undergraduate degree was highest in radius 3 (44%); and the percentage of households with a graduate degree or higher is highest in radius 4 (71%). The percentage of households having an income level less than 40k is highest in radius 1 (64%) and the percentage of households with an income level greater than 40k is highest in radius 3 (40%). The sample seems to show some evidence of association of SES and Environmental Justice explored in prior studies. The employment status in the data do not seem to have a clear association with the noise exposure level except that the percentage of households who are “unable to work” is highest in radius 1 with noise level 75 dB and none in radius 4 with noise level 60 decibels.
Methods
The aim of the first part of the research is to determine if there are potential disparities in exposure to airport noise pollution between Blacks and Whites indicating environmental injustice. The potential disparities in overall exposure to aircraft noise between the Black and White households in AHJA area is defined by a statistical measure called Net Exposure Difference Score (NED) based upon cumulative frequency distributions. Historically, it has been used in income inequality analysis (Waller et al., 1999) but here it is adapted to measure inequality in exposure to noise pollution. The advantage of using a net difference score is that it measures inequality over the whole range of exposures. Comparing means or medians of exposure would overly focus on differences near the center of the exposure distribution and would be insensitive to values at the high and low ends. Exposures at these upper and lower ends may be of critical importance in assessing potential health impacts and therefore, any change in potential exposure should be considered of equal value regardless of “where” on the distribution the change occurs.
The Net Exposure Difference Score is calculated using the following formula
Potential Noise Exposure Difference Score at each Radius.
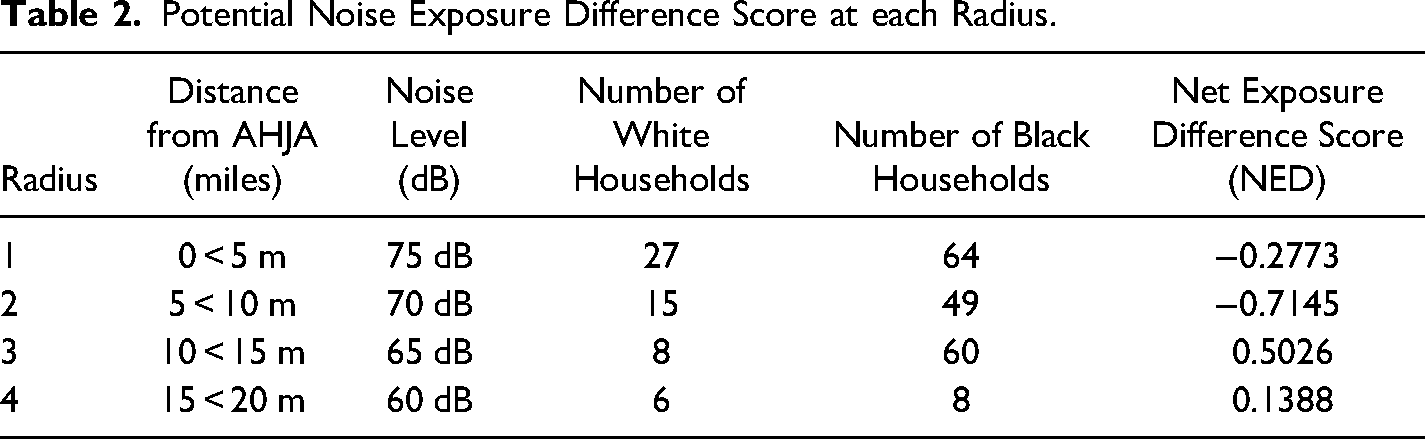
As is evident in Table 2, the sample had more Black households in all the radii. However, for the first two radii with exposure levels 75 dB and 70 dB respectively, the NED were negative implying the probability of a randomly picked Black household being exposed to a higher level of noise than a randomly picked White household living within 10-miles radius from AHJA. With this potential disparity in noise exposure levels existing between the Black and White households, we next explore what factors may be contributing to this disparity.
The objective variables presented in Table 1 are integrated with some subjective variables to prepare the model for a binary logistic regression analysis. Race is converted into a binary variable with Black = 1 and 0 = otherwise. Gender is another dummy variable with 1 = male and 0 = otherwise. The house ownership variable is also a binary variable with 1 = own the house and 0 = rent.
The variable “poverty ratio” was added to represent the income differences between Black and White, to control for the fact that many studies have found low income to be a risk factor for living near an environmental hazard. The residential segregation is measured by the dissimilarity index first developed in 1950 (Polednak, 1997). It is defined as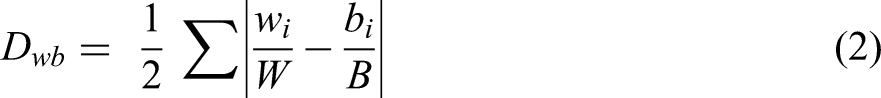
The subjective variables included as explanatory variables in the model were created from the 13 questions about the participants’ perception of noise annoyance and 18 questions related to their health conditions. Four composite indicators were created to represent noise annoyance (NA), hearing impairment (HI), sleep disturbance (SD), and cardio-vascular disorder (CVD). Each of these indicators were averages of the binary representations of specific questions in the survey. This average for each zip code represented the health indicator variable for each zip code for each radius. Details of the indicator creations are presented in appendix A.
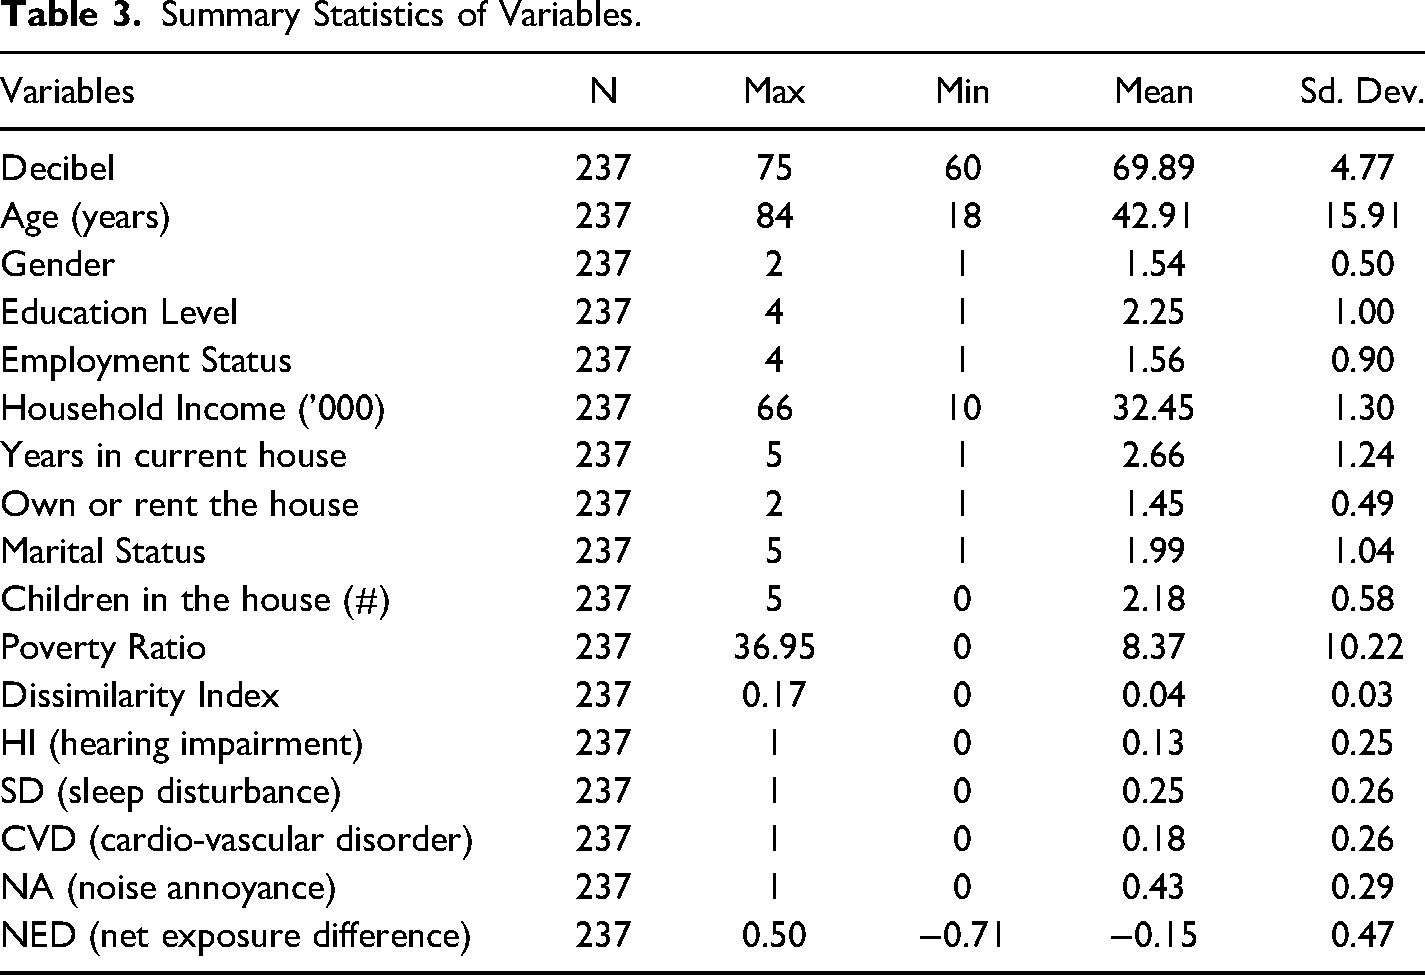
Table 3 provides the summary statistics for the model variables. In this table, some of the variables like “education level”, “employment status”, “marital status”, and “years in current house” are categorical data. The education level ranges as 1 = High School diploma or less; 2 = undergraduate; 3 = graduate; and 4 = postgraduate. The “employment status” consists of four levels with 1 = employed; 2 = unemployed; 3 = retired; and 4 = unable to work. The length of stay in the current residence measured by “years in current house” is also categorized as 1 = less than 6 months; 2 = 6 months to less than 5 years; and so forth with the highest category as 5 = more than 20 years. Marital status is categorized as 1 = single; 2 = married; 3 = divorced; 4 = widowed; and 5 = separated. Accordingly, their statistics like max & min values or mean represents the categories. The objective variables “gender” and “own or rent the house” are binary variables with 1 = black; 0 = white and 1 = own; 0 = rent respectively.
Summary Statistics of Variables.
Results
An Ordinary Least Square specification to estimate the impact of health indicators, and other socio-economic demographic variables is likely not appropriate as the relationships are not expected to be linear. Geographical location and the dispersion of aircraft noise itself are not happening in a linear fashion. Therefore, a Logit regression specification is utilized with the NED as the dependent variable dichotomized into 1 = exposure level 70 dB and above (radius 1 & 2 located within 10-mile of AHJA) and 0 = exposure level less than 70 dB (radius 3 & 4 located beyond the 10-mile of AHJA). The new binary variable is defined as net exposure difference by radii (NED_R). The specific model tested for odds ratio to measure the association between NED_R, residential segregation, some socio-economic variables, and the health indicators is as follows: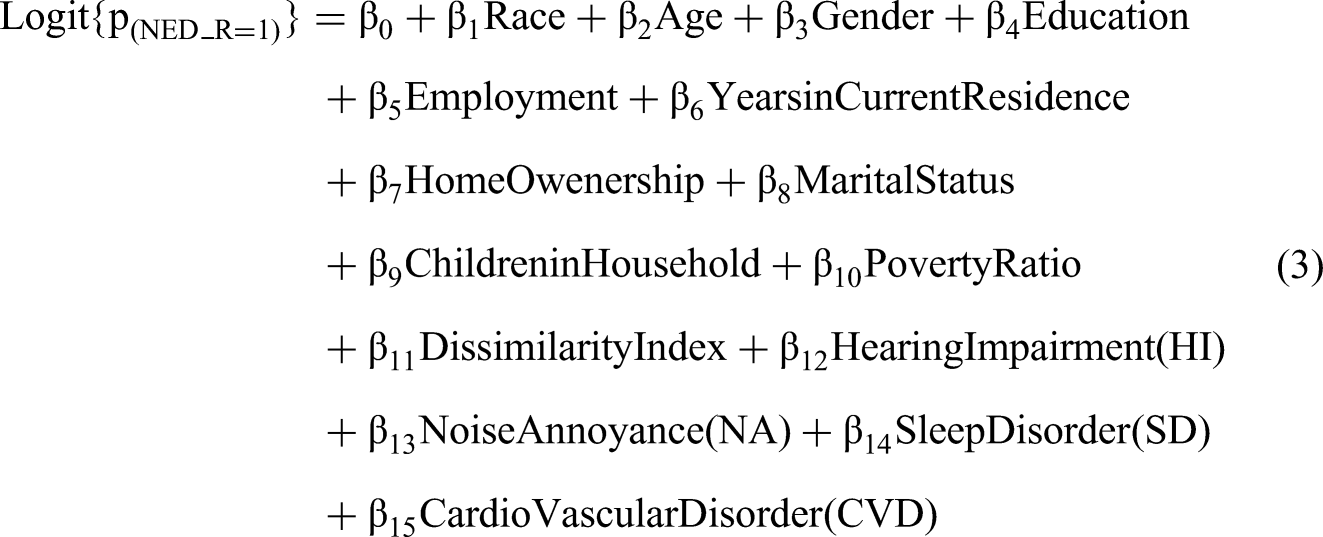
Odds Ratio and 95% Confidence Interval Associating Health Indicators, Socio-Economic-Demographic Variables, and Residential Segregation with Noise Exposure Disparities at 10 Miles Radius from AHJA.
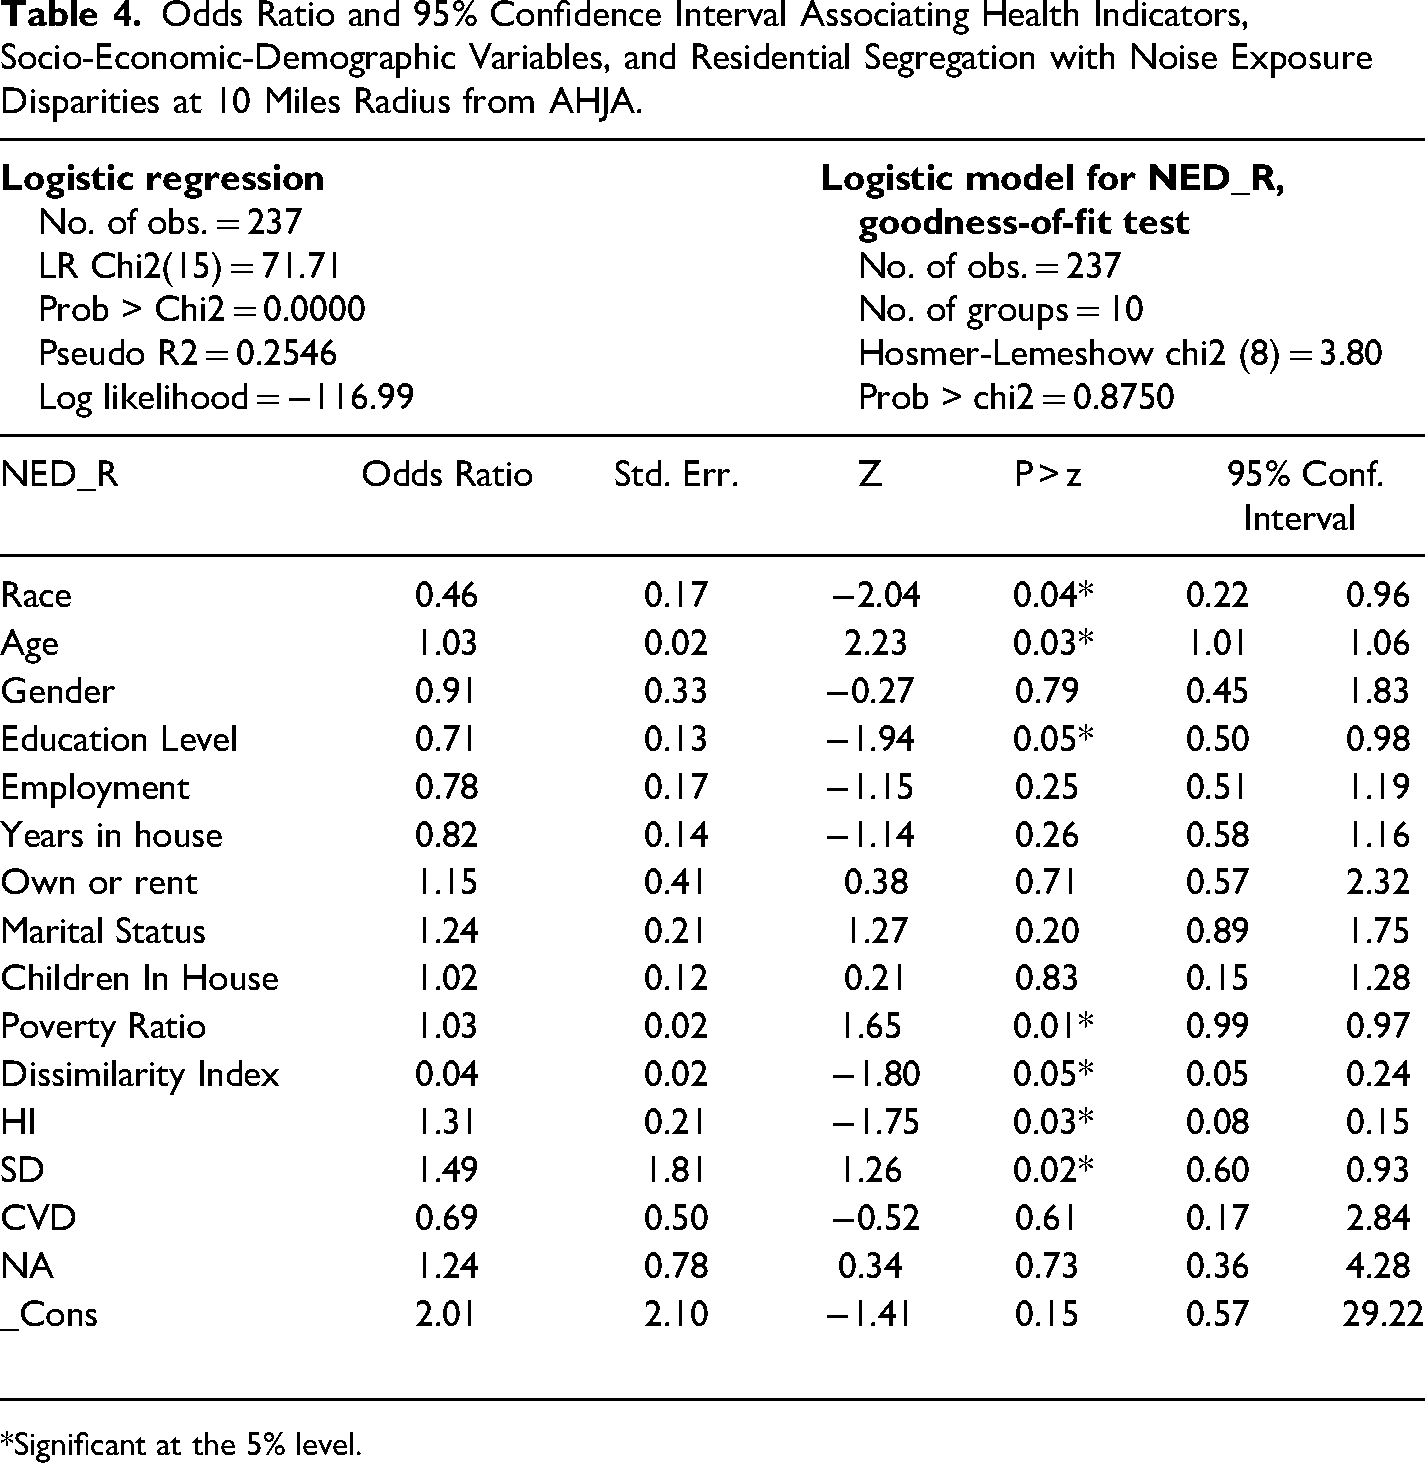
*Significant at the 5% level.
The Logit specification shows an acceptable goodness-of- fit as the Hosmer-Lemeshow goodness-of-fit test revealed a significant value (p-value = 0.8750) to be greater than 0.05. In addition, the model is good in predicting the overall choice with LR chi2 = 71.71% indicating that the predictor variables have good explanatory power. The odds ratio (OR) for most variables are greater than 1 but not all of them are statistically significant.
Among the objective variables, race, age, education level, poverty ratio and dissimilarity index are statistically significant. Correspondingly, the 95% CI for these variables do not contain the OR value of 1 which would suggest the null hypothesis that the variable had no influence to be true. Other variables like, gender, employment status, years lived in the current house, house ownership, marital status, or how many children lived in the house did not have any impact on the likelihood of being within the 10-mile radius of the airport.
“Race” is a binary variable with 0 = White as the baseline category. Thus, the odds ratio of 0.46 for this variable suggests that with every increase in White household, the likelihood of noise disparity in the 10-mile reduces. The odds ratio for the variable “Age” is 1.03 suggesting that for every 1-year increase in age, the probability of being in the 10-mile radius or being exposed to noise level greater than 70 dB increases by 3%. The “Education Level” is a categorical variable with 1 = HS or less; 2 = Undergraduate, 3 = Graduate, and 4 = Postgraduate. Therefore, the odds ratio = 0.71 suggests that for every increase in the level of education, the likelihood of being within the 10-mile radius reduces by 71%. This is consistent with what the data shows in Table 1- radius 4 has a higher percentage of graduates while radius 1 has a higher percentage of HS graduates. The continuous variable “Poverty Ratio” has an odds ratio = 1.03 implying that there is a 3% probability of observing an increase in difference in incomes between the Black and White households, exposed to noise levels 70 dB or above. The odds ratio for the “Dissimilarity Index” is slightly above “0” but still significant suggesting that 1-unit increase in segregation is likely to decrease the probability of living within the 10-mile radius by 4 percent.
Among the subjective variables, only (HI) and (SD) were found to be statistically significant whereas (NA) and (CVD) were not statistically significant. Since these subjective variables were composite indicators with values ranging between 0 and 1, the interpretation of their significance requires caution. The odds ratio of 1.31 for HI suggests that for every 1-unit increase in the value of the composite indicator, the probability of being within the 10-mile radius increases by 31%. Since the HI is an average of the responses to the 3 specific questions, it is not clear which of these responses are changing. For example, when HI value increases from 0.34 to 0.35, it could be due to an increase in loss of hearing ability, increase in lingering pain in ear or more individuals having to use hearing aid. The odds ratio for “sleep disorder” is 1.49 suggesting that a 1-unit increase in value of the indicator increases the probability of the household being in the noise exposure level of 70 dB or higher by almost 50%. Again, that increase in odds ratio could be due to change in responses to any of the 5 questions in this indicator. However, for these significant explanatory variables, the 95% CI do not contain the OR value of “1”.
Discussion and Conclusion
The main aim in this paper was twofold—(1) to explore potential disparities in exposure to airport noise pollution between Blacks (non-Hispanic) and Whites (non-Hispanic) living within the 20-mile radius from the Atlanta-Hartsfield Jackson airport, and (2) to test the hypothesis that residential segregation, SEC factors, poverty ratio among Blacks and Whites and health factors have an influence on the exposure disparity. Using a stratified random sampling method to conduct a telephonic survey during the period of 2015–2017 yielded the sample data of 237 complete observations. Statistical analysis was performed using STATA, version 13.1. The results in Table 2 suggest that the net exposure difference score (NED) as defined by equation (1) show proportionately more Black households live withing the 10-mile radius from AHJA and are exposed to higher levels of aircraft noise (70 dB or above) than the White households. This conforms to the environmental injustice discussed in prior studies. Bullard (2001) for example, postulates that “race still plays a significant part in distributing ‘benefits’ and public ‘burdens’ associated with economic growth” and suggests an environmental justice framework that can uncover the ethical and political questions of “who gets what, why, and how much”.
To fulfill the second objective, a binary logistic test was performed by converting the NED score into a binary variable using the four radii levels. Households which were in radii 1 and 2 were grouped to represent exposure level 70 dB and above and households in radii 3 and 4 were grouped to represent exposure level below 70 dB and located beyond the 10-mile radius. The new binary variable is defined as net exposure difference by radii (NED_R). The results of this binary logistic regression are displayed in Table 4. The odds ratio reflects the influence of each of the objective and subjective explanatory variables to the likelihood of the net exposure difference being within 10-mile radius of the AHJA area.
Unlike many prior studies, this study didn’t find the socio-economic factors like “gender”, “employment”, “ownership of housing” to be influencing environmental justice but “race” was influential. Confirming prior studies, residential segregation and poverty does seem to have an influence on the disparity in noise exposure. With respect to health disparity, this research suggests hearing impairment and sleep disorder to have some link to noise exposure disparity but did not find noise annoyance or cardio-vascular disorder to be a significant factor. It could very well be that the households were practicing noise-abatement strategies such as adding extra insulation to their doors and windows in the house.
The survey questionnaire didn’t include questions about the noise abating strategies adopted by households nor their housing prices. Time and budget constraints also prevented from further investigating the measures undertaken by the AHJA authorities to reduce noise exposure or to compensate households experiencing sudden increase in noise annoyance due to change in flight routes. These are some shortcomings that merit attention and may incite future research.
Notwithstanding the possible limitations, the parameter estimates in this study suggest race-based environmental injustice in the form of disparity in exposure to noise pollution between Black and White households living near the AHJA area. In addition, there is evidence that health disparities, segregation, and other household socio-economic conditions like education and poverty levels are drivers of disparity in noise exposure.
Footnotes
Declaration of Conflicting Interests
The author(s) declared no potential conflicts of interest with respect to the research, authorship, and/or publication of this article.
Funding
The author(s) received no financial support for the research, authorship and/or publication of this article.