
Abstract
This article develops a rapid performance evaluation approach for lower mobility hybrid robot, which provides guidance for manipulator evaluation, design, and optimization. First, a general position vector model of gravity center for the lower mobility hybrid robot in the whole workspace is constructed based on a general inverse kinematic model. A performance evaluation index based on gravity-center position is then proposed, where the coordinates pointing to the supporting direction are selected as the evaluation index of the robot performance. Furthermore, the credibility of the evaluation approach is verified from a 5-DOF hybrid robot (TriMule) by comparing with the condition number and the first natural frequency. Analysis results demonstrate that the evaluation index can not only reflect the performance spatial distribution in the whole workspace but also is sensitive to the performance difference caused by mass distribution. The proposed performance evaluation approach provides a new index for the rapid design and optimization of the cantilever robot.
Introduction
Hybrid robot has advantages of compact structure, high rigidity, and large bearing capacity, which has a broad application prospect in aerospace manufacturing, and in high-precision and high-intensity processing.1–3 Performance evaluation is one of the key issues in robot design and application. It is of great significance to select the evaluation approaches and index, which could precisely constrain design variables in the design process and embody the real performance of robot in the application.4,5
At present, there are many evaluation approaches and indices for robot performance, including static structure symmetry, terminal stiffness, bearing capacity, force transfer, geometric accuracy, singularity, redundancy, and workspace, or dynamic precision, speed, dynamic stiffness, and mode shape.6–9 Among them, the most typical evaluation indices of the local performance are the kinematic evaluation index based on the condition number (κ) of Jacobian matrix 10 and the dynamic stiffness evaluation index based on the low order natural frequency, 11 both of which are closely related to the specific pose of the robot. Salisbury and Craig 10 used the condition number as the evaluation index for the local performance of the robot. The smaller the condition number, the better the performance of the whole machine in this pose. Based on the Jacobian matrix, the problem of different physical quantities with different dimensions should be solved first, and then it should be normalized. Jacobian matrix depends on the pose of the robot, which is a local performance index. In order to evaluate the dexterity of robots in general, Gosselin and Angeles 12 proposed Global Conditioning Index. Huang et al.13–15 applied this performance evaluation index to robot design, optimization, and evaluation. In the process of studying the performance of the robot, Dong et al.16,17 and Wu et al. 18 assessed and evaluated its local performance with the help of the first natural frequency (f1) of the robot. This approach has been widely used in the performance research and optimization design of various mechanisms. But acquisition of the first natural frequency of the mechanism mostly depends on the whole machine’s numerical analytical dynamics model or finite element model. The accuracy of the model determines the reliability of the index. At present, most of the high-precision analytical models or finite element models have some errors, which limit the exploration of the real performance of the mechanism. The experimental method is the most accurate means to obtain the first natural frequency of the mechanism. However, as the complexity of the mechanism increases, the complexity of the experiment also increases, making it difficult to quickly evaluate and study the mechanism.
The position of gravity center has a significant impact on the performance of the robot in the whole workspace,19–21 and gravity compensation has been a very important issue.22–24 Wu et al. 25 studied the dynamic characteristics of the mechanism in consideration of gravity. Ma et al., 26 in order to improve the performance of the robot, designed a barycenter balance mechanism to solve the influence caused by the barycenter in the process of work. As known to all, the gravity center of the mechanism is closely related to the pose of the robot. Moreover, the acquisition of the gravity center is relatively simple, which only relies on the kinematics model and the fine 3D model. The gravity center has a high sensitivity to the difference of positions and orientations between the different poses. However, there is no systematic research on the relationship between the gravity-center position and the performance of the manipulator, even though the gravity-center position is introduced into the robot design and optimization.
In this article, a performance evaluation approach of the lower mobility hybrid robot based on the position of gravity center is presented, aiming to put forward a simple index which could be used for the rapid evaluation, design, and optimization of the robot. A general inverse kinematic model of the lower mobility hybrid robot is constructed, following a general position vector model of gravity center. Furthermore, the coordinates pointing to the supporting direction are selected as the performance evaluation index. The credibility of the evaluation approach is then verified from the 5-DOF hybrid robot (TriMule).
The remainder of the article is organized as follows. Section “Evaluation method based on gravity-center position” describes a general kinematics model and gravity-center position solution for the lower mobility hybrid robot. Thereafter, the evaluation index based on gravity-center position is established. In section “Performance evaluation of 5-DOF hybrid robot,” the inverse kinematics solution model and the gravity-center vector model of the 5-DOF robot TriMule are deduced. Furthermore, the validity and reliability of the evaluation approach are verified by respectively comparing the gravity-center position with the condition number and the first natural frequency. Section “Application” discusses the selection of evaluation index based on the position of gravity center. Conclusions are made in last section.
Evaluation method based on gravity-center position
Kinematic analysis
The general model of a lower mobility hybrid robot is shown in Figure 1, which includes a fixed base, a moving platform, i limbs, and an end effector. One end of the limb is connected to the fixed base, and the other end is connected to the moving platform. It is customary to define the global coordinate frame B-xyz rigidly with the fixed base, and the moving coordinate frame A-uvw is fixed with the moving platform, and the cutter tool coordinate frame P’ -xcyczc is defined at the principal axis, respectively.
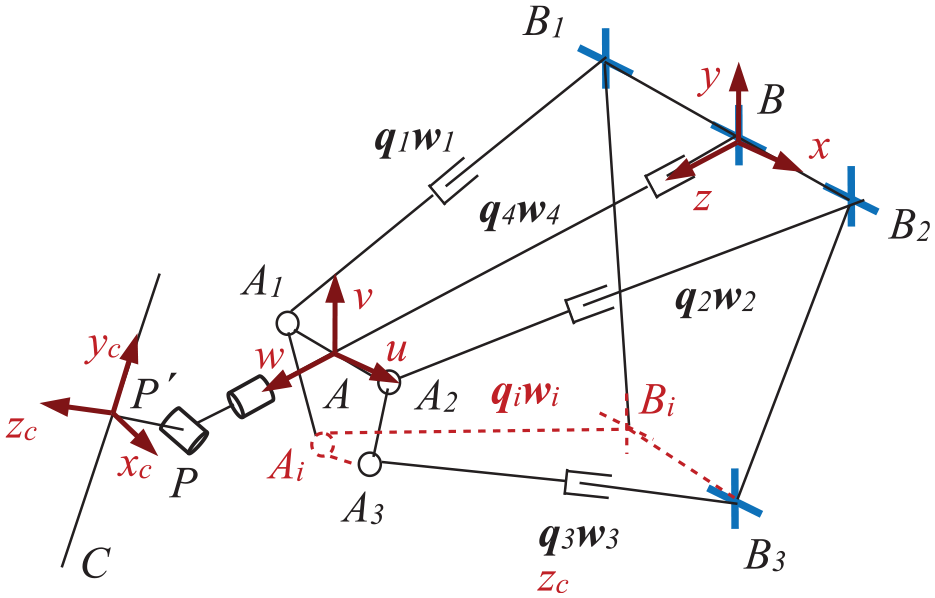
Schematic of the lower mobility hybrid robot.
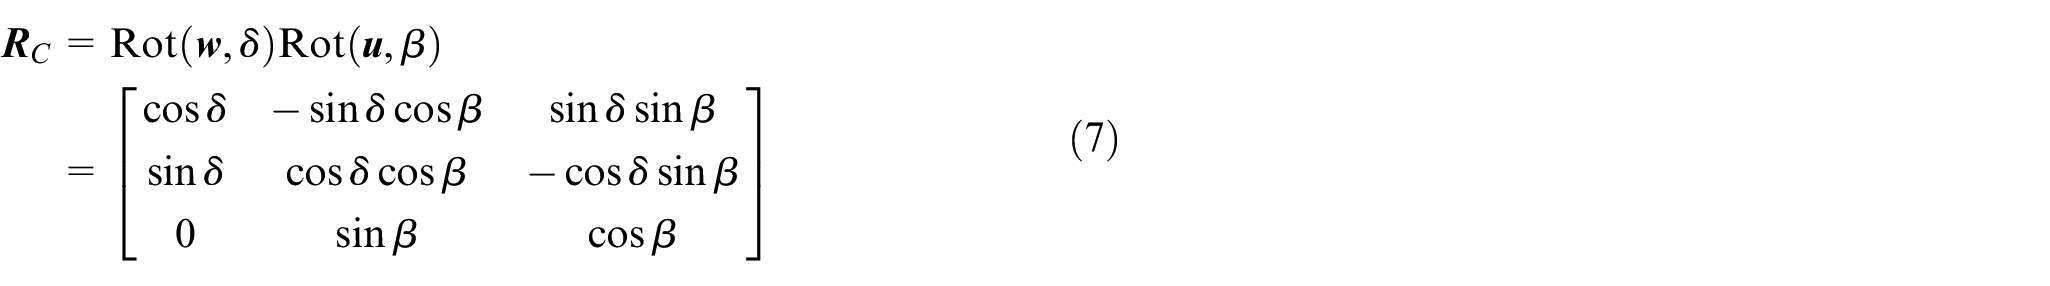
Then, the rotational transformation matrix of A-uvw with respect to B-xyz can be represented by

The rotational transformation matrix of P’ -xcyczc relative to A-xyz can be expressed by

The length and the direction vector of each limb or the rotational angle of end effector can be obtained through the inverse kinematic solution for the specific tool center point C.
Performance index based on gravity-center position
Based on the inverse kinematics model and the 3D model of the lower mobility hybrid robot, the parts are grouped according to the following principles:
The whole machine is grouped with joints as nodes;
When grouping, it is insisted that the relative position of the parts in the group does not change during the working;
The position vector of each part in B-xyz, A-uvw, or P’ -xcyczc is easily obtained as a priority, because the direction vector of each limb and joint need to be deduced in the inverse kinematic model.
Assuming that the manipulator is divided into i components, the vector

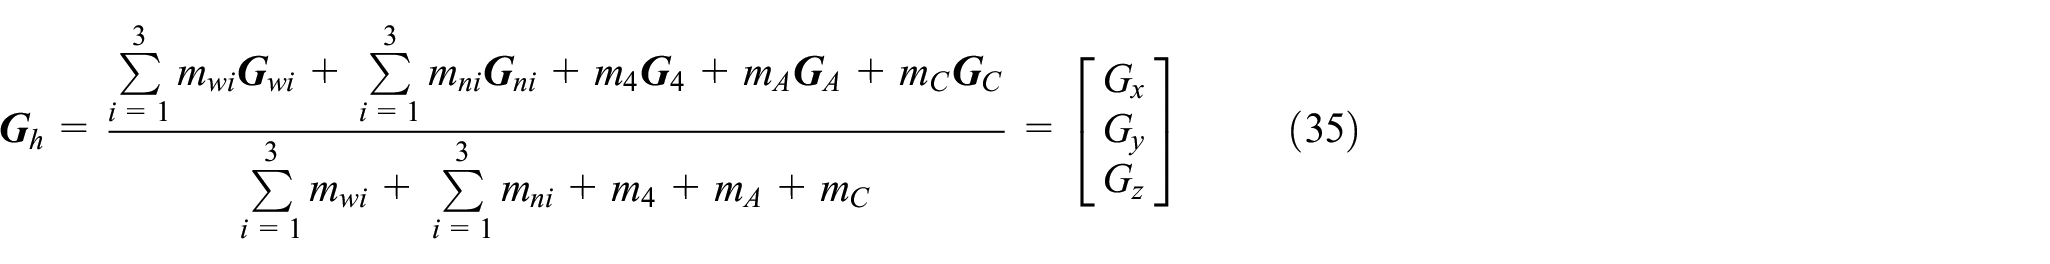
Furthermore the gravity-center vector of the manipulator could be deduced as
According to the cantilever direction of the mechanism, the evaluation index RG is based on the position of the gravity center as

RG≥0, and the larger the value, the greater the distance between the gravity center and the supporting surface, that is the worse the performance in the corresponding position.
Compared with other performance evaluation indices, such as κ and f1, RG is more intuitive, easier to obtain, and more operable. It is a convenient and rapid performance evaluation approach.
Performance evaluation of 5-DOF hybrid robot
The 5-DOF hybrid robot TriMule
27
is shown in Figure 2, which is composed of a spatial parallel module (3U
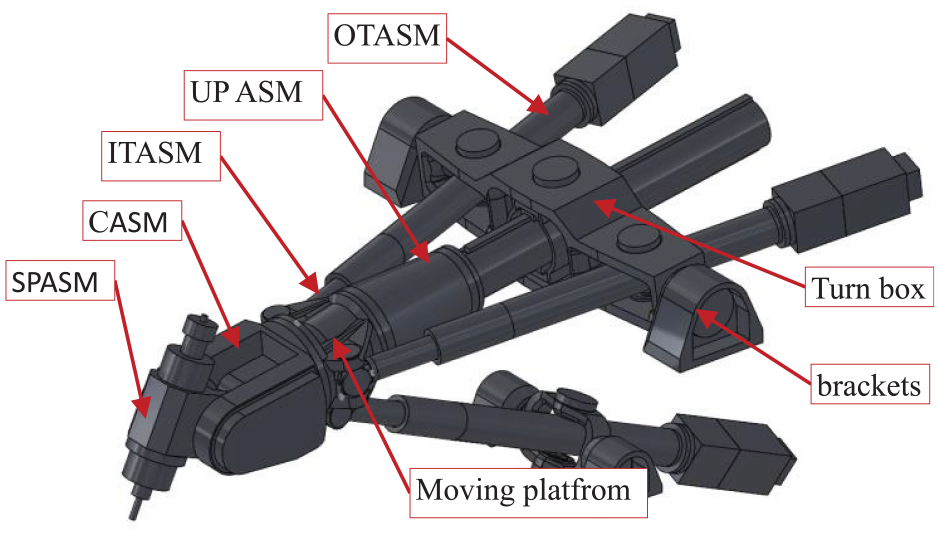
3-D model of TriMule.
According to the grouping principle mentioned in section 2, TriMule is grouped as U
Kinematics analysis
Inverse kinematic model of the 3UP S&UP
The schematic of TriMule is shown in Figure 3. Herein, Bi is supporting point, and Ai is the junction between moving platform and the ith limb. A and B are the junctions of the UP limb with the moving platform and the rotational frame, respectively. Point P is the junction of C-axis rotational shaft and A-axis rotational shaft. P’ is the intersection of spindle rotational shaft and C-axis rotational shaft. Point C is the tool center point.

Schematic diagram of TriMule robot.
The translational matrix

The translational matrix
If point A has been given, the inverse solution analysis of the 3-U
The position vector of point A in B-xyz can be calculated as


where, qi represents the length of the ith limb,
The position vector of Ai in A-uvw can be calculated as


Where,
The position vector of Bi in B-xyz can be expressed as

Where,
When


Combining equations (13) and (14) yields

There is the transformation matrix

Inverse kinematic solution of the 2R model
The position vector


where

One thing to point out is that tool-axis does not intersect with the A-axis. Therefore, in order to determine

There

When
So

Hence, taking norm on both sides of equation (18) leads to

Substituting equation (23) into equations (14)–(16), the rotational angle θ, ψ, the length qi, and the unit vector
From

According to equation (24), two rotational angles can be calculated


Take an attention, when

Gravity-center position solution
Relative to the position vector of the tool center point C, the direction vector of the gravity center of the ith limb is the same as the vector

where
The gravity-center vector of INASM in the B-xyz can be expressed as

where
The gravity-center vector of UPASM in the B-xyz can be expressed as

where
The mess of each assembly is expressed as mwi (i = 1, 2, 3), mni (i = 1, 2, 3), m4, respectively. The gravity-center vector

The whole mechanism is cantilever supported in the B-xyz. Therefore, the z-axis coordinate

The gravity-center position vector of the CASM in the B-xyz can be represented by

Where,
The gravity-center position vector of the SPASM in the B-xyz can be expressed as

where
The messes of CASM and SPASM are mA, mC, respectively. The gravity-center vector
The whole mechanism is cantilever supported in the B-xyz. Therefore, the z-axis coordinate value

Assembly parameters of TriMule are acquired by 3D model, as shown in Table 1. There are four things to add.
The length of U
The distance between the spindle axis and the point A in moving platform is 342×10−3 mm.
P’ P = 120×10−3 mm, the vector of point P in the A-uvw is {0, 0, 342×10−3 mm}, the vector of point C in P’ -xcyczc is {0, −320×10−3 mm, 0};
The workspace of TriMule600: z = [600 mm:1200 mm], x2 + y2 ≤ 6002 mm.
Assembly parameters.

Comparison with the kinematic index
The conditional number (κ) is an important evaluation approach for kinematics performance of manipulator. Literature
28
of the previous works analyzed kinematics performance of the 3U
Figure 4(a) is the spatial distribution of κ, and Figure 4(b) is the spatial distribution of RG. It can be seen from Figure 4 that κ and RG have the same distribution trend within the plane of z = 800 mm.

Distributions of κ and RG within the plane of z = 0.8m: (a) spatial distribution of κ and (b) spatial distribution of RG.
Figure 5 shows the contour distribution of κ and RG within the plane of z = 800 mm. As show in Figure 5(a), κ is symmetric about the x-axis and asymmetric about the y-axis. The minimum point of κ is (0, 0.04). It can be seen from Figure 5(b) that RG is symmetric about the x-axis and asymmetric about the y-axis. The center of contour line distributions of RG is lower than the y-axis, and the minimum point of RG value is (0, 0.04). Furthermore, it is very clear that the two evaluation methods are highly consistent with the evaluation results of the 3U

Contour line distributions of κ and RG within the plane of z = 0.8 m: (a) contour line distributions of κ and (b) contour line distributions of RG.
In order to further investigate the difference between the two evaluation approaches, the contour envelope area corresponding to the two evaluation approaches can be obtained through color filling, identification, and calculation. Figure 6(a) is the stacked diagram of the two evaluation indices, and Figure 6(b) is the proportion of contour envelope area corresponding to the two evaluation indices.

Contour line distributions of κ and RG of the plane z = 0.8: (a) contour line and (b) envelope area proportion statistics.
As shown in Figure 6(a), the contour line shapes of the two evaluation indicators are not the same, but the core areas covered by them are consistent and have good correspondence. That is to say, the optimal workspace based on the two indicators is same. In particular, Figure 6(b) shows that the two contour lines envelope areas that are almost equal, as the 0.05 of RG corresponds to the 2.2 of κ, and the 0.055 of RG corresponds to the 2.3 of κ, and so on, which finely demonstrates the consistency of the evaluation results of the two evaluation methods. Therefore, RG is effective for the kinematics performance evaluation of the mechanism.
Comparison with the dynamic index
To further verify the validity of RG, as mentioned earlier, z = 800 mm plane was selected for comparative analysis of RG and the first-order natural frequency (f1). 29
Figure 7 compares f1 from the previous works literature
29
and RG for the 3U
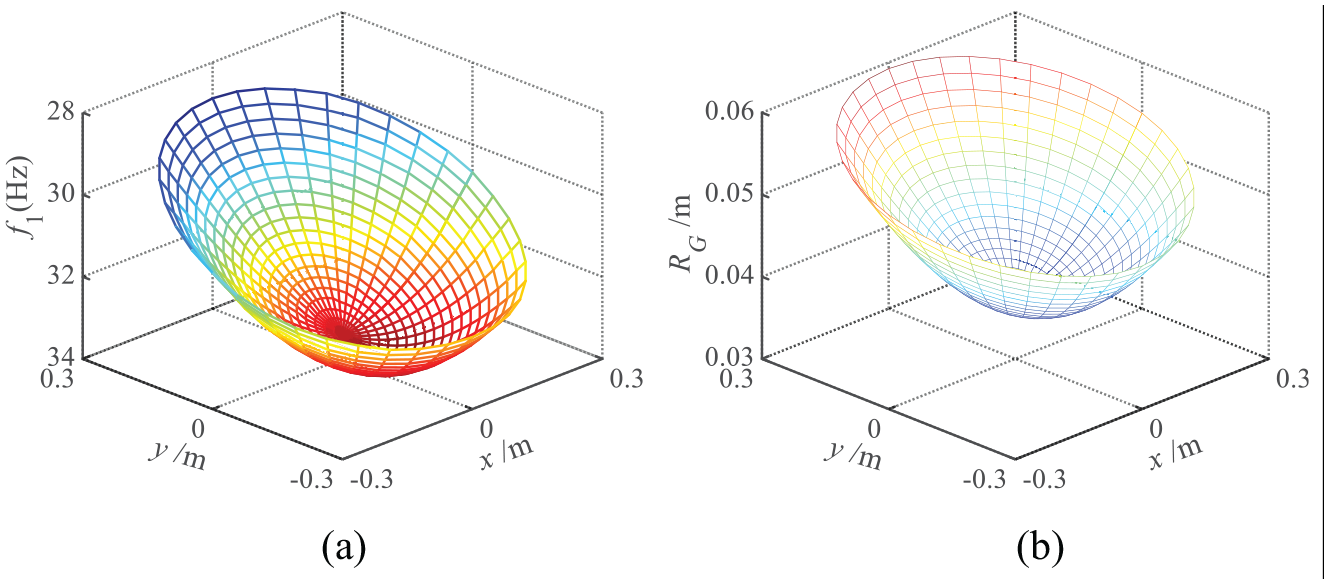
Spatial distributions of f1 and RG within the plane of z = 800 mm: (a) spatial distribution of f1 and (b) spatial distribution of RG.
Contour line distributions of f1 and RG within the plane of z = 800 mm as shown in Figure 8, where the shape of the two contour lines is ellipse. As show in Figure 8(a), f1 is symmetric about the x-axis and asymmetric about the y-axis. The minimum point of κ is (0, 0.04), and the center of contour line distributions is lower than the y-axis. As shown in Figure 8(b), RG is symmetric about the x-axis and asymmetric about the y-axis. The center of contour line distributions of RG is lower than the y-axis, and the minimum point of RG value is (0, 0.04). Therefore, it is very clear that the two evaluation methods are highly consistent with the evaluation results of the 3U

Contour line distributions of κ and RG within the plane of z = 0.8: (a) contour line distributions of κ and (b) contour line distributions of RG.
In order to further investigate the difference between the two evaluation approaches, the contour line envelope areas corresponding to the two evaluation approaches can be obtained through color filling and identification. Figure 9(a) is the stacked diagram of the two evaluation indices, and Figure 9(b) is the proportion of contour line envelope areas corresponding to the two evaluation indices.

Contour lines distributions of κ and RG of the plane z = 0.8: (a) contour lines and (b) envelope area proportion statistics.
Figure 9(a) shows the core areas covered by the contour line shapes of the two evaluation indicators are consistent. The results show the two evaluation indicators have a good correspondence. The difference is that the contour lines of f1 have a certain displacement along the y-axis compared with the contour lines of RG.
As shown in Figure 9(b), although there is a certain difference in 0.045 and 32, the overall contour line envelope areas are very consistent, which finely demonstrates the consistency of the evaluation results based on the two evaluation methods. All aforementioned proofs indicate the effectiveness of RG on the performance evaluation for manipulator. From the foregoing analysis, κ, f1, and RG are consistent in the performance evaluation of cantilever robot. However, RG is related to the dimensional parameters, and the quantitative expression of the relationship is related to the specific topology structure of the robot.
Application
Analyses in the previous sections demonstrate enough credibility on RG for cantilever robot. However, the most key problem is the determination of RG in application. This requires enough research to establish corresponding relationship between the performance and RG. The upper boundary of RG is further determined, which is used for performance evaluation, design, and optimization.
The choice of RG for performance evaluation
The gravity-center position of TriMule in whole workspace was analyzed. The results are shown in Figures 10–13, where z = 600 mm in Figure 10, z = 800 mm in Figure 11, z = 1000 mm in Figure 12 and z = 1200 mm in Figure 13. In addition, (a) is the spatial distribution, and (b) is the corresponding contour distribution.
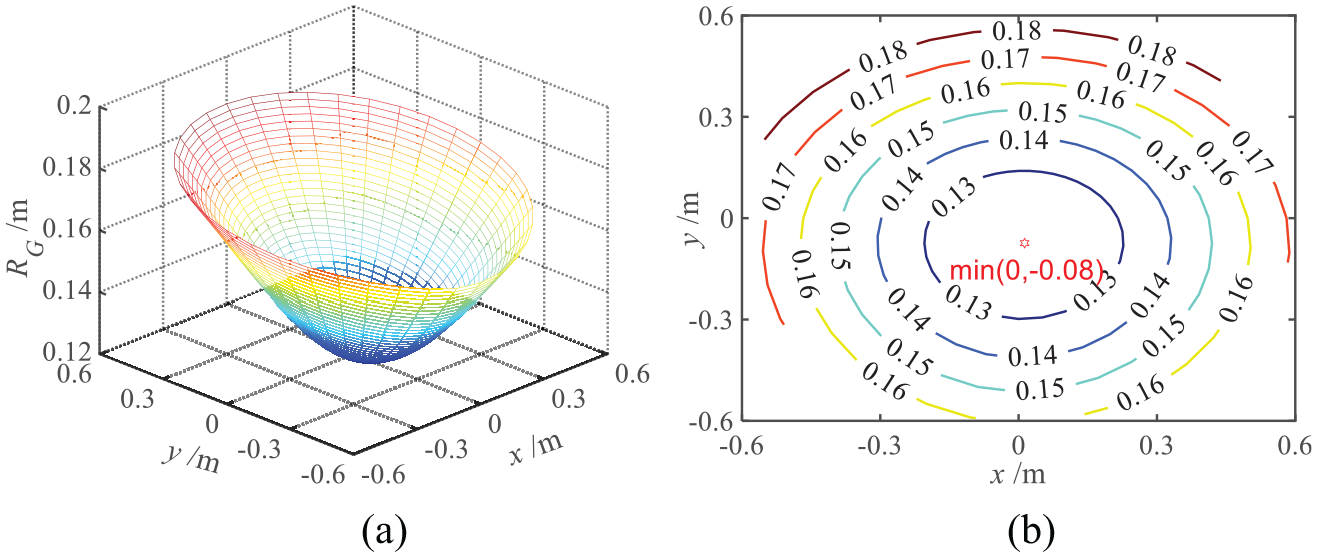
RG distribution of TriMule within the plane of z = 600 mm: (a) spatial distribution and (b) contour lines.

RG distribution of TriMule within the plane of z = 800 mm: (a) spatial distribution and (b) contour lines.

RG distribution of TriMule within the plane of z = 1000 mm: (a) spatial distribution and (b) contour lines.

RG distribution of TriMule within the plane of z = 1200 mm: (a) spatial distribution and (b) contour lines.
As shown in Figures 10–13, the distribution of RG is not symmetry about x-axis in the whole workspace; moreover, the asymmetry increases as the z increases. The reason is that the mass distribution of 2R module is not symmetry about x-axis, which is bound to show that the performance of TriMule is not symmetry about x-axis in the whole workspace. Furthermore, the bigger z, the greater the impact on the performance of the distribution. However, κ and f1 cannot accurately reflect the difference due to some simplification considerations in the modeling process.
In addition, Figures 10–13 show that the distribution of RG in the whole workspace is very consistent. However, the increase of z is not equal to the increase of RG for TriMule. According to literature, 30 the accuracy of TriMule is maintained in workspace of x = [−400 mm, 400 mm], y = [−600 mm, 300 mm] within the plane of z = 800 mm. As the spatial correspondence, the value of RG can be set as 0.26, to obtain the optimal performance space of TriMule in the whole workspace, as shown in Figure 14.
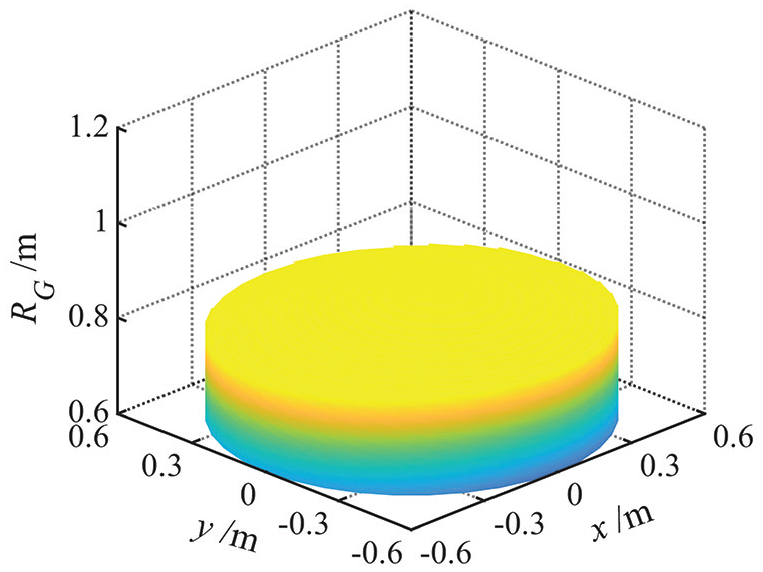
Optimal workspace based on RG.
R G value choice for design and optimization of manipulator
In the process of robot design and optimization, there are many traditional constraint variables such as kinematics constraints, force constraints, 31 dimensional constraints, pressure angle constraints, 32 and dynamic characteristics constraints. 33 However, RG can be introduced instead of kinematics and dynamic constraints at the same time, which will effectively constrain the performance of the robot. Meanwhile, RG can be utilized for the trajectory optimization constraints of manipulator.
If there is the constraint as

Where, the constant denotes the upper boundary of RG.
Predictably, κ, dimensional parameters (Di) and f1 will be constrained within the limits

In conclusion, RG is a convenient and fast performance evaluation method, which can be well applied to the design, optimization, and application evaluation of the robot.
Conclusions
This article presents a performance evaluation approach of the lower mobility hybrid robot based on the vector of gravity center for rapid evaluation, design, and optimization of the robot. The following conclusions are drawn:
A general position vector model of gravity center for the lower mobility hybrid robot in the whole workspace is constructed based on a general inverse kinematic model.
A rapid performance evaluation index RG for cantilever robot based on gravity-center position is proposed, which has high sensitivity on mess distribution.
The validity of RG is verified by comparing with the conditional number and the first natural frequency of 5-DOF hybrid robot. The results indicate that RG have enough credibility, and it can perform performance evaluation accurately for TriMule. It is proved that the gravity-center position vector is closely related to the performance of the manipulator, which is of great significance.
The boundary selection of RG is discussed, which can be used for design and optimization of lower mobility hybrid robot. If RG is introduced during design and trajectory optimization, the performance of the robot in the whole workspace will be improved.
The line distributions between the conditional number, the first natural frequency, and RG have been presented. Further work needs to be carried out to perform the relationship between position accuracy, cutting stability, and RG. These issues, however, deserve to be addressed in separate articles.
Footnotes
Declaration of conflicting interests
The author(s) declared no potential conflicts of interest with respect to the research, authorship, and/or publication of this article.
Funding
The author(s) disclosed receipt of the following financial support for the research, authorship, and/or publication of this article: This work was supported by the National Key Research Project under Grant 2017ZX04013001.