
Abstract
Objective
Chronic inflammation is central to the development of diabetes mellitus (DM) and its complications, with leukocytes acting as key mediators. This retrospective cross-sectional study aimed to investigate the association between leukocyte volume, conductivity, and light scatter (VCS) parameters and diabetes mellitus, as well as the presence of diabetic complications.
Methods
We retrospectively analyzed 295 diabetic patients and 167 healthy controls, recruited from the First Affiliated Hospital of Guangxi Medical University between October 2023 and October 2024. Diabetic patients were further stratified into groups with complications (n = 96) and without complications (n = 199). Leukocyte VCS parameters were measured using a Beckman Coulter DxH900 analyzer. ROC curve analysis evaluated discriminatory capacity. Sensitivity analysis excluded 23 patients with documented infectious diagnoses or diabetic foot. Multivariable logistic regression adjusting for age and sex assessed independent associations.
Results
Diabetic patients exhibited significantly increased leukocyte volumes compared to controls (all P < 0.0001). Lymphocyte upper median-angle light scatter (MN-UMALS-LY) showed the highest discriminatory capacity for diabetes (AUC = 0.770, 95% CI: 0.728–0.813) and modest capacity for complications (AUC = 0.615, 95% CI: 0.547–0.682). MN-UMALS-LY was independently associated with complication status after adjusting for age and sex (OR = 1.047, 95% CI: 1.015–1.080, P = 0.004). Sensitivity analysis excluding patients with infections confirmed that MN-UMALS-LY remained significant (ANOVA P = 0.017; ROC AUC = 0.604, P = 0.009).
Conclusion
Leukocyte VCS parameters, particularly MN-UMALS-LY, were significantly altered in diabetes and independently associated with complication status. These findings are exploratory and require prospective multicenter validation.
Keywords
1. Introduction
Diabetes mellitus is a chronic endocrine and metabolic disorder characterized by persistent hyperglycemia, resulting from defects in insulin secretion, insulin action, or both.1–3 The global burden of diabetes has increased dramatically over recent decades, and it has emerged as one of the most significant threats to public health worldwide.4,5 Prolonged hyperglycemia leads to progressive damage across multiple organ systems, contributing to the development of complications including diabetic nephropathy, retinopathy, peripheral neuropathy, peripheral vascular disease, diabetic foot, cardiomyopathy, and atherosclerosis.6,7
Chronic low-grade inflammation is now recognized as a fundamental pathological mechanism underlying both the onset and progression of diabetes, particularly type 2 diabetes.8,9 Pro-inflammatory cytokines, including interleukin-6 (IL-6), tumor necrosis factor-alpha (TNF-α), and C-reactive protein (CRP), are significantly elevated in diabetic patients and contribute to insulin resistance and beta-cell dysfunction.10–12 Several studies have confirmed the mechanistic link between inflammatory mediators and diabetic pathology. Rehman et al. demonstrated that inflammation-mediated nitric oxide overproduction directly compromises endogenous antioxidant status during hyperglycemia. 13 Essential oils downregulate pro-inflammatory cytokines and nitric oxide-mediated oxidative stress in diabetogenic animal models. 14 Hesperidin improves insulin resistance via downregulation of IL-6, TNF-α, and leptin, 15 and genistein enhances GLP-1 secretion by reducing inflammatory mediator levels. 16 Collectively, these studies establish that leukocytes, as the primary cellular mediators of inflammatory responses, are central to diabetic pathology.
Leukocytes serve as key executors of the inflammatory cascade in diabetes.17,18 The neutrophil-to-lymphocyte ratio (NLR) and platelet-to-lymphocyte ratio (PLR) have emerged as practical inflammatory markers in type 2 diabetes,19–21 and total and differential leukocyte counts predict diabetes incidence in prospective studies.22,23 Leukocyte phenotyping has been proposed as a marker for cardiovascular risk in diabetes. 24 However, research on leukocyte morphological and functional changes in the context of diabetes remains limited. 25
Volume, conductivity, and light scatter (VCS) technology is a fundamental detection principle in modern hematology analyzers,26,27 providing simultaneous physical morphological parameters of leukocytes during routine complete blood count (CBC) testing. Cell volume reflects cell size, conductivity measures internal composition and membrane properties, and light scatter at various angles provides information regarding nuclear complexity and cytoplasmic granularity. 28 VCS parameters have demonstrated significant clinical utility in inflammatory conditions, particularly sepsis detection (AUC 0.85–0.92 for neutrophil mean volume),29–31 and have been compared favorably with procalcitonin and interleukin-6 in predicting sepsis in cirrhosis. Recent literature has expanded VCS applications beyond infectious diseases. However, no studies have investigated VCS parameters specifically in diabetes mellitus.
Therefore, this study aimed to evaluate the association between leukocyte VCS parameters and diabetes mellitus, and to explore whether these parameters differ between diabetic patients with and without complications.
2. Methods
2.1. Data source and study design
This was a retrospective cross-sectional study conducted at the First Affiliated Hospital of Guangxi Medical University, Nanning, China. The reporting conforms to STROBE guidelines. 32 The study was conducted in accordance with the Declaration of Helsinki as revised in 2024. 33 The study was approved by the Ethics Review Board (Approval No.: 2025-E0855; Date of Approval: October 20, 2025). Informed consent was waived given the retrospective design. All patient data were de-identified.
All the data were collected from October 2023 to October 2024. All data were extracted from routine blood tests. A total of 295 diabetic patients (209 males and 86 females, aged 15-93 years) and 167 healthy controls (88 males and 79 females, aged 15-81 years) were included.
2.2. Laboratory measurements
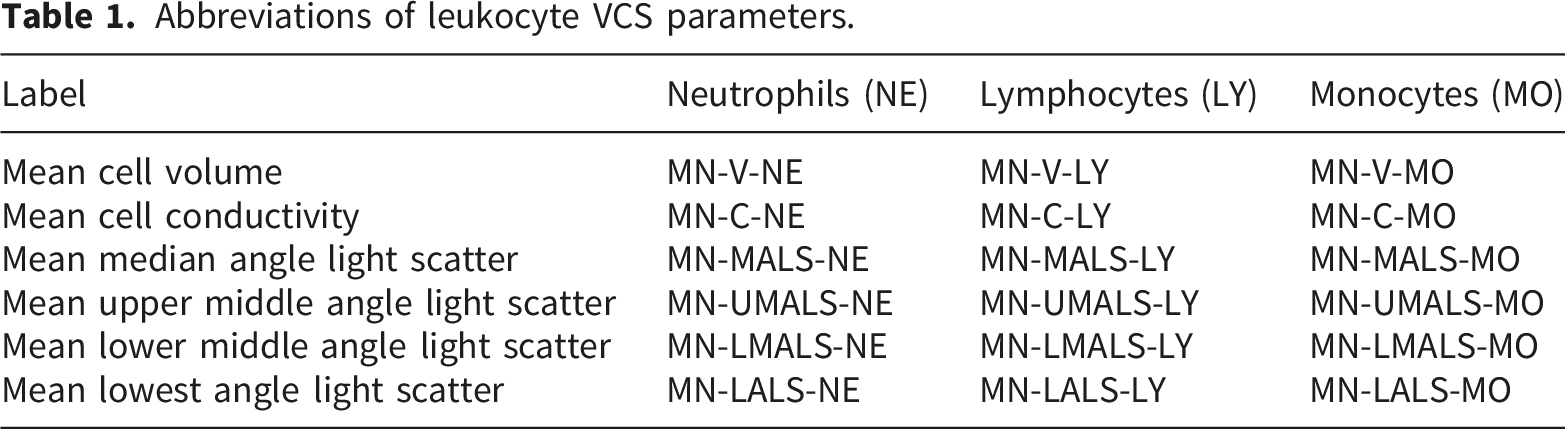
Leukocyte volume, conductivity, and light scatter (VCS) parameters were quantified using a Beckman Coulter DxH900 automated hematology analyzer. Key parameters included: Mean Cell Volume (MN-V), Mean Cell Conductivity (MN-C), Mean Median Angle Light Scatter (MN-MALS), Mean Upper Median Angle Light Scatter (MN-UMALS), Mean Lower Median Angle Light Scatter (MN-LMALS), and Mean Low Angle Light Scatter (MN-LALS), measured for neutrophils (NE), lymphocytes (LY), and monocytes (MO). Daily calibration and quality controls were performed. Samples were analyzed within 2 hours of EDTA-anticoagulated collection. Representative cell morphology images were captured using the Hunan Pinxin Bone Marrow/Blood Cell Morphology AI Scanning Analysis System (CR-GS series, Hunan Pinxin Medical Technology Co., Ltd., China) for illustrative purposes only.
2.3. Group definitions
Diabetic patients were categorized into a complications group (n = 96) and non-complications group (n = 199). Complications included: diabetic foot (n = 10), retinopathy (n = 20), peripheral neuropathy (n = 21), nephropathy (n = 26), peripheral vascular disease (n = 16), Diabetic ketoacidosis (n = 3). A total of 45 patients had ≥2 concurrent complications.
2.4. Statistical analysis
Continuous variables were expressed as mean ± SD. Normality was assessed using the Shapiro-Wilk test. Two-group comparisons used unpaired t-tests; three-group comparisons used one-way ANOVA with Tukey’s test. Pearson correlation coefficients (r) with P values were calculated for VCS parameters versus NLR within diabetic patients.
ROC curve analysis: ROC curves evaluated discriminatory capacity of lymphocyte light scatter parameters: (1) diabetes (n = 295) vs. controls (n = 167); (2) complications (n = 96) vs. non-complications (n = 199). AUC with 95% CI, optimal cutoff (Youden index), sensitivity, and specificity were reported.
Sensitivity analysis: To address the concern that concurrent acute or severe infections could independently alter leukocyte parameters, a pre-planned sensitivity analysis was performed. Twenty-three patients in the complications group who had documented infectious diagnoses in their clinical records — including diabetic foot ulcers with secondary infection, urinary tract infections, and infected ulcers — were identified and excluded. The primary ANOVA comparisons and ROC analysis were repeated using the remaining 73 patients in the complications group versus the non-complications group and healthy controls.
Multivariable logistic regression: Binary logistic regression assessed the independent association of VCS parameters with complication status, adjusting for age and sex. Given the high correlation between MN-MALS-LY and MN-UMALS-LY, three models were constructed: Model 1 included both parameters simultaneously; Models 2a and 2b included MN-UMALS-LY and MN-MALS-LY separately, to evaluate the impact of multicollinearity. The Enter method was used. OR with 95% CI were reported.
Multiple VCS parameters were tested across three leukocyte subsets, increasing type I error risk. Formal correction across all parameters was not applied beyond Tukey’s post hoc test. P < 0.05 was considered significant. Analyses used GraphPad Prism 9.0 (GraphPad Software, USA) and IBM SPSS Statistics 25.0 (IBM Corp., Armonk, NY, USA).
3. Results
3.1. Baseline characteristics
A total of 295 diabetic patients and 167 controls were included. The diabetic group comprised 209 males (70.8%) and 86 females (29.2%), mean age 60.36 ± 14.06 years. Controls comprised 88 males (52.7%) and 79 females (47.3%), mean age 51.74 ± 15.68 years. Among the 96 complications patients: diabetic foot 10 (10.4%), retinopathy 20 (20.8%), peripheral neuropathy 21 (21.9%), nephropathy 26 (27.1%), peripheral vascular disease 16 (16.7%), other 3 (3.1%); 45 (46.9%) had ≥2 complications.
Representative morphological alterations were observed in peripheral blood neutrophils, lymphocytes, and monocytes from diabetic patients, including variations in cell size and nuclear complexity that corresponded to changes in VCS parameters (Figure 1). All abbreviations used in this study are defined in Table 1. Representative images of peripheral blood leukocytes. (a) Normal monocyte morphology. (b–d) Abnormal monocytes exhibiting increased cell size and altered nuclear complexity observed in diabetic patients. Cell images were captured using the Hunan Pinxin Bone Marrow/Blood Cell Morphology AI Scanning Analysis System (CR-GS series) for illustrative purposes only. Abbreviations of leukocyte VCS parameters.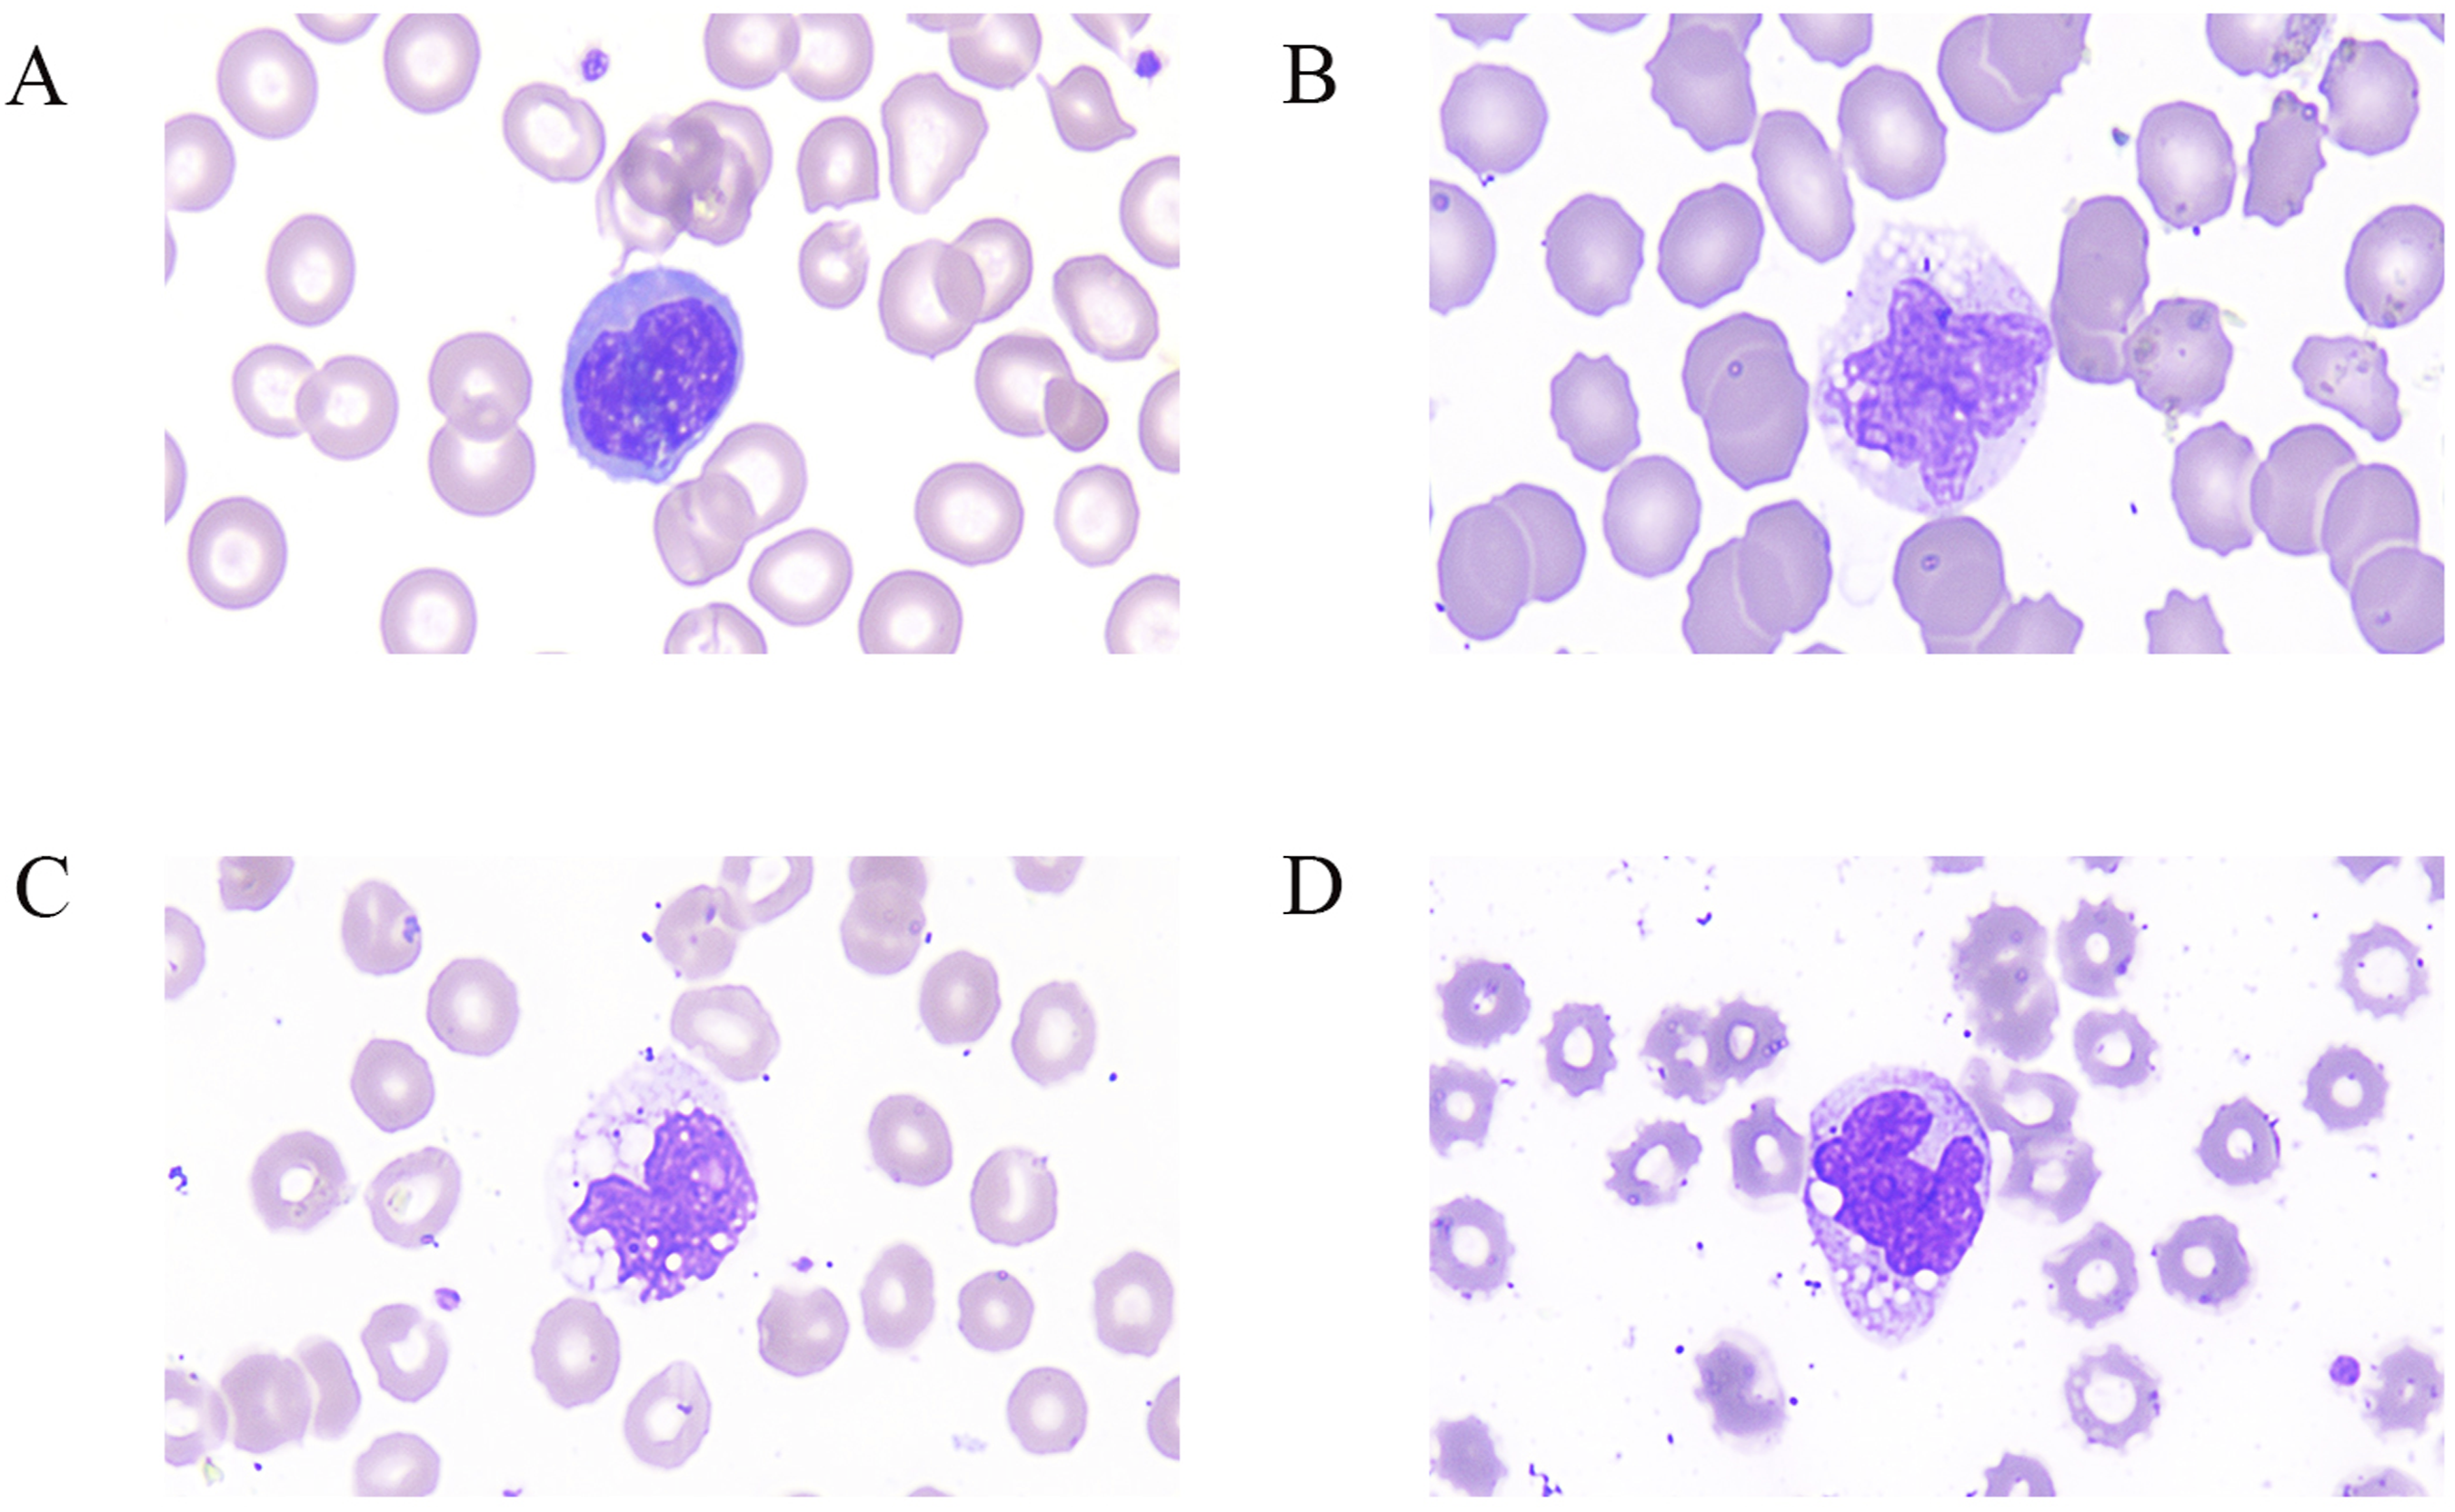
3.2. Leukocyte volume analysis
Leukocyte volumes were measured across all three major subsets in order to investigate whether diabetes-associated inflammation alters cell size (Figure 2). Compared with healthy controls, diabetic patients exhibited significantly increased mean neutrophil volume (MN-V-NE: 148.7 ± 9.639 vs. 142.8 ± 6.679, P < 0.0001, Figure 2(a)), mean lymphocyte volume (MN-V-LY: 89.43 ± 6.272 vs. 87.19 ± 5.078, P < 0.0001, Figure 2(b)), and mean monocyte volume (MN-V-MO: 172.7 ± 11.51 vs. 164.6 ± 6.812, P < 0.0001, Figure 2(c)). When the diabetic group was further stratified by complication status, no significant differences in cell volumes were observed between the complications and non-complications groups (all P > 0.05, Figure 2(d)–(f)), suggesting that the volume increase is a general feature of diabetic inflammation rather than a specific indicator of complication status. Comparison of mean leukocyte volumes between groups. (a–c) Two-group comparisons between healthy controls (n = 167) and diabetic patients (n = 295) for neutrophils (a), lymphocytes (b), and monocytes (c). (d–f) Three-group comparisons among healthy controls (n = 167), diabetic patients with complications (n = 96), and diabetic patients without complications (n = 199) for neutrophils (d), lymphocytes (e), and monocytes (f). Data are expressed as mean ± SD. Statistical analysis: unpaired t-test for two-group comparisons; one-way ANOVA with Tukey’s multiple comparisons test for three-group comparisons. ****P < 0.0001. ns = not significant. VCS parameters are expressed in arbitrary units as reported by the Beckman Coulter DxH900 analyzer.
3.3. Leukocyte conductivity analysis
Conductivity parameters, which reflect cytoplasmic composition and membrane permeability, were also examined across the three groups (Figure 3). Significant differences were observed only in neutrophils: MN-C-NE was slightly higher in controls (144.7 ± 6.897) than in the diabetes group (143.1 ± 6.678, P < 0.05, Figure 3(a)). The mean conductivity of lymphocytes and monocytes showed no statistically significant differences among the diabetes, complications, and control groups (all P > 0.05). Given the small effect size and the context of multiple comparisons performed in this study, the neutrophil conductivity difference should be interpreted with caution and may represent a chance finding. Comparison of mean leukocyte conductivity between groups. (a–c) Two-group comparisons between healthy controls (n = 167) and diabetic patients (n = 295) for neutrophils (a), lymphocytes (b), and monocytes (c). (d–f) Three-group comparisons among healthy controls (n = 167), diabetic patients with complications (n = 96), and diabetic patients without complications (n = 199) for neutrophils (d), lymphocytes (e), and monocytes (f). Data are expressed as mean ± SD. Statistical analysis: unpaired t-test for two-group comparisons; one-way ANOVA with Tukey’s multiple comparisons test for three-group comparisons. *P < 0.05. ns = not significant.
3.4. Leukocyte light scatter analysis
Light scatter parameters at different angles were analyzed for all three leukocyte subsets to evaluate changes in nuclear complexity and cytoplasmic granularity (Figures 4 and 5). Comparison of mean median angle and upper median angle light scatter between groups. (a and b) Two-group comparisons of median angle light scatter (MN-MALS) between healthy controls (n = 167) and diabetic patients (n = 295) for neutrophils (a) and lymphocytes (b). (c and d) Three-group comparisons of MN-MALS among healthy controls (n = 167), complications (n = 96), and non-complications (n = 199) for neutrophils (c) and lymphocytes (d). (e and f) Two-group comparisons of upper median angle light scatter (MN-UMALS) between healthy controls and diabetic patients for lymphocytes (e) and monocytes (f). (g and h) Three-group comparisons of MN-UMALS among healthy controls, complications, and non-complications for lymphocytes (g) and monocytes (h). Data are expressed as mean ± SD. Statistical analysis: unpaired t-test for two-group comparisons; one-way ANOVA with Tukey’s multiple comparisons test for three-group comparisons. *P < 0.05, **P < 0.01, ***P < 0.001, ****P < 0.0001. ns = not significant. Comparison of mean lower median angle and low angle light scatter between groups. (a–c) Two-group comparisons between healthy controls (n = 167) and diabetic patients (n = 295) for lymphocyte low angle light scatter (MN-LALS-LY, A), monocyte low angle light scatter (MN-LALS-MO, B), and neutrophil lower median angle light scatter (MN-LMALS-NE, C). (d–f) Three-group comparisons among healthy controls (n = 167), complications (n = 96), and non-complications (n = 199) for the same parameters (d–f). Data are expressed as mean ± SD. Statistical analysis: unpaired t-test for two-group comparisons; one-way ANOVA with Tukey’s multiple comparisons test for three-group comparisons. ***P < 0.001, ****P < 0.0001. ns = not significant.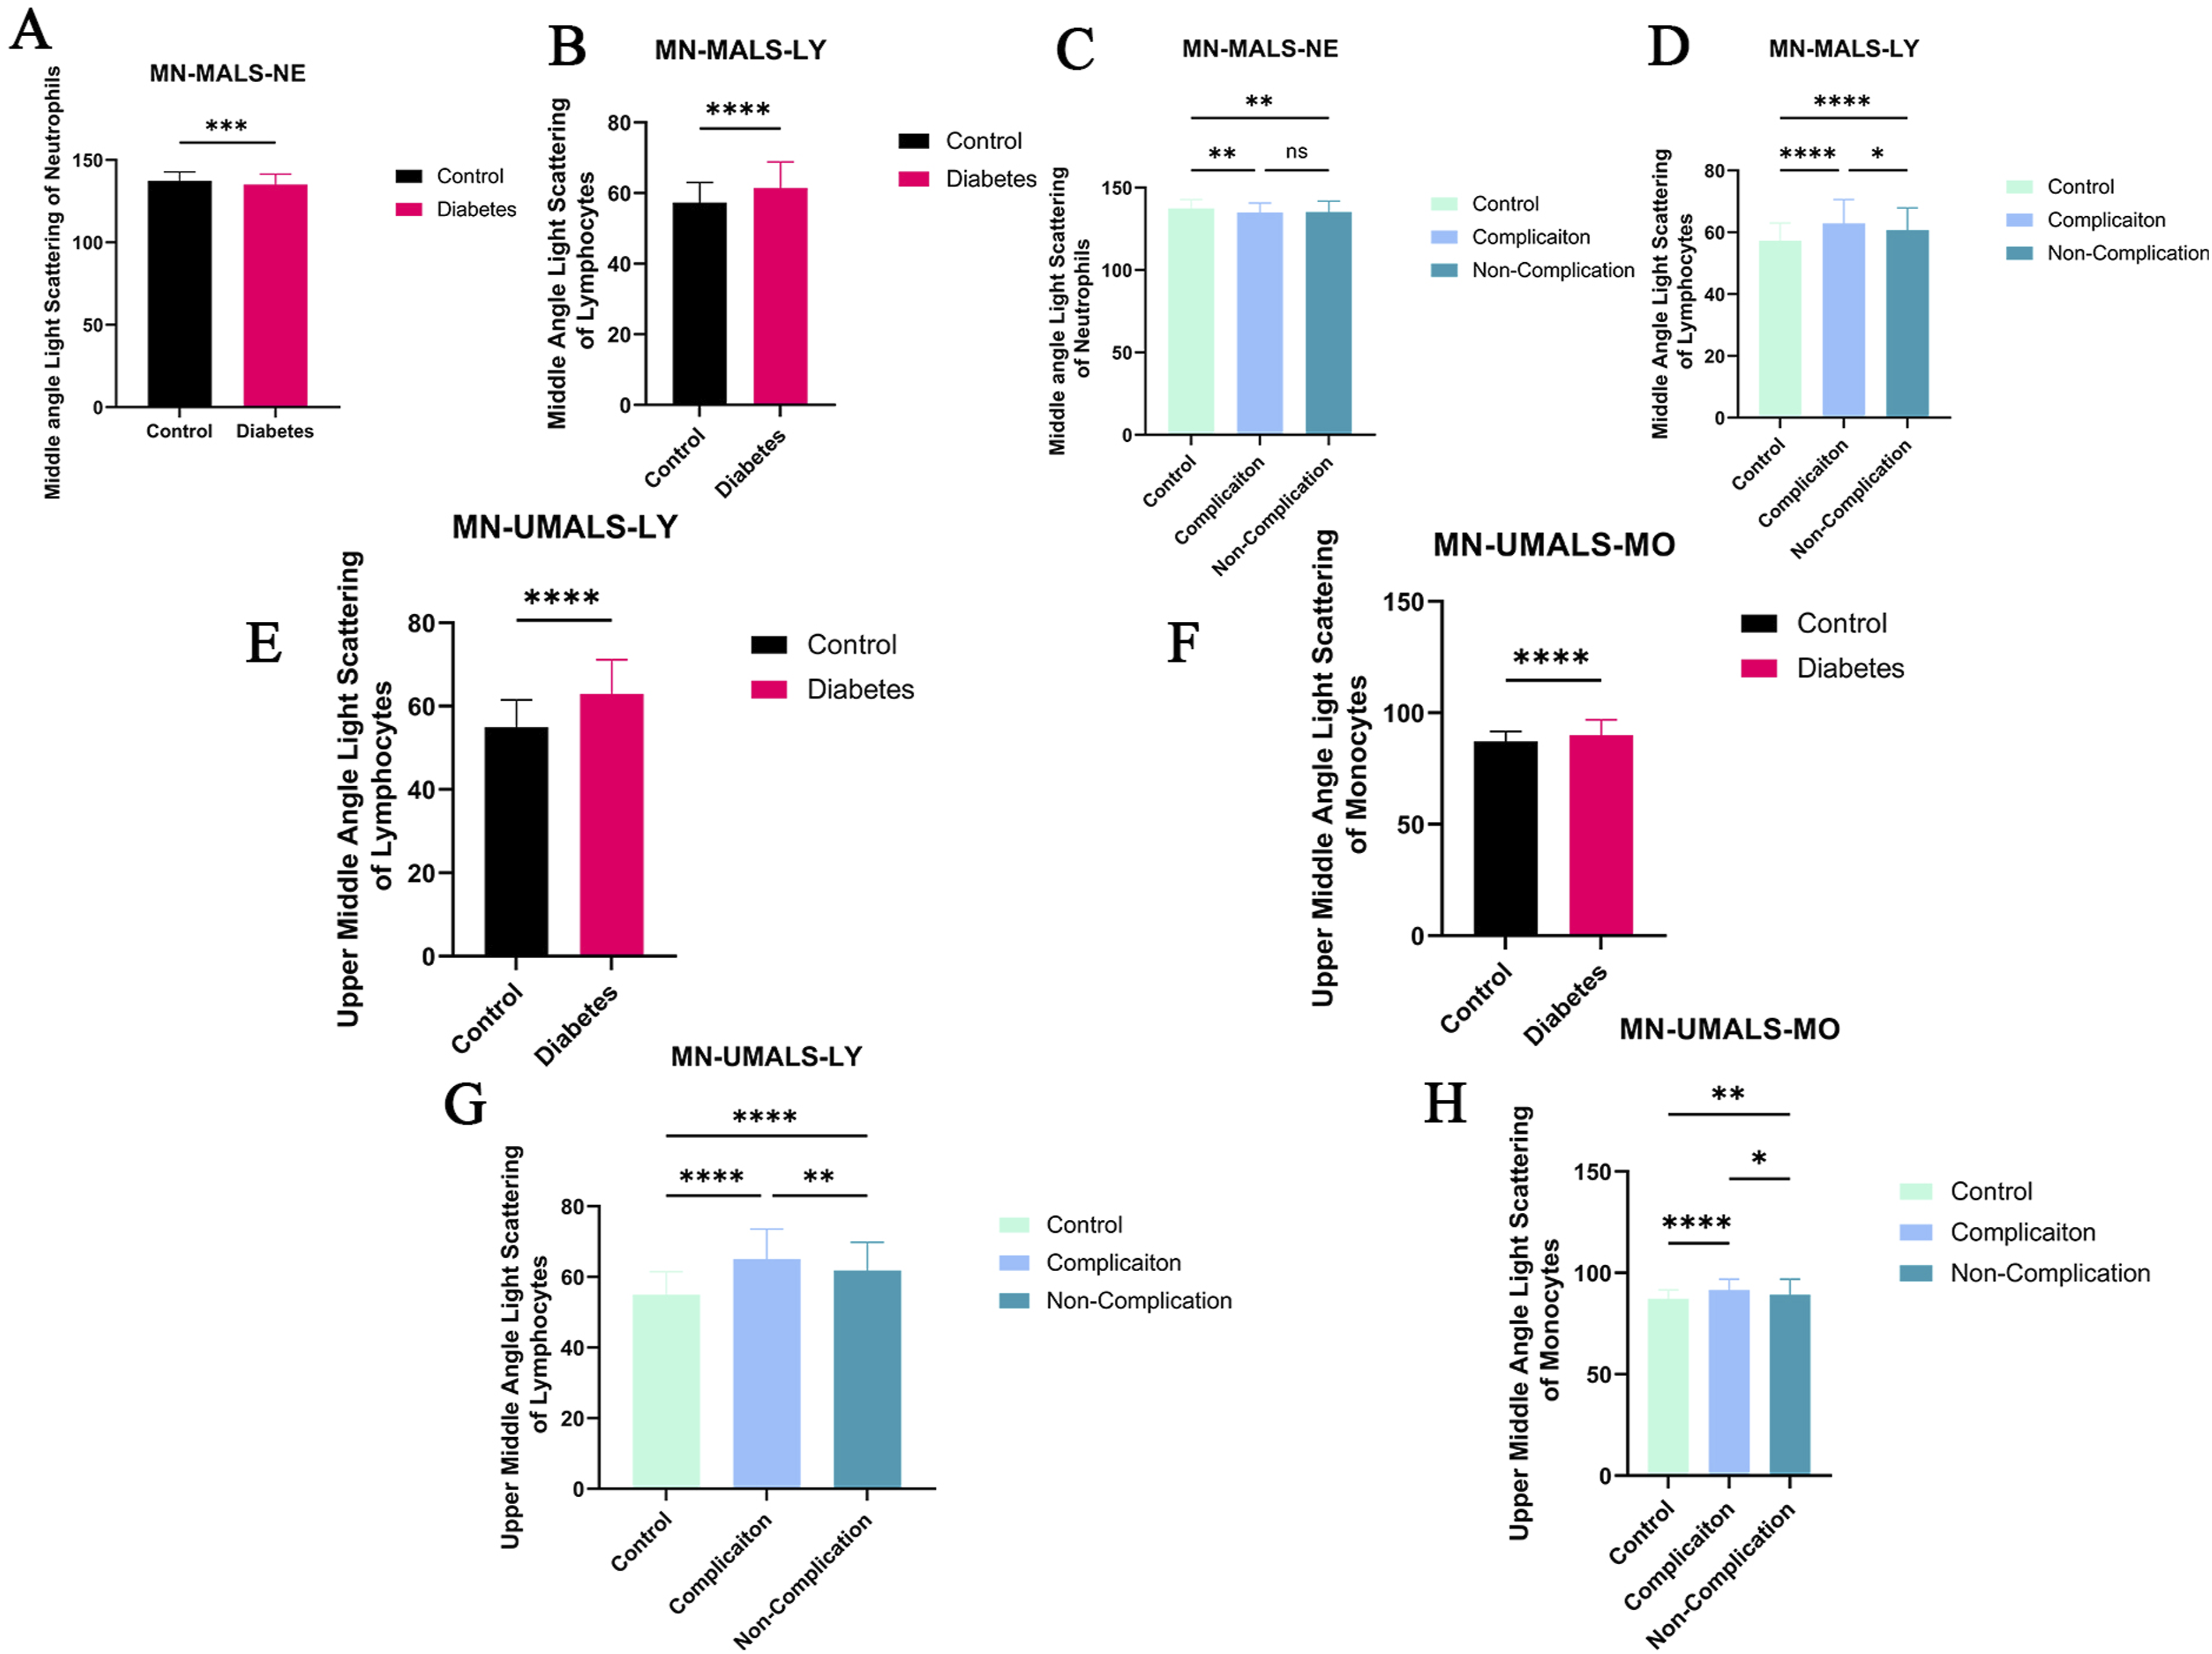

At median angles, a divergent pattern was observed between neutrophils and lymphocytes. MN-MALS-NE was significantly higher in controls (137.4 ± 5.488) than in the diabetes group (135.1 ± 6.363, P < 0.001, Figure 4(a)), with no further distinction between complication subgroups (Figure 4(c)). Conversely, MN-MALS-LY was significantly elevated in the diabetes group (61.44 ± 7.414) compared with controls (57.31 ± 5.729, Figure 4(b)). A graded increase was apparent across disease severity: the complications group (62.92 ± 7.687) showed significantly higher MN-MALS-LY than both the non-complications group (60.73 ± 7.190, P < 0.05) and controls (P < 0.0001, Figure 4(d)).
At upper median angles, an even more pronounced pattern emerged. MN-UMALS-LY in the complications group (65.03 ± 8.525) was significantly higher than in controls (54.96 ± 6.529, P < 0.0001) and the non-complications group (61.85 ± 8.016, P < 0.01, Figure 4(e) and (g)). Similarly, MN-UMALS-MO in the complications group (91.55 ± 5.38) was significantly higher than in the non-complications group (89.31 ± 7.65, P < 0.05) and controls (87.23 ± 4.491, P < 0.0001, Figure 4(f) and (h)). These findings suggest that light scatter at upper median angles may be particularly sensitive to the structural intracellular changes associated with diabetic complications.
At lower angles, a consistent pattern of decreased scatter was observed in diabetic patients. MN-LALS-LY was higher in controls (34.47 ± 2.257) than in the diabetes group (33.35 ± 2.866, P < 0.0001, Figure 5(a) and (d)). MN-LALS-MO was similarly higher in controls (87.25 ± 13.76) versus diabetes (80.44 ± 14.57, P < 0.0001, Figure 5(b) and (e)). MN-LMALS-NE was higher in controls (134.4 ± 6.014) versus diabetes (131 ± 10.82, P < 0.001, Figure 5(c) and (f)). This bidirectional pattern — increased scatter at median and upper median angles coupled with decreased scatter at lower angles — may reflect distinct aspects of intracellular remodeling during inflammatory activation.
3.5. ROC curve analysis
To quantify the discriminatory capacity of the most consistently altered parameters, ROC curve analyses were performed for MN-MALS-LY and MN-UMALS-LY (Figure 6, Table 2). Receiver operating characteristic (ROC) curves for lymphocyte light scatter parameters. (a) Discrimination between healthy controls (n = 167) and diabetic patients (n = 295): MN-UMALS-LY AUC = 0.770 (95% CI: 0.728–0.813, P < 0.0001), MN-MALS-LY AUC = 0.673 (95% CI: 0.625–0.721, P < 0.0001). (b) Discrimination between diabetic patients with complications (n = 96) and without complications (n = 199): MN-UMALS-LY AUC = 0.615 (95% CI: 0.547–0.682, P = 0.001), MN-MALS-LY AUC = 0.571 (95% CI: 0.500–0.641, P = 0.049). The diagonal dashed line represents the line of no discrimination (AUC = 0.5). ROC curve analysis of lymphocyte light scatter parameters.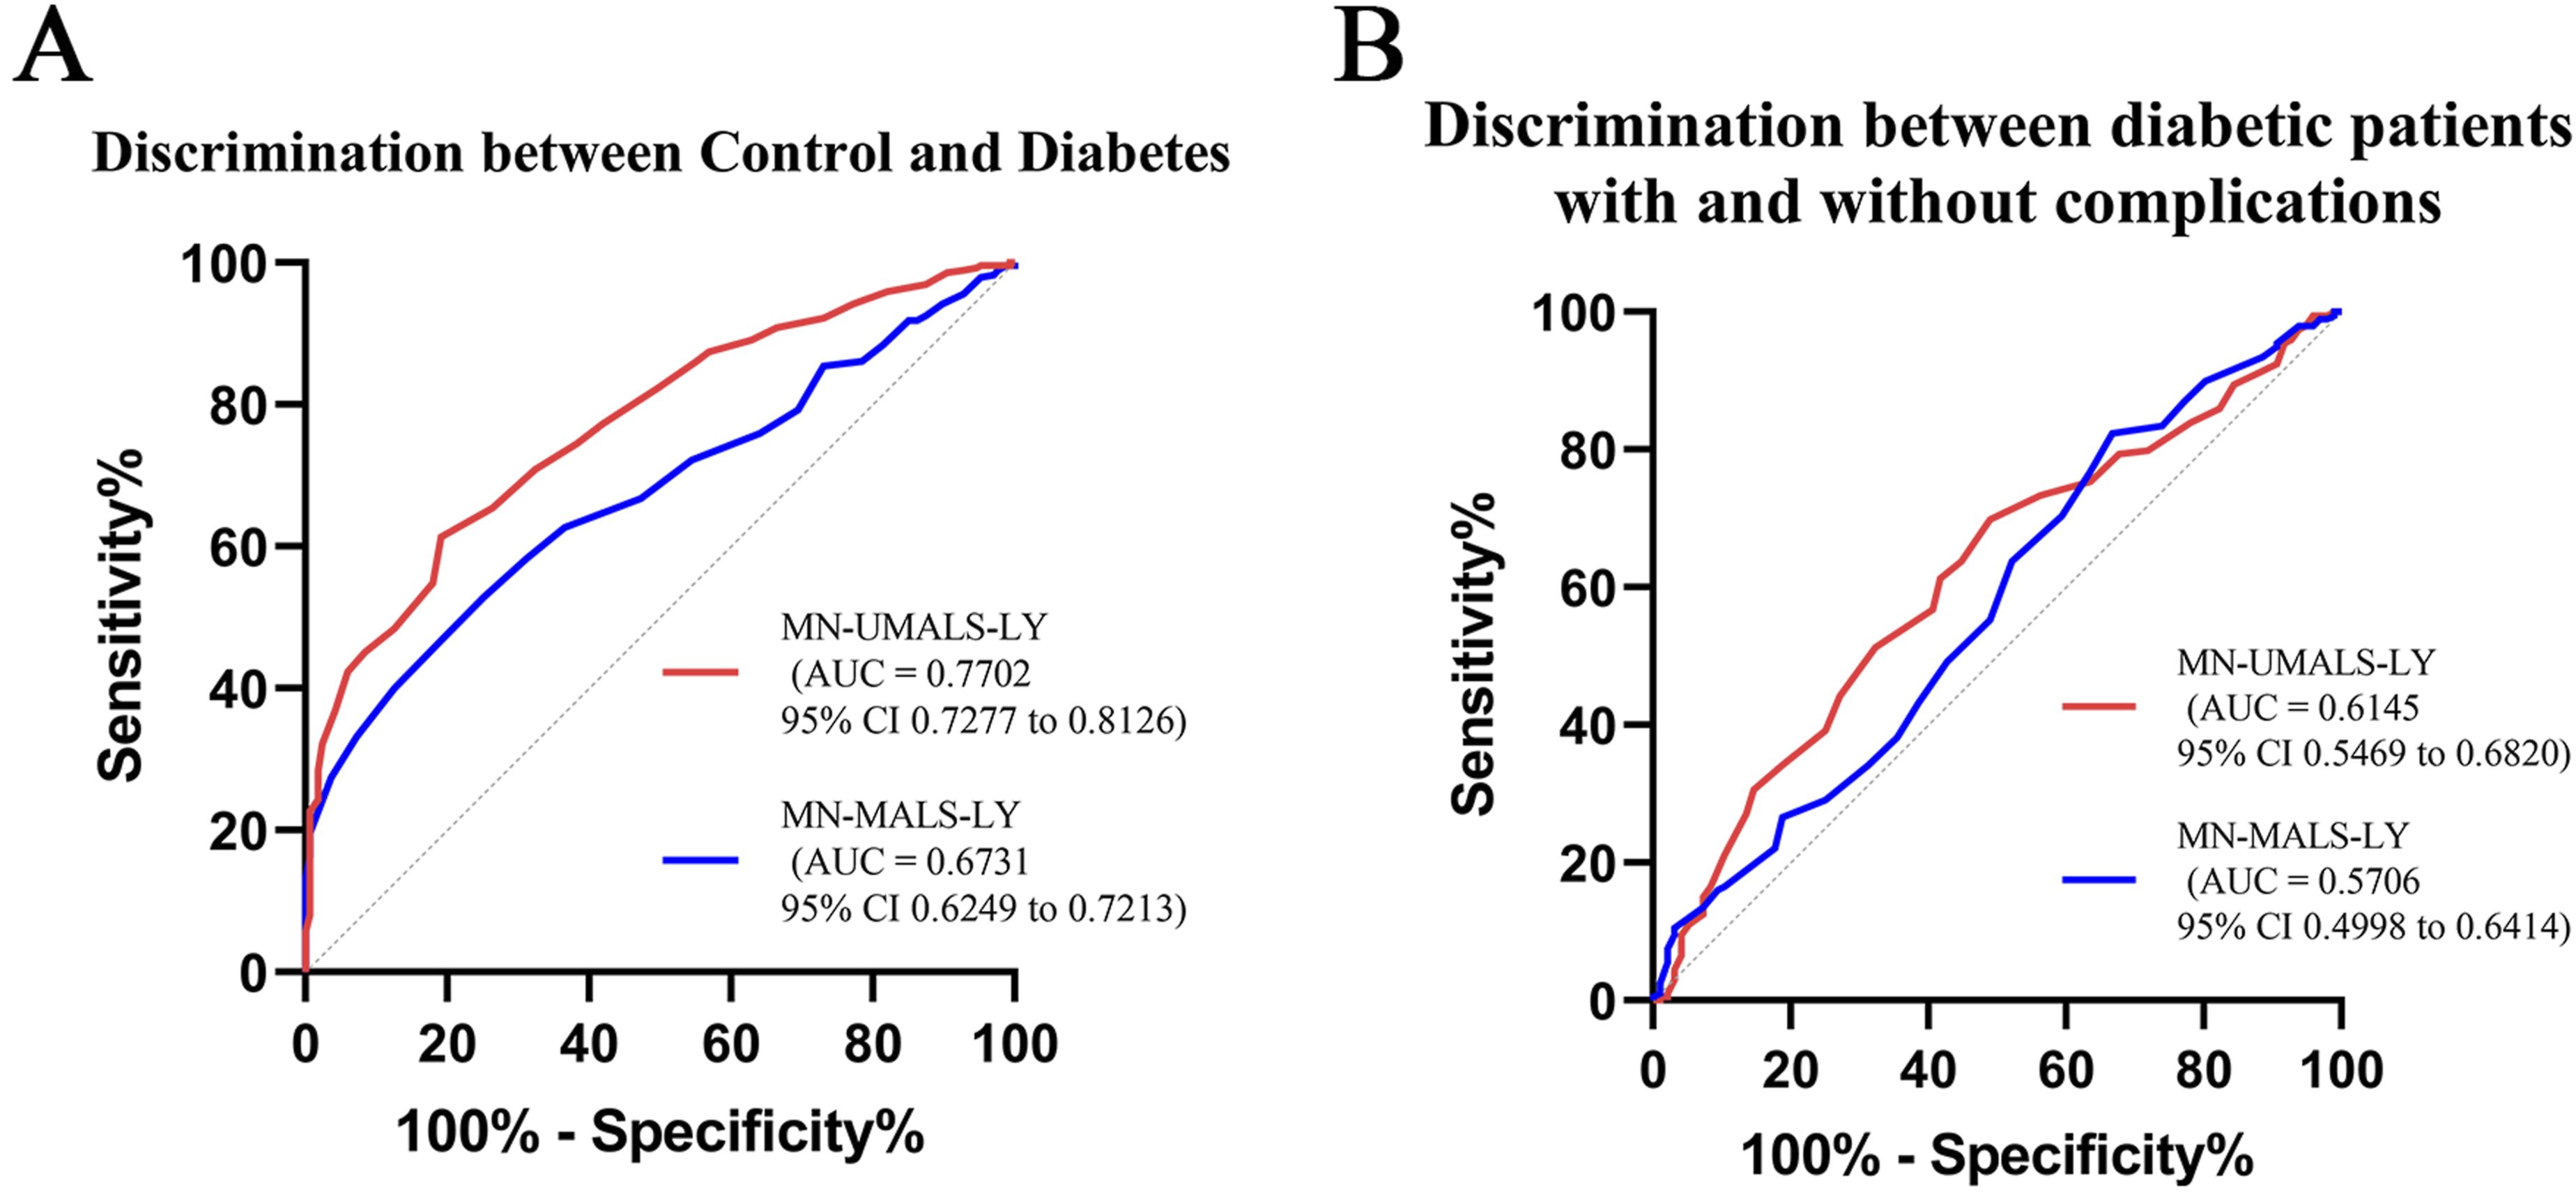
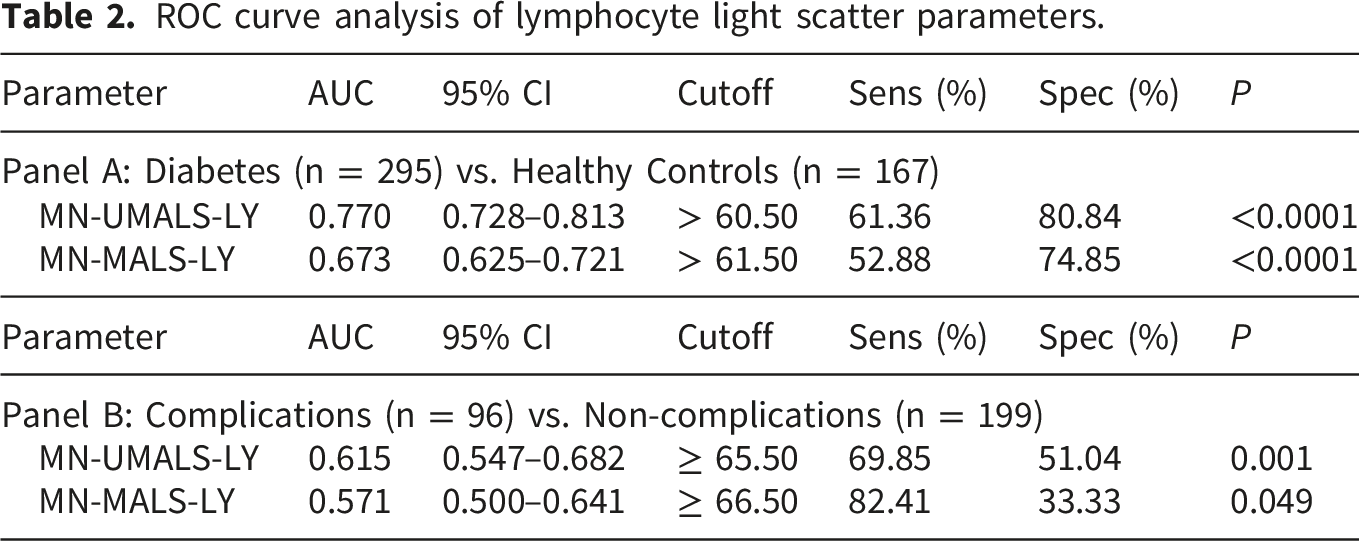
For distinguishing diabetic patients from healthy controls (Figure 6(a)), MN-UMALS-LY demonstrated moderate discriminatory capacity with an AUC of 0.770 (95% CI: 0.728–0.813), while MN-MALS-LY yielded a lower AUC of 0.673 (95% CI: 0.625–0.721). These results indicate that MN-UMALS-LY provides superior overall discrimination for diabetes status.
For distinguishing diabetic patients with complications from those without (Figure 6(b)), the discriminatory capacity was more limited. MN-UMALS-LY yielded an AUC of 0.615 (95% CI: 0.547–0.682) and MN-MALS-LY yielded an AUC of 0.571 (95% CI: 0.500–0.641). Although both parameters showed statistically significant group differences in ANOVA (Section 3.4), the modest AUC values indicate that these parameters alone are insufficient for reliable individual patient classification and would need to be integrated with other clinical indicators for meaningful clinical application.
3.6. Correlation analysis with NLR
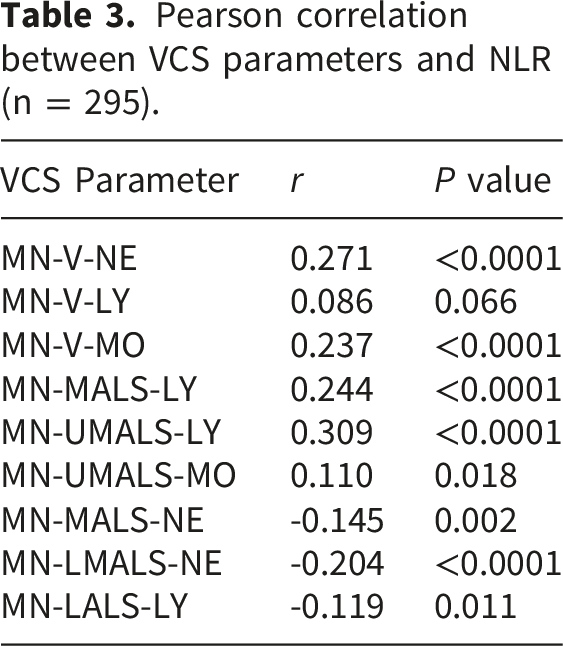
Pearson correlation between VCS parameters and NLR (n = 295).
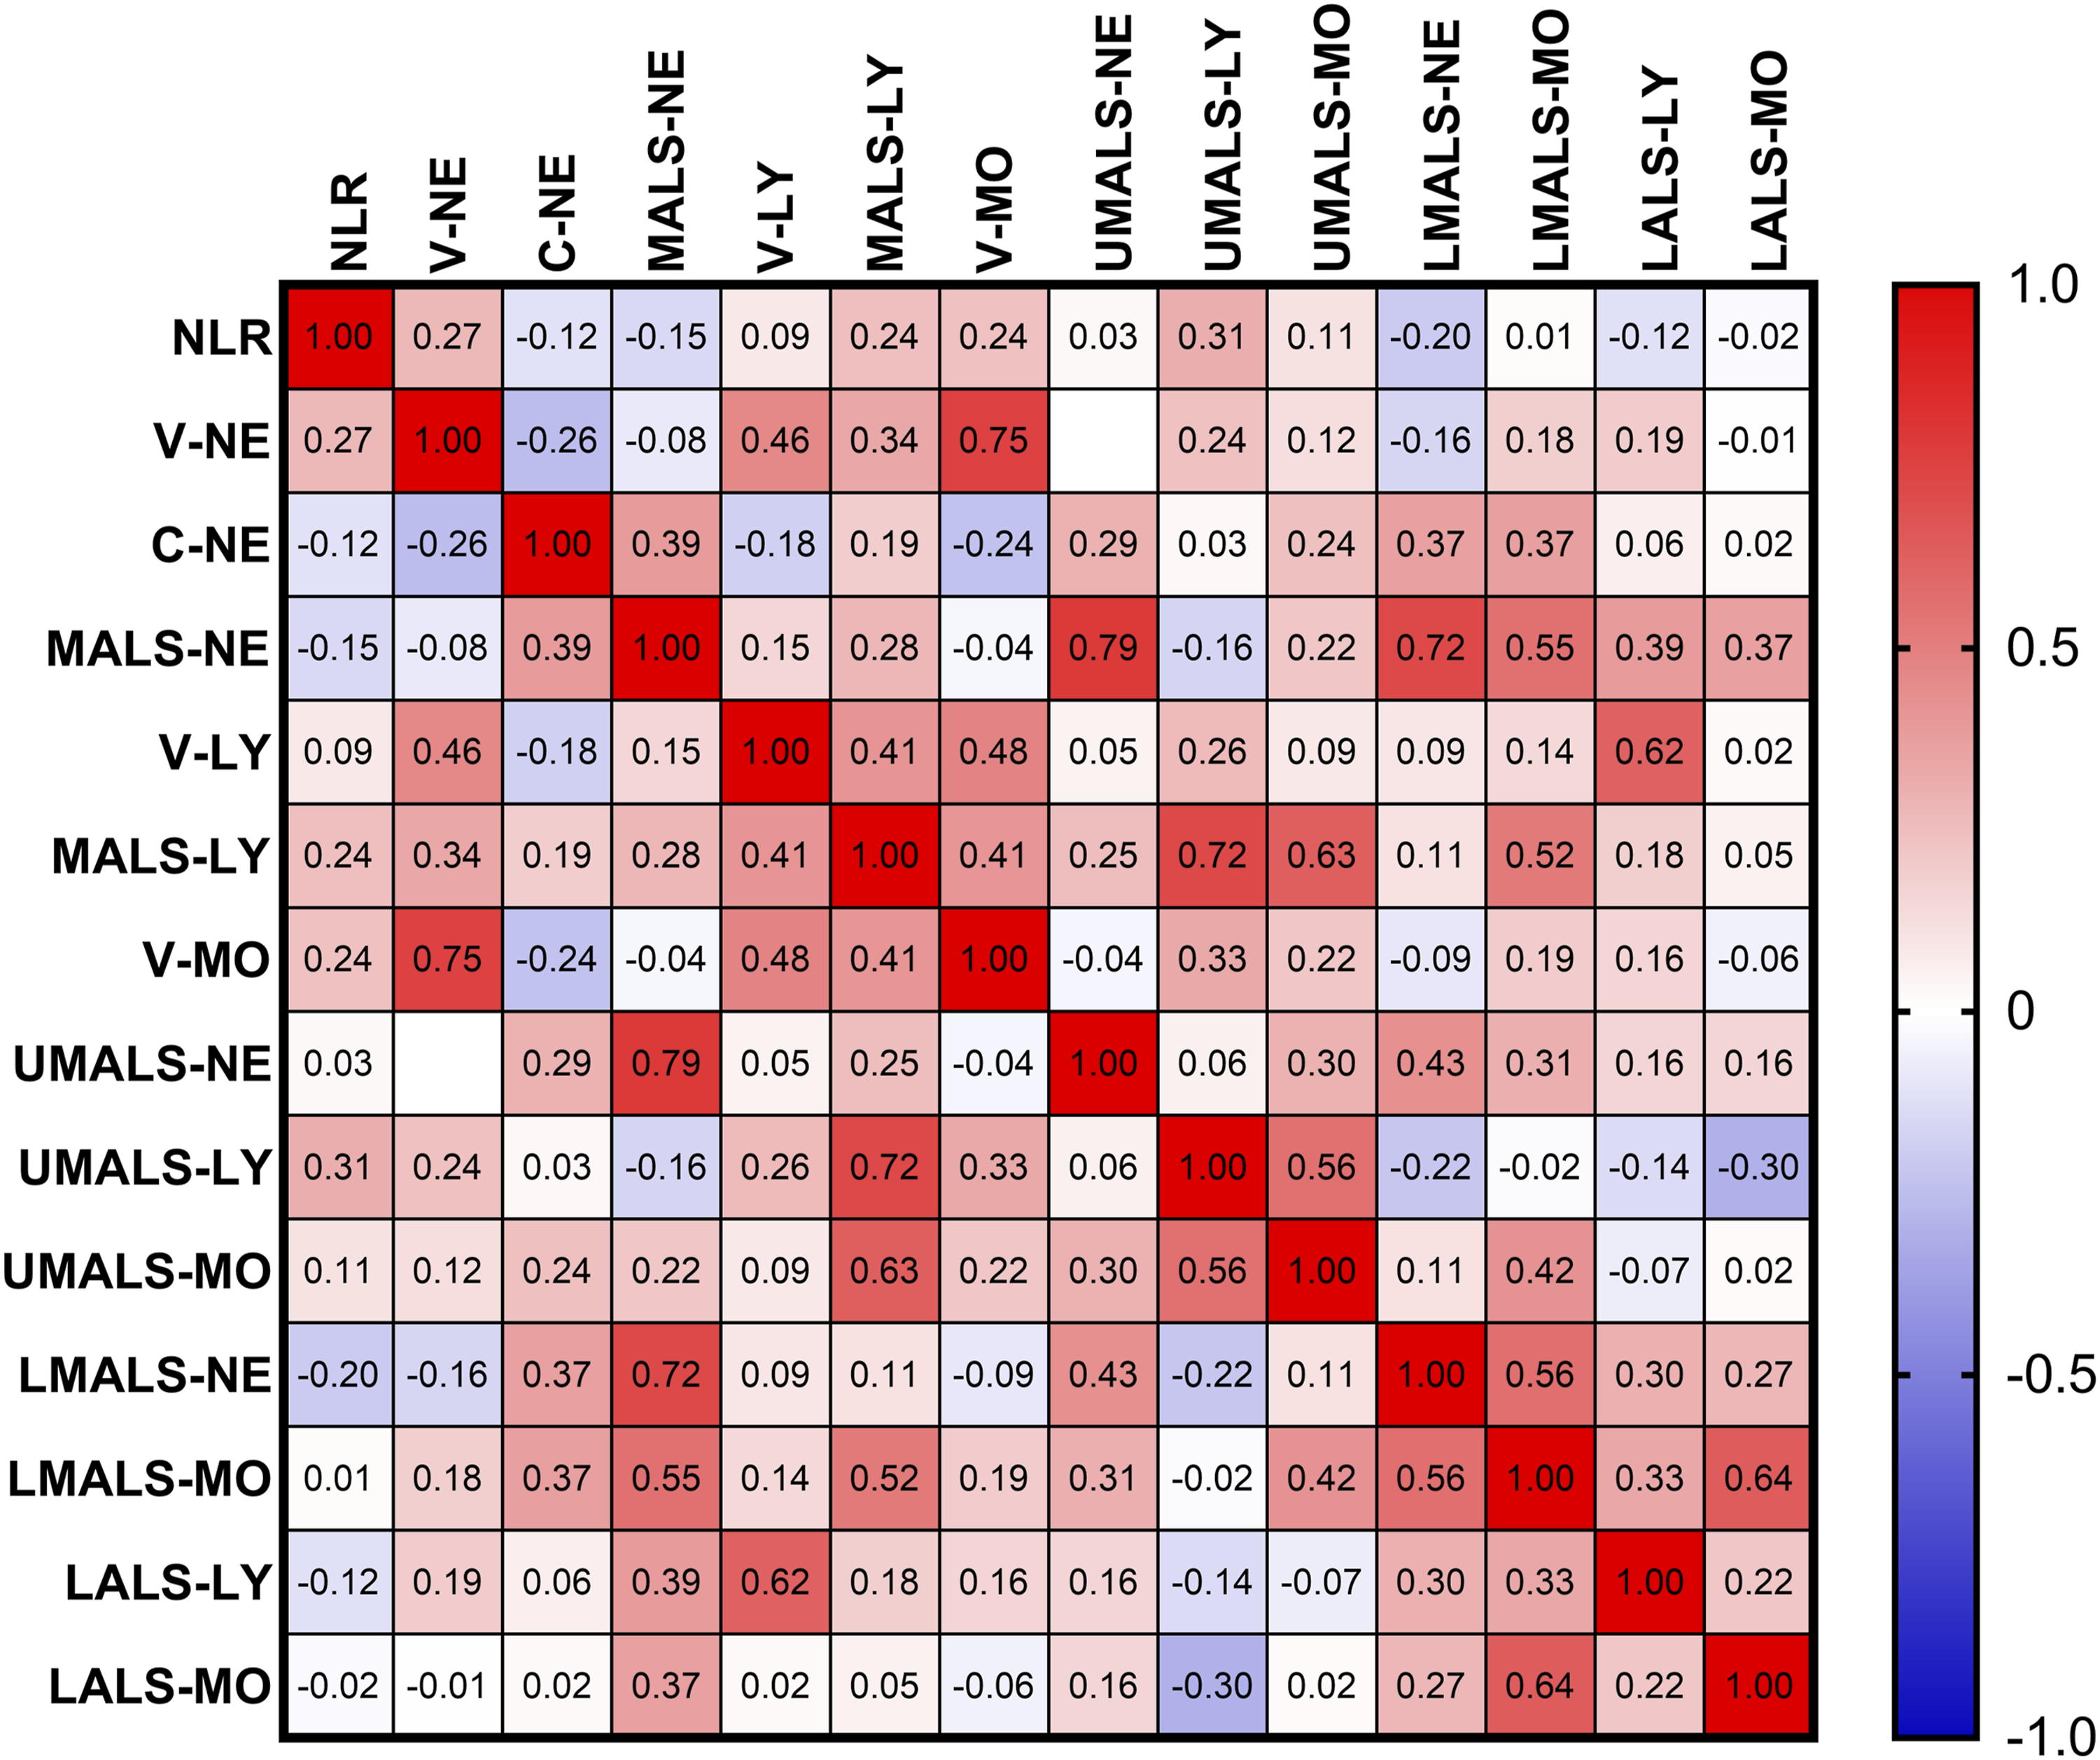
Heatmap of Pearson correlation coefficients between key differential VCS parameters and neutrophil-to-lymphocyte ratio (NLR) within the diabetic patient group (n = 295). Color intensity represents the strength and direction of correlation. Positive correlations are indicated in red and negative correlations in blue. Numerical correlation coefficients (r) and P values are reported in Table 4.
Positive correlations were observed between leukocyte volumes (MN-V-NE, MN-V-LY, MN-V-MO), lymphocyte light scatter parameters (MN-MALS-LY, MN-UMALS-LY), and NLR. Negative correlations were identified between MN-LMALS-NE, MN-LALS-LY, and NLR. These findings are consistent with the direction of group differences observed in the primary analysis and support the biological plausibility of VCS parameters as indicators of systemic inflammation in diabetes.
3.7. Sensitivity analysis
Sensitivity analysis after excluding 23 patients with documented infections.
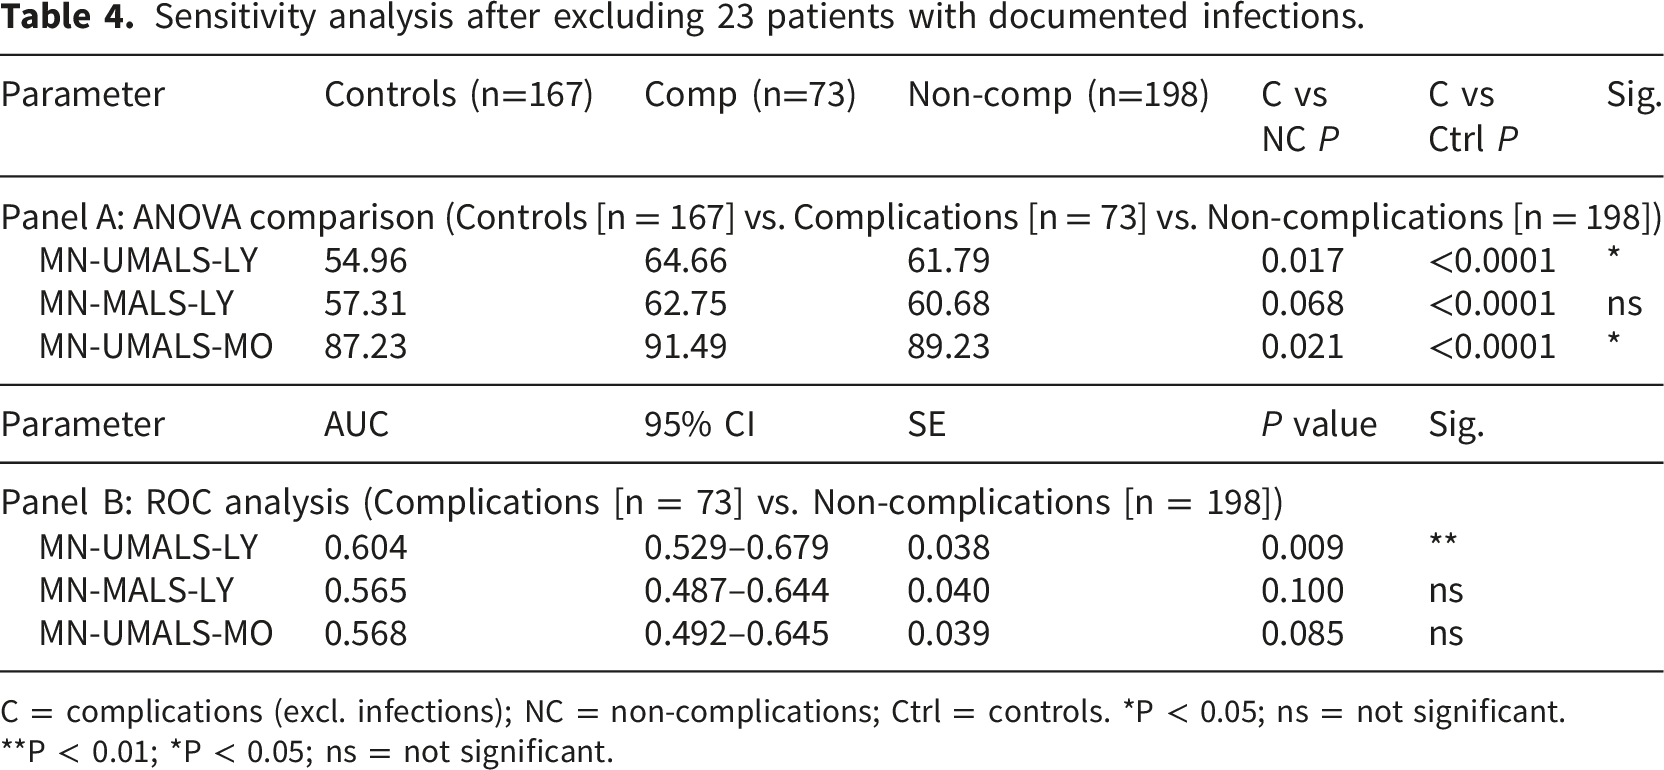
C = complications (excl. infections); NC = non-complications; Ctrl = controls. *P < 0.05; ns = not significant.
**P < 0.01; *P < 0.05; ns = not significant.
In the ANOVA comparison (Table 4, Panel A), MN-UMALS-LY in the sensitivity complications group (mean = 64.66) remained significantly higher than both the non-complications group (mean = 61.79, P = 0.017) and controls (mean = 54.96, P < 0.0001). MN-UMALS-MO also maintained significance between complications (91.49) and non-complications (89.23, P = 0.021) and controls (87.23, P < 0.0001). However, MN-MALS-LY in the sensitivity complications group (62.75) was no longer significantly different from the non-complications group (60.68, P = 0.068), although it remained significantly elevated compared with controls (57.31, P < 0.0001).
ROC analysis (Table 4, Panel B) further confirmed the robustness of MN-UMALS-LY: AUC = 0.604 (95% CI: 0.529–0.679, P = 0.009). In contrast, neither MN-MALS-LY (AUC = 0.565, P = 0.100) nor MN-UMALS-MO (AUC = 0.568, P = 0.085) reached statistical significance.
These results demonstrate that MN-UMALS-LY is the most robust VCS parameter, retaining significance across all analytical approaches even after removal of potentially infected patients. The loss of significance for MN-MALS-LY suggests that its discriminatory signal in the primary analysis may have been partly influenced by acute infection rather than chronic diabetic inflammation alone.
3.8. Multivariable logistic regression
Multivariable logistic regression for association between lymphocyte light scatter parameters and complication status (n = 295).
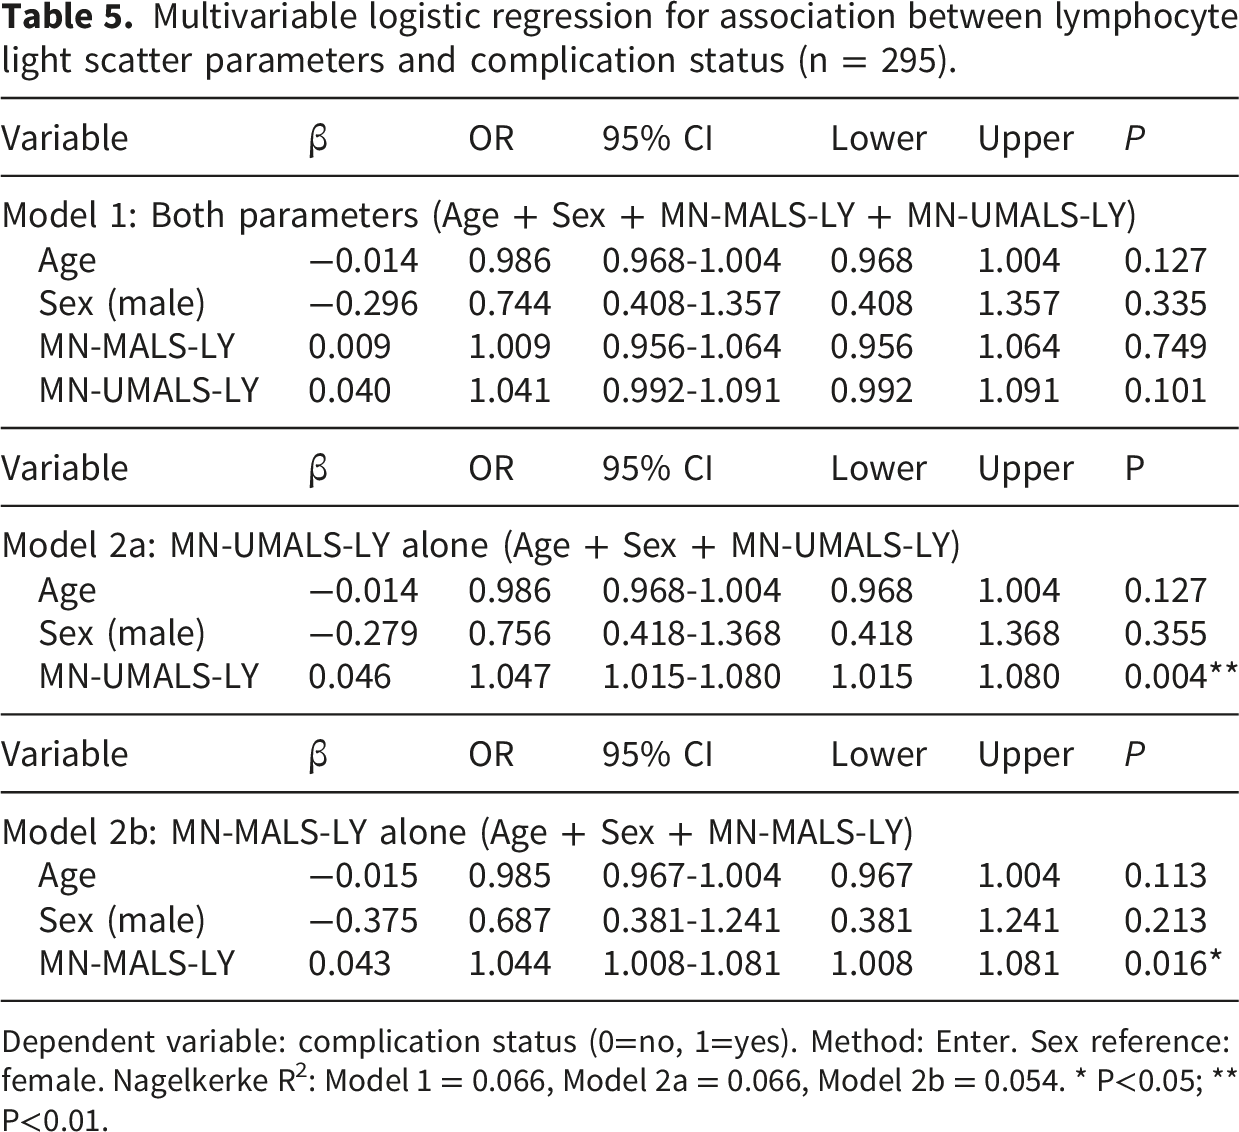
Dependent variable: complication status (0=no, 1=yes). Method: Enter. Sex reference: female. Nagelkerke R2: Model 1 = 0.066, Model 2a = 0.066, Model 2b = 0.054. * P<0.05; ** P<0.01.
In Model 1, which included both MN-MALS-LY and MN-UMALS-LY simultaneously, neither parameter reached statistical significance (MN-MALS-LY: OR = 1.009, 95% CI: 0.956–1.064, P = 0.749; MN-UMALS-LY: OR = 1.041, 95% CI: 0.992–1.091, P = 0.101). However, when entered separately into models adjusting for age and sex, both parameters demonstrated significant independent associations with complication status. In Model 2a, MN-UMALS-LY showed a significant association (OR = 1.047, 95% CI: 1.015–1.080, P = 0.004), indicating that each unit increase in MN-UMALS-LY was associated with a 4.7% increase in the odds of having complications. In Model 2b, MN-MALS-LY was also independently associated (OR = 1.044, 95% CI: 1.008–1.081, P = 0.016). Age and sex were not significantly associated with complication status in any of the three models.
The discrepancy between the combined and separate models is attributable to multicollinearity between MN-MALS-LY and MN-UMALS-LY. These two parameters measure lymphocyte light scatter at adjacent angles and are therefore highly correlated. When both are included simultaneously in the same model, they compete for overlapping explanatory variance, inflating standard errors and reducing individual significance. The separate models confirm that each parameter independently carries information about complication status beyond age and sex, with MN-UMALS-LY demonstrating the stronger association (P = 0.004 vs. 0.016), consistent with its higher AUC in ROC analysis and its robustness in the sensitivity analysis.
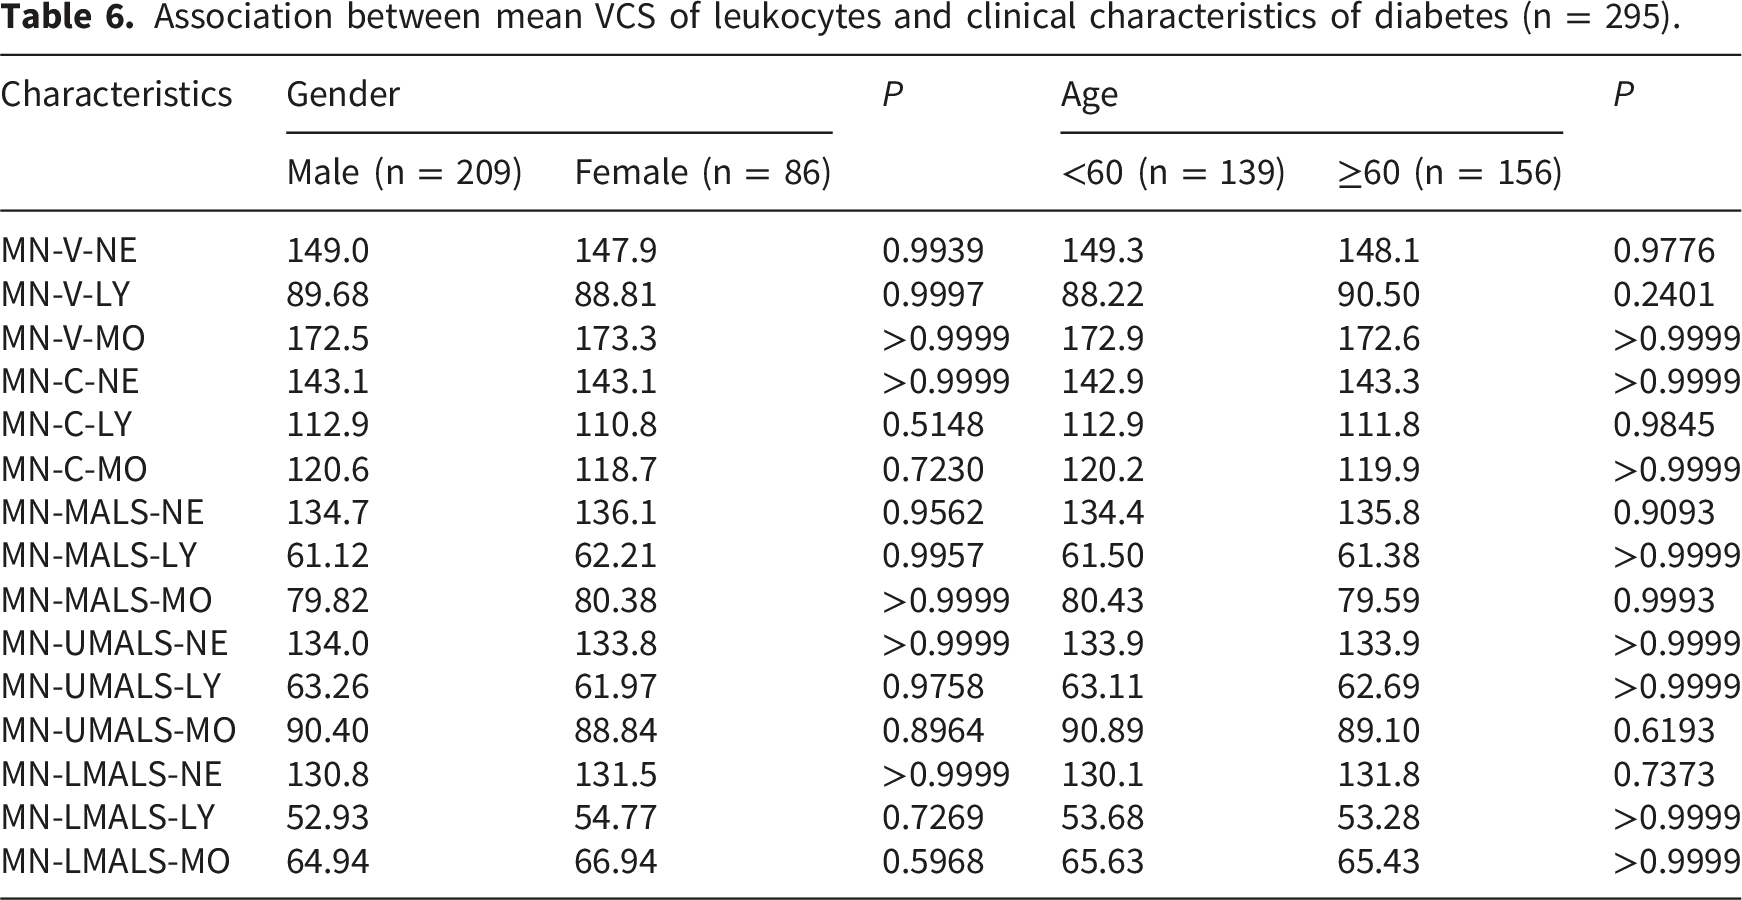
3.9. Subgroup analysis by age and sex
Association between mean VCS of leukocytes and clinical characteristics of diabetes (n = 295).
4. Discussion
In this retrospective cross-sectional study, we investigated the association between leukocyte VCS parameters and diabetes mellitus, with particular attention to whether these parameters differ between diabetic patients with and without complications. Our findings revealed that leukocyte VCS parameters were significantly altered in diabetic patients compared to healthy controls. Leukocyte volumes were uniformly increased across all three major subsets, and distinct patterns of light scatter changes were identified that differentiated patients with and without complications. To our knowledge, this is the first study to systematically evaluate VCS parameters in the context of diabetes mellitus and its inflammatory complications, extending the clinical applications of VCS technology beyond its established role in sepsis detection. The primary finding of this study was that lymphocyte light scatter parameters, specifically MN-UMALS-LY, showed a graded increase across disease severity: controls < diabetes without complications < diabetes with complications. This pattern suggests a dose-response relationship between inflammatory burden and lymphocyte internal structural changes. Light scatter at median and upper median angles reflects nuclear complexity, chromatin condensation, and intracellular granular content. 34 The elevated MN-UMALS-LY in the complications group may therefore reflect enhanced lymphocyte activation, chromatin remodeling, or increased intracellular organelle content driven by the intensified inflammatory milieu associated with diabetic complications. A secondary finding was that leukocyte volumes were uniformly increased in diabetes regardless of complication status, suggesting that volume changes represent a general feature of diabetic inflammation, while light scatter changes at upper median angles may be more specifically associated with complication severity. The sensitivity analysis provided critical insight into the specificity of these findings. After excluding 23 patients with documented infections, MN-UMALS-LY remained significantly elevated in the complications group (ANOVA P = 0.017) and retained discriminatory capacity in ROC analysis (AUC = 0.604, P = 0.009). In contrast, MN-MALS-LY lost significance after infection exclusion (ANOVA P = 0.068; ROC P = 0.100), suggesting that its signal in the primary analysis may have been partly driven by acute infection rather than chronic diabetic inflammation alone. This differential response strengthens the conclusion that MN-UMALS-LY is the most robust VCS parameter for reflecting chronic diabetic inflammation, and highlights the importance of accounting for concurrent infections when interpreting VCS data in diabetic populations.
ROC analysis demonstrated that MN-UMALS-LY achieved moderate discriminatory capacity for diabetes status (AUC = 0.770), which is comparable to previously reported AUC values for established inflammatory markers in diabetes, such as NLR (AUC approximately 0.70–0.79 across various populations)19,35 and total leukocyte count (AUC approximately 0.65–0.75).22,23 For complication discrimination, the AUC was more modest (0.615), indicating insufficient standalone diagnostic utility for individual patient classification. This is not unexpected given the multifactorial nature of diabetic complications and the heterogeneity of the complications group. Importantly, in this study we were unable to directly compare the discriminatory capacity of VCS parameters with NLR or CRP in the same cohort, as CRP data were not systematically available. Future studies should incorporate head-to-head comparisons with established inflammatory markers and assess whether combining VCS parameters with NLR or CRP through integrated models could improve diagnostic accuracy, using metrics such as net reclassification improvement (NRI) and integrated discrimination improvement (IDI).
Multivariable logistic regression confirmed that MN-UMALS-LY was independently associated with complication status after adjusting for age and sex (OR = 1.047, 95% CI: 1.015–1.080, P = 0.004), indicating that each unit increase in MN-UMALS-LY was associated with a 4.7% increase in the odds of having complications. Although this effect size is modest for individual patient classification, it is biologically meaningful and consistent with the gradual nature of chronic inflammatory changes. The multicollinearity between MN-MALS-LY and MN-UMALS-LY in the combined model further supports the interpretation that these two parameters capture overlapping but not identical aspects of lymphocyte intracellular remodeling, with MN-UMALS-LY carrying the stronger independent signal.
The generalized increase in leukocyte volume observed in diabetic patients is consistent with the known effects of inflammatory activation on cell morphology. Multiple studies have reported that elevated levels of inflammatory cytokines, including CRP, IL-6, and TNF-α, stimulate leukocytes into an activated state, leading to cytoskeletal reorganization, increased intracellular granules such as lysosomes and inflammasomes, and consequent cellular swelling.10–12,36 Hyperglycemia-induced oxidative stress plays a key mechanistic role in this process. Excessive production of reactive oxygen species (ROS) disrupts mitochondrial function and activates pro-inflammatory signaling pathways, particularly NF-κB, in monocytes and macrophages.37,38 ROS further upregulates the expression of adhesion molecules, including intercellular adhesion molecule-1 (ICAM-1) and vascular cell adhesion molecule-1 (VCAM-1), as well as chemokines such as monocyte chemoattractant protein-1 (MCP-1), thereby enhancing monocyte recruitment to the vascular endothelium and promoting transmigration into target tissues. 39 These inflammatory activation processes alter membrane fluidity, promote pseudopodia formation, and enhance adhesion and migration capabilities — all of which constitute morphological changes that may directly affect VCS-detected volume and light scatter parameters.
Advanced glycation end products (AGEs) represent another important mechanistic pathway linking hyperglycemia to the observed VCS parameter alterations. AGEs accumulate progressively in diabetes and interact with their receptor RAGE, which is expressed on inflammatory cells including monocytes, macrophages, and lymphocytes.40–42 The AGE-RAGE interaction activates intracellular signaling cascades, most notably NF-κB, which promotes further cytokine production, oxidative stress, and cellular morphological remodeling.43,44 This creates a positive feedback loop whereby AGE-driven inflammation leads to sustained leukocyte activation and progressive morphological changes, potentially explaining the graded pattern of VCS parameter changes observed from non-diabetic controls to diabetic patients without complications to those with complications. Mechanistically, the increased lymphocyte light scatter at upper median angles likely reflects increased intracellular complexity resulting from inflammatory activation. Activated lymphocytes undergo chromatin decondensation, mitochondrial biogenesis, and expansion of the endoplasmic reticulum,27,45 all of which increase the number of intracellular refractive interfaces and thus enhance light scatter at median angles. The simultaneous decrease in low-angle scatter (MN-LALS) in diabetic patients may reflect reduced surface membrane smoothness due to pseudopodia formation and increased membrane ruffling during leukocyte activation.24,34 This bidirectional pattern — increased scatter at median/upper angles coupled with decreased scatter at lower angles — is consistent with the known optical physics of VCS detection, where median-angle scatter is sensitive to internal granularity while low-angle scatter predominantly reflects cell surface characteristics.
The finding that neutrophil conductivity (MN-C-NE) was marginally lower in the diabetes group compared to controls warrants cautious interpretation. Conductivity primarily reflects cytoplasmic composition, including lipid content, and cell membrane permeability. The small effect size of this difference (143.1 ± 6.678 vs. 144.7 ± 6.897), combined with the multiple comparisons performed across numerous VCS parameters and three leukocyte subsets, suggests that this finding may not represent a clinically meaningful alteration and could be a chance finding. Future studies with larger sample sizes and formal correction for multiple testing across all parameters would be needed to determine whether neutrophil conductivity changes are reproducibly associated with diabetes.
Our study builds upon the existing VCS literature, which has predominantly focused on sepsis and acute bacterial infections, where neutrophil mean volume has achieved AUC values of 0.85–0.9228,31,46 and has been shown comparable to procalcitonin and interleukin-6 in predicting sepsis in cirrhosis. 45 The AUC values observed in our study for diabetes discrimination (0.770) are lower than those reported for sepsis, which is expected given that sepsis produces an acute, robust inflammatory response, whereas diabetes-associated inflammation is chronic and low-grade. Nevertheless, the consistency of findings across multiple analytical approaches (ANOVA, ROC, logistic regression, and sensitivity analysis) supports the biological plausibility of VCS parameters as indicators of chronic inflammation.
4.1. Limitations
This study has several limitations. First, the retrospective cross-sectional design precludes causal inference. Second, single-center design and analyzer-specific results limit generalizability. Third, BMI, disease duration, HbA1c, CRP, and medication data were unavailable, precluding comprehensive multivariable adjustment. Fourth, the AUC values for complication discrimination were modest, confirming limited standalone diagnostic utility. Fifth, the complications group was heterogeneous; although sensitivity analysis was informative, individual subgroups were too small for separate analysis. Sixth, diabetes type was not definitive for all patients. Seventh, incremental value beyond NLR or CRP was not assessed. Eighth, pre-analytical variables were not fully standardized. Ninth, longitudinal data were lacking. Tenth, formal correction for multiple comparisons across all parameters was not applied.
5. Conclusion
Leukocyte VCS parameters, particularly MN-UMALS-LY, were significantly altered in diabetic patients and independently associated with complication status after adjusting for age and sex. MN-UMALS-LY demonstrated moderate discriminatory capacity for diabetes (AUC = 0.770) but limited standalone capacity for complications (AUC = 0.615). Sensitivity analysis excluding patients with documented infections confirmed the robustness of MN-UMALS-LY as a marker of chronic diabetic inflammation. These findings are exploratory; prospective, multicenter validation with comprehensive clinical data is essential before clinical implementation.
Footnotes
Acknowledgements
We extend our gratitude to Dr. Zheng Yang from The First Affiliated Hospital of Guangxi Medical University for his insightful suggestions on the experimental design. We acknowledge the assistance provided by GraphPad Prism 9 (GraphPad Software, USA) in figure generation. We also thank the Department of Clinical Laboratory at The First Affiliated Hospital of Guangxi Medical University for their assistance in data collection. Furthermore, we appreciate the technical support provided by the Hunan Pinxin Bone Marrow/Blood Cell Morphology AI Scanning Analysis System CR-GS series. AI-assisted language editing was performed using ChatGPT (OpenAI, San Francisco, CA, USA) to improve the clarity and readability of the manuscript. The authors take full responsibility for the accuracy and integrity of all scientific content.
Ethical considerations
This study was approved by the Ethics Review Board of the First Affiliated Hospital of Guangxi Medical University (Approval No.: 2025-E0855; Date of Approval: October 20, 2025). Given the retrospective nature of the study, the requirement for informed consent was waived.
Author contributions
Funding
The authors disclosed receipt of the following financial support for the research, authorship, and/or publication of this article: This work was supported by the National Natural Science Foundation of China (Grant No. 82360538), the Natural Science Foundation of Guangxi Zhuang Autonomous Region (Grant No. 2023JJA141022), the Basic Ability Enhancement Project for Young and Middle-aged Teachers in Guangxi (Grant No. 2021KY1375), and First-class discipline innovation-driven talent program of Guangxi Medical University (2025).
Declaration of conflicting interests
The authors declared no potential conflicts of interest with respect to the research, authorship, and/or publication of this article.
Data Availability Statement
The datasets generated and analyzed during the current study are not publicly available due to ethical restrictions and patient confidentiality agreements. However, aggregated data and statistical results supporting the findings are included in this published article and its supplementary materials. Requests for access to de-identified raw data may be directed to the corresponding author, subject to institutional review board approval and compliance with local data protection regulations.