
Abstract
Objective
This study aimed to identify immune-related hub genes shared between acute myocardial infarction (AMI) and metabolic syndrome (MetS), and to construct and validate a blood-based gene diagnostic signature for AMI, with the hypothesis that this signature may be informative for AMI risk assessment in MetS patients.
Methods
Two AMI datasets (GSE66360, GSE61145) and one MetS dataset (GSE98895) were obtained from the Gene Expression Omnibus (GEO) database. Based on the GSE66360 dataset, 285 AMI-related common genes were identified as the intersection between 1409 differentially expressed genes (DEGs) and 304 module genes, identified via Limma and weighted gene co-expression network analysis (WGCNA), respectively. Subsequently, the intersection of these 285 AMI-related common genes and 1446 MetS-related DEGs yielded 40 genes that were primarily associated with immunoregulation, as revealed by functional enrichment analysis. After constructing a protein-protein interaction (PPI) network, 30 node genes were selected and ranked according to node degree. Six candidate hub genes (THBD, MMP9, IRAK3, CXCL16, NLRP3, and JDP2) identified via machine learning were used to establish a diagnostic model and evaluate its diagnostic value.
Results
We revealed that the six candidate genes demonstrated strong diagnostic value for AMI (AUC ranging from 0.86 to 0.94, with 95% confidence intervals [CIs]). Moreover, a diagnostic nomogram constructed from these genes allows for visual quantification of AMI probability. Immune cell infiltration analysis revealed dysregulation across multiple immune cell subsets in AMI. These six immune-based hub genes have been identified as potential diagnostic biomarkers for AMI, with hypothesized relevance in MetS patients.
Conclusions
These findings provide a hypothesis-generating resource for understanding inflammatory links between MetS and AMI, though clinical utility for risk stratification in MetS patients requires further prospective validation.
Keywords
Introduction
Acute myocardial infarction (AMI) remains the leading cause of mortality among cardiovascular diseases, with an estimated 8 million deaths annually. 1 Multiple factors contribute to AMI risk, including genetic variations, psychosocial factors, and metabolic disorders (e.g., diabetes, hypertension, hyperlipidemia). 2 Metabolic syndrome (MetS)—a cluster of metabolic abnormalities linked to vascular endothelial injury 3 —markedly elevates the incidence of adverse coronary events and recurrent myocardial infarction. 4 For this reason, AMI is recognized as the most severe cardiovascular complication of MetS, highlighting the importance of exploring potential biomarkers that may inform AMI risk assessment in patients with MetS. 5
Accumulating evidence highlights overlapping pathological mechanisms between MetS and AMI. Immune cell dysregulation and pro-inflammatory cytokine overactivation not only contribute to MetS pathogenesis 6 but also drive atherosclerotic plaque instability and excessive immune cell infiltration in coronary arteries—key triggers of AMI onset and ischemia-reperfusion injury exacerbation. 7 Despite this, current strategies for assessing AMI risk in MetS patients primarily rely on traditional clinical indicators (e.g., blood lipid levels, blood pressure), which lack sufficient specificity for this high-risk population. Over-reliance on these post-hoc risk indicators further limits timely risk stratification for MetS patients, especially those with type 2 MI (triggered by oxygen supply-demand mismatch without plaque rupture). 8 Meanwhile, standard diagnostic tools (e.g., cardiac troponin [cTn], electrocardiography [ECG]) only detect myocardial injury after AMI onset and do not predict risk prior to event occurrence.9,10 Thus, identifying highly sensitive and specific predictive biomarkers has become urgent to enable early assessment of AMI risk in MetS patients—a gap that genome sequencing and bioinformatics tools are well-positioned to address. 11
This study leveraged bioinformatics to identify immune-related hub genes shared between AMI and MetS, and to construct a diagnostic signature for AMI. First, we retrieved two AMI datasets (GSE66360, GSE61145) and one MetS dataset (GSE98895) from the Gene Expression Omnibus (GEO) database. Using the GSE66360 dataset, we identified differentially expressed genes (DEGs) via Limma and key AMI-related module genes through weighted gene co-expression network analysis (WGCNA), then intersected these sets to obtain AMI-associated core genes. Second, we performed functional enrichment analysis, protein-protein interaction (PPI) network analysis, and immune cell infiltration analysis to characterize the immune-related functions of genes commonly associated with both AMI and MetS. Third, we applied least absolute shrinkage and selection operator (LASSO) and random forest (RF) algorithms to screen candidate diagnostic genes, and evaluated their diagnostic performance via receiver operating characteristic curve analysis (AUC). Finally, we performed multivariable logistic regression analysis and constructed a nomogram-based diagnostic model using these candidate genes. By validating the model’s efficacy using the independent GSE61145 dataset, we established an immune-based diagnostic tool that may inform future AMI risk stratification in MetS patients, pending prospective validation.
Materials and methods
Datasets acquisition
In this study, normalized expression spectrum datasets were collected from the Gene Expression Omnibus database. All expression data were publicly available normalized datasets downloaded from GEO. Within-dataset batch effects were corrected using the “ComBat” algorithm, which is implemented in the “sva” R package. Cross-platform differences (GPL570, GPL6947, GPL6106) were not directly merged or batch-corrected; instead, GSE66360 was used as the training set, and GSE61145 as an independent validation set, with normalization preserved as provided by GEO (primarily log2-transformed and quantile-normalized). Probe-to-gene mapping was performed according to each platform’s annotation file, with one representative probe per gene selected by maximum mean expression. GSE66360, which included mRNA expression data annotated by GPL570, comprised 49 AMI samples and 50 healthy cohorts. GSE98895, processed on platform GPL6947, included 20 MetS samples and 20 healthy samples. Additionally, GSE61145, used as a validation cohort, was sequenced on GPL6106 and included 26 AMI samples and 17 healthy samples (samples from 14 recovered AMI patients were excluded). All samples were collected from human peripheral blood. Limited clinical metadata (age, sex, comorbidities, ethnicity, medication) were available in the GEO datasets, and thus adjustment for these covariates was not possible. The study flowchart is depicted in Figure 1. The study flowchart.
Differential expression analysis
The R package “Limma” was utilized to perform differential expression analysis in R software. 12 The threshold for identifying DEGs was set as adjusted p-value < 0.05 (using the Benjamini-Hochberg method to control false discovery rate, FDR) and |log2FC| > 0.585; this corresponds to a 1.5-fold change in gene expression, a commonly adopted moderate effect size cutoff in transcriptomics. Differential expression was performed using a simple two-group contrast (AMI vs control, MetS vs control) because clinical covariates were not available. Multiple probes were collapsed to one gene per symbol using the probe with the maximum mean expression. Volcano plots and heatmaps of DEGs were generated using the “ggplot2” and “Heatmap” packages, respectively.
Weighted gene co-expression network analysis
To investigate correlations among genes, a gene co-expression network was established using the R package “WGCNA”. Based on the GSE66360 dataset (the training set), a total of 2818 genes were initially included. Then, 1409 genes (exactly 50%) with the lowest median absolute deviation (MAD) were excluded, leaving 1409 genes for subsequent analysis. Outlier genes and samples were removed using the “goodSamplesGenes” function, and then a scale-free network was constructed through the following three steps. First, the average linkage approach was applied, and Pearson correlation coefficients were calculated for all gene pairs. Then, we determined the optimal soft-threshold parameter (β = 22), chosen based on the criterion that the scale-free fit index R2 ≈ 0.8, to accentuate strong gene correlations and penalize weak correlations. Subsequently, a weighted adjacency matrix was created. Second, a signed topological overlap matrix (TOM) was constructed from the adjacency matrix because signed TOM was selected to preserve the directionality of gene co-expression correlations (positive vs. negative) and reduce the impact of spurious correlations. The proportion of genes in the network and the corresponding dissimilarity (1-TOM) were then determined. Finally, we employed average linkage hierarchical clustering, using a minimum group size of 30 genes, to cluster genes with similar expression characteristics into modules represented in the dendrogram. We estimated the differences between module eigengenes, set a cut height of 0.25 (corresponding to a correlation coefficient of 0.75) for the module dendrogram, and combined certain modules for further examination. The key module related to AMI was defined as having the highest absolute value of the correlation coefficient with AMI.
Functional enrichment analysis
Gene Ontology (GO) and Kyoto Encyclopedia of Genes and Genomes (KEGG) analyses were conducted using annotation information provided by the “org.Hs.eg.db” and “clusterProfiler” packages, respectively. In the KEGG REST API, we obtained the most recent gene annotations for KEGG pathways. Dditionally, the R packages “GOplot” and “enrichplot” were used to visualize the final outcomes of GO and KEGG analyses. We performed functional enrichment analysis on AMI-related DEGs and on the intersection of DEGs for AMI and MetS.
Protein-protein interaction network
Interactions among protein-coding genes were explored using the STRING database with a confidence score ≥ 0.7 to retain high-confidence interactions. Then, the Cytoscape application was used to visualize the PPI network. Key interacting genes in the PPI network were identified by the molecular complex detection (MCODE) plug-in in Cytoscape, using parameters degree cutoff = 2, max depth = 100, and k-score= 2. The intersection of genes related to AMI and MetS was used to establish the PPI network and to screen for node genes. Node genes were ranked by degree centrality because it is the most straightforward and widely used measure to identify core genes in a PPI network.
Machine learning
To construct a more accurate diagnostic signature, we applied two algorithms to select significant candidate genes for AMI diagnosis. LASSO regression was performed using “glmnet” in R; 10-fold cross-validation was used to select the optimal λ value corresponding to the minimum partial likelihood deviance. Random Forest (RF) analysis, as an ensemble learning method based on decision trees, was used to identify candidate genes and was completed using “randomForest” R package with 500 trees and default mtry parameters, with variable importance calculated by mean decrease accuracy. LASSO and RF have the capacity to handle both regression and classification issues. Both algorithms were applied only in the GSE66360 training set. The candidate hub genes were derived from the intersection of LASSO and RF.
Receiver operating characteristic curve
To estimate the diagnostic capacity of the candidate hub genes, ROC curves were plotted to evaluate the specificity and sensitivity of each candidate hub gene and the nomogram. The area under the ROC curve (AUC) was evaluated, with 95% CIs reported, and AUC > 0.75 was determined to be the optimal diagnostic value. Furthermore, the diagnostic value was verified by ROC analysis using the independent AMI dataset (GSE61145), which was used to evaluate both single-gene AUCs and the combined diagnostic signature. The “pROC” R package was used to perform the ROC analysis. We acknowledge that the lack of internal cross-validation or bootstrapping may lead to optimistic performance estimates.
Multivariable logistic regression and nomogram construction
Based on the six candidate genes, a multivariable Logistic regression model was constructed to predict the presence of AMI (dependent variable: AMI status, 1 = AMI, 0 = healthy control). All six hub genes were included simultaneously to account for potential inter-gene confounding. The regression coefficients (β) with 95% confidence intervals (CIs) and two-sided p-values were estimated to quantify the association between each gene and AMI status. Based on the regression coefficients from the multivariable Logistic model, a nomogram was developed using the “rms” package in R software (Version 4.2.1). The nomogram mapped each gene’s expression level to a point score on a linear scale.
Immune cell infiltration analysis
Based on the linear support vector regression principle, the CIBERSORT algorithm was applied to examine proportions of various immune cells in AMI and healthy controls. The “cibersort” R package was used to run CIBERSORT with the following parameters: the LM22 signature matrix was selected as the reference; the number of permutations was set to 1000; and default normalization settings were applied. Results with p<0.05 were used for further analysis. We calculated 22 immune cell subtypes in AMI patients and visualized the different proportions of each immune cell via histogram. The results of CIBERSORT analysis were visualized in a heat map correlation matrix plot implemented utilizing the “corrplot” package.
Statistical analysis
Most data analysis was performed using R software (v4.2.1). Unpaired Student’s t-test and Wilcoxon tests were used to assess statistical significance between two groups for normally distributed and non-normally distributed variables, respectively. Correlations between different genes were measured using Pearson correlation coefficients.
Results
Identification of DEGs between AMI and control samples
A total of 1,409 genes were identified from the differential expression analysis between AMI samples and control samples, of which 723 were up-regulated and 686 were down-regulated. Figure 2(a) and (b) showed the volcano plot and heat map of the top 50 AMI DEGs. Identification of differentially expressed genes and key module genes in AMI. (a) The volcano shows total DEGs, of which the red triangles indicate significantly up-regulated genes and the green triangles indicate significantly down-regulated genes. (b) The heatmap depicts the top 50 DEGs screened out from AMI dataset. The red and blue represent up-regulated and down-regulated, respectively. (c and d) The corresponding scale-free topological model and mean connectivity values at different soft threshold powers. Here we selected β=22 as the soft threshold. (e) Cluster dendrogram of gene co-expression modules. (f) Eigengene adjacency heatmap between modules. (g) Correlations between different modules and AMI. Correlation coefficient and P value are shown at top and bottom, respectively. The red module is significantly associated with AMI. (h) Scatterplot of module membership vs. gene significance in the red module.
WGCNA analysis and key module gene identification
The module most correlated with AMI was identified using WGCNA analysis. Based on a scale-free topology fit index (R2=0.8) and to achieve relatively good average connectivity, the network was constructed using a soft-threshold power of 22 (Figure 2(c) and (d)). The cluster dendrogram of the gene co-expression modules is shown in Figure 2(e). Figure 2(f) displays the eigengene adjacency among the six modules, with a minimum module size of ≥30. The results, as shown in Figure 2(g), indicated the red module has the greatest association with AMI (correlation coefficient=0.62, P=7.3*10-12). Then, the relationship between gene significance and module membership was calculated in the red module. As shown in Figure 2(h), we observed a significant positive association between them (r=0.52, P=2.4*10-22). Therefore, the red module, which includes 304 genes, is most significantly correlated with AMI.
Functional enrichment analysis of AMI
We identified 285 common genes (shown in Figure 3(a)) by overlapping the 1409 DEGs and 304 red module genes, and then performed a functional enrichment analysis. The KEGG analysis results indicated that the 285 common genes were primarily enriched in the “NF-Kappa B (NF-κB) signaling pathway”, the “TNF signaling pathway”, and the “Cytokine-cytokine receptor interaction”. According to GO analysis, the common genes were mainly enriched in “vesicle” (cellular component, CC), “immune system process” (biological process, BP), and “signaling receptor binding” (molecular function, MF). The top 10 enriched terms for GO and KEGG are displayed in Figure 3(b)–(e). According to GO and KEGG analyses, the 285 AMI-related common genes were mainly associated with immune function and inflammatory response. Function enrichment analysis of intersection genes in AMI. (a-b) Venn diagram and KEGG analysis of 285 genes identified from the intersection of DEGs and the red module. (c–e) GO analysis of the 285 genes, including BP, CC and MF.
Enrichment analysis of AMI with MetS and node gene identification
In the MetS datasets, 1,446 DEGs were identified in total, with 654 up-regulated and 792 down-regulated (Figure 4(a)). Figure 2(b) showed the heat map of the top 50 MetS-associated DEGs. We collected 40 genes from the intersection of 1446 MetS-associated DEGs and 285 common AMI genes to investigate the potential link between MetS-associated DEGs and AMI pathogenesis (Figure 5(a)). KEGG analysis revealed that the 40 genes are involved in 114 pathways, primarily including “NF-κB signaling pathway” and “Rheumatoid arthritis” (Figure 5(d)). According to GO analysis, the 40 genes were mainly enriched in “leukocyte activation”, “immune response”, and “immune system process”, which were strongly associated with immunity (Figure 5(e)). Then, a PPI network was constructed to identify key node genes for subsequent machine learning analysis. As shown in Figure 5(b) and (c), 30 of the 40 genes interacted with each other and were ranked according to their number of interactions (degree). Differential analysis between MetS and control samples. (a) The red and green triangles indicate DEGs with up-regulated and down-regulated, respectively. (b) Heatmap of expression levels of DEGs in MetS. GO and KEGG analysis and PPI network analysis. (a) The 40 common genes are screened out from intersection genes in AMI and MetS. (b) The 30 genes interacted with each other were identified through PPI network. (c) The 30 hub genes that are key nodes in the protein-protein interaction network, which play critical roles in the shared pathophysiology of AMI and MetS. (d) The column depicts the number of nodes about the 30 genes. (e-f) KEGG and GO analysis of the 40 common genes.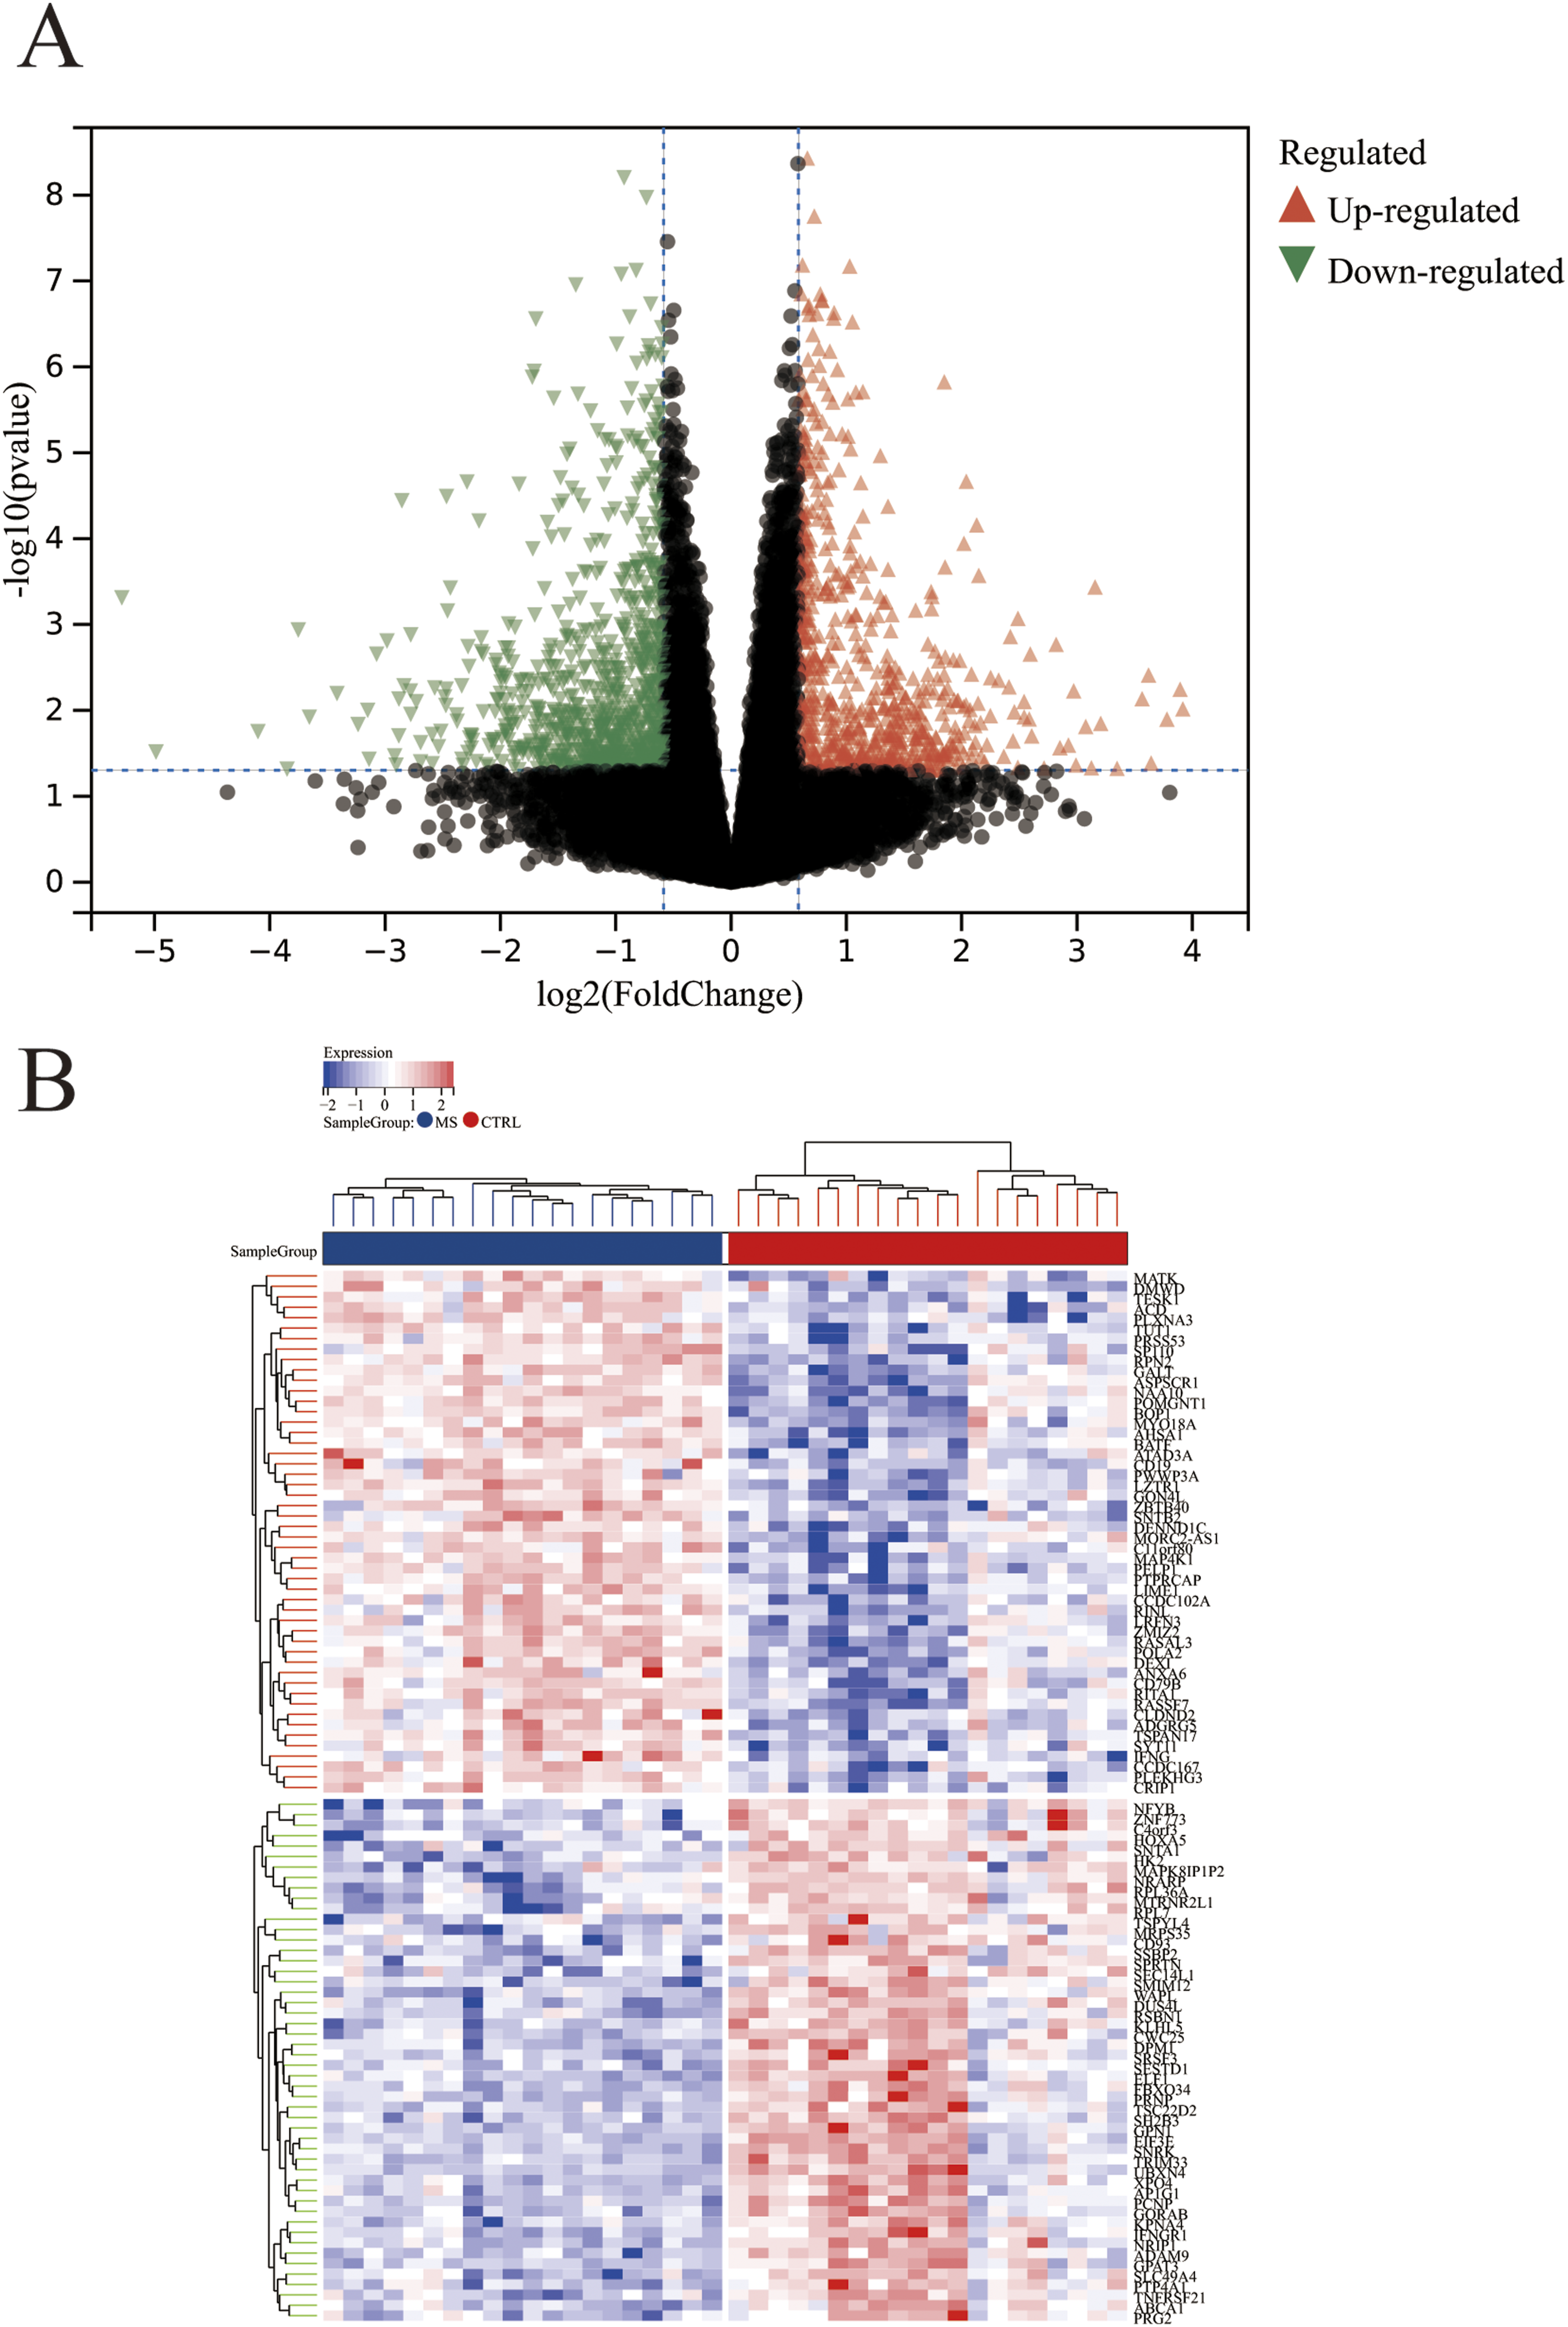

Identification of hub genes
Candidate hub genes were identified using the LASSO and RF algorithms for diagnostic model creation and diagnostic value assessment. Seven potential candidate biomarkers (MMP9, JUN, NLRP3, THBD, IRAK3, CXCL16, JDP2) were identified via the LASSO algorithm (Figure 6(a) and (b)). The RF algorithm was employed to estimate the importance of each gene and identified the eight most important genes (MMP9, NLRP3, CXCL16, THBD, IRAK3, MAFB, SLC11A1, JDP2), as shown in Figure 6(c). Figure 6(d) showed the intersecting genes of the candidate genes from the LASSO algorithm and the most important genes identified by the RF algorithm. The six hub genes (MMP9, NLRP3, THBD, IRAK3, CXCL16, JDP2) were selected for subsequent validation. Identification of candidate diagnostic hub genes for AMI with MetS via machine learning. (a and b) The Lasso analysis screens out the most 7 genes appropriate for AMI with MetS diagnosis. (c) The 8 candidate hub genes are identified depending on the significance score via the RF algorithm. (d) Venn diagram indicates that the 6 hub genes are identified from the intersection genes of LASSO and RF algorithms.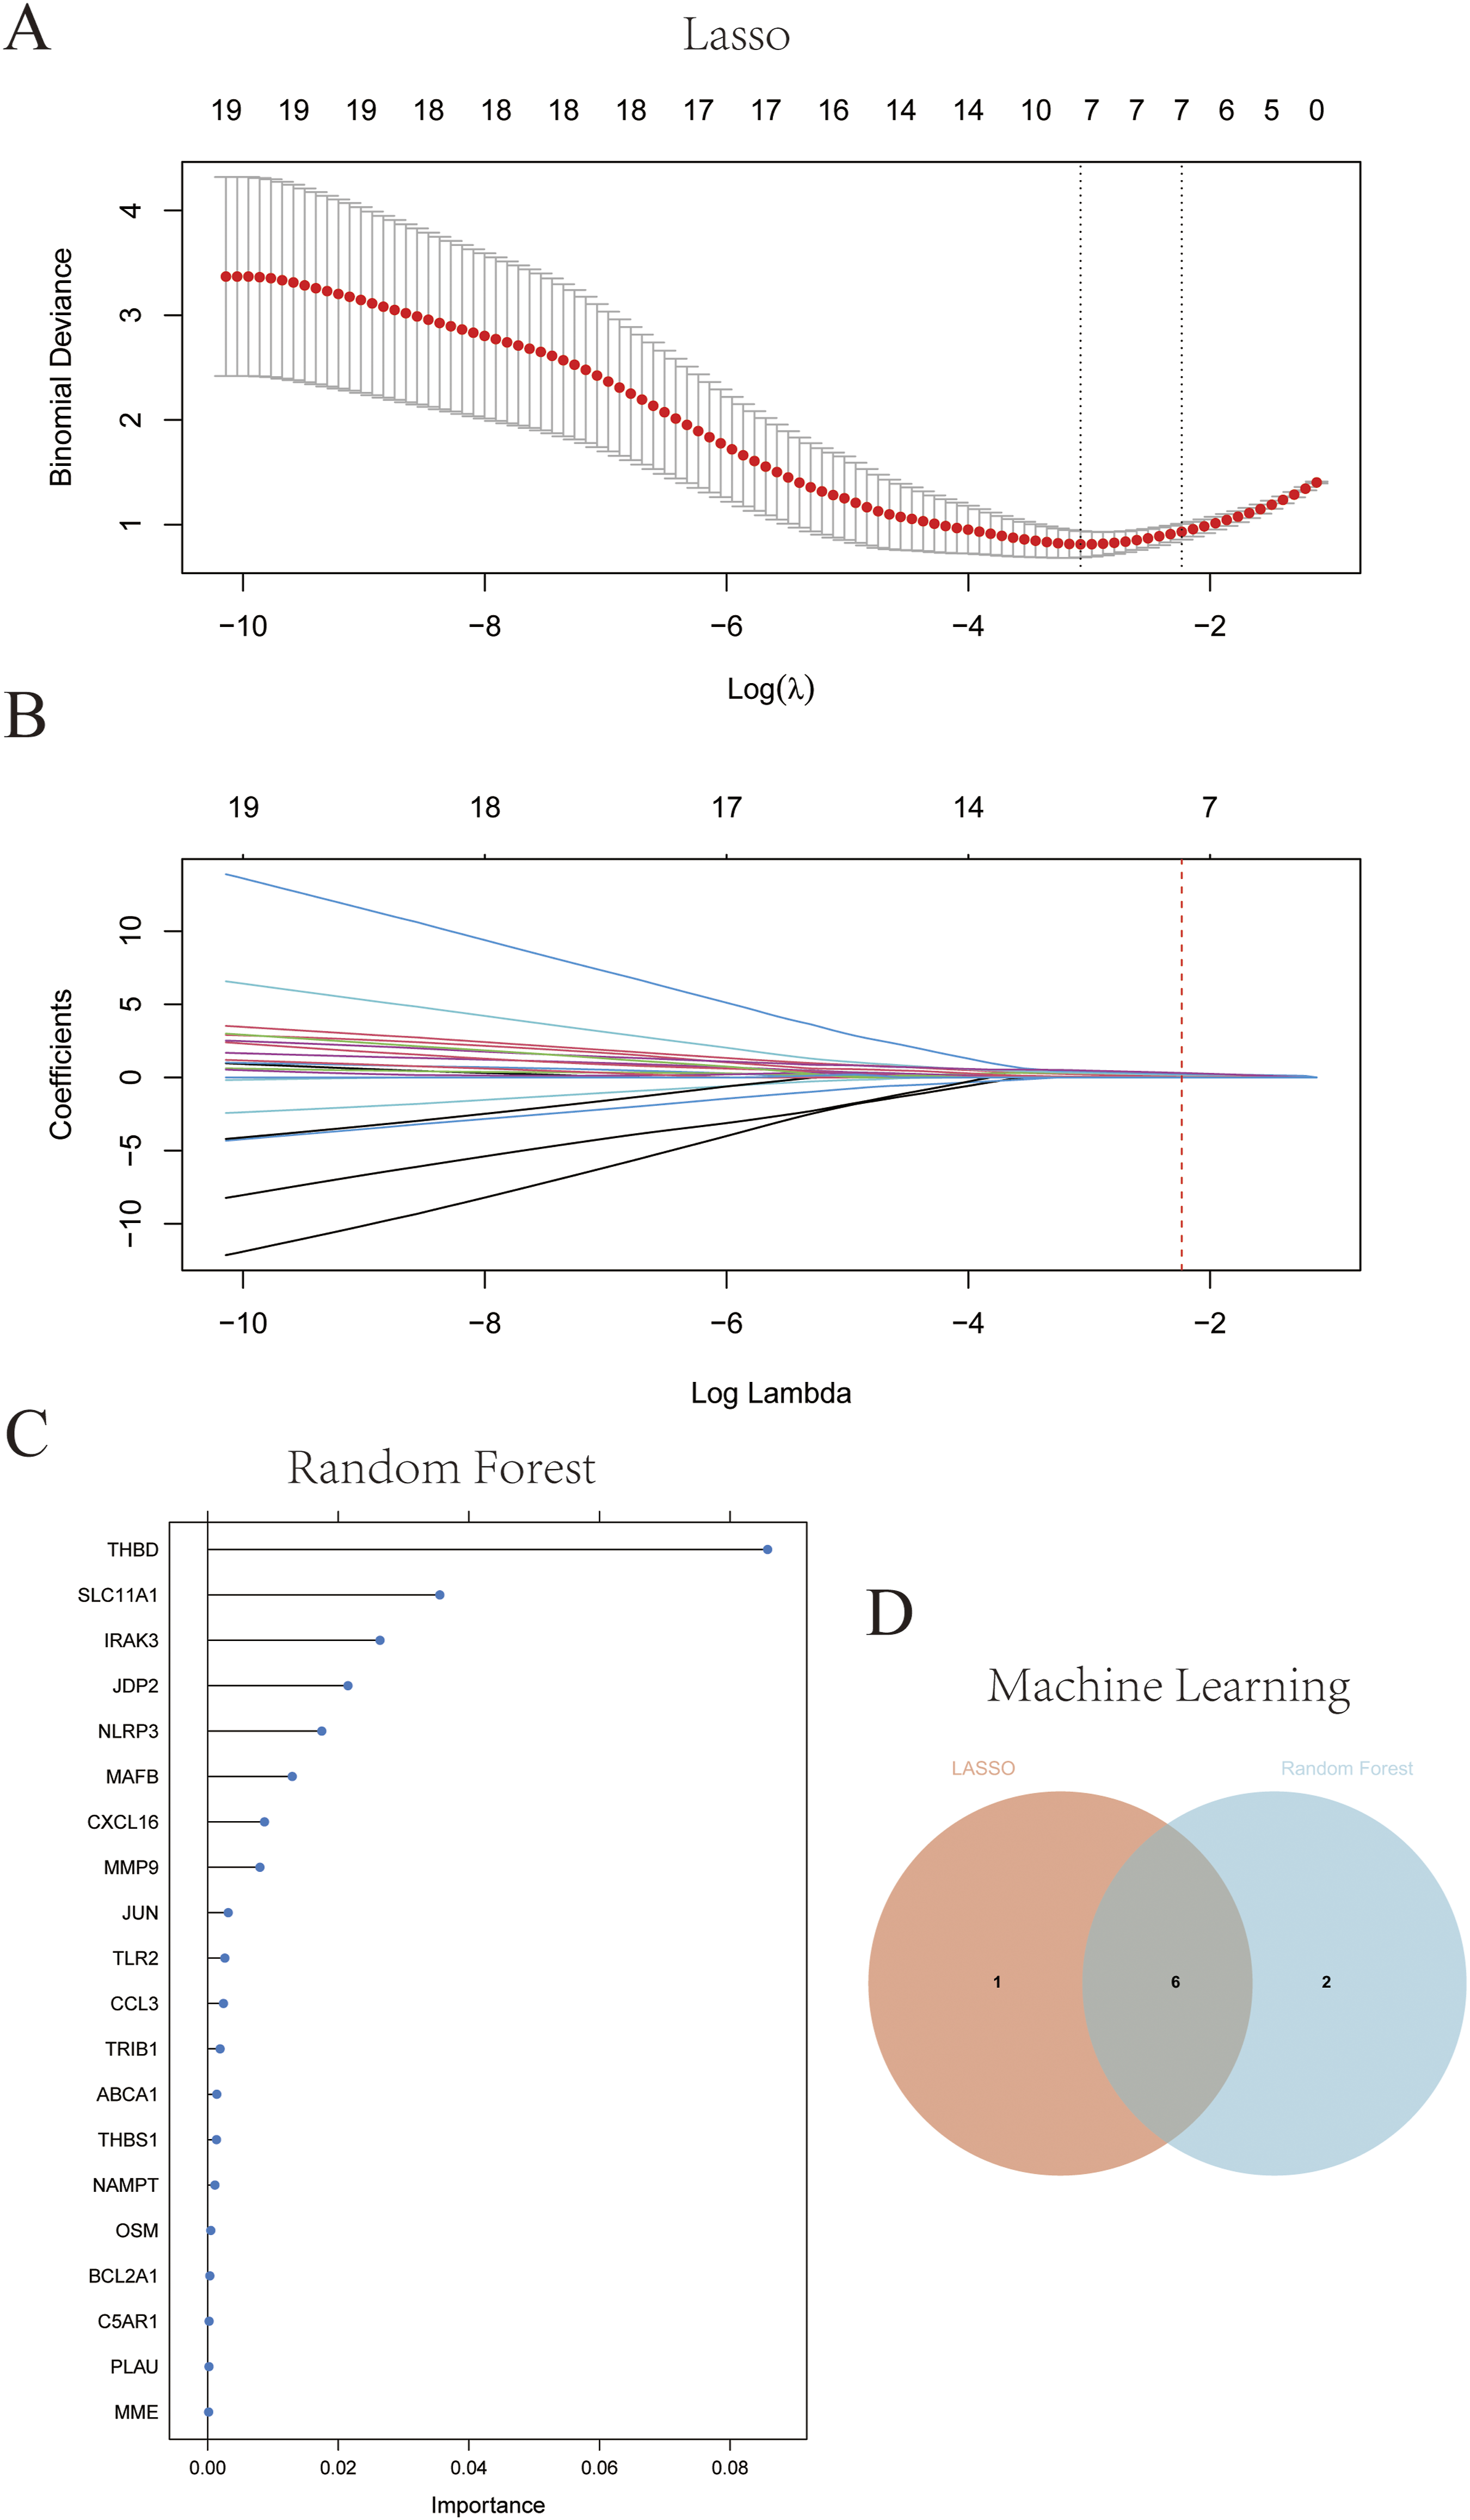
Diagnostic model
Based on the six candidate hub genes (THBD, MMP9, IRAK3, CXCL16, NLRP3, and JDP2), we constructed a diagnostic model via logistic regression analysis. ROC curve analysis (shown in supplementary Figure 1A–F) revealed that individual genes exhibited robust predictive performance. A nomogram was further developed to visually quantify diagnosis of AMI in MetS patients (Figure 7), where each gene’s expression level corresponds to a specific score, the total score positively correlates with AMI probability (higher scores indicate higher risk), and a 0.5 threshold facilitates clinical risk stratification. The nomogram showed excellent predictive efficacy in the training dataset and independent validation dataset (Supplementary Figure 1G and 1H), confirming the significant diagnostic value of the six hub genes and the derived nomogram for AMI. We acknowledge that model performance may be overestimated due to lack of internal cross-validation and small sample size in the validation cohort. The nomogram maps the normalized expression levels of each hub gene to a corresponding point score, with the total cumulative score (Overall point) correlated with the predicted probability of AMI (Positive Risk). The green dashed line marks the clinical risk threshold of 0.5, stratifying patients into high-risk (predicted probability ≥ 0.5) and low-risk (predicted probability < 0.5) groups.
Immune landscape in AMI
Ratios of twenty-two immune cell types were compared between 49 AMI samples and 50 healthy samples using the CIBERSORT algorithm (Supplementary Figure 2A). For multiple-testing correction of the 22 immune cell subtype comparisons, the Benjamini-Hochberg (BH) method was applied to adjust the original p-values, with a false discovery rate (FDR) of < 0.05 considered statistically significant. The boxplots indicated that the AMI group exhibited lower levels of CD8+ T cells, naive CD4+ T cells, memory resting CD4+ T cells, and gamma delta T cells, as well as higher levels of follicular helper T cells, monocytes, active mast cells, eosinophils, and neutrophils (all adjusted p < 0.05, Supplementary Figure 2B). Correlation analysis among the 22 immune cell types revealed that naive B cells were positively correlated with CD4+ memory activated T cells (r=0.68), and regulatory T cells were positively correlated with M0 macrophages (r=0.64), whereas memory resting CD4+ T cells were negatively correlated with activated mast cells (r=-0.54) and neutrophils (r=-0.54) (Supplementary Figure 2C).
Discussion
Acute myocardial infarction (AMI) is the most severe cardiovascular event that threatens human life, imposing enormous social and economic burdens. Exploring novel and clinically valuable biomarkers for early diagnosis of AMI is a primary clinical task, as timely risk stratification in high-risk populations can guide preventive interventions and reduce mortality. Previous studies have identified several potential indicators for AMI risk assessment, including serum miRNA-499, plasma glucagon-like peptide-1 (GLP-1), plasma lncRNA MHRT, and serum miRNA-210. 13 An evidence-based study demonstrated that the incidence of cardiovascular outcomes in patients with MetS is 1.23-2.15 times higher than in those without MetS. 14 Recent studies have revealed that specific immune cell subsets and pro-inflammatory genes are involved in the pathogenesis of AMI. 15 Moreover, inflammatory responses and immune processes are shared pathological mechanisms of AMI and MetS. Therefore, we aimed to identify immune-based candidate genes in the peripheral blood that are shared between AMI and MetS, and to construct a diagnostic signature for AMI, with the hypothesis that these genes may be informative for future AMI risk assessment in MetS patients.
Immune cell infiltration analysis identified key immune cells and elucidated their roles in AMI pathogenesis, which may provide complementary insights for AMI risk stratification. Consistent with previous studies, our CIBERSORT analysis identified significant alterations in neutrophils, monocytes, mast cells, and T cell subsets in AMI patients. These changes align with the dysregulated immune pathways enriched in our shared AMI-MetS gene set. Neutrophils are the first immune cells to accumulate in ischemic myocardial tissue, thereby recruiting additional immune cells and inflammatory mediators. 16 Ly-6Chigh monocytes and their derived macrophages are activated and recruited to the infarct area by neutrophils, sustaining inflammation and clearing cellular debris by releasing inflammatory cytokines. 17 The immune microenvironment acts as a double-edged sword in cardiovascular homeostasis and damage repair: in the early stage of AMI, accumulated mast cells in vulnerable coronary plaques exacerbate plaque erosion and rupture. 18 Additionally, our research found that peripheral blood eosinophil proportions in AMI patients are significantly higher than in healthy individuals. Mechanistic studies suggest that eosinophils accumulate in peripheral blood and infarcted hearts, modulating the cardiac inflammatory response and limiting cardiomyocyte apoptosis by producing IL-4 and other molecules. 19 Multiple T-cell subsets, including CD8+ T cells, naive CD4+ T cells, memory resting CD4+ T cells, and gamma delta T cells identified in this study, participate in regulating the complex and dynamic inflammatory responses in AMI, and their dysregulation may serve as auxiliary indicators for AMI diagnosis.
KEGG and GO analyses revealed key inflammatory pathways and biological processes linking AMI and MetS. KEGG analysis showed that the 40 genes overlapping between AMI and MetS are mainly involved in the “IL-17 signaling pathway” and “NF-κB signaling pathway”—key pathways linking metabolic disorders to inflammatory responses and AMI. Activated NF-κB signaling stimulates the production of inflammatory factors, triggers a robust inflammatory response, and promotes immune cell activation. 20 NF-κB is activated under severe ischemia-reperfusion conditions, which lead to myocardial infarction, 21 and a previous study indicated that hyperglycemia-activated TBK1-mediated IL-17 signaling may exacerbate coronary atherosclerosis severity. 22 Additionally, metabolic disorders increase the risk of vascular endothelial injury and atherosclerotic plaque accumulation by activating chronic low-grade inflammation through the NF-κB and IL-17 signaling pathways. 23 GO analysis revealed that these 40 genes are primarily involved in “leukocyte activation”, “immune response”, and “immune system processes”, consistent with the close association between immune inflammation and AMI risk. Numerous studies have focused on developing novel therapeutic strategies and predictive biomarkers for AMI based on immune-inflammatory responses, 24 but to our knowledge, no previous research has explored immune-based predictive biomarkers for AMI risk in MetS patients.
In this study, six immune-based genes (THBD, MMP9, IRAK3, CXCL16, NLRP3, and JDP2) for AMI diagnostic in MetS patients were identified through machine learning algorithms and subsequently validated in independent datasets. Thrombomodulin (THBD) plays a crucial role in maintaining vascular homeostasis by regulating thrombosis-fibrinolysis, immune-inflammatory responses, and cell proliferation. 25 Endothelial cell injury during AMI onset up-regulates THBD via NF-κB pathway activation. This up-regulation increases neutrophil chemotaxis and regulates lymphocyte and monocyte activation and proliferation. 26 Thus, elevated THBD expression may indicate increased AMI risk in MetS patients, thereby making it a potential predictive marker. Our research found that MMP9 expression is significantly elevated in AMI patients compared to healthy individuals; altered MMP9 is implicated in MetS pathophysiology, 27 and recent studies showed that MMP9 inhibition effectively reduces infarct size in AMI, supporting its role as both a diagnostic biomarker and therapeutic target. 28 Gelatinase-B, a specific MMP9 substrate stored in and secreted by vascular endothelial cells, contributes to inflammation, atherosclerotic plaque rupture, and cardiovascular events in a hyperglycemic microenvironment. 29
Interleukin-1 receptor associated kinase-3 (IRAK3), a core inhibitor of MetS-associated chronic low-grade NF-κB-mediated inflammation, is up-regulated in AMI patients. Its expression level may serve as a potential diagnostic indicator of AMI. The production of the pro-inflammatory chemokine CXCL16 is involved in AMI and atherosclerosis, 30 and a preliminary study has linked variations in the CXCL16 gene to the severity of coronary artery stenosis, a key precursor of AMI. 31 The The Nod-Like-Receptor (NLR) family Pyrin Domain-Containing 3 (NLRP3) inflammasome, a potential diagnostic factor identified in this study, is involved in inflammatory processes in MetS, diabetes, obesity, and cardiovascular diseases. AMI-induced neutrophil infiltration in ischemic hearts is partly mediated by the NLRP3-IL-1β-IL1R1-NF-κB signaling axis in injury-dependent neutrophils. 32 Animal studies have shown that NLRP3 inflammasome inhibitors mitigate myocardial ischemia/reperfusion injury and preserve cardiac function by suppressing NF-κB signaling. 33 Our research found higher expression of the transcriptional regulator JDP2 in AMI patients compared to healthy controls; previous evidence indicated that the synergy between NF-κB and JDP2 regulates NF-κB-mediated transcriptional activation in early inflammatory responses, 34 and JDP2 overexpression in mice induces inflammation, cardiac hypertrophy, and fibrosis, especially post-AMI cardiac dysfunction. 35 Interestingly, the six up-regulated hub genes identified here are associated with AMI and may participate in pathways involving NF-κB signaling, promoting endothelial inflammation, coronary thrombosis, and cardiomyocyte apoptosis—providing a mechanistic basis for their diagnostic value.
Clinically, these six hub genes hold potential translational value as a blood-based diagnostic signature for AMI. As peripheral blood-based biomarkers, they can be integrated into a non-invasive diagnostic panel to improve AMI detection accuracy—particularly valuable for MetS patients, a high-risk group where timely AMI identification is critical to reducing mortality. The panel may assist in classifying patients into high- and low-probability groups for AMI: elevated expression of MMP9, NLRP3, and CXCL16, which correlate with plaque instability and inflammatory severity, could identify patients at higher probability of AMI, guiding intensified monitoring and therapeutic interventions. Notably, the nomogram constructed based on these genes further enhances their clinical utility by visually quantifying AMI probability: higher total scores correspond to higher AMI probability, and the 0.5 threshold enables straightforward classification, providing a practical tool for clinicians to assess individual patients. However, we emphasize that clinical utility for risk stratification in MetS patients remains hypothesis-generating and requires prospective validation in a well-characterized MetS cohort with adjudicated AMI events. Practical considerations for translation include the need for standardized pre-analytic conditions, validation of assay platforms (e.g., qPCR vs NGS), and assessment of turnaround time relative to current biomarkers.
Currently, individual hub genes have been linked to AMI or MetS, but their combined utility as a diagnostic signature for AMI and their shared expression between the two conditions remains unreported. MMP9 and NLRP3 are well-documented in AMI pathophysiology, with elevated levels associated with infarct size and clinical prognosis, while their overexpression in MetS is linked to chronic inflammation and insulin resistance.36,37 THBD and CXCL16 have been implicated in vascular dysfunction associated with both conditions, but no studies have validated their efficacy as part of a combined diagnostic signature for AMI.38,39 IRAK3 and JDP2 are less studied in this context. While IRAK3’s role in MetS-related inflammation is established, its association with AMI diagnosis remains unclear; conversely, JDP2’s link to AMI as part of a shared signature with MetS is newly identified here. Our study contributes to the literature by systematically integrating these genes into a blood-based AMI diagnostic signature using machine learning, validating its utility across multiple independent datasets, and revealing their coordinated association with NF-κB-mediated inflammation—filling a gap in understanding the shared mechanisms between MetS and AMI.
Conclusions
Our data suggested that activation of the NF-κB signaling pathway may be associated with inflammatory responses and myocardial injury, thereby linking MetS and AMI. The six-gene signature and derived nomogram provide a potential diagnostic tool for AMI and a hypothesis-generating resource for understanding the shared inflammatory mechanisms underlying MetS and AMI. However, this study has significant limitations: it is a bioinformatics analysis based on public, cross-sectional case-control datasets, and in vitro and in vivo experiments are needed to verify the functional roles of hub genes and their regulatory relationships with immune cells. Additional key limitations include: heterogeneity of platforms and populations across GEO series and incomplete clinical metadata; absence of MetS patients with AMI in any dataset and thus lack of direct evidence in the target population; potential confounding by leukocyte subset composition, which could drive gene expression differences; risk of overfitting due to selection and evaluation on the same dataset and small external validation sample. Future studies should explore immune cell crosstalk in AMI development in MetS patients, validate the nomogram in large-scale, prospective clinical cohorts of MetS patients with adjudicated AMI outcomes, and standardize assay methods to enhance translational value.
Supplemental material
Supplemental material - Identification of immune-related genes shared between acute myocardial infarction and metabolic syndrome and construction of a diagnostic signature for acute myocardial infarction
Supplemental material for Identification of immune-related genes shared between acute myocardial infarction and metabolic syndrome and construction of a diagnostic signature for acute myocardial infarction by Ni Feng, Meiguo Feng, Jian Ruan, Cai Zhou, Xiaoying Song, Li Chen, Shuai Hou in Science Progress.
Footnotes
Acknowledgements
We gratefully acknowledge the LetPub Scientific Paper Editing Service Team for their assistance in the language polishing of this manuscript.
Author contributions
Shuai Hou and Meiguo Feng contributed equally to this work. Li Chen designed the research; Xiaoying Song and Cai Zhou performed the data collection and bioinfomatics analysis; Jian Ruan completed the visualization; Shuai Hou and Ni Feng wrote the paper.
Funding
The authors disclosed receipt of the following financial support for the research, authorship, and/or publication of this article: This work was supported by Special funding project for scientific research at Xianning Central Hospital, the grant number is 2025XYA001.
Declaration of conflicting interests
The authors declared no potential conflicts of interest with respect to the research, authorship, and/or publication of this article.
Data Availability Statement
The datasets were obtained from the Gene Expression Omnibus (GEO) database.
AI tools
We used Doubao (an AI tool) for manuscript formatting and reference format standardization.
Supplemental material
Supplemental material for this article is available online.
References
Supplementary Material
Please find the following supplemental material available below.
For Open Access articles published under a Creative Commons License, all supplemental material carries the same license as the article it is associated with.
For non-Open Access articles published, all supplemental material carries a non-exclusive license, and permission requests for re-use of supplemental material or any part of supplemental material shall be sent directly to the copyright owner as specified in the copyright notice associated with the article.