






Abstract
Objective
As an in vitro model of catecholaminergic neurons, Cath.a Differentiated cells or CAD cells have been selected because of their direct origin in the mouse CNS and their ability to undergo inducible differentiation. Dexamethasone (DEX), a glucocorticoid receptor agonist, generates postmitotic and neurite-bearing CAD cells. Although the morphological differentiation of CAD cells induced by DEX has been well characterized, a comprehensive understanding of its proteomic profile and underlying pathways remains limited. Neuronal differentiation involves substantial remodeling of mitochondrial metabolic programs. However, the relationship between DEX-induced neuronal differentiation in CAD cells and mitochondrial metabolic state remains incompletely understood.
Methods
In this study, we applied a label-free quantitative SWATH-MS proteomic approach to investigate the protein expression in CAD cells upon differentiation.
Results
The results of the proteomic analysis of 1,114 proteins associated with various GO terms, including neuronal differentiation and characteristics of brain-derived CAD cells, are shown. The data revealed the upregulation of proteins involved in mitochondria-associated metabolism and oxidative phosphorylation in DEX-differentiated cells compared with those in dividing cells, highlighting the role of mitochondrial metabolic changes during the neuronal differentiation of CAD cells. In addition, we identified proteins that were commonly expressed between the two neuronal differentiating protocols. A shared set of proteins involves electron transport, metabolic pathways, and DNA repair.
Conclusions
This study first highlights the proteomic signature and elucidates the key altered molecular pathways underlying DEX-induced neuronal differentiation in CAD cells.
Keywords
Introduction
Induced differentiation of neuronal cell lines has been used as a preclinical research tool for studying cell and molecular neuroscience. An in vitro model of neuronal differentiation refers to a laboratory-based system in which immortalized cells are induced to transform into neuron-like cells.1–4 These models allow researchers to study the complex process of neuronal development and the factors that influence differentiation. Both intrinsic and extrinsic cues regulate the induction of neuronal differentiation. Understanding the molecular mechanisms underlying induced neuronal differentiation is crucial for optimizing more effective differentiation protocols that increase the efficiency and reliability of neuronal differentiation.
CAD (Cath.a Differentiated) cells are a neuronal cell line derived from a mouse catecholaminergic brain cell line. They serve as a model system for studying various aspects of neurobiology.1,5–9 CAD cells can be readily maintained in an undifferentiated state under standard growth conditions containing 8–10% serum. Notably, differentiation into neuron-like cells can be induced by serum-free media (SF), leading to the development of postmitotic phenotypes and the extension of long neurite processes closely resembling those of primary neurons. 1 Our previous findings also demonstrated that dexamethasone (DEX), a specific glucocorticoid receptor (GR) agonist can serve as an effective alternative method for inducing differentiation. 2 In addition to promoting significant morphological differentiation, DEX enhances the longevity of differentiated cells, offering a key advantage over the conventional SF protocol. By improving cell survival, DEX provides a more robust and reliable approach for studying the neuronal properties and functions of differentiated cells for long-term periods. Although the morphological differentiation of CAD cells has been extensively characterized, the underlying molecular alterations that drive these neuronal differentiation processes remain limited. Understanding these mechanisms could yield valuable insights into the fundamental processes of neuronal differentiation and increase the utility of CAD cells as a model system for studying neurobiology.
The relationship between cellular metabolic reprogramming and neuronal differentiation has been well studied. In fact, the metabolic profile distinguishes the undifferentiated state from the differentiated state. Redox status and cellular metabolism are associated with neuronal differentiation processes, as cell division and differentiation require different levels of energy for DNA replication and neuronal remodeling.10–13 During the transition from stemness to differentiating neuronal progeny, there is a shift in metabolic profiles characterized by a reduction in glycolytic activity and a concurrent increase in oxidative phosphorylation (OXPHOS).14,15 The relationship between the regulation of neuronal cell fate and OXPHOS has been demonstrated. An in vivo study indicated that mouse embryonic neuronal stem cells (NSCs) maintain lower levels of ROS, whereas committed NPCs show a marked increase in ROS levels, which appears to play a pivotal role in driving their differentiation process. 16 Elevated ROS levels result in increased mitochondrial activity and increased OXPHOS in mature neurons.17–21 These findings suggest that ROS are crucial in regulating the shift from stemness to differentiation during neuronal lineage commitment.
Steroid hormones, particularly glucocorticoids acting through the GR, play essential roles in neuronal development by regulating multiple processes of proliferation and differentiation of NSCs. Activation of GR by DEX has been shown to promote neurite outgrowth in murine cortical NSCs, 22 and glucocorticoids have been also been reported to influence NSCs proliferation.23–25 However, the effects of glucocorticoid signaling on mitochondrial OXPHOS and its contribution to neuronal differentiation remain incompletely understood. Notably, ecdysone, a steroid hormone, has been shown to promote a metabolic shift from glycolysis to OXPHOS, leading to cell cycle exit and differentiation of Drosophila NSCs. 26 Consistent with this concept, our previous transcriptomic analysis revealed upregulation of OXPHOS-related genes during DEX-induced neuronal differentiation in CAD cells. 2 While these findings provide insight into the transcriptional level, the corresponding proteomic changes underlying glucocorticoid-induced neuronal differentiation have not yet been explored.
Investigating the proteomic landscape is essential for revealing potential mechanisms that may modulate neuronal differentiation and metabolic shifts in response to stimuli. Using quantitative mass spectrometry (MS)-based proteomic analysis, the underlying mechanism of neuronal differentiation in human embryonic stem cells and neuroblastoma cell lines has been shown to involve metabolic reprogramming upon induced differentiation.20,27 SWATH-MS is a data-independent acquisition (DIA) method that enables measurements of all ionized peptides within a specified mass range from a given sample to be systematically and unbiasedly fragmented. 28 This approach allows reproducible measurement of proteins in complex biological samples. Researchers can uncover key biological pathways by coupling this approach with pathway annotation analysis. This integration is particularly valuable in studying neuronal differentiation, which is a tightly regulated process involving multiple signaling pathways. 20
Although morphological characteristics after the differentiation of CAD cells have been studied, evidence concerning the redox status and cellular metabolic profile of CAD cells is lacking. Therefore, in this study, we employed the SWATH proteomic approach to profile differentially expressed proteins (DEPs) and their corresponding functions. A total of 1,114 proteins were identified in the quantitative analysis, among which a subset was found to be differentially expressed in response to DEX-induced CAD cell differentiation. Pathway enrichment analysis of the upregulated proteins highlighted the involvement of mitochondrial metabolism and OXPHOS during differentiation. We also identified a set of commonly expressed proteins that could be considered metabolic differentiation markers during CAD cell differentiation. This is the first study in which the proteomic alteration profile has been investigated in a CAD cell line.
Materials and methods
Cell culture
Mouse CNS-derived CAD cell line (RRID:CVCL_0199) was obtained from European Collection of Authenticated Cell Cultures (ECACC, accession number: 08100805) and cultured in Dulbecco’s modified Eagle’s medium (DMEM): nutrient mixture F-12 (F12) (Gibco, USA) supplemented with 8% fetal bovine serum (FBS) (HyClone, USA) and 1% antibiotic-antimycotic 100X (Gibco, USA). The cells were maintained in a humidified incubator at 37 °C with 5% CO2 and 95% air (v/v). The cultured cells were regularly tested for mycoplasma contamination via a Mycoplasma PCR detection kit (Abcam, UK).
Differentiation induction
Immortalized CAD cells cultured in complete DMEM/F12 supplemented with 8% FBS were considered undifferentiated or proliferating. Differentiation was conducted following 2 protocols previously reported. 2 The complete medium was replaced with serum-free (0% FBS) DMEM/F12 to induce serum-free differentiated cells. To induce dexamethasone-induced neuronal differentiation, CAD cells were cultured in DMEM/F12 containing 1% FBS and dexamethasone (D4902, Sigma‒Aldrich, USA) at 100 μM. This concentration was selected on the basis of our previous work, in which methanol (vehicle control) had no detectable effect on the differentiation process. 2 The culture media were replenished every 3 days. The cells were differentiated for 5 days and the pellets were collected for the proteomic study. Successful differentiation was indicated by morphological changes, including neurite outgrowth and arrested cell proliferation, and the cells were observed via a 10X objective lens on an inverted microscope (ECLIPSE TS100, Nikon, Japan).
Immunocytochemistry of beta-III tubulin and Ki67
CAD cells were plated at a density of 2 × 10⁴ cells/well on a coverslip placed on a 12-well plate. The plated cells were incubated under different conditions as indicated for 5 days. CAD cells were fixed and permeabilized with prechilled ethanol (95–100%) for 15 min at -20 °C. The cells were then processed as described in our previous study. 2 The cells were incubated in 10% BSA (A2153, Sigma‒Aldrich, USA) dissolved in 1X PBS solution and incubated with mouse monoclonal anti-beta III (neuronal) clone 2G10 (T8578, Sigma‒Aldrich, USA) or rabbit polyclonal anti-Ki67 (cat. no. ab15580, Abcam, UK) in 1% BSA/PBS for 1 h at room temperature. The cells were incubated with goat anti-mouse IgG (H+L), a superclonal secondary antibody conjugated to Alexa Fluor 488 (cat.no. A28175, Invitrogen, USA), or donkey anti-rabbit IgG (H+L) highly cross-adsorbed secondary antibody, Alexa Fluor Plus 488 (cat.no. A32790, Invitrogen, USA). DAPI (Invitrogen, USA) was used for nuclear staining. The experiments were conducted with 3 biological replicates. The images were collected from 5 nonoverlapping areas via a 10-20X objective lens on a Fluoview FV10i laser scanning microscope (Olympus, Japan). The raw files were processed via Fiji version 1.54p (released February 17, 2025; https://imagej.net/software/fiji).
Cell proliferation assay
The relative number of cells was detected via an MTT assay (cat.no. M5655, Sigma‒Aldrich, USA) after 3 days of induction. Briefly, the immortalized cells were plated on 96-well plates at a density of 2,500 cells per well and maintained for 24 h before the media were removed. Different conditioning media (200 µl) were added to each well to induce proliferating or differentiated cells. The MTT stock reagent (20 µl, 5 mg/ml) was directly added to the conditioning media to obtain the final concentration (0.5 mg/ml) of the MTT reagent. The plates were further cultured for an additional 2.5 h. Subsequently, the MTT solution was carefully removed, and insoluble formazan was dissolved in 100 µ DMSO (cat.no. D8418, Sigma‒Aldrich, USA). The colorimetric determination was measured at 570 nm via a spectrophotometer (EZ Read2000 Microplate reader, Biochrom, USA). The data were normalized according to the relative fold change in the number of cells.
Quantitative real-time-PCR
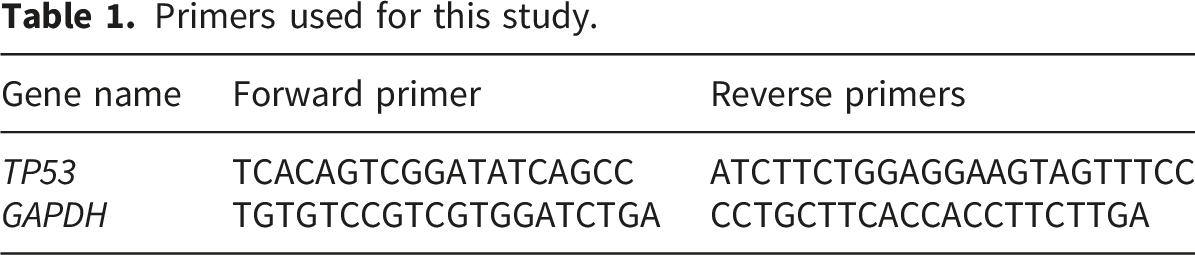
Primers used for this study.
Protein extraction and in-solution digestion for proteomic study
The cells were seeded at a density of 2 × 10⁵ cells per Petri dish (70 × 15 mm) and maintained for 24 h. Differentiation induction was carried out for 5 days. The cell pellets were collected, washed 3 times with cooled 1X PBS, and stored at -80 °C until use. Four biological replicates were prepared for each group. The samples were subjected to LC‒MS/MS analysis at the National Omics Center, National Science and Technology Development Agency, Thailand.
The samples were lysed with lysis buffer solution (0.5% Triton X-100, 10 mM DTT, and 10 mM NaCl in 50 mM HEPES-KOH, pH 8.0). The proteins extracted were precipitated with ice-cold acetone and stored at -20 °C for 16 hours. After precipitation, the protein pellet was reconstituted in 0.25% RapidGest SF (Waters, UK) in 10 mM ammonium bicarbonate. The protein concentrations were measured with a Bradford Reagent assay kit (Sigma‒Aldrich, USA) using bovine serum albumin as the standard. A total of 20 μg of protein was subjected to trypsin digestion. The sulfhydryl bonds were reduced by using dithiothreitol (DTT, 10 mM) in ammonium bicarbonate (10 mM) at 62 °C for 20 minutes, and the sulfhydryl groups were alkylated with iodoacetamide (IAA, 20 mM) at room temperature for 25 minutes in the dark. The solution was cleaned using a desalting column (Thermo Fisher Scientific, USA). The flow-through solution was enzymatically digested with trypsin (Thermo Fisher Scientific, USA) at a ratio of 1:50 (enzyme:protein) and incubated at 37 °C for 6 hours. The digested peptides were reconstituted in 0.1% formic acid and transferred to a TruView LCMS vial (Waters, UK).
DDA-based spectral generation
A Sciex triple TOF-6600+ mass spectrometer (SCIEX, USA) coupled to an EASY-nLC1000 nanoliquid chromatography (LC) system (Thermo Fisher Scientific, USA) equipped with a nanoanalytical column (75 μm i.d. × 15 cm, packed with Acclaim PepMap C18) (Thermo Fisher Scientific, USA) was used for proteomic analysis. For spectral library generation, digested peptide samples (1.0 μg) were analyzed using data-dependent acquisition (DDA). Peptides were separated using mobile phase A (0.1% formic acid (FA) in water) and mobile phase B (80% acetonitrile with 0.1% FA). The samples were loaded onto the nanoanalytical column, and the first linear gradient was separated according to 95 min from 3–35% B from the nano-LC system at a constant flow rate of 300 nL per min. The analytical column was regenerated at 90% B for 10 minutes and re-equilibrated at 5% B for 15 minutes. The eluted peptides were analyzed via LC‒MS/MS. The MS acquisition time was set from gradient time zero to 120 min, and the MS1 spectra were collected in the mass range of 400 to 1,500 m/z with 250 ms in “high sensitivity” mode. Further fragmentation of each MS1 spectrum occurred, with a maximum of 30 precursors per cycle. The switch criteria used were a charge of 2+ to 5+, a 500 cps intensity threshold, and dynamic exclusion for 15 s.
DIA (SWATH- MS) quantitative proteomic analysis
SWATH-MS data for individual samples were acquired via LC‒MS/MS using the workflow described above. Swath acquisition was carried out in data-independent acquisition (DIA) mode. The MS1 spectra were collected in the 400 to 1,250 m/z mass range in “high sensitivity” mode. The variable Q1 isolation windows are optimized on the basis of the spectral library via the SWATH Acquisition Variable Window Calculator. The collision energy was different for each window. Single injections of biological triplicates were performed.
Protein identification and quantification
The protein library was constructed via the Paragon algorithm via ProteinPilot software version 5.0 (SCIEX, USA) and searched against the Mus musculus UniProt database (UniProt release 2024_03) downloaded on 19 June 2024. The search parameters included trypsin as the digestion enzyme, iodoacetamide (IAA) for cysteine alkylation, biological modification, and a threshold of [Unused ProtScore (Conf)] ≥ 0.05 with a 1% false discovery rate (FDR) with ≥ 10 peptides/protein as the filter. This was followed by reviewing the protein molecule markers via PeakView software version 2 (SCIEX, USA). The processing parameters were set as a peptide confidence threshold of 99% and an FDR > 1%. All group files were extracted using an MS tolerance of 25 ppm and an MS/MS tolerance of 50 ppm. The following parameters were considered: number of peptides: 10: number of transitions: 6: and shared peptides excluded for SWATH analysis.
The resulting raw files (Supplementary File 1) were imported into Perseus version 2.1.1.0 software (https://maxquant.net/perseus). 29 The data were log2-transformed and filtered such that 70% of the values were valid. Missing values were imputed by creating a normal distribution of random numbers with a width of 0.3 relative to the standard deviation of the measured values and a 1.8 standard derivation downshift of the mean. Data normalization was performed by subtracting the median. Significant differences in global protein abundance were assessed via Student’s t test, with a permutation-based FDR of 5% and an S0 value of 0.1. The cutoff criteria for up- or downregulated proteins were set at a log2(fold change) >1 or <-1, respectively. According to Benjamini and Hochberg, statistically significant changes were regarded as adjusted p values < 0.05 or log10(FDR) >1.3.
Bioinformatics for functional and pathway annotation analysis
Gene Ontology (GO) annotations describing differentially abundant proteins were retrieved from bioinformatic tools, including DAVID Bioinformatics (https://davidbioinformatics.nih.gov)30,31 or ShinyGO 0.8 (https://bioinformatics.sdstate.edu/go80). 32 For all enrichment analyses, the background was set to the default reference Mus musculus proteome provided by the tools. Term enrichments were considered significant when the FDR was < 0.05. All the databases used Mus musculus as a reference organism. A common and unique list of proteins was identified via InteractiVenn (https://www.interactivenn.net). 33 Protein‒protein interaction (PPI) analysis was conducted via STRING version 12.0 (https://string-db.org). 34
Western blot analysis
Total proteins were extracted with RIPA lysis buffer (cat. no. 89900, Thermo Scientific, USA) containing 10% (v/v) Triton X-100. The concentration of the isolated proteins was measured via a Pierce BCA protein assay kit (cat. no. 23225, Thermo Scientific, USA). An identical concentration of total extracted protein was prepared in 1X LaemmLi SDS sample buffer (Thermo Scientific, USA), heated at 95°C for 15 min, separated by SDS‒PAGE, and transferred to a PVDF membrane (1620177, Bio-Rad Laboratories, USA). The completeness of the blotting process was confirmed by Ponceaus S staining.The membranes were blocked in 2.5 % nonfat dry milk in TBST for 30 min, washed once with 1x PBS, and incubated with primary antibodies against an SDHB (cat.no. 92649, Cell Signaling Technology, USA), or GAPDH (cat.no. ABS16, Merck Millipore, USA). HRP-conjugated secondary antibodies for anti-rabbit IgG (cat. no.7074, Cell Signaling, USA) were used for detection with enhanced chemiluminescence (ECL) reagents (GE Healthcare). The signals were imaged with a Fusion FX chemiluminescence system (Vilber, France). Densitometric quantification of SDHB was normalized to GAPDH, and relative protein expression levels were expressed as fold changes compared with PRO (proliferating) cells. Uncropped images are provided in Supplementary File 7.
Statistical analysis
Statistical analysis was performed, and graphs were created via GraphPad Prism version 8.0.1. Statistical significance was determined via one-way ANOVA for multiple comparisons. Statistical significance was interpreted at a p value < 0.05. All experiments were performed with at least three biological replicates.
Results
CAD cells exhibited morphological differentiation under two validated protocols
CAD cells are CNS-originating neuronal cell lines and are immortalized (proliferating, PRO) when maintained in high-serum-containing media for routine maintenance. The cells, however, exhibited differentiation characteristics under two validated protocols.1,2 The conventional method for inducing neuronal differentiation involves the use of serum-free media (SFs). Without mitogenic factors, the cells undergo neurite outgrowth and stop proliferating. However, cells ultimately die due to a lack of surviving nutrients primed by serum (Supplementary Fig. 1). Our previous findings demonstrated that dexamethasone dissolved in 1% serum-supplemented medium (DEX) is an alternative differentiating method that promotes morphological differentiation and prolongs differentiated cell survival. Proliferating (PRO) cells were polygonal in shape, while both SF and DEX clearly promoted neurite elongation (Figure 1(a)). In vitro differentiation of CAD cells by DEX and SF results in neurite elongation and growth arrest. (a) Representative immunofluorescence images of βlll-tubulin (neuronal marker) and DAPI (nucleus) staining to display the neurite outgrowth of differentiated CAD cells. Scale bar is 100 μm. (b) Quantification of cell number via the MTT proliferation assay (n=3). (c) Representative immunofluorescence images of Ki67 (cell arrest marker) and DAPI (nucleus) staining to confirm post-mitotic fate of the differentiated CAD cells. Scale bar is 100 μm. (d) Quantification of total Ki67-positive cells (%) via the immunocytochemistry (n=3). (e) Relative TP53 mRNA expression from RT-PCR (n=3). Statistical significance was determined by one-way ANOVA with Tukey’s multiple comparison test. **** P< 0.0001 (vs PRO), ## P<0.01 (vs DEX). PRO: proliferating cells cultured under completed media, DEX: Dex (100μM) + 1% FBS differentiated cells, SF: serum-free differentiated cells.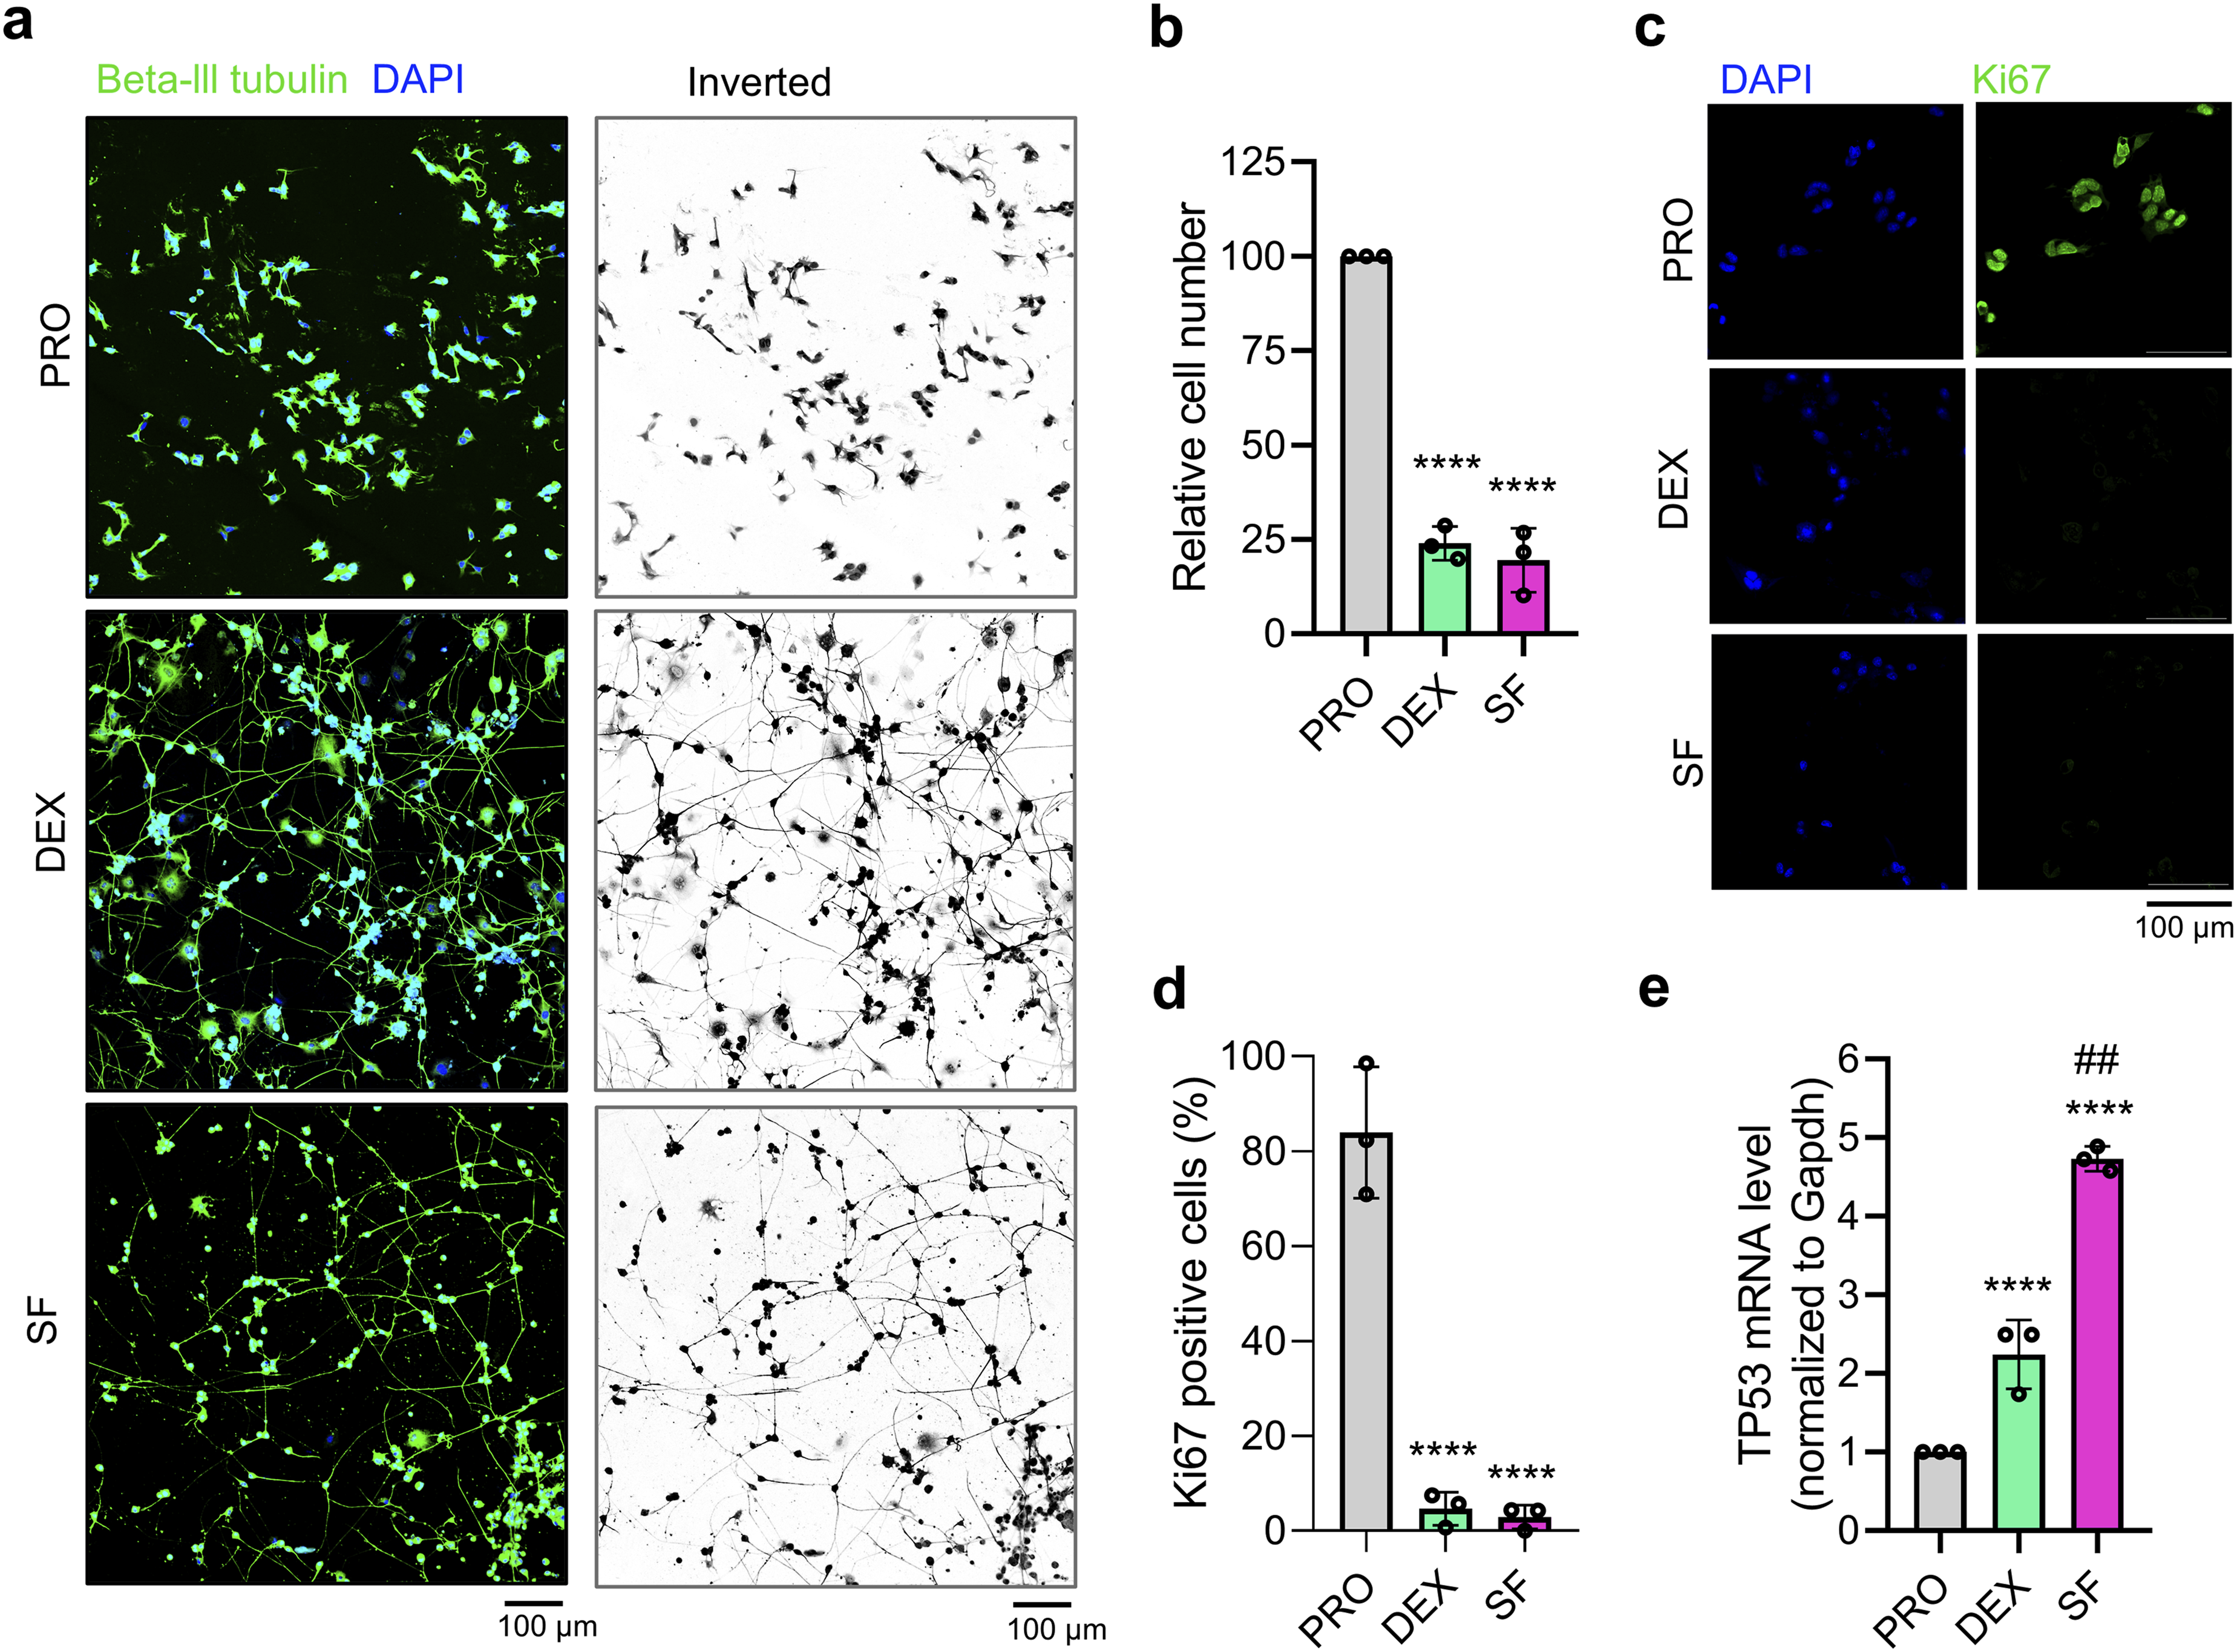
As presented in Figure 1(b), PRO cells actively proliferated as the cell number progressively increased. The cells were slowly proliferated upon differentiation, suggesting that differentiating cells retain a low proliferative state, which is consistent with our previous observations. 2 Immunocytochemical staining for Ki67, a nuclear marker of cell proliferation that is absent in G0-arrested cells, revealed a significant reduction in Ki67-positive cells in both differentiated cell populations, suggesting a transition toward a post-mitotic state (Figure 1(c)–(d)). Furthermore, to demonstrate the molecular mechanism underlying growth arrest, we observed the expression of TP53, a tumor suppressor gene that controls many cell cycle regulators and promotes growth arrest or death in response to cellular stress.35–37 The level of TP53 mRNA was significantly increased in the differentiated cells. SF induced a two-fold higher TP53 mRNA expression level compared to DEX, which may contribute to the pronounced cell death observed in SF-differentiated cells (Figure 1(e)).
Even if morphological differentiation is evident, the molecular profile of the protein expression of these cells is unknown. To investigate the signature profile of protein expression in differentiated and proliferating cells, we applied a label-free quantitative mass spectrometry (MS)-based proteomic approach in SWATH acquisition mode. The workflow of the proteomic study and subsequent functional enrichment analysis is illustrated in Figure 2. Following cell plating, CAD cells were induced to differentiate using either DEX or SF for five days. An undifferentiated group (PRO) was also included. After the treatment period, cell lysates were collected, and proteins were extracted for downstream proteomic analysis. The primary objectives of the analysis were to: (1) identify DEPs between the experimental groups, (2) determine commonly expressed proteins shared between the two differentiation conditions, and (3) perform functional enrichment and pathway annotation to interpret the biological significance of the identified protein sets. Overview workflow for proteomic studies and functional enrichment analysis. CAD cells were plated and subjected to three conditions including undifferentiated/proliferating cells (PRO), dexamethasone-differentiated cells (DEX), and serum-free differentiated cells (SF). After 5 days of incubation, cells were harvested for SWATH-MS-based proteomic profiling. Four biological replicates from each group (n=4) were used. All identified proteins, as well as the lists of DEPs between DEX vs. PRO and DEX vs. SF, and the list of commonly expressed proteins between DEX and SF, were subjected to functional enrichment analysis and/or protein–protein interaction (PPI) analysis to explore associated biological pathways and molecular networks. The last panel of the workflow summarizes the key enriched pathways found in this study.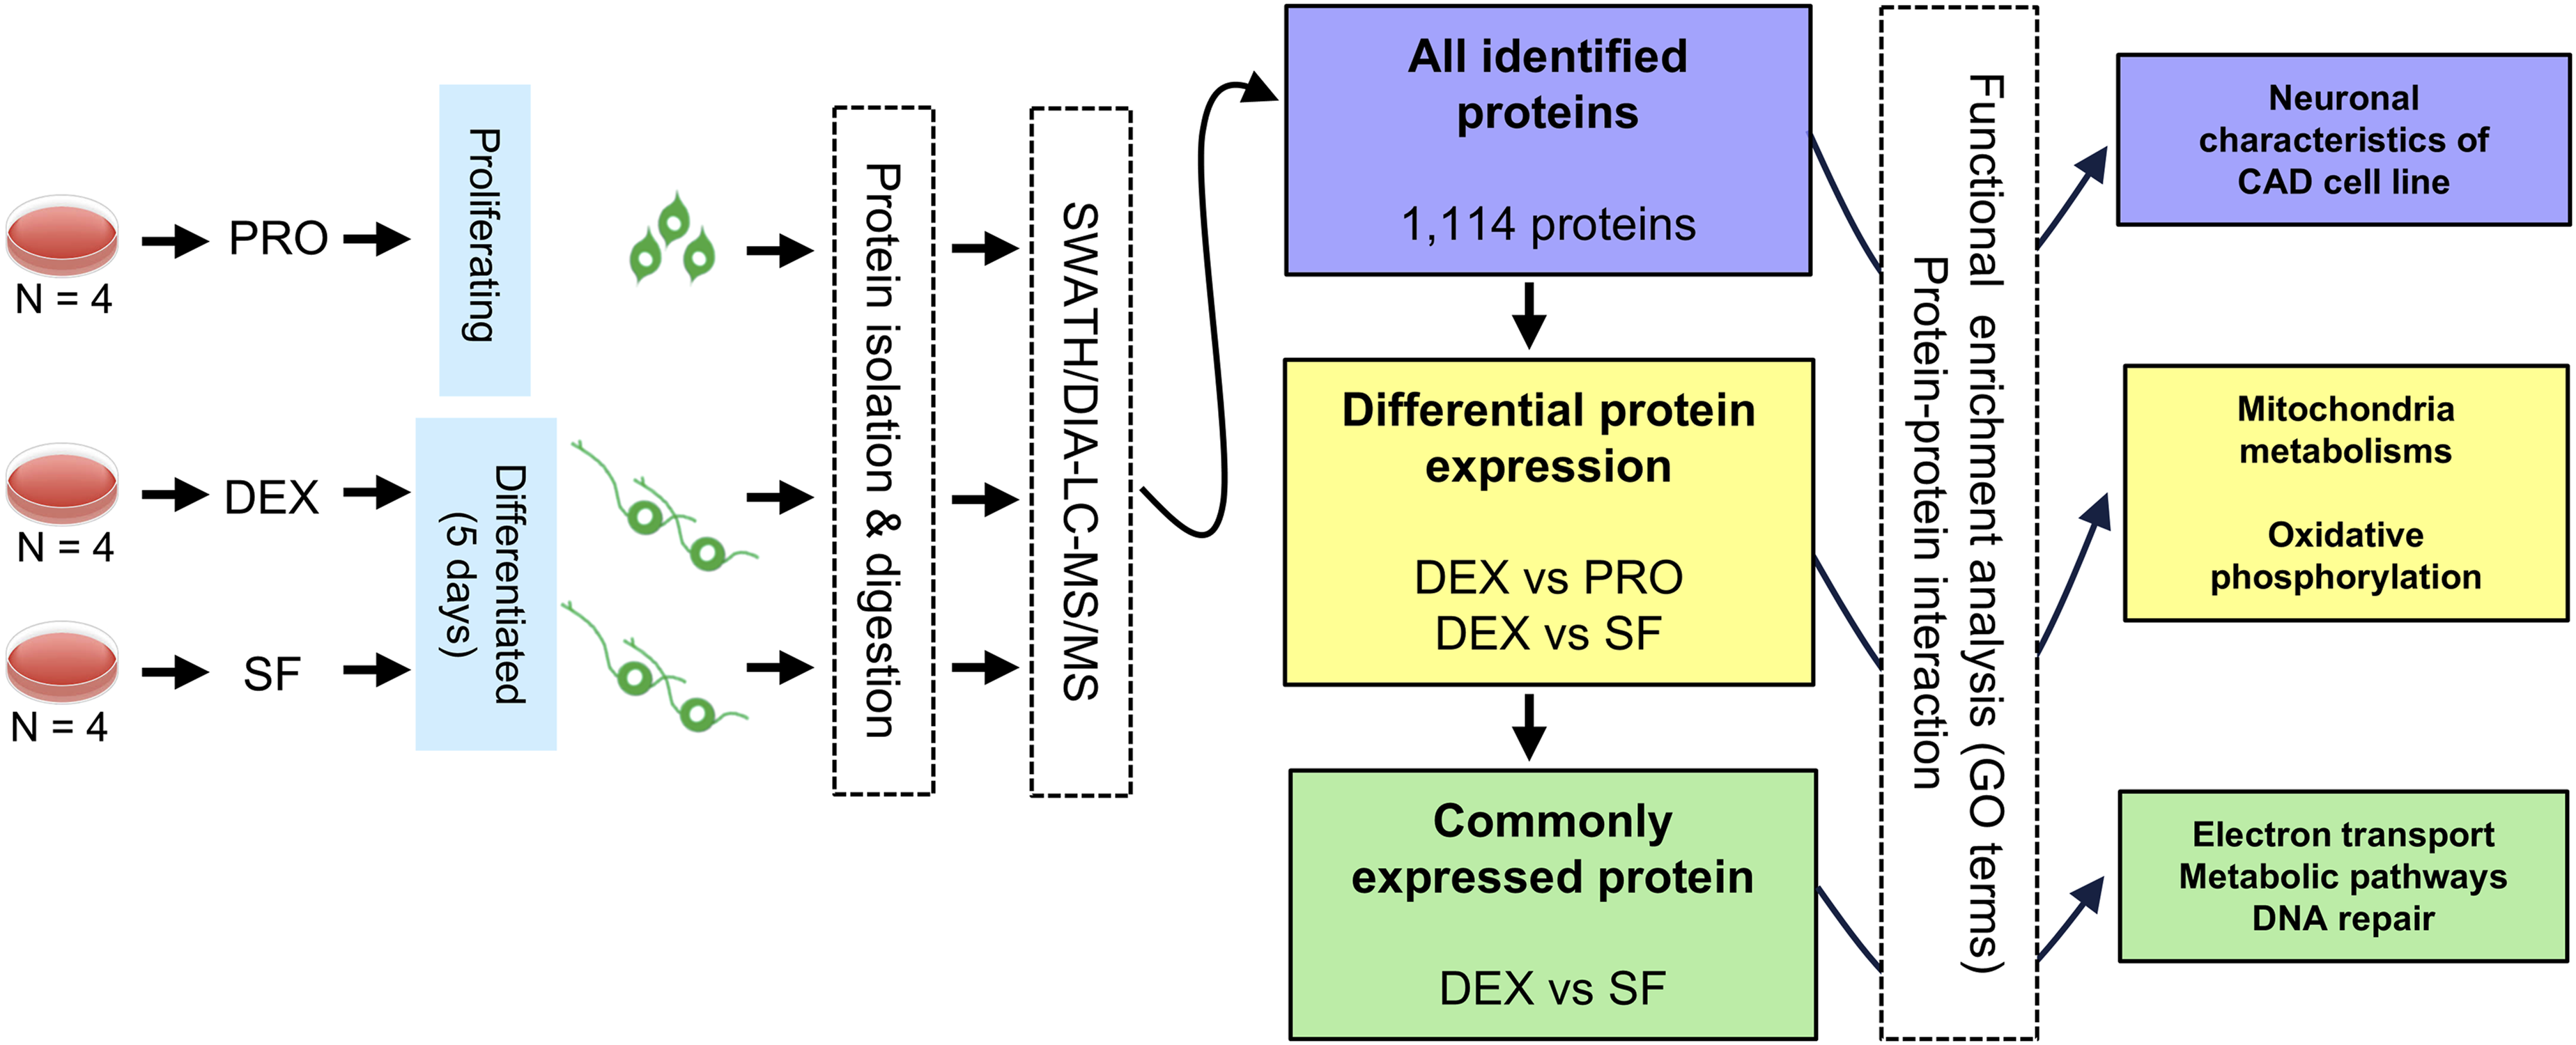
SWATH -based proteomics identified various proteins associated with the neuronal differentiation and phenotypes of CAD cells
Principal component analysis (PCA) and unsupervised hierarchical clustering based on global protein expression profiles revealed distinct proteomic patterns among the experimental conditions (Supplementary Fig. 2b-c). Although biological replicates within each group were not always positioned immediately adjacent to one another in the dendrogram, samples belonging to the same treatment condition displayed comparable overall expression profiles. On the protein axis, the heatmap revealed distinct co-expression modules, representing groups of proteins with coordinated expression patterns across the sample set. These structured patterns suggest that the dataset effectively captures underlying biological signals rather than random variability, supporting its suitability for downstream analyses. Therefore, downstream differential expression and pathway enrichment analyses were employed to identify biologically meaningful changes associated with neuronal differentiation.
A total of 1,114 proteins were identified. These proteins were directly subjected to pathway annotation analysis via DAVID bioinformatics to identify their functions (Supplementary File 2). We identified proteins involved in neuronal differentiation processes (Figure 3(a)). GO terms associated with the cell cycle, DNA replication, regulation of the cell cycle, cell division, and various terms for neuronal differentiation, which include microtubule cytoskeleton organization, regulation of cell shape, axonogenesis, axon guidance, positive regulation of cell fate, regulation of stem cell differentiation, synaptic vesicle endocytosis, dendrite morphogenesis, and anterograde axonal protein transport, were identified. Various cellular stress responses involved in the DNA damage response, DNA repair, the response to oxidative stress, cellular senescence, and the negative regulation of the apoptotic process have also been shown. In addition, some proteins play roles in the response to steroid hormones and nuclear receptor-mediated glucocorticoid signaling pathways. These pathways indicate cellular and biological alterations that might underlie the neuronal differentiation of CAD cells. Functional annotation analysis of the identified proteins via the DAVID bioinformatic database revealed pathway enrichment classified by the following GO terms: (a) biological process, BP, and (b) cellular component, CC.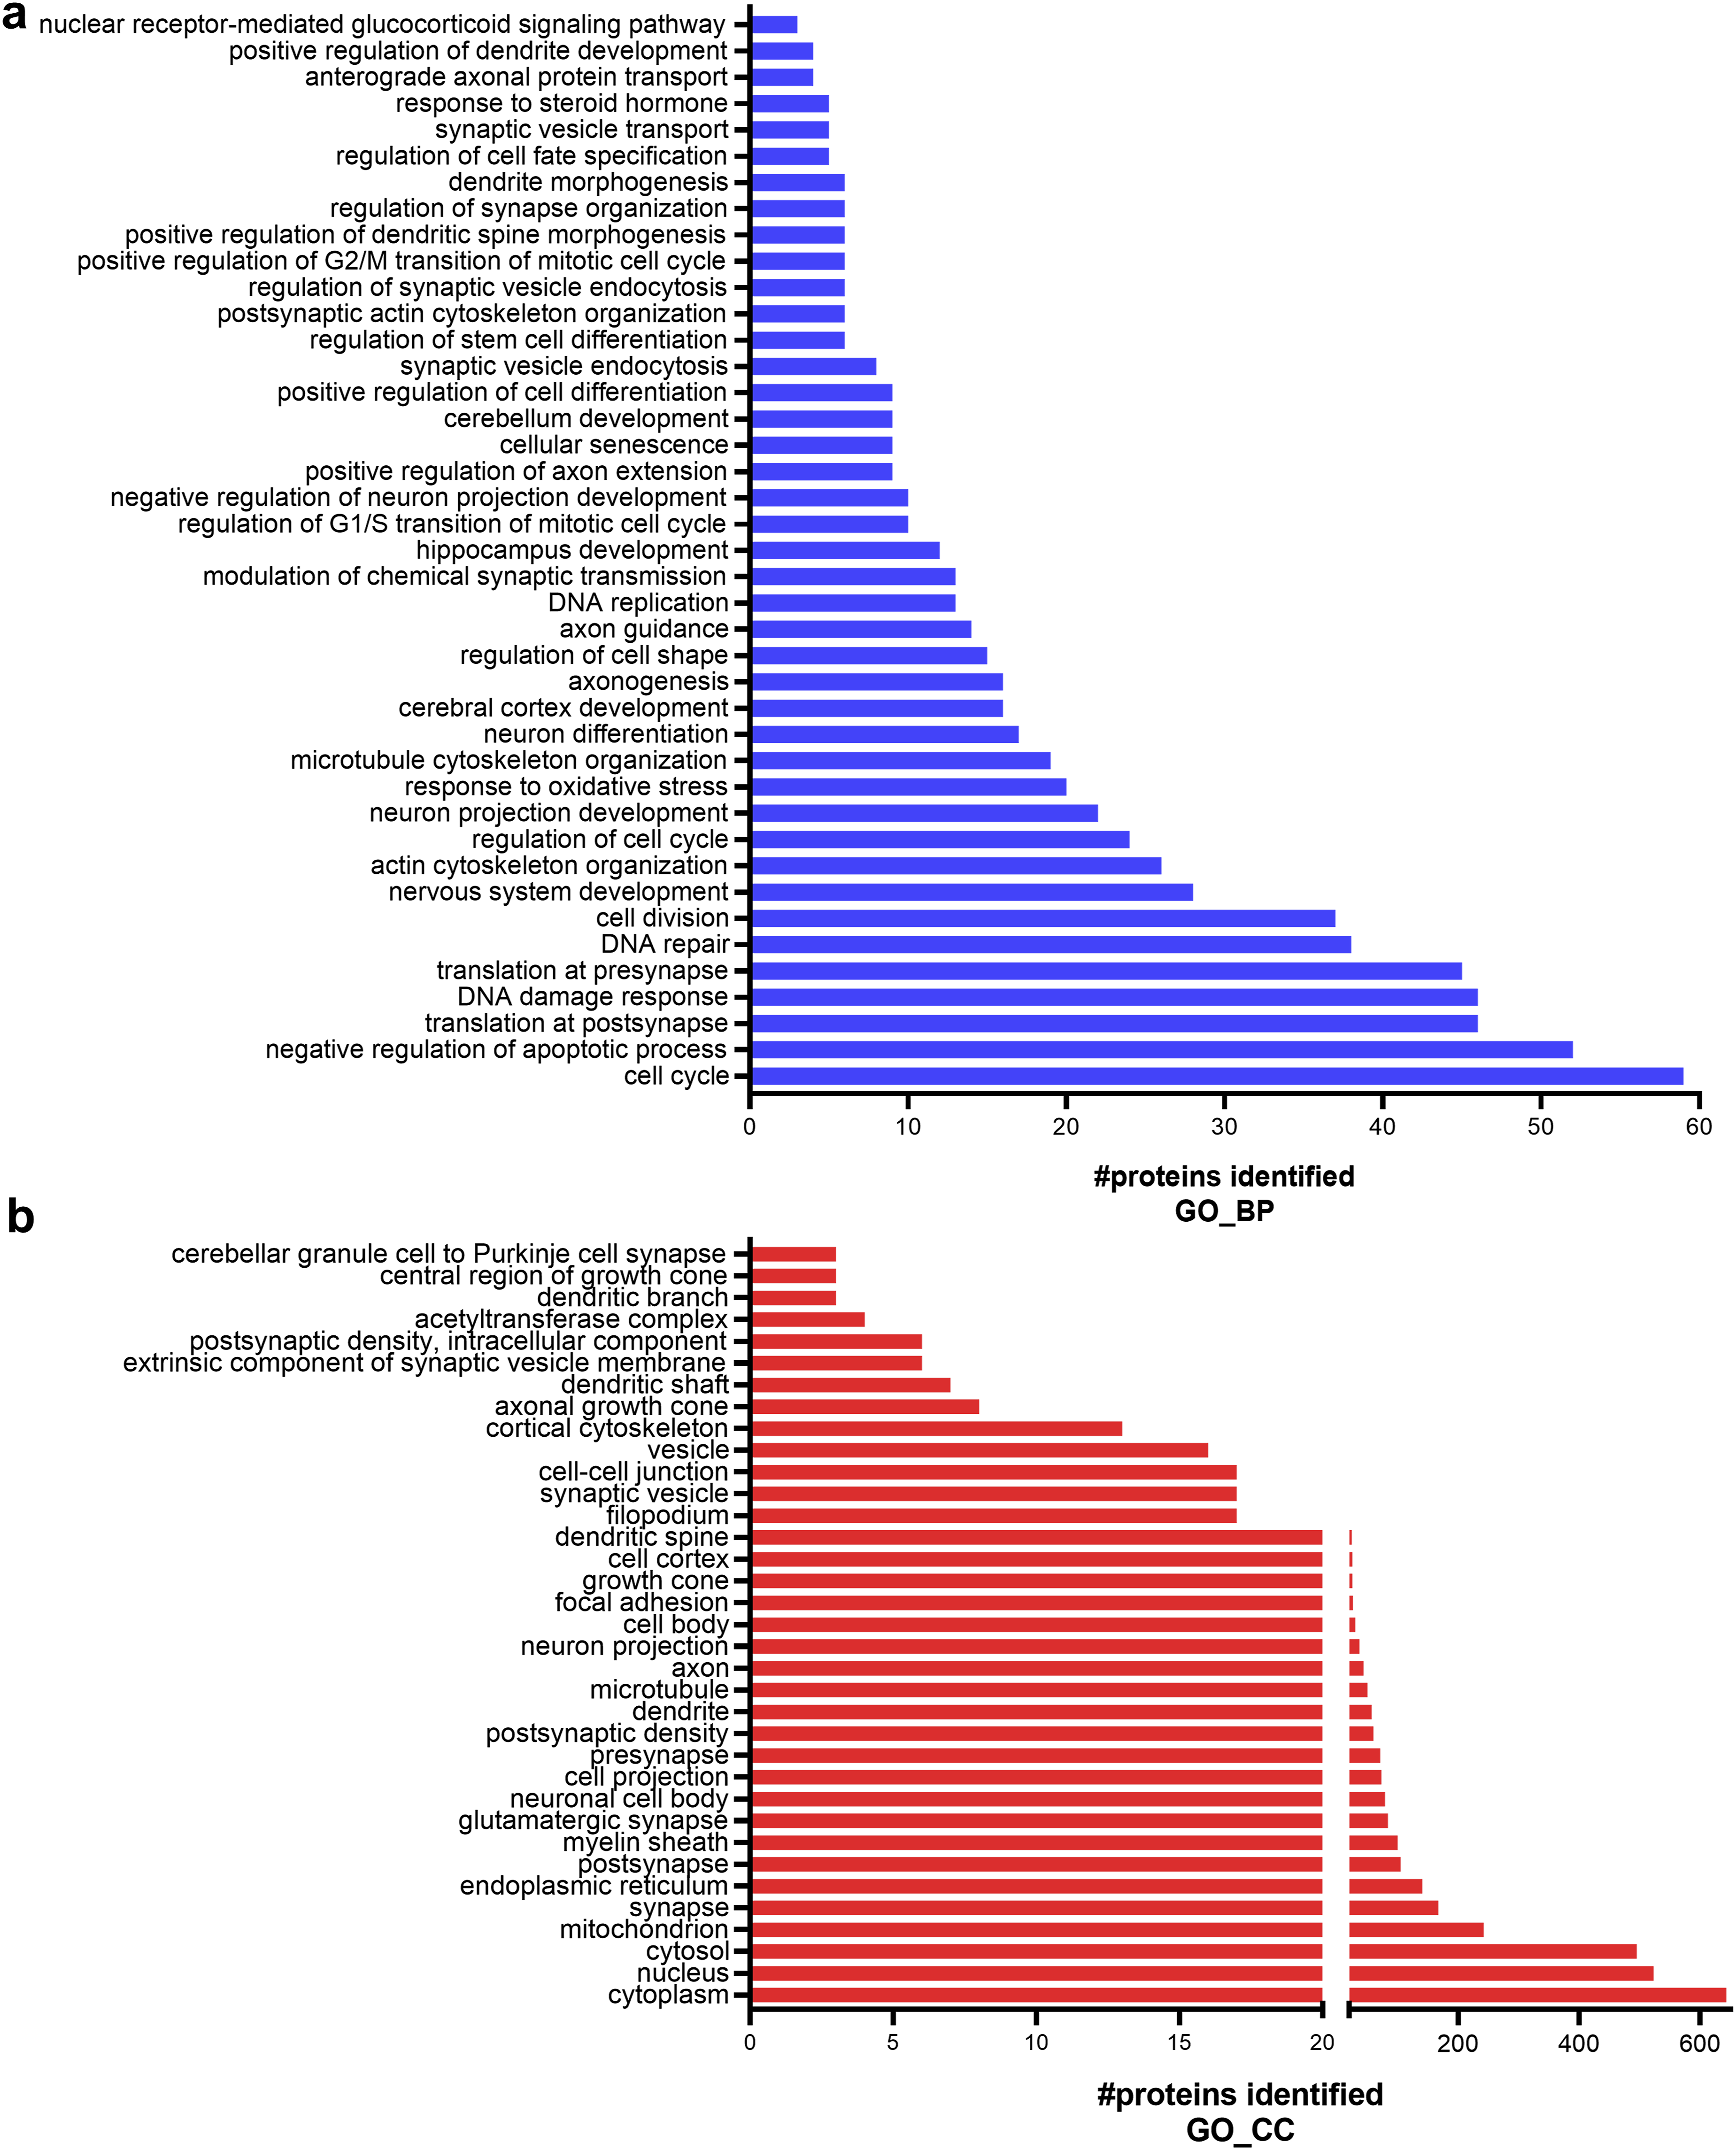
The GO terms of cellular component (CC) revealed that the identified proteins were localized mainly in the cytoplasm, followed by the nucleus, cytosol, and mitochondria (Figure 3(b)). Importantly, proteins categorized in the neuron-related compartments were also identified, including those in the synapse, postsynapse, presynapse, glutamatergic synapse, neuronal cell body, axon, dendrites, dendrite spine, myelin sheath, growth cone, filopodium, and other types of cytoskeletons. These data elucidate the neuronal phenotypic characteristics of CAD cells.
Quantitative analysis identified DEPs in dexamethasone-differentiated cells and highlighted alterations in mitochondrial metabolism
To identify the proteins significantly expressed between each comparative group, we set stringent significance thresholds of a P value < 0.05 and an absolute fold change of 2 or greater. These cutoff criteria identified 65 (DEX vs PRO), 25 (DEX vs SF), and 63 (SF vs PRO) proteins as DEPs. The lists of these proteins are provided in Supplementary File 3. As shown in Figure 4(a), 49 and 16 proteins were upregulated and downregulated, respectively, in DEX compared with PRO. In addition, 14 (upregulated) and 11 (downregulated) proteins were quantified as DEPs between DEX and SF (Figure 4(b)). The five proteins with the highest fold changes were highlighted, with succinate dehydrogenase subunit B (SDHB) emerging as the most prominently upregulated protein in dexamethasone-differentiated cells relative to the other conditions. Volcano plots visualizing the differentially expressed proteins (DEPs) identified by quantitative proteomic analysis. (a) Comparation between dexamethasone-differentiated CAD cell (DEX) and proliferating cells (PRO). (b) Comparation between DEX and serum free -induced differentiated cells (SF). Each plot displays the log2 [fold change] in protein expression versus the −log10 [P value]. DEPs were identified based on a permutation-based FDR < 0.05 and a –log (p-value) > 1.3. Values above this threshold indicate statistically significant changes in protein abundance.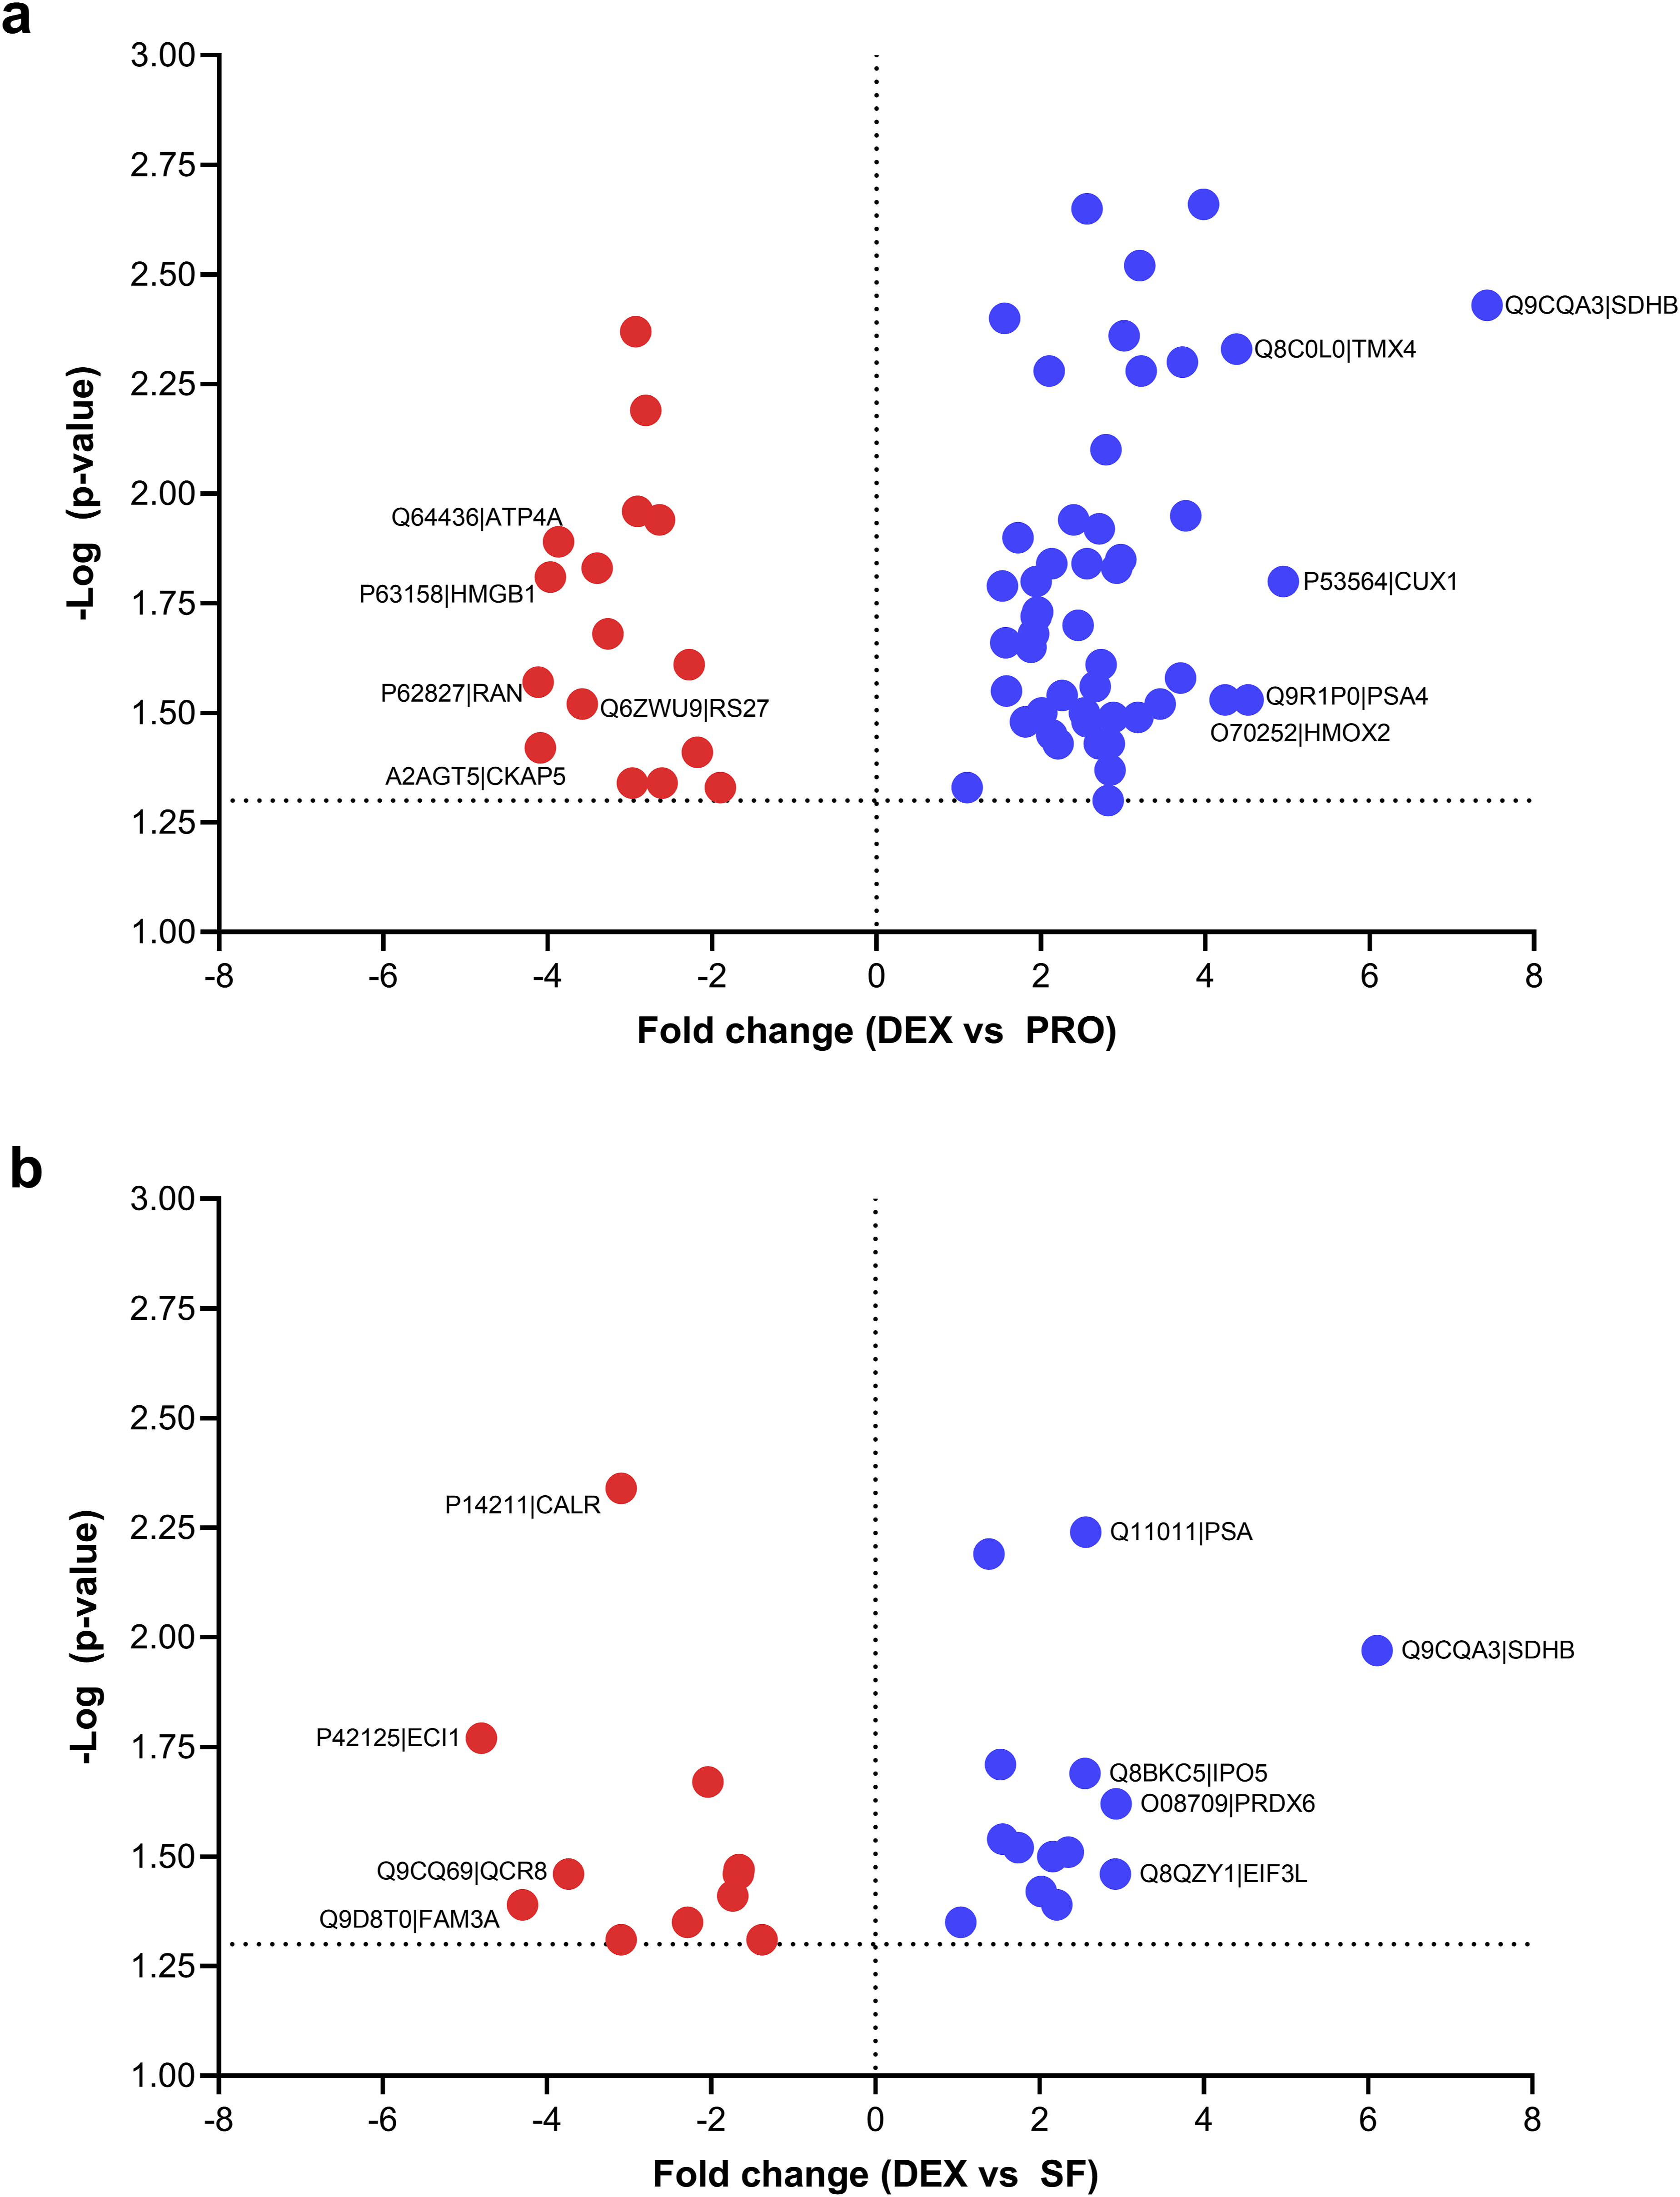
We identified associated functional pathways (BP, MF, CC) of the upregulated proteins (49) in DEX vs PRO by subjecting the list to ShinyGO. The complete list of outputs is available in Supplementary File 4. As shown in Figure 5(a), these proteins were annotated with various BP terms related to mitochondrial metabolic processes, including cellular respiration, the electron transport chain, and oxidative phosphorylation (OXPHOS). The key MF terms enriched in the DEX group included increased oxidoreductase and electron transfer activity (Figure 5(b)). Moreover, network visualization of CC terms (Figure 5(c)) revealed that the upregulated proteins were localized mainly in the mitochondria. These data suggest that mitochondrial metabolism is altered upon DEX differentiation in CAD cells. Upregulated proteins in DEX-differentiated CAD cells play roles in various pathways of mitochondrial metabolism. (a) Dot chart showing pathway enrichment classified by GO terms for biological processes: BP. The terms are ranked on the basis of the FDR. The size of each dot represents the number of proteins categorized under the respective term, whereas the color indicates the fold enrichment. Network visualization of GO terms for (b) molecular functions: MF and (c) cellular components: CC. The size of each dot represents the number of proteins associated with the respective term, whereas the lines indicate the interactions between terms. Functional annotation analysis of upregulated proteins via ShinyGO.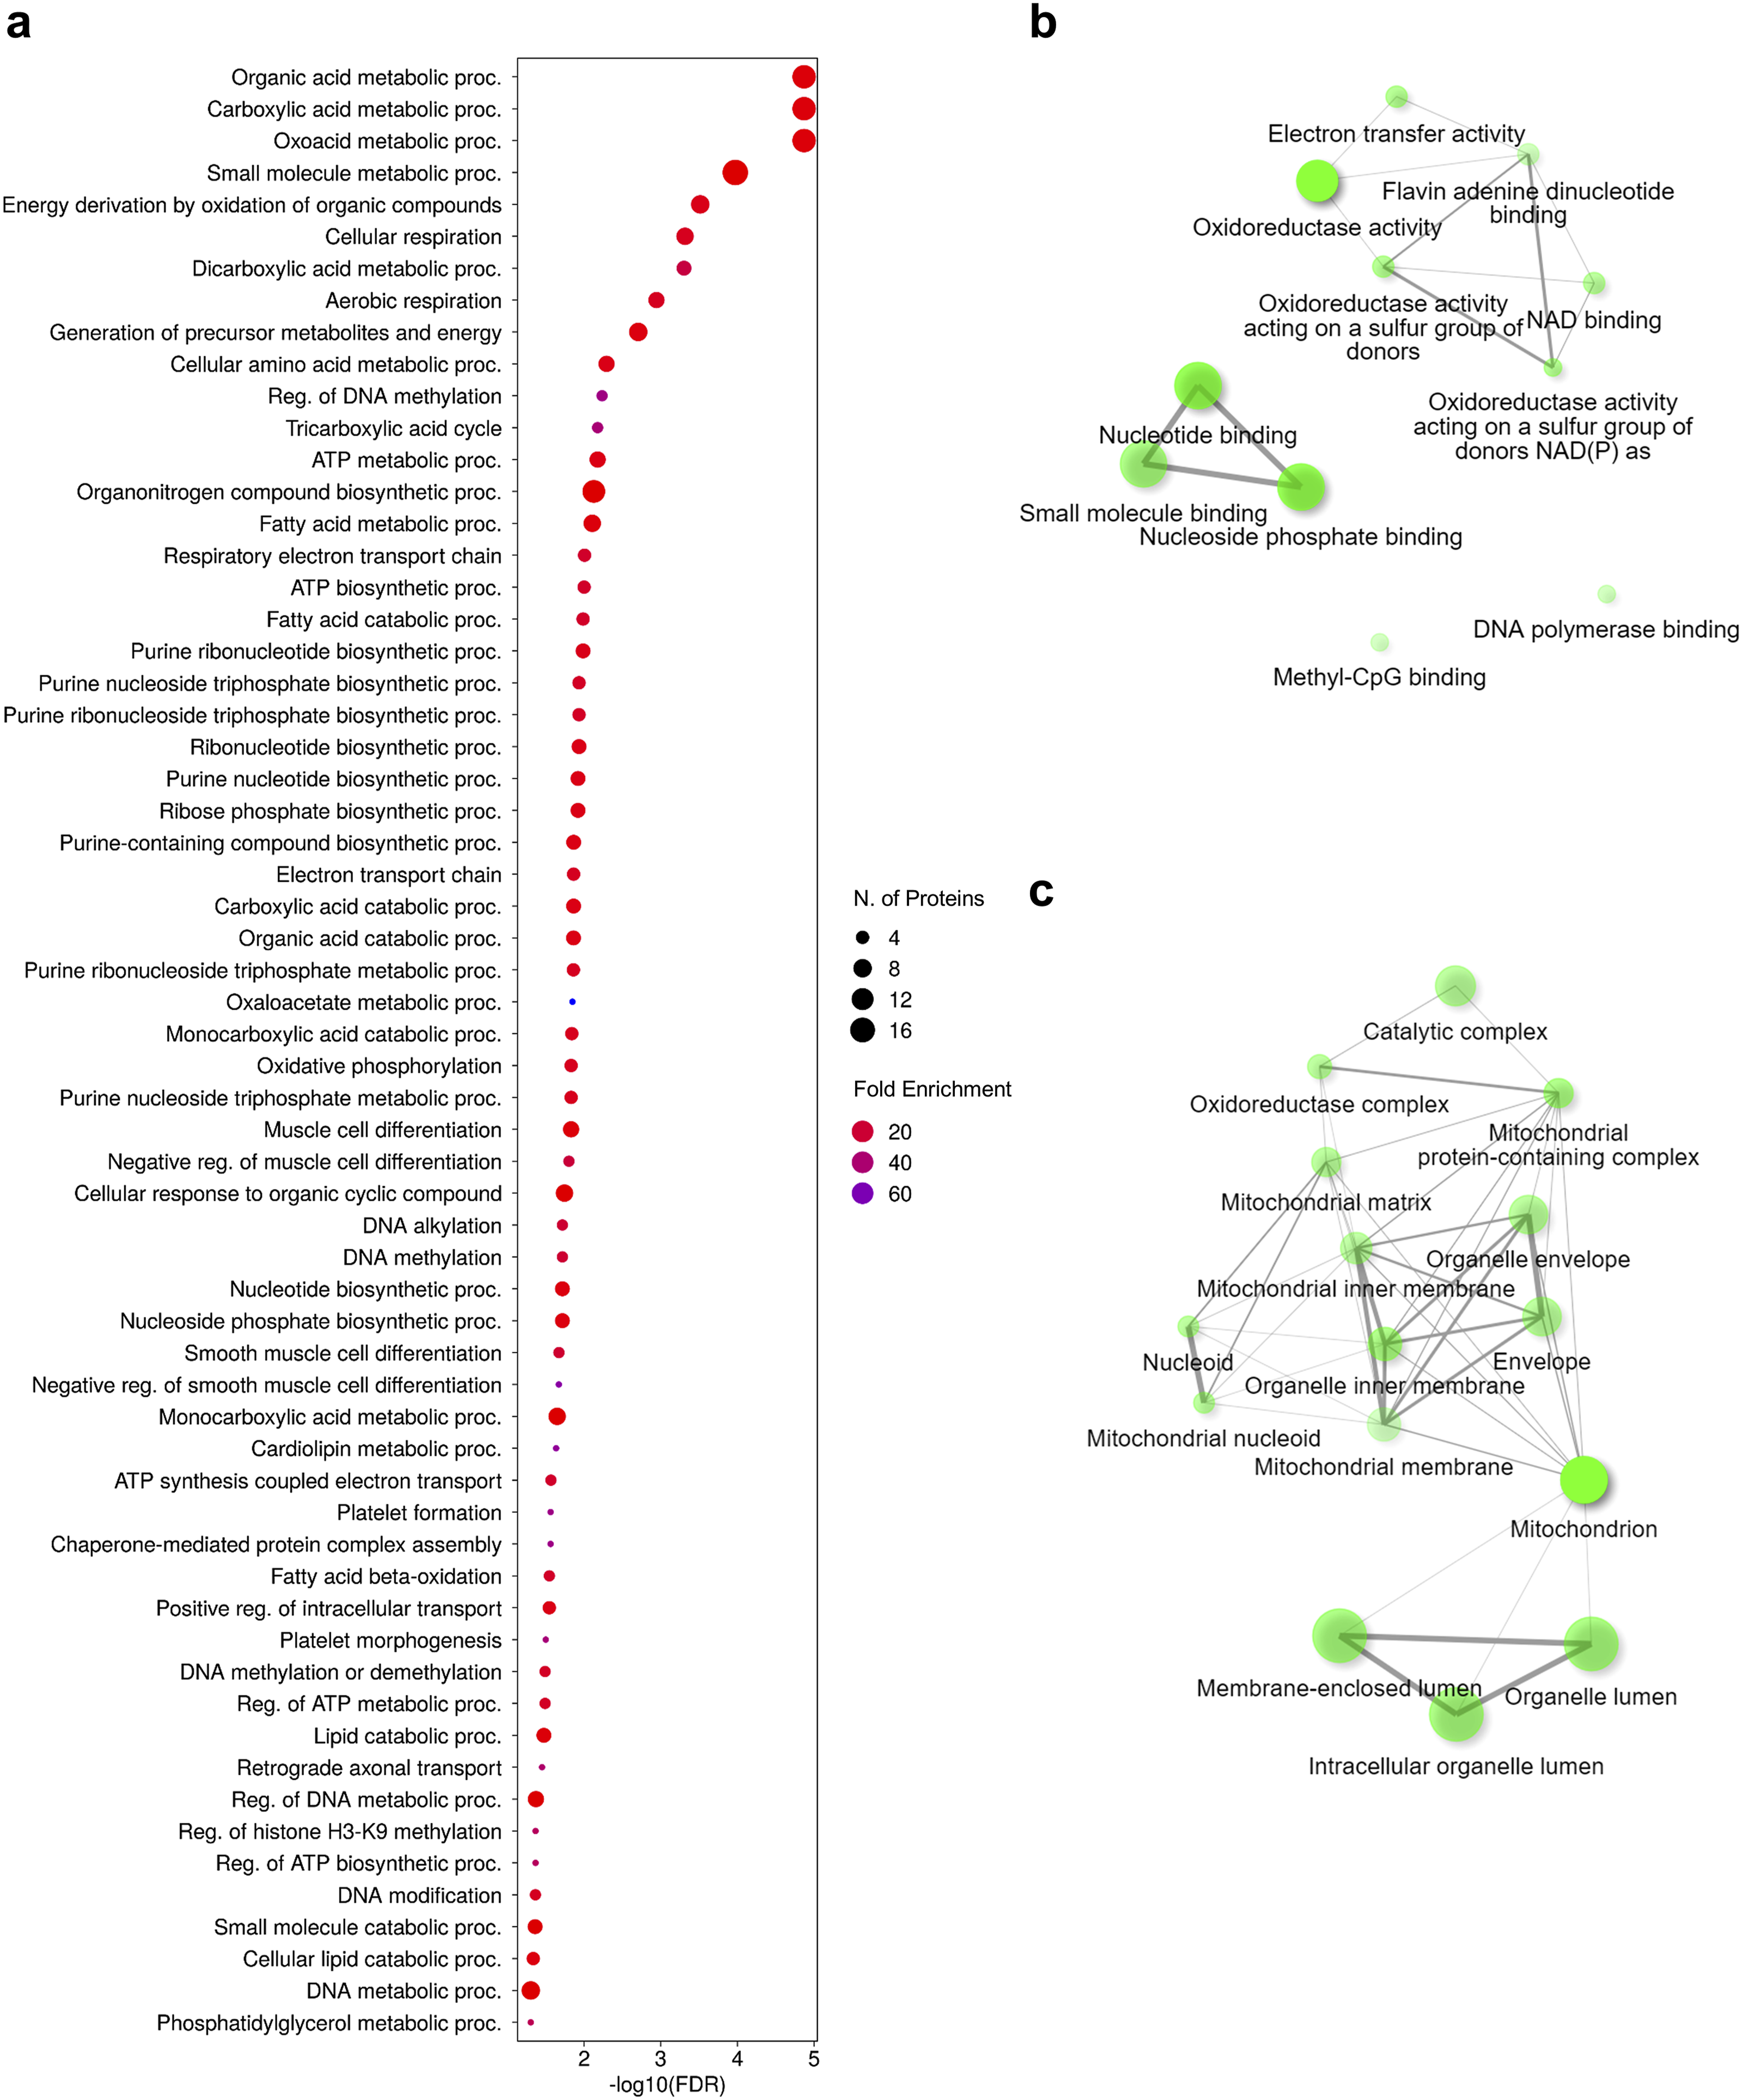
Additionally, pathway enrichment analyses of DEPs for the DEX vs SF and SF vs PRO comparisons were performed and are presented in Supplementary Figure 3 and 4, respectively. Upregulated DEPs in the DEX vs SF comparison were associated with succinate dehydrogenase activity and the respiratory chain complex. In the SF vs PRO comparison, upregulated DEPs were enriched in oxidative phosphorylation and were predominantly localized to mitochondria, whereas downregulated DEPs were associated with translation.
Upregulated proteins in DEX that play roles in oxidative phosphorylation and pathways of mitochondrial metabolism showed the strong protein-protein interaction
Furthermore, we identified proteins associated with OXPHOS and mitochondrial metabolism. Their abundance in each group is illustrated in Figure 6(a) and Supplementary File 5. These proteins include succinate dehydrogenase (Q9CQA3, Sdhb), malate dehydrogenase (P08249, Mdh2), aconitate hydratase (Q99KI0, Aco2), cytochrome c oxidate subunit 2 (P00405, mt-Co2), NADH dehydrogenase (Q9CQH3, Ndufb5), electron transfer flavoprotein subunit alpha (Q99LC5, Etfa), dihydrolipoyl dehydrogenase (O08749, Dld), trifunctional enzyme subunit alpha (Q8BMS1, Hadha), very-long-chain enoyl-CoA reductase (Q9CY27, Tecr), phosphoenolpyruvate carboxykinase (GTP) (Q8BH04, Pck2), prostaglandin E synthase 3 (Q9R0Q7, Ptges3), delta(3,5)-delta(2,4)-dienoyl-CoA isomerase (O35459, Ech1), poly [ADP-ribose] polymerase 1 (P11103, Parp1), and mitochondrial fission 1 protein (Q9CQ92, Fis1). In addition to parp1, all proteins are located in the mitochondrion. Protein‒protein interaction (PPI) analysis revealed strong connections among these proteins, especially sdhb, mt-Co2, and Ndufb5, which are key DEPs that play roles in OXPHOS (Figure 6(b)). Upregulation of proteins that play roles in oxidative phosphorylation and mitochondrial metabolism pathways in DEX-differentiated CAD cells. (a) Quantification of the expression levels of proteins that play roles in mitochondrial metabolism and OXPHOS in DEX, SF, and PRO. The values for expression level were obtained from the log 2 (LFQ intensity) after normalization. (b) PPI network analysis of proteins from panel A. Each circle represents a distinct protein, with colors indicating the biological functions classified by GO terms. The strength of the PPI for each GO term and the corresponding FDR were analyzed via the STRING database.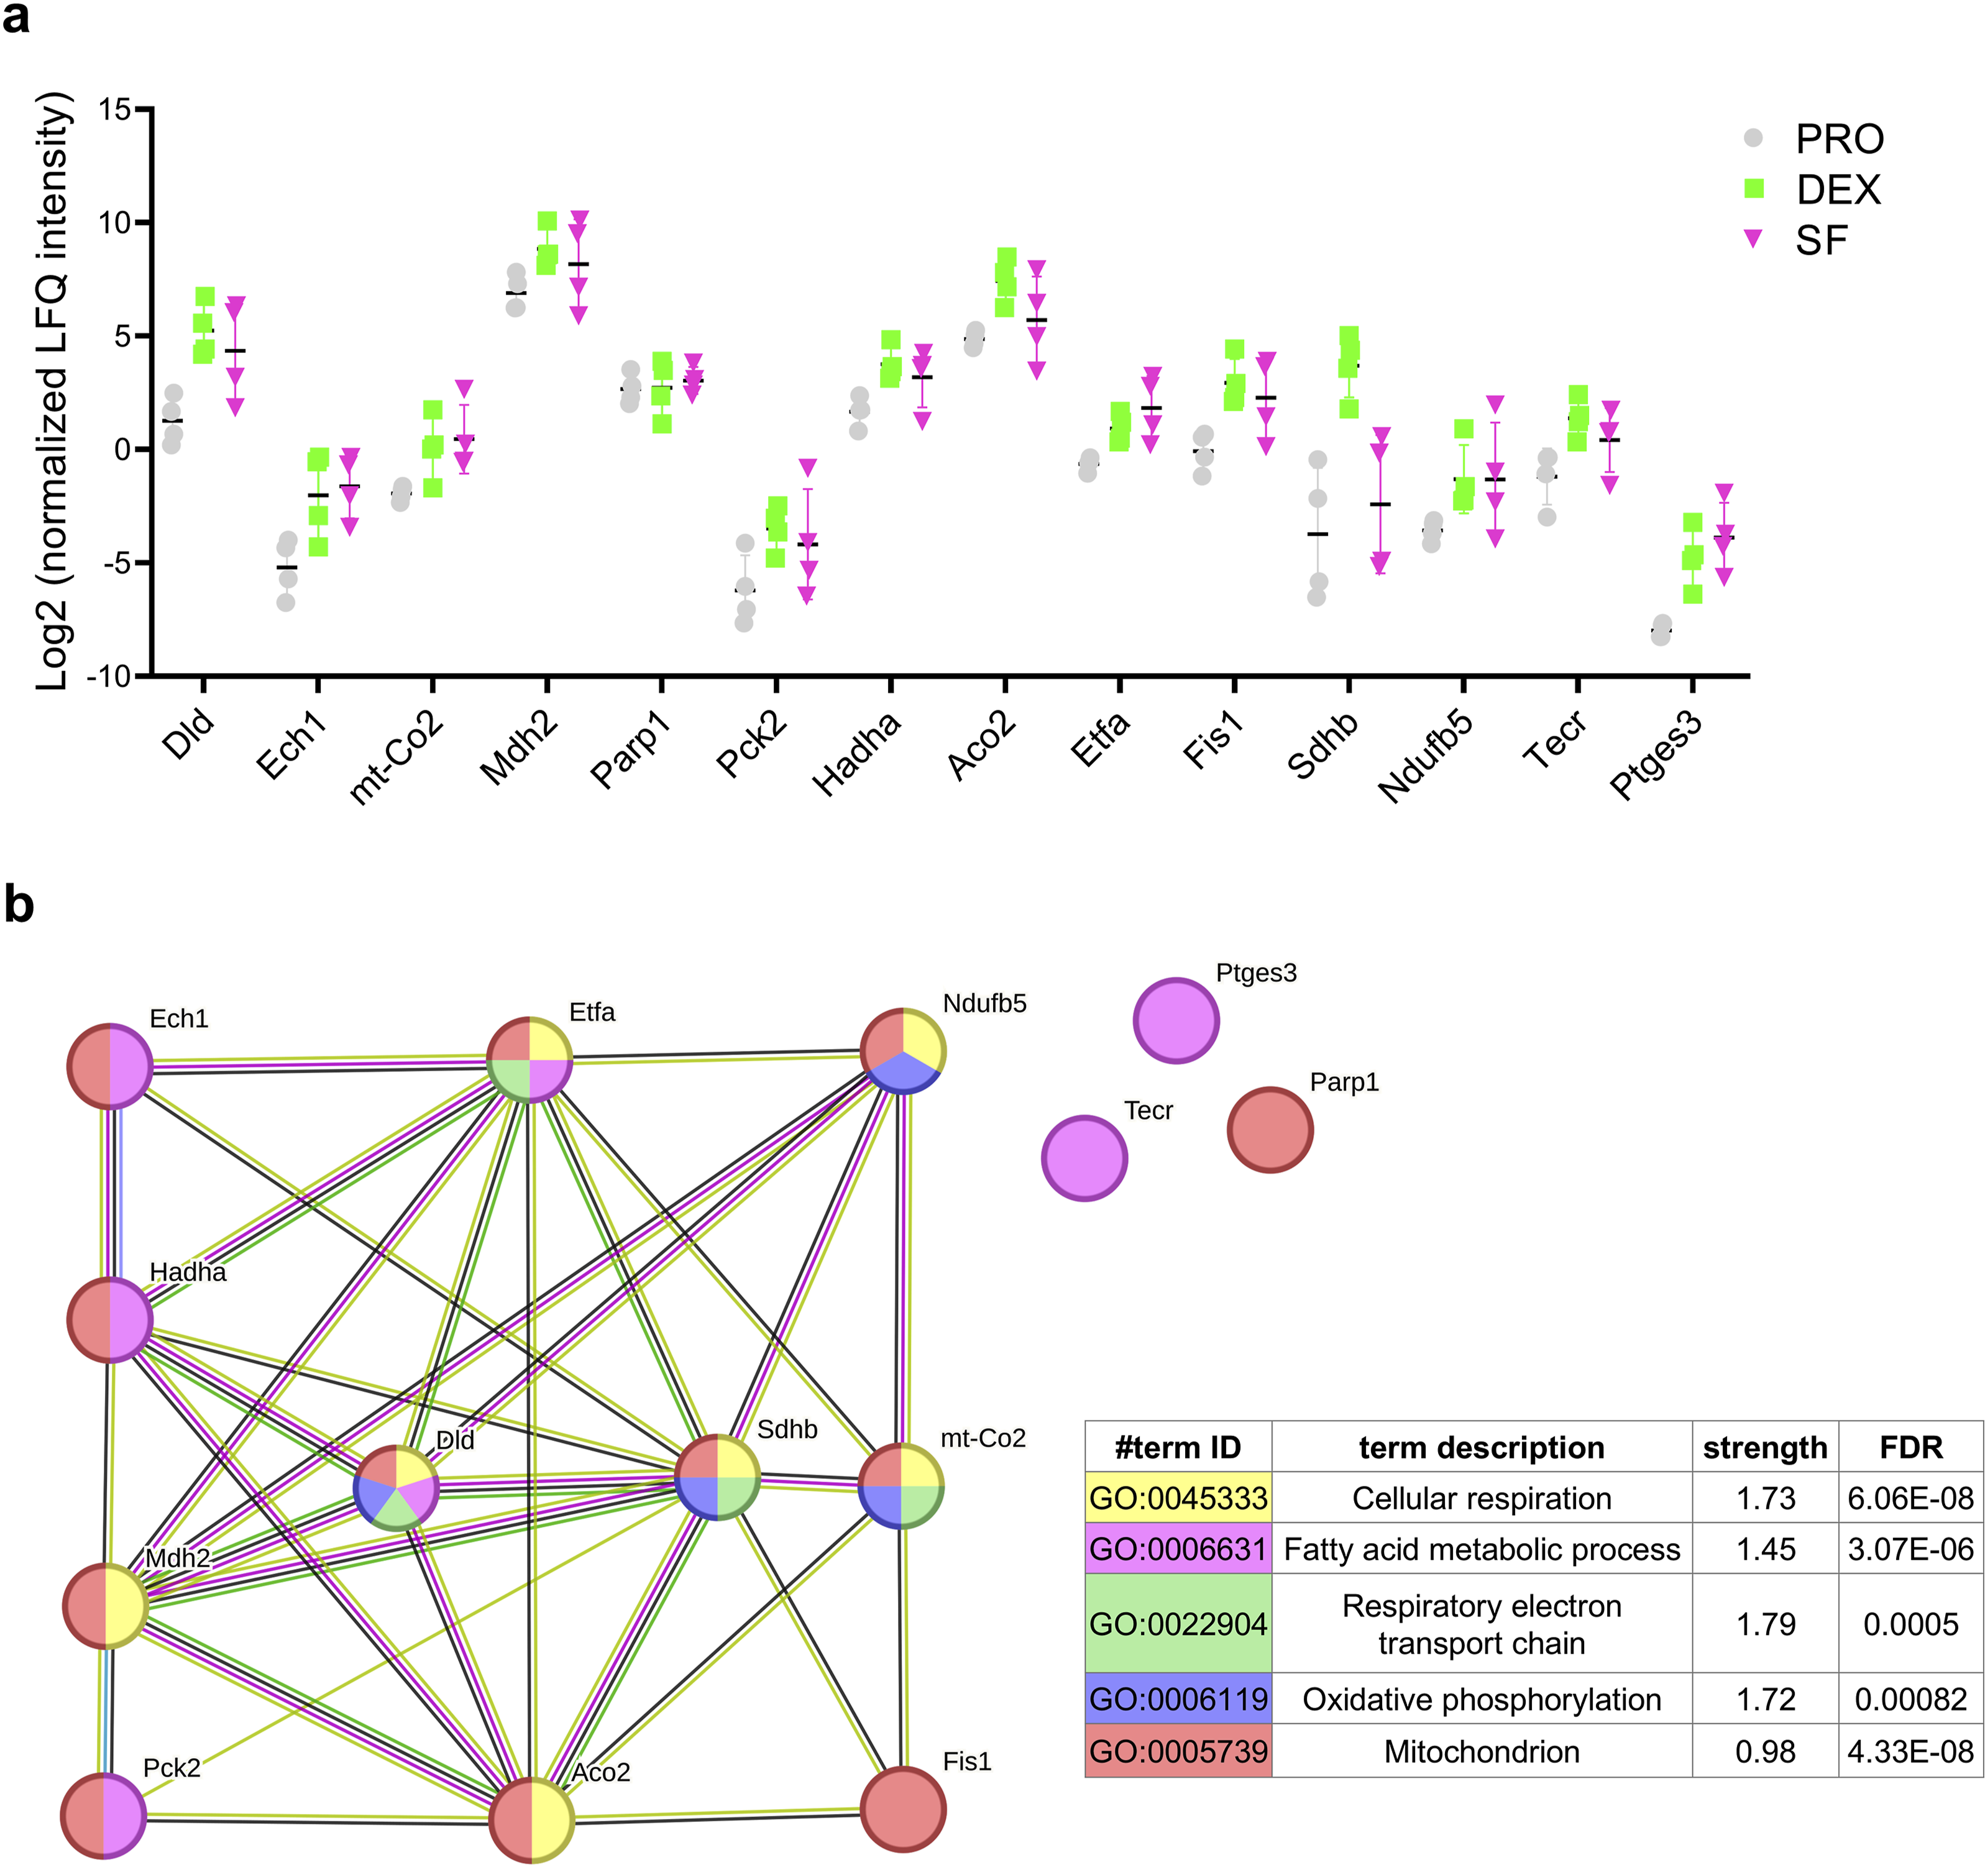
Validation of SDHB, a key DEPs associated with OXPHOS, was performed using immunoblotting (Figure 7(a)–(b)). The results demonstrated a significant upregulation of SDHB in DEX-differentiated cells, confirming the activation of oxidative phosphorylation during dexamethasone-induced neuronal differentiation. In contrast, SDHB expression was reduced in serum-free differentiated cells, which may be attributable to pronounced cell death observed after five days of differentiation under serum-free conditions (SF). To minimize potential bias arising from differential expression of housekeeping protein, particularly under SF-induced cell death, the target protein was normalized to total protein rather than a single loading control (Supplementary Fig. 5). This total protein normalization approach yielded a similar expression pattern of SDHB across experimental groups. Western blot analysis of succinate dehydrogenase [ubiquinone] iron-sulfur subunit, mitochondrial (SDHB) expression in CAD cells under different differentiation conditions. (a) Immunoblots showing SDHB protein levels in proliferating cells (PRO), dexamethasone-differentiated cells (DEX), and serum-free–differentiated cells (SF). GAPDH was used as a loading control. Each group includes three independent biological replicates (#1-3). (b) Densitometric quantification of SDHB normalized to GAPDH and expressed relative to PRO cells. Data are presented as mean ± SD (n = 3). Statistical significance was determined by one-way ANOVA with Tukey’s multiple comparison test. **P < 0.01 (vs PRO) and ### P < 0.001 (vs DEX).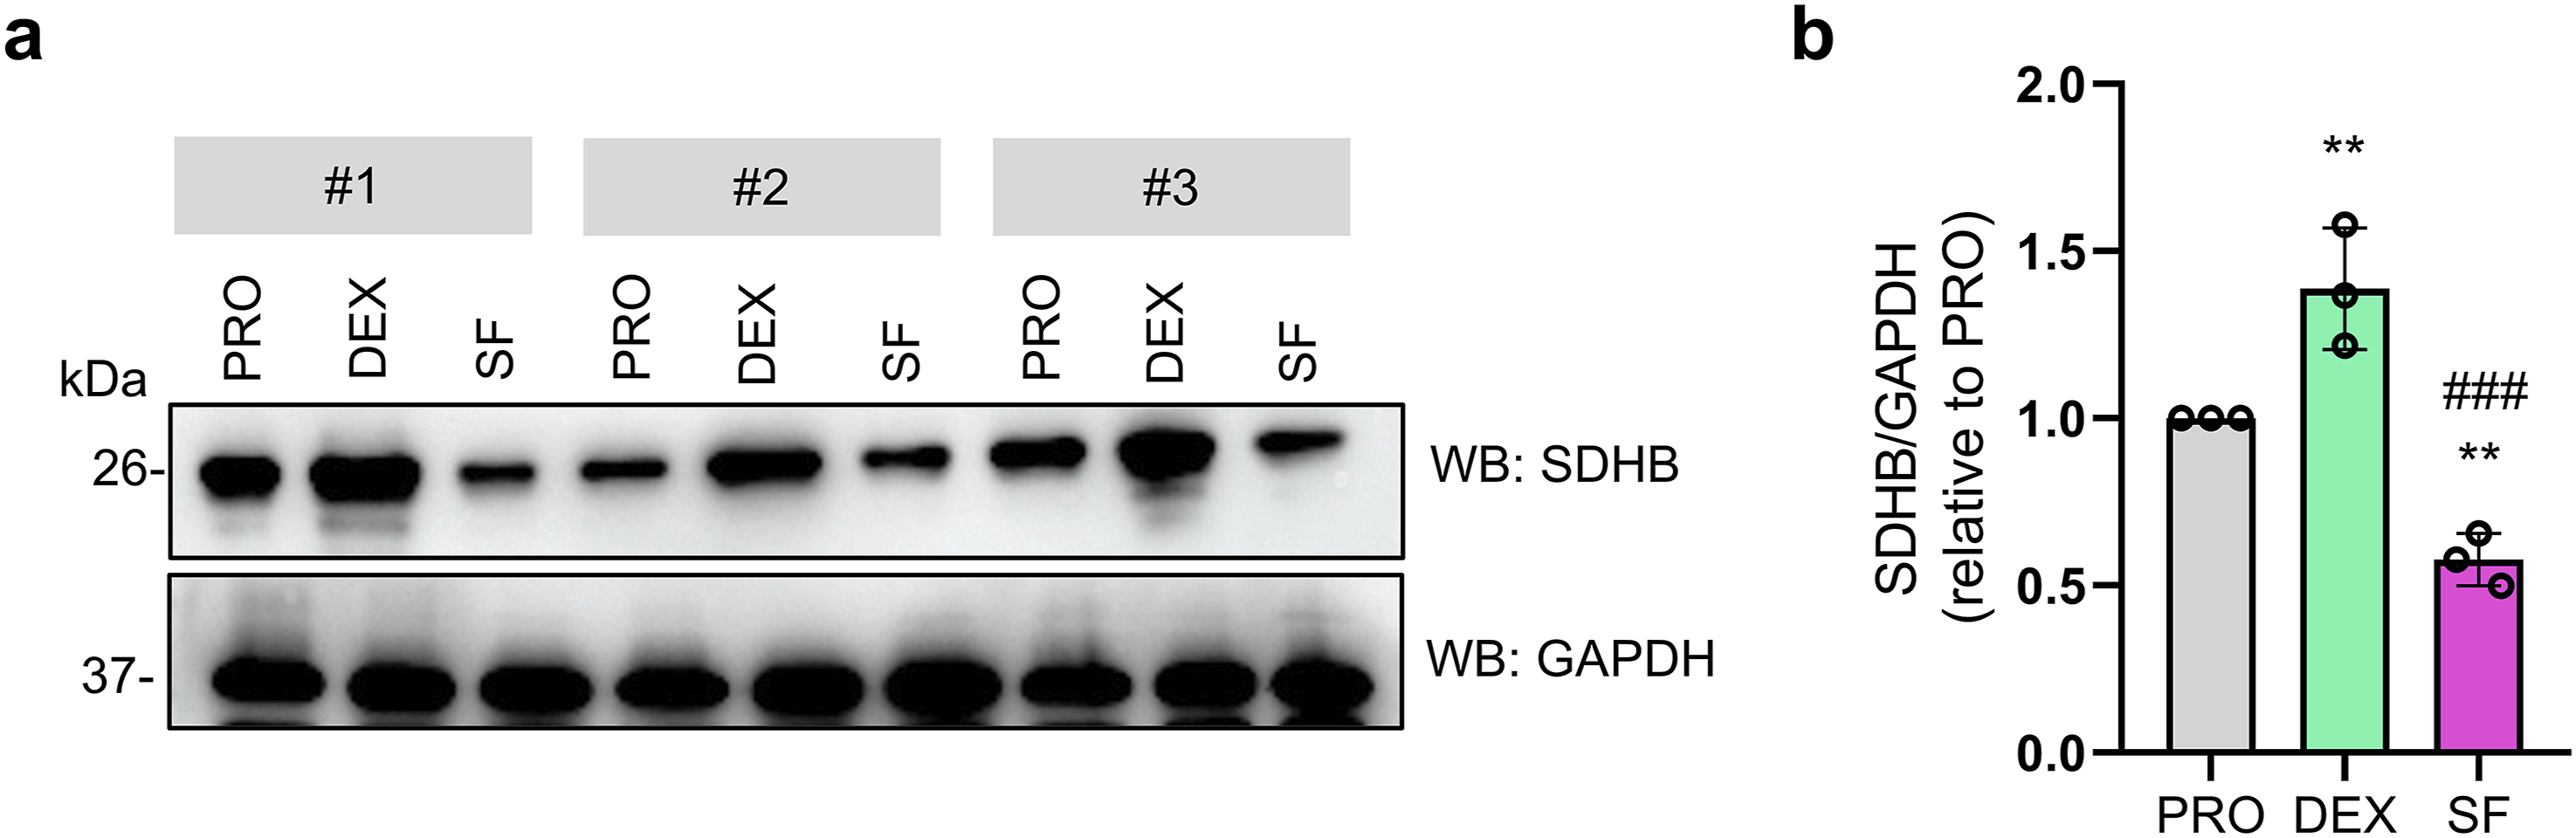
Proteins commonly expressed via the two neuronal differentiating methods play roles in mitochondrial metabolism-associated pathways
Next, we aimed to identify the list of proteins commonly expressed in the two validated differentiation protocols. The list of significant DEPs from DEX and SF was input into InteractiVenn. There are 15 upregulated and 2 downregulated proteins identified as overlapping sets of proteins in the differentiation protocols. The list of commonly expressed proteins is presented in Figure 8(a). The functional annotation (BP, MF, CC) of these proteins was performed, and the results are provided in Supplementary File 6. Interestingly, annotation of the typical upregulated genes revealed that both methods resulted in the upregulation of various BP pathways, which were further categorized into two clusters, first associated with mitochondrial metabolism, including the respiratory electron transport chain, and another cluster involving DNA repair mechanisms, such as nucleotide-excision repair and double-strand break repair (Figure 8(b)). Moreover, the results of the PPI analysis of 15 commonly upregulated proteins are shown in Figure 8(c). The data revealed the interactions of the 6 proteins. Among these, 3 proteins were associated with the electron transport chain, as annotated from UniProt keywords (KW-0249). Proteins commonly expressed in differentiated CAD cells are involved in mitochondrial metabolism-associated pathways and the DNA damage response. (a) Venn diagrams identifying the unique and overlapping sets of upregulated and downregulated proteins in two validated differentiation protocols of CAD cells. (b) A tree chart visualizes BP terms and enrichment FDRs from pathway enrichment analysis of the commonly upregulated proteins. (c) PPIs of the commonly upregulated proteins identifying the interactions of proteins associated with the electron transport chain.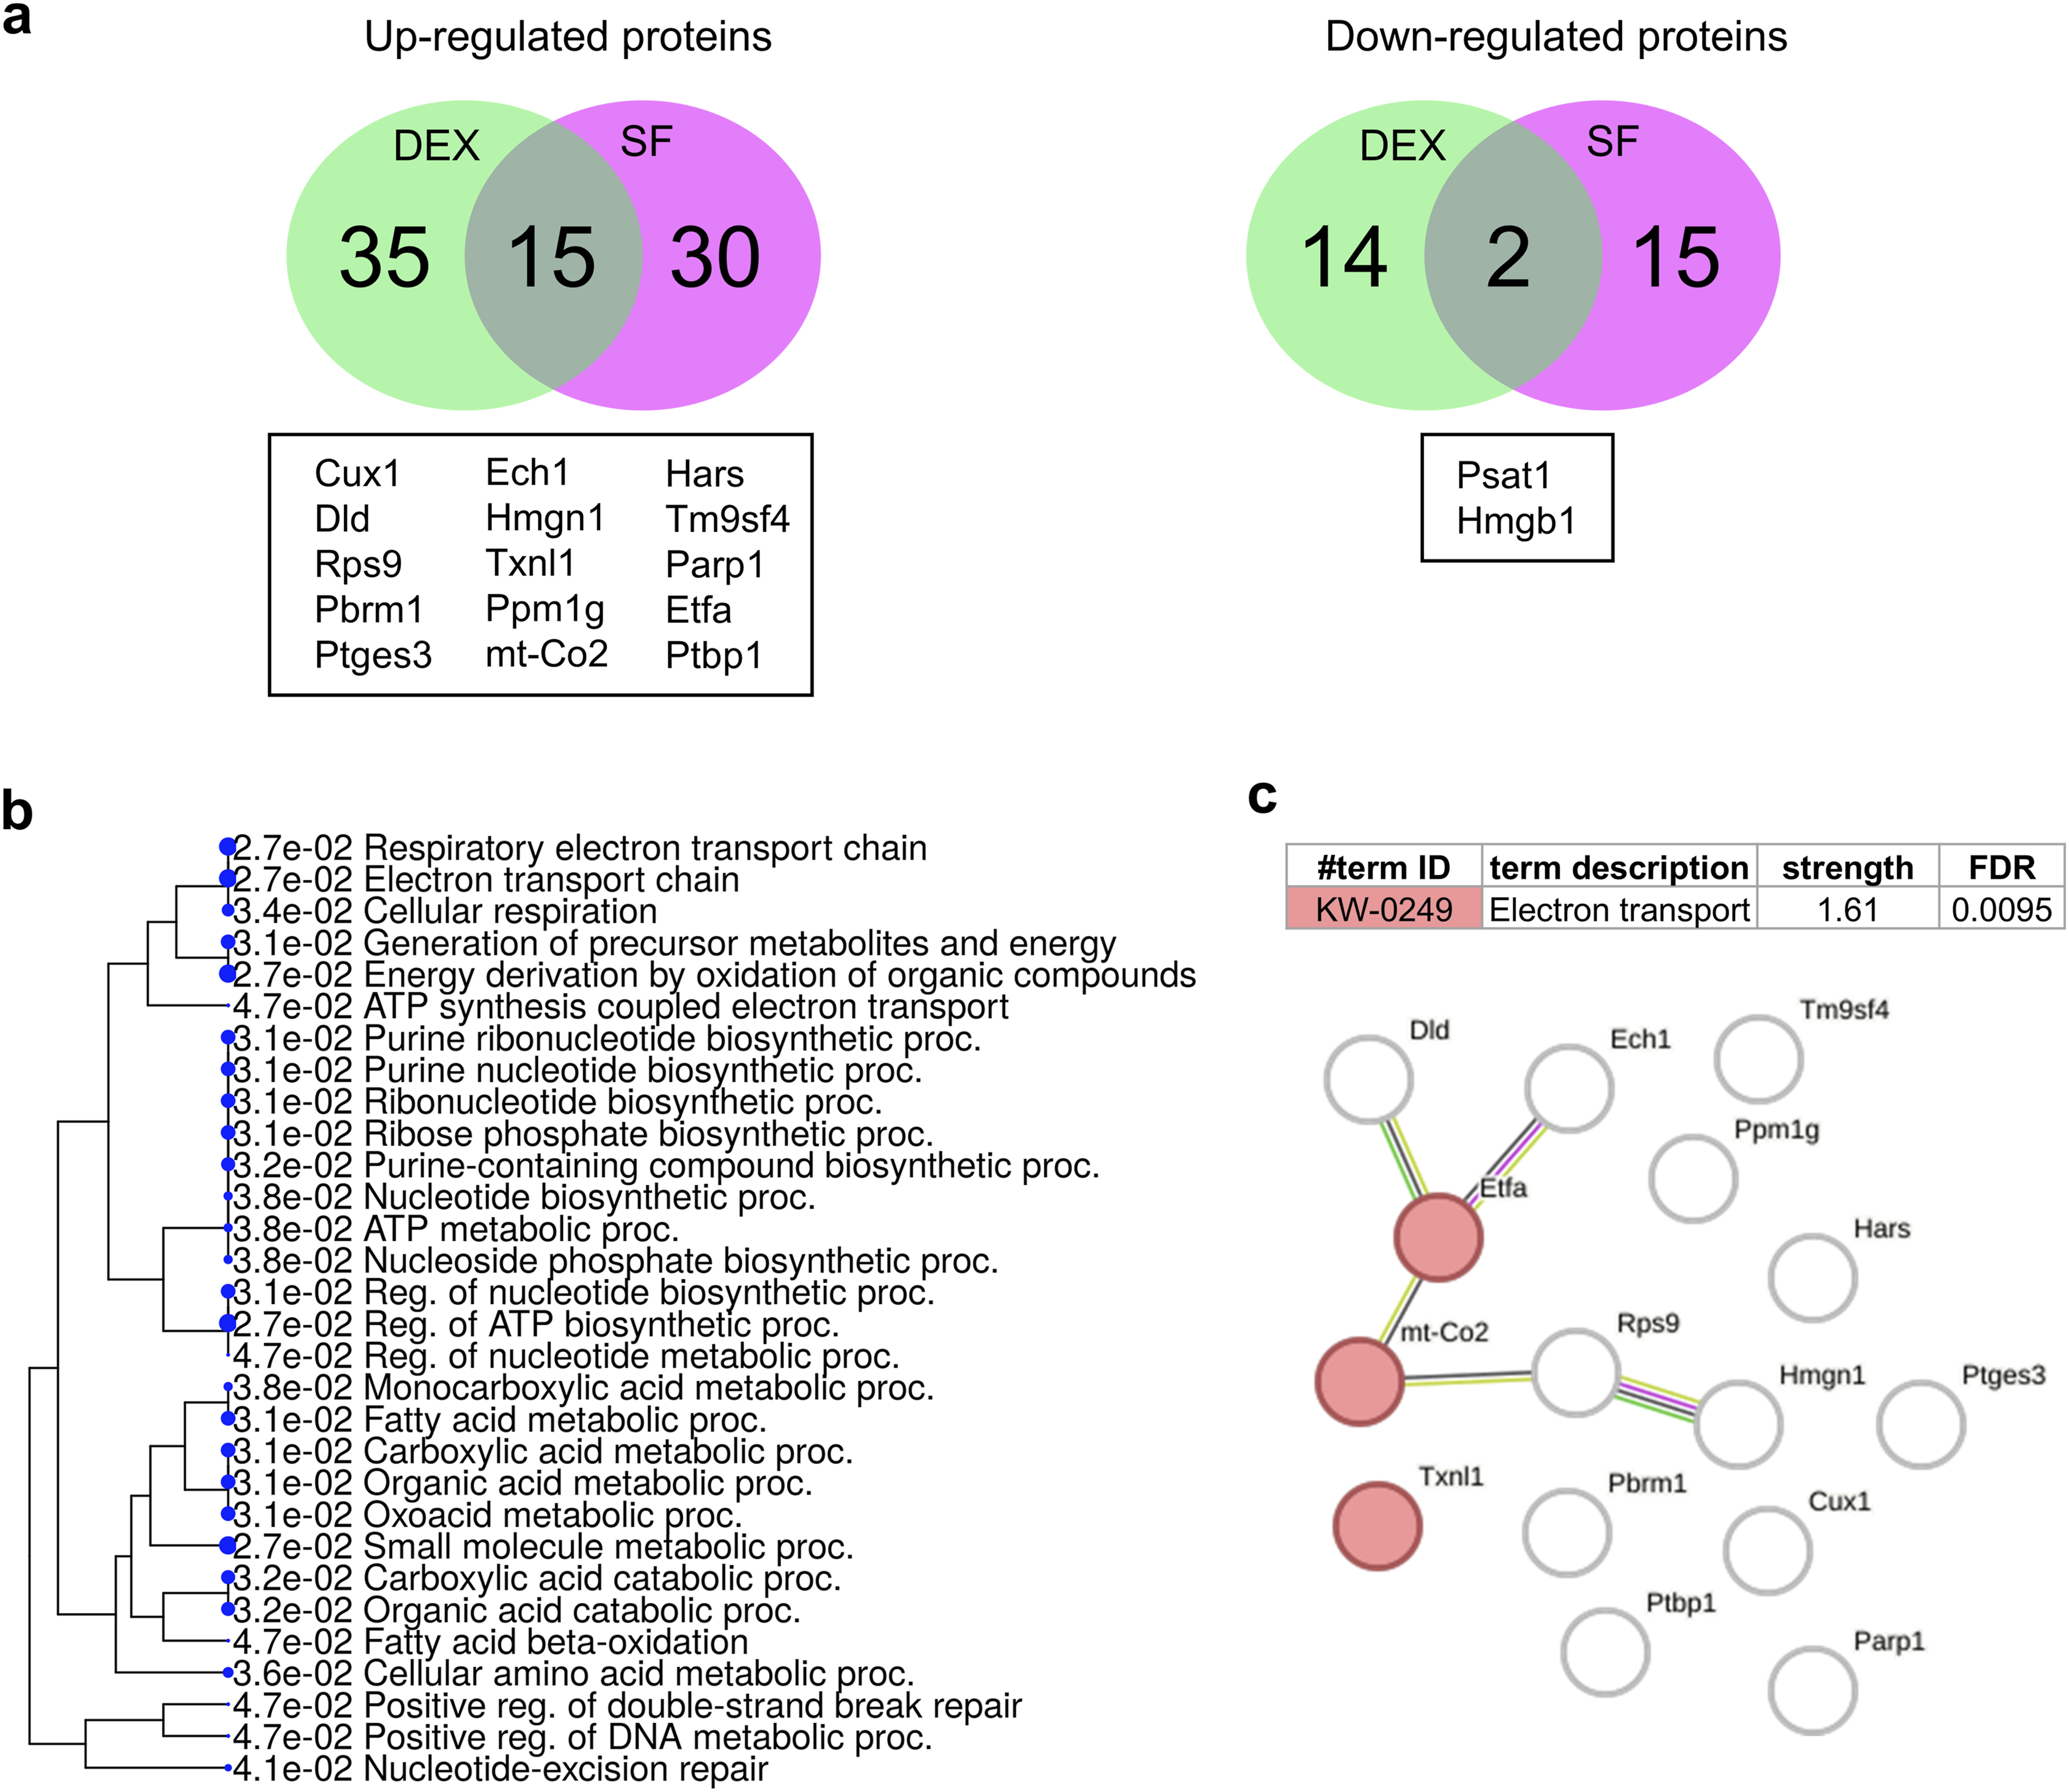
Overall, these data emphasize that mitochondrial metabolism is tightly regulated during CAD cell differentiation, in which a set of proteins functioning in the electron transport chain, OXPHOS, and DNA repair mechanisms are upregulated compared with those in the proliferating stage.
Discussion
In vitro-induced differentiation of neuronal cells is a complex process driven by underlying molecular alterations. Neuronal differentiation is closely associated with changes in cellular metabolism. Unlike rapidly dividing or immortalized cells, which rely primarily on glycolysis for energy, differentiated neurons depend highly on OXPHOS to meet their substantial bioenergetic demands.13,21 The present study applied a label-free quantitative SWATH proteomic approach to investigate the holistic aspect of protein expression in CAD during differentiation. The data revealed the upregulation of proteins involved in mitochondria-associated metabolism and OXPHOS in DEX-differentiated cells compared with those in dividing cells, highlighting the role of mitochondrial metabolic changes during the neuronal differentiation of CAD cells.
Mitochondria are central to cellular respiration and are involved in various cellular activities, including neuronal differentiation, a stress response process influenced by various environmental changes. These stressors include fluctuations in the redox state. 38 Mitochondrial respiration through OXPHOS is a proficient way for the cell to generate ATP. However, during OXPHOS via the electron transport chain (ETC), mainly reactive oxygen species (ROS) are produced. An in vivo investigation revealed increased levels of ROS in differentiating neurons. 18 Elevated ROS levels induce oxidative stress, leading to an adaptive response that can halt the cell cycle while activating pathways regulating neuronal differentiation. It has also been reported that ROS production is required for nerve growth factor-induced rat PC12 cell differentiation, which is prevented by the antioxidant N-acetylcysteine. 39 The neuronal differentiation induced in human mesenchymal stem cells has been shown to increase ROS levels. 40 Paraquat-induced ROS production can trigger the expression of differentiation markers in human NT2 neuronal cells. 19 Our preliminary test using B-27, consisting of a cocktail of antioxidants included in serum-free (SF) media, is expected to reveal improved cell death upon CAD cell differentiation. Unexpectedly, the cells actively proliferated and had no sign of differentiation, similar to those maintained in high-serum media (Supplementary Fig. 6). Therefore, it seems that differentiation processes in CAD cells require an optimal level of oxidative stress. These findings from several in vitro approaches support the role of the redox state in neuronal differentiation.
Glucocorticoids exert their cellular effects predominantly through activation of the glucocorticoid receptor (GR), a ligand-dependent transcription factor that regulates gene networks involved in cell fate determination, metabolism, and stress responses. In the nervous system, GR signaling has been shown to influence neuronal proliferation, cell cycle exit, neurite outgrowth, and maturation.41–43 Collectively, these findings position glucocorticoids as active regulators of neuronal differentiation rather than merely passive mediators of systemic stress responses. DEX, a potent synthetic glucocorticoid, has been employed to induce neuronal differentiation in CAD cells. 2 Despite these observations, the downstream metabolic adaptations accompanying glucocorticoid-driven neuronal differentiation have remained insufficiently explored. The present proteomic data provide evidence that DEX-induced differentiation is accompanied by coordinated remodeling of mitochondrial metabolic pathways, suggesting that metabolic reprogramming is a fundamental component of glucocorticoid-mediated neuronal differentiation. Emerging evidence indicates that steroid hormones can directly regulate mitochondrial function through both transcriptional and non-genomic mechanisms. GR activation has been reported to modulate the expression of nuclear-encoded mitochondrial genes, including components of the electron transport chain, regulators of mitochondrial biogenesis, and enzymes involved in redox homeostasis.44–46 In addition, GR has been detected within mitochondria, where it can interact with mitochondrial DNA and influence respiratory activity. 47 In this context, the upregulation of oxidative phosphorylation–related proteins observed in DEX-differentiated CAD cells supports the concept that glucocorticoid signaling actively promotes a metabolic shift. Such a shift is consistent with the high energetic requirements of differentiated neurons and aligns with developmental paradigms in which neuronal maturation is coupled to enhanced mitochondrial capacity and respiratory efficiency.48,49
Mitochondrial metabolism itself is increasingly recognized as an instructive regulator of neuronal differentiation. Enhanced oxidative phosphorylation alters intracellular ATP levels, redox balance, and metabolite availability, all of which can modulate signaling cascades and epigenetic mechanisms governing neuronal lineage commitment.13,21,50 Notably, increased expression of mitochondrial genes and proteins involved in OXPHOS were found in induced pluripotent stem cells, supporting that mitochondrial remodeling is an essential process during neuronal differentiation.51,52 Glucocorticoid–induced metabolic remodeling may therefore function as a permissive signal that reinforces neuronal differentiation programs. In particular, controlled increases in mitochondrial activity and ROS generation have been shown to act as signaling cues that promote neuronal differentiation and neurite extension when maintained within a physiological range. 53 Thus, the proteomic changes identified in this study suggest a mechanistic link whereby DEX-activated GR signaling interfaces with mitochondrial metabolism to support neuronal differentiation. Collectively, these findings support a model in which DEX modulates neuronal differentiation through regulation of mitochondrial metabolic function. This study advances the understanding of how hormonal signaling and cellular metabolism converge to shape neuronal differentiation outcomes.
According to our proteomic analysis, most DEPs are localized in the mitochondria. The upregulation of proteins involved in mitochondrial metabolism and OXPHOS underscores the pivotal role of mitochondria-mediated mechanisms in regulating CAD cell differentiation. The data correspond to observations on the differentiation process of neuroblastoma SH-SY5Y cells. 27 Increased expression levels of mitochondrial proteins were observed in the retinoic acid-induced differentiation of SH-SY5Y cells, although a complete proteomic analysis was lacking in this study. The two-dimensional gel electrophoresis–based proteomics coupled with MALDI-TOF mass spectrometry of human embryonic stem cell differentiation revealed the upregulation of proteins associated with redox homeostasis and metabolic processes, including peroxiredoxins and NADH-ubiquinone oxidoreductase. 20 Overall, the greater abundance of proteins involved in mitochondrial metabolism underscores the critical role of cellular energy reprogramming during neuronal differentiation. However, further studies are needed to identify the precise molecular mechanisms that govern the transition from the proliferative to the differentiated stage in CAD cells.
Various redox-sensitive molecules are upregulated during DEX-induced CAD cell differentiation. Succinate dehydrogenase (SDH), a complex II or succinate/quinone oxidoreductase, is a crucial component of the electron transport chain. The upregulation of subunit B (Q9CQA3, SDHB) suggests the essentiality of the energy-producing process during DEX-induced neuronal differentiation. These data support previous evidence demonstrating increased expression of SHDB upon in vitro terminal differentiation of cortical neurons. 13 Peroxiredoxin 6 (O08709, PRDX6) belongs to an antioxidant enzyme family. Elevated levels of PRDX6 contribute to the neuronal differentiation of human embryonic stem cells by preventing damage caused by oxidative stress and causing metabolic shifts during neuronal differentiation. 20 As shown in our proteomic study, the upregulation of PRDX6 was observed in DEX-induced CAD cell differentiation, possibly to control the cellular redox environment.
Neuronal differentiation is a stress-induced mechanism. The DNA damage response (DDR) is another regulator that plays a role in terminally differentiated neurons and is regulated tightly via various DNA repair mechanisms. One is ATM (ataxia-telangiectasia mutated), an activated central protein kinase that helps repair DNA and maintain genome stability. Studies have demonstrated that ATM kinase is upregulated during in vitro neuronal stem cell differentiation to mediate the DDR.54–56 The increased expression of eukaryotic translation elongation factor 1 epsilon-1 (Q9D1M4, MCA3) (Figure 4(a)), a positive modulator of the ATM response to DNA damage, supports the idea that the DDR mediates DEX-induced neuronal differentiation. Furthermore, a prominent morphological hallmark of CAD cell differentiation is cell cycle arrest, a characteristic feature of cellular senescence. This process involves a complex interplay of various molecular factors, including HMGB1 (high mobility group box 1).57,58 These findings suggest that HMGB1 acts as an oncogene, which is supported by evidence that high levels of HMGB1 are expressed in tumor cell lines and tumors. 59 HMGB1 depletion in fibroblasts results in senescence, which is characterized by permanent growth arrest. 60 Our data revealed that HMGB1 is a commonly downregulated protein in both differentiation protocols and underlies the induction of cell cycle arrest. However, the role of HMGB1 in neuronal differentiation remains unclear. Further investigations are needed to determine whether HMGB1 depletion in CAD cells can directly induce neuronal differentiation.
The findings of this study are the first to highlight the proteomic signature and elucidate the key molecular pathways altered during DEX-induced neuronal differentiation in mouse brain-derived CAD cells. In addition to changes in cellular morphology, the identified list of DEPs could serve as molecular markers representing the metabolic shifts associated with induced neuronal differentiation in CAD cells. Lastly, although less frequently used than stem cell–based systems, CAD cells are of CNS origin and have been validated for neuronal differentiation studies.1,7–9 A key finding of this study was the identification of biologically relevant alterations in mitochondrial metabolism and oxidative phosphorylation during CAD cell differentiation, which are consistent with established features of neuronal maturation. Nevertheless, it should be acknowledged that immortalized cell lines may not fully recapitulate the molecular and functional characteristics of normal, mature neurons, and therefore may provide information that differs from differentiation processes occurring in primary or stem cell–derived neuronal models. Accordingly, functional validation of mitochondrial activity was not performed in this study, and the conclusions are based primarily on changes in protein expression levels. Direct measurements such as intracellular ATP levels, oxygen consumption rate (OCR), or extracellular flux analysis would be valuable to further substantiate the observed alterations in mitochondrial function.
Supplemental Material
Supplemental Material - Proteomic profiling reveals mitochondrial metabolic alterations in dexamethasone-induced neuronal differentiation
Supplemental Material for Proteomic profiling reveals mitochondrial metabolic alterations in dexamethasone-induced neuronal differentiation by Ekkaphot Khongkla, Jaturon Kwanthongdee, Banthit Chetsawang in Science Progress
Footnotes
Acknowledgments
We acknowledge Yodying Yingchutrakul from the National Omics Center, National Science and Technology Development Agency, Thailand, for his valuable assistance and expertise in proteomic services and analysis.

Authors’ contributions
EK designed all the experiments, prepared the samples, and conducted the data analysis and interpretation. JK performed immunocytochemistry and image visualization. BC assisted for conceptualization. EK and BC contributed to writing the manuscript and approved the final version.
Funding
The study was supported by the Graduate Program in Neuroscience, Institute of Molecular Biosciences, Mahidol University.
Declaration of conflicting interests
The authors declared no potential conflicts of interest with respect to the research, authorship, and/or publication of this article.
Data Availability Statement
All data supporting the findings of this study are provided within the article and its supplementary information files. The raw data from the MS proteomic analysis have been deposited in the MassIVE public repository under the accession number MSV000098332.
Declaration of generative AI and AI-assisted technologies in the writing process
This manuscript was prepared with the assistance of generative AI and AI-assisted technologies to improve its clarity, grammar, and overall readability. The tools utilized included Grammarly, and Curie which are employed for language editing and text generation.
Supplemental material
Supplemental material for this article is available online.
Appendix
References
Supplementary Material
Please find the following supplemental material available below.
For Open Access articles published under a Creative Commons License, all supplemental material carries the same license as the article it is associated with.
For non-Open Access articles published, all supplemental material carries a non-exclusive license, and permission requests for re-use of supplemental material or any part of supplemental material shall be sent directly to the copyright owner as specified in the copyright notice associated with the article.
