
Abstract
Objective
This study aimed to identify valuable quantitative plaque parameters and adverse vascular geometric features for constructing a diagnostic model to improve culprit vessel identification in Non-ST segment elevation acute coronary syndrome (NSTE-ACS).
Methods
Data from 144 consecutive NSTE-ACS patients who underwent both Coronary CT angiography (CCTA) and invasive coronary angiography (ICA) were retrospectively analyzed. Coronary geometric characteristics and quantitative plaque parameters were derived from CCTA data. Patients were randomly split into training and validation sets at a 7:3 ratio. Using logistic regression and stepwise regression, three models were developed: (I) diameter stenosis + high-risk plaque (HRP); (II) Model I + quantitative plaque parameters; (III) Model II + adverse geometric characteristics (AGCs). The optimal model was selected by comparing the areas under the receiver operating characteristic curves (AUC), and nomograms with calibration and decision curves were generated.
Results
The results demonstrated that the multivariable logistic regression model integrating diameter stenosis, HRP, quantitative plaque parameters, and AGCs exhibited excellent diagnostic performance, with AUCs of 0.95 and 0.92 in the training and validation sets, respectively. Decision curve analysis confirmed the model’s net benefit across threshold probabilities, demonstrating its clinical utility.
Conclusions
This CCTA-based model showed high predictive capability, further enhanced by incorporating vascular geometric features, offering a clinically valuable tool for the precise identification of culprit lesions in NSTE-ACS.
Keywords
1. Introduction
Non-ST segment elevation acute coronary syndrome (NSTE-ACS) encompasses unstable angina (UA) and non-ST segment elevation myocardial infarction (NSTEMI). The clinical manifestations often include pain, pressure, heaviness, or a burning sensation, among other symptoms.1,2 In some patients, the electrocardiogram (ECG) may reveal only transient ST-segment elevation, sustained or transient ST-segment depression, T wave inversion, flat T waves, or T wave pseudonormalization; in some cases, the ECG may appear normal, which complicates reliance on this traditional examination alone. 3 In patients with multiple coronary artery disease, the overlapping blood supply areas further complicate the diagnosis of the culprit lesion, thereby impacting the patient’s long-term prognosis.4,5 Additionally, high-sensitivity troponin (hs-cTn) concentrations, whether in the presence or absence of myocardial infarction, can be influenced by baseline differences in age, gender, renal insufficiency, and the onset time of chest pain 1. Although elevated hs-cTn levels indicate myocardial damage, their ability to localize the affected coronary arteries is limited,1,3 and there are also constraints in accurately identifying the culprit lesions.
Near-infrared spectroscopy, intravascular ultrasound, and optical coherence tomography (OCT) are advanced technologies currently employed to identify the characteristics of coronary artery lesions, providing high-resolution information on plaque characteristics and vessel wall structure.6–9 However, these methods are invasive, costly in terms of equipment, complex to operate, and require high levels of clinical expertise, which limits their widespread adoption in routine clinical practice.9,10 Despite being the gold standard for guiding treatment in NSTE-ACS, invasive coronary angiography (ICA) is limited by its invasive nature, associated procedural risks, and its inability to provide information on plaque composition. 11
Coronary CT angiography (CCTA) is a non-invasive imaging technology that provides detailed visualization of the coronary artery anatomy, including the degree of vessel stenosis, plaque distribution, and plaque composition. This information serves as a foundation for identifying potentially high-risk vulnerable plaques and assessing the condition of patients with NSTE-ACS.12–15 Studies have shown that plaque location and vessel geometry are closely related to the occurrence of acute coronary syndrome, with the number of adverse geometric characteristics (AGCs) providing incremental value for identifying precursors to culprit lesions.16–18 This study aims to integrate CCTA-derived plaque characteristics with vessel geometric morphological features to construct and validate an auxiliary diagnostic model for identifying culprit lesions in NSTE-ACS. The research focuses on enhancing the efficiency of culprit lesion identification, providing a scientific basis for optimizing individualized treatment strategies, and further promoting the adoption and application of CCTA in clinical practice.
2. Materials and methods
2.1. Research population
This retrospective study included consecutive patients diagnosed with NSTE-ACS who underwent CCTA and ICA measurements at The First Affiliated Hospital of Jinzhou Medical University between March 2018 and June 2024. The inclusion criteria are as follows: (1) Participants must be 18 years of age or older; (2) The culprit lesion must be located in one of the three main coronary vessels; (3) Patients with multivessel disease must have a clearly identified culprit lesion; (4) Only one culprit lesion is permitted per vessel; (5) Complete data from both CCTA and ICA must be provided. The exclusion criteria were: (1) Age < 18 years; (2) Interval between CCTA and ICA examinations > 7 days; (3) History of myocardial infarction or coronary revascularization; (4) Presence of coronary artery aneurysm or coronary artery dissection; (5) Myocardial ischemia caused by coronary artery malformation or abnormal coronary artery development; (6) Multiple culprit lesions in each vessel; (7) Due to the differences in anatomical structure, blood supply range, and the reliability of CCTA assessment between left main trunk lesions and side branch lesions with a diameter of less than 1.5 mm compared to lesions in the three major branches of the coronary arteries, this study excludes them to avoid potential inconsistencies in vascular level analysis. (8) Poor image quality of CCTA, insufficient for analysis; (9) Severe hepatic or renal insufficiency; (10) Presence of autoimmune diseases such as systemic lupus erythematosus, multiple sclerosis, or scleroderma. This study was conducted in accordance with the Declaration of Helsinki established in 1975 and revised in 2024. All data have been de-identified to protect patient privacy. This study adheres to the STROBE guideline
19
and is classified as a retrospective study, approved by the Ethics Committee of the First Affiliated Hospital of Jinzhou Medical University (Ethics Number: KYLL-202444, retrospectively registration, Registration Time: April 1, 2024), and has been exempted from obtaining written informed consent. The detailed process of patient screening and data collection is illustrated in Figure 1. Case screening flowchart. CCTA, coronary computed tomography angiography; ICA, invasive coronary angiography.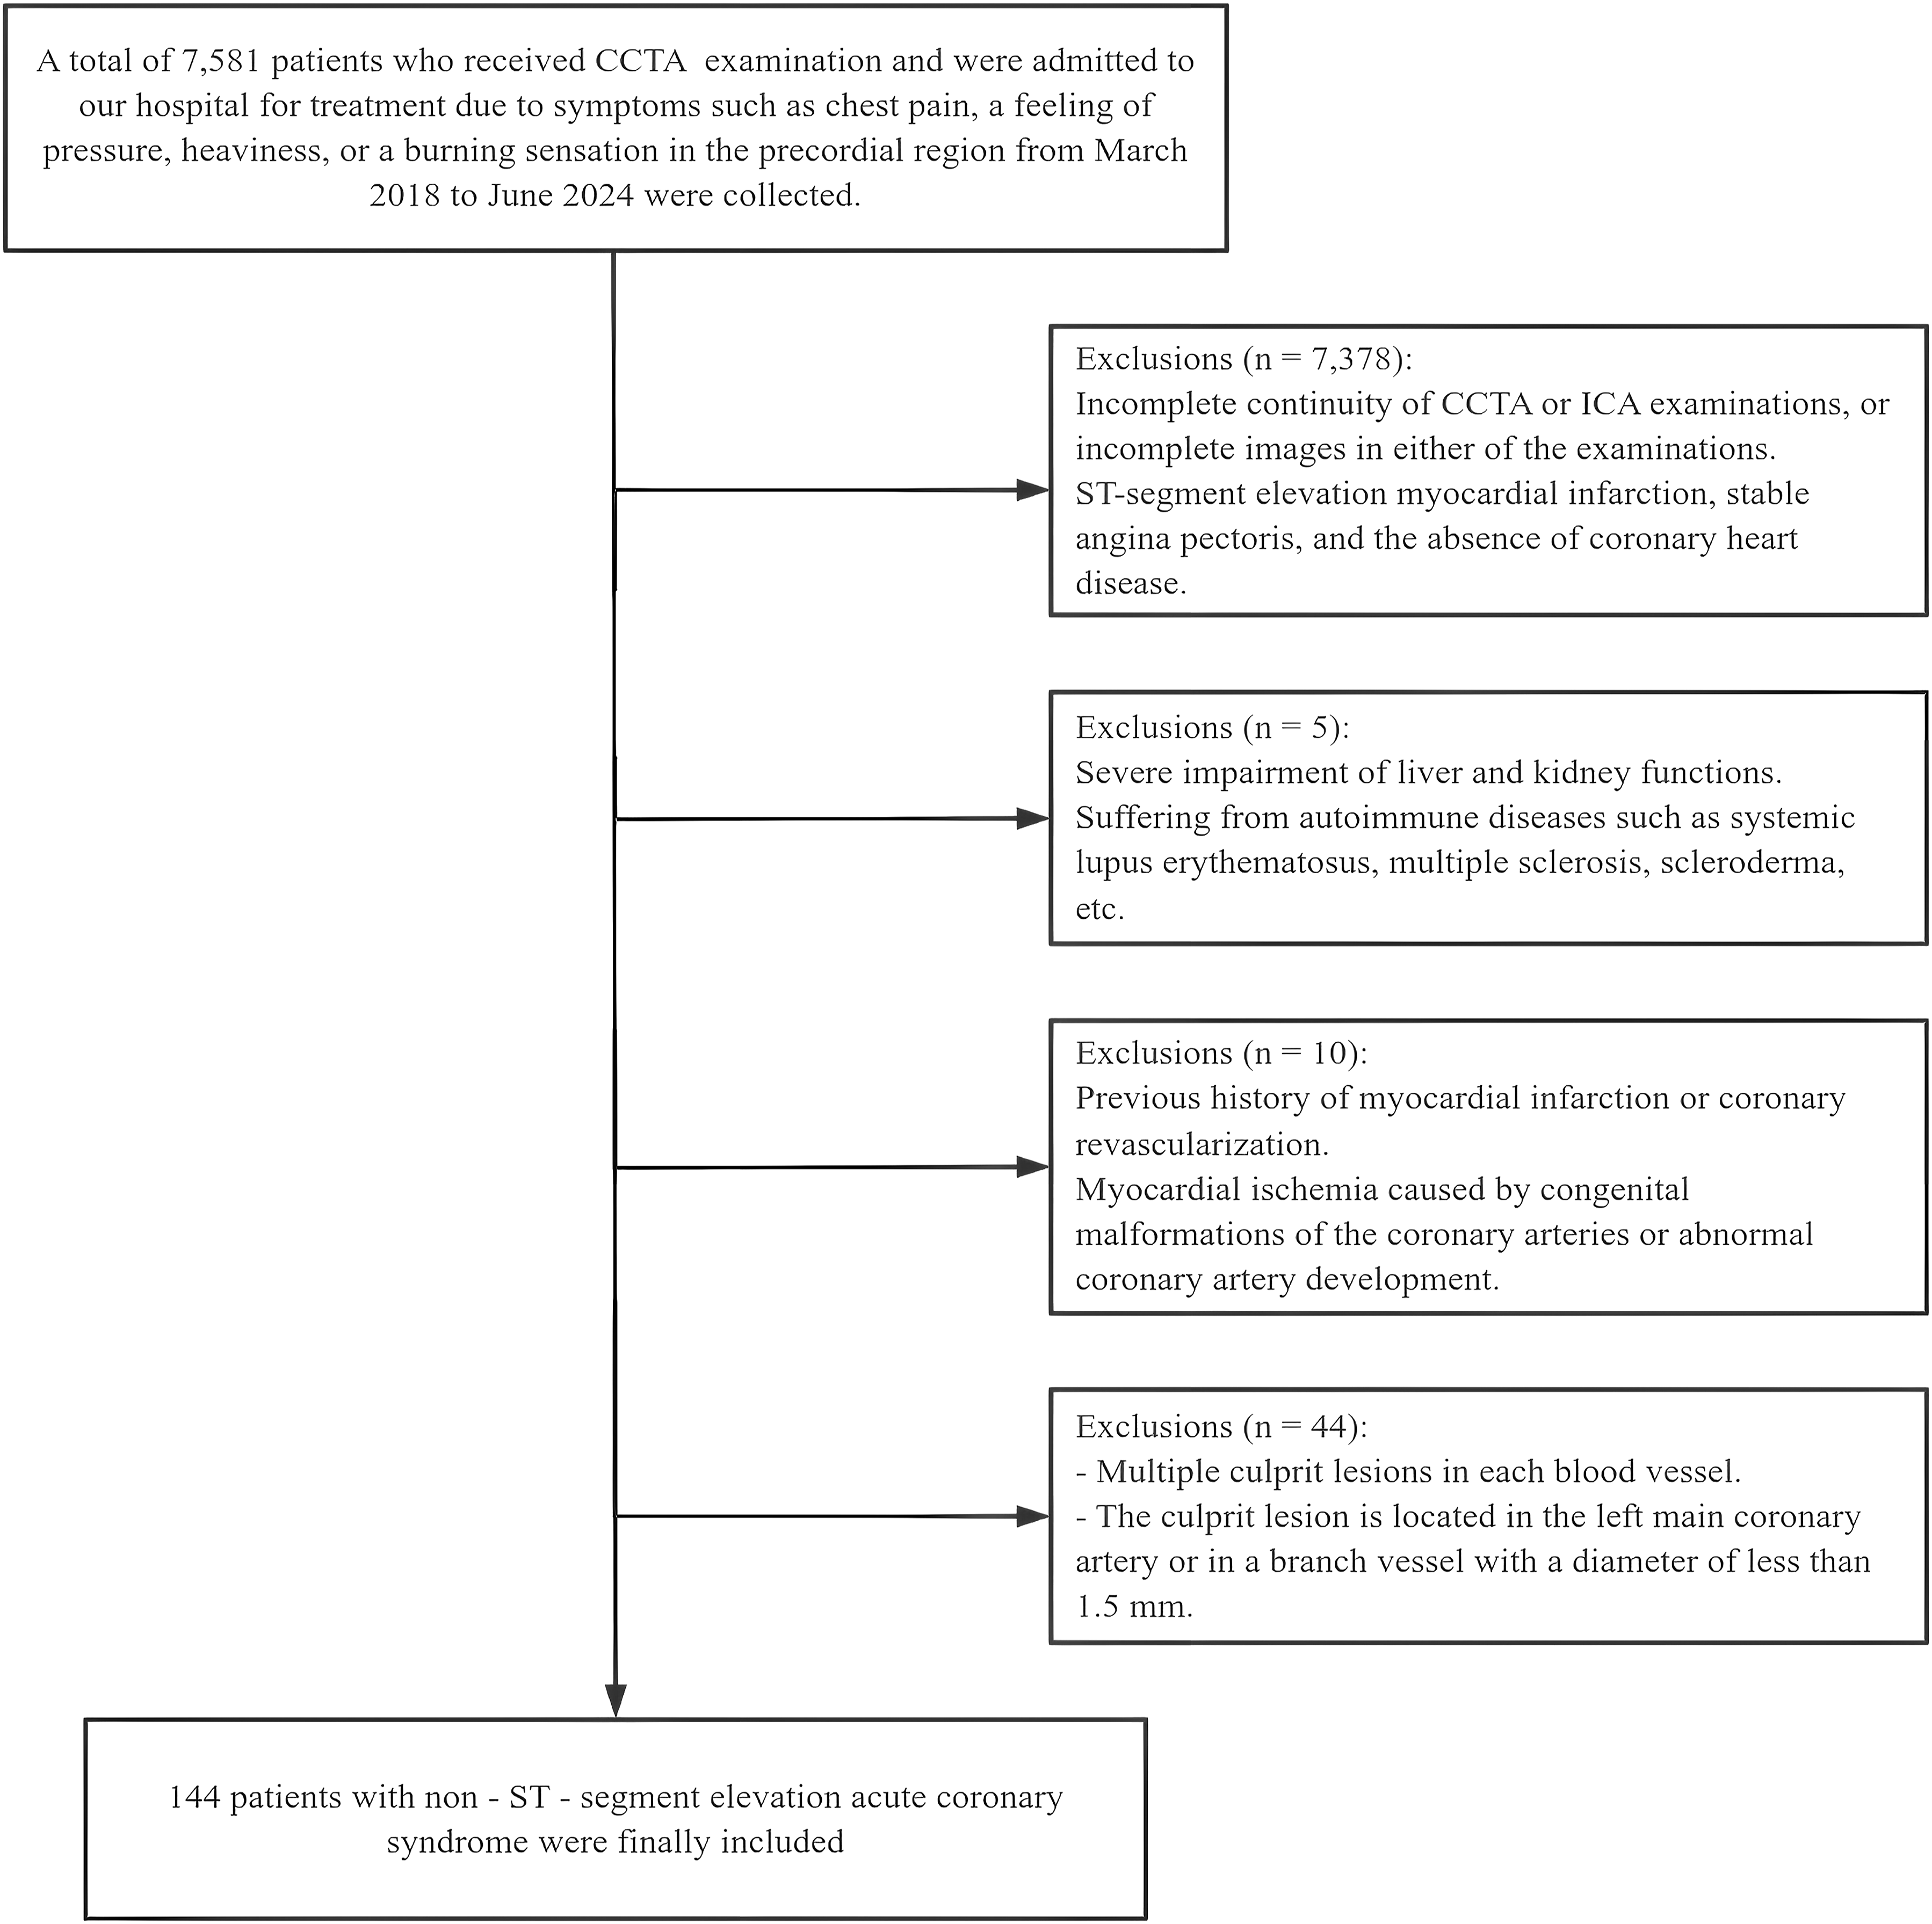
2.2. CCTA scanning method
The Philips 256 iCT was utilized with the following scanning parameters: slice thickness of 1 mm, a matrix size of 512×512, a tube voltage of 120 kV, and a tube current of 250 mAs or automatic mAs. Initially, a cardiac localization scan was conducted, with the scanning range extending from the level of the carina to the diaphragmatic surface below the heart. The root of the ascending aorta was designated as the tracking point, and the scan was initiated when the CT value of this tracking point reached 100-150 HU, with flexible adjustments made based on individual patient differences and the conditions of the contrast agent. A non-ionic contrast agent, iopamidol (concentration: 370 mg/ml), was injected at a rate of 1.1 ml/kg through the antecubital vein at a speed of 5.0 to 5.5 ml/s, followed by an injection of 40 ml of 0.9% saline to reduce beam hardening artifacts and optimize image quality. Patients were instructed to hold their breath after a resting inhalation, and the scan progressed from the feet to the head. The collected CCTA data was transmitted to the Philips CT workstation (Extended Brilliance Workspace, EBW 4.5), where post-processing is performed using the coronary analysis software (Comprehensive Cardiac Analysis, CCA), which includes volume rendering (VR) and curved planar reformation (CPR) images.
2.3. AGC feature analysis
The AGCs of coronary arteries were analyzed using the Philips workstation Post-processing software. This analysis included the following indicators
18
: (1) The position of the plaque relative to the coronary sinus opening, measured as the distance from the coronary sinus opening to the lesion (maximum diameter stenosis) in millimeters (mm). The median distance was used as a boundary to classify the lesions into categories based on proximity to the opening (LAD = 34.80 mm, LCX = 37.80 mm, RCA = 41.30 mm). The two sets of measured values for the position of the plaque from the coronary sinus opening demonstrated a high level of consistency following the consistency testing. Consequently, the final result was determined as the average of the two measurements. (2) The presence of collateral origin within the lesion, defined as the existence of the lesion at the bifurcation site where the collateral vessel originates. (3) The location of the lesion in a tortuous blood vessel, defined as a lesion present in a bend of ≥90° or in three consecutive bends of ≥45°. (4) The assessment of AGCs ≥ 2, evaluated based on the number of the aforementioned characteristics present in the lesion. The analysis of all geometric features was conducted independently by two experienced radiologists. In the event of a disagreement, a radiologist with over 20 years of experience was consulted for review. The measurement diagram is presented in Figure 2. Schematic illustration of measuring AGCs. (a) Depicts the measurement of the distance between the plaque and the opening of the coronary sinus; (b) Indicates the origin of the collateral branch of the lesion, as highlighted by the arrow; (c) Demonstrates that the lesion is located within a tortuosity of ≥90°; (d) Shows that the lesion is present in three consecutive tortuous blood vessels, each with a tortuosity of ≥45°.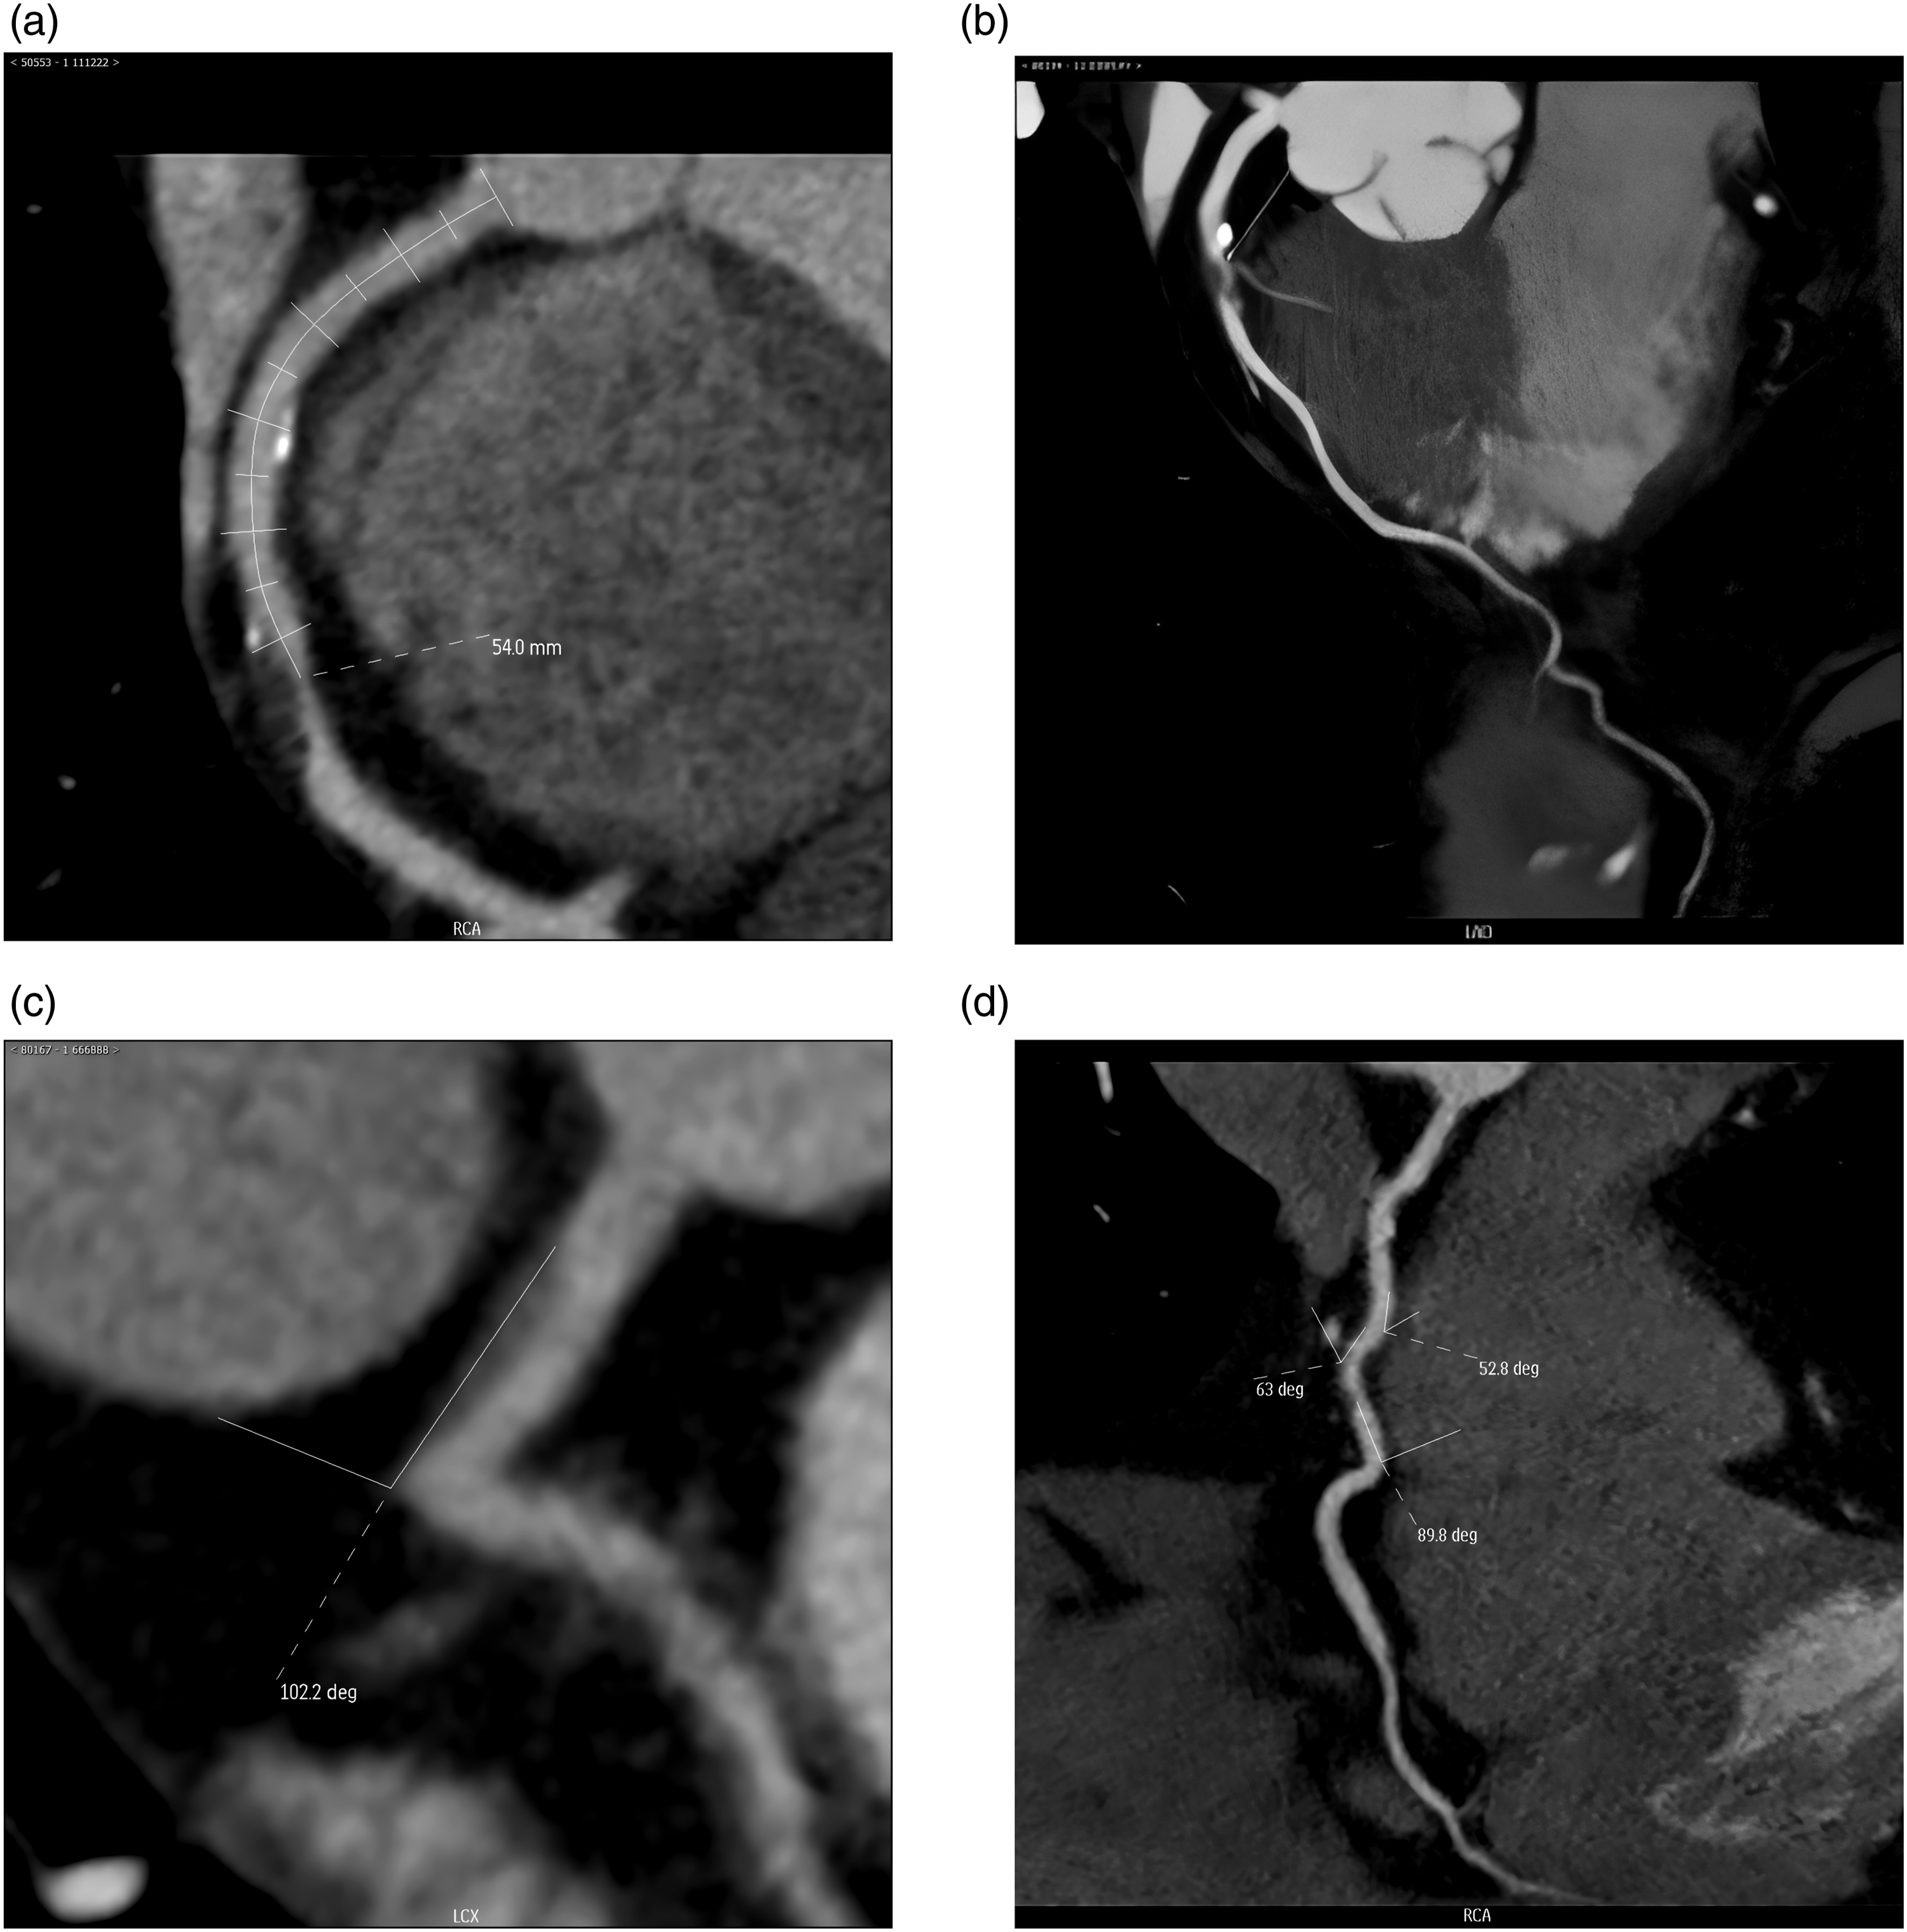
2.4. Analysis of plaque characteristics by CCTA
Coronary artery diameter stenosis and plaque characteristics were assessed using the deep learning-based CT image analysis software (TIMESlice, version 4.19).
20
The specific analyses included: (1) Diameter stenosis parameter analysis, which encompassed the degree of diameter stenosis, minimum lumen cross-sectional area, and lesion length; (2) Plaque quantitative analysis, which involved measuring calcification component volume, non-calcification component volume, and the load of various plaque types (including calcified plaque, fibrous plaque, fibrolipid plaque, and necrotic core). Plaque burden was defined as the percentage of specific plaque volume relative to the total volume of diseased vessels.
21
The delineation of all images was performed independently by two radiologists, each with over 10 years of experience. The consistency test of the two sets of results demonstrated a high level of agreement, and the final result was determined as the average of the two measurements. High-risk plaque feature (HRP) identification involves several criteria
21
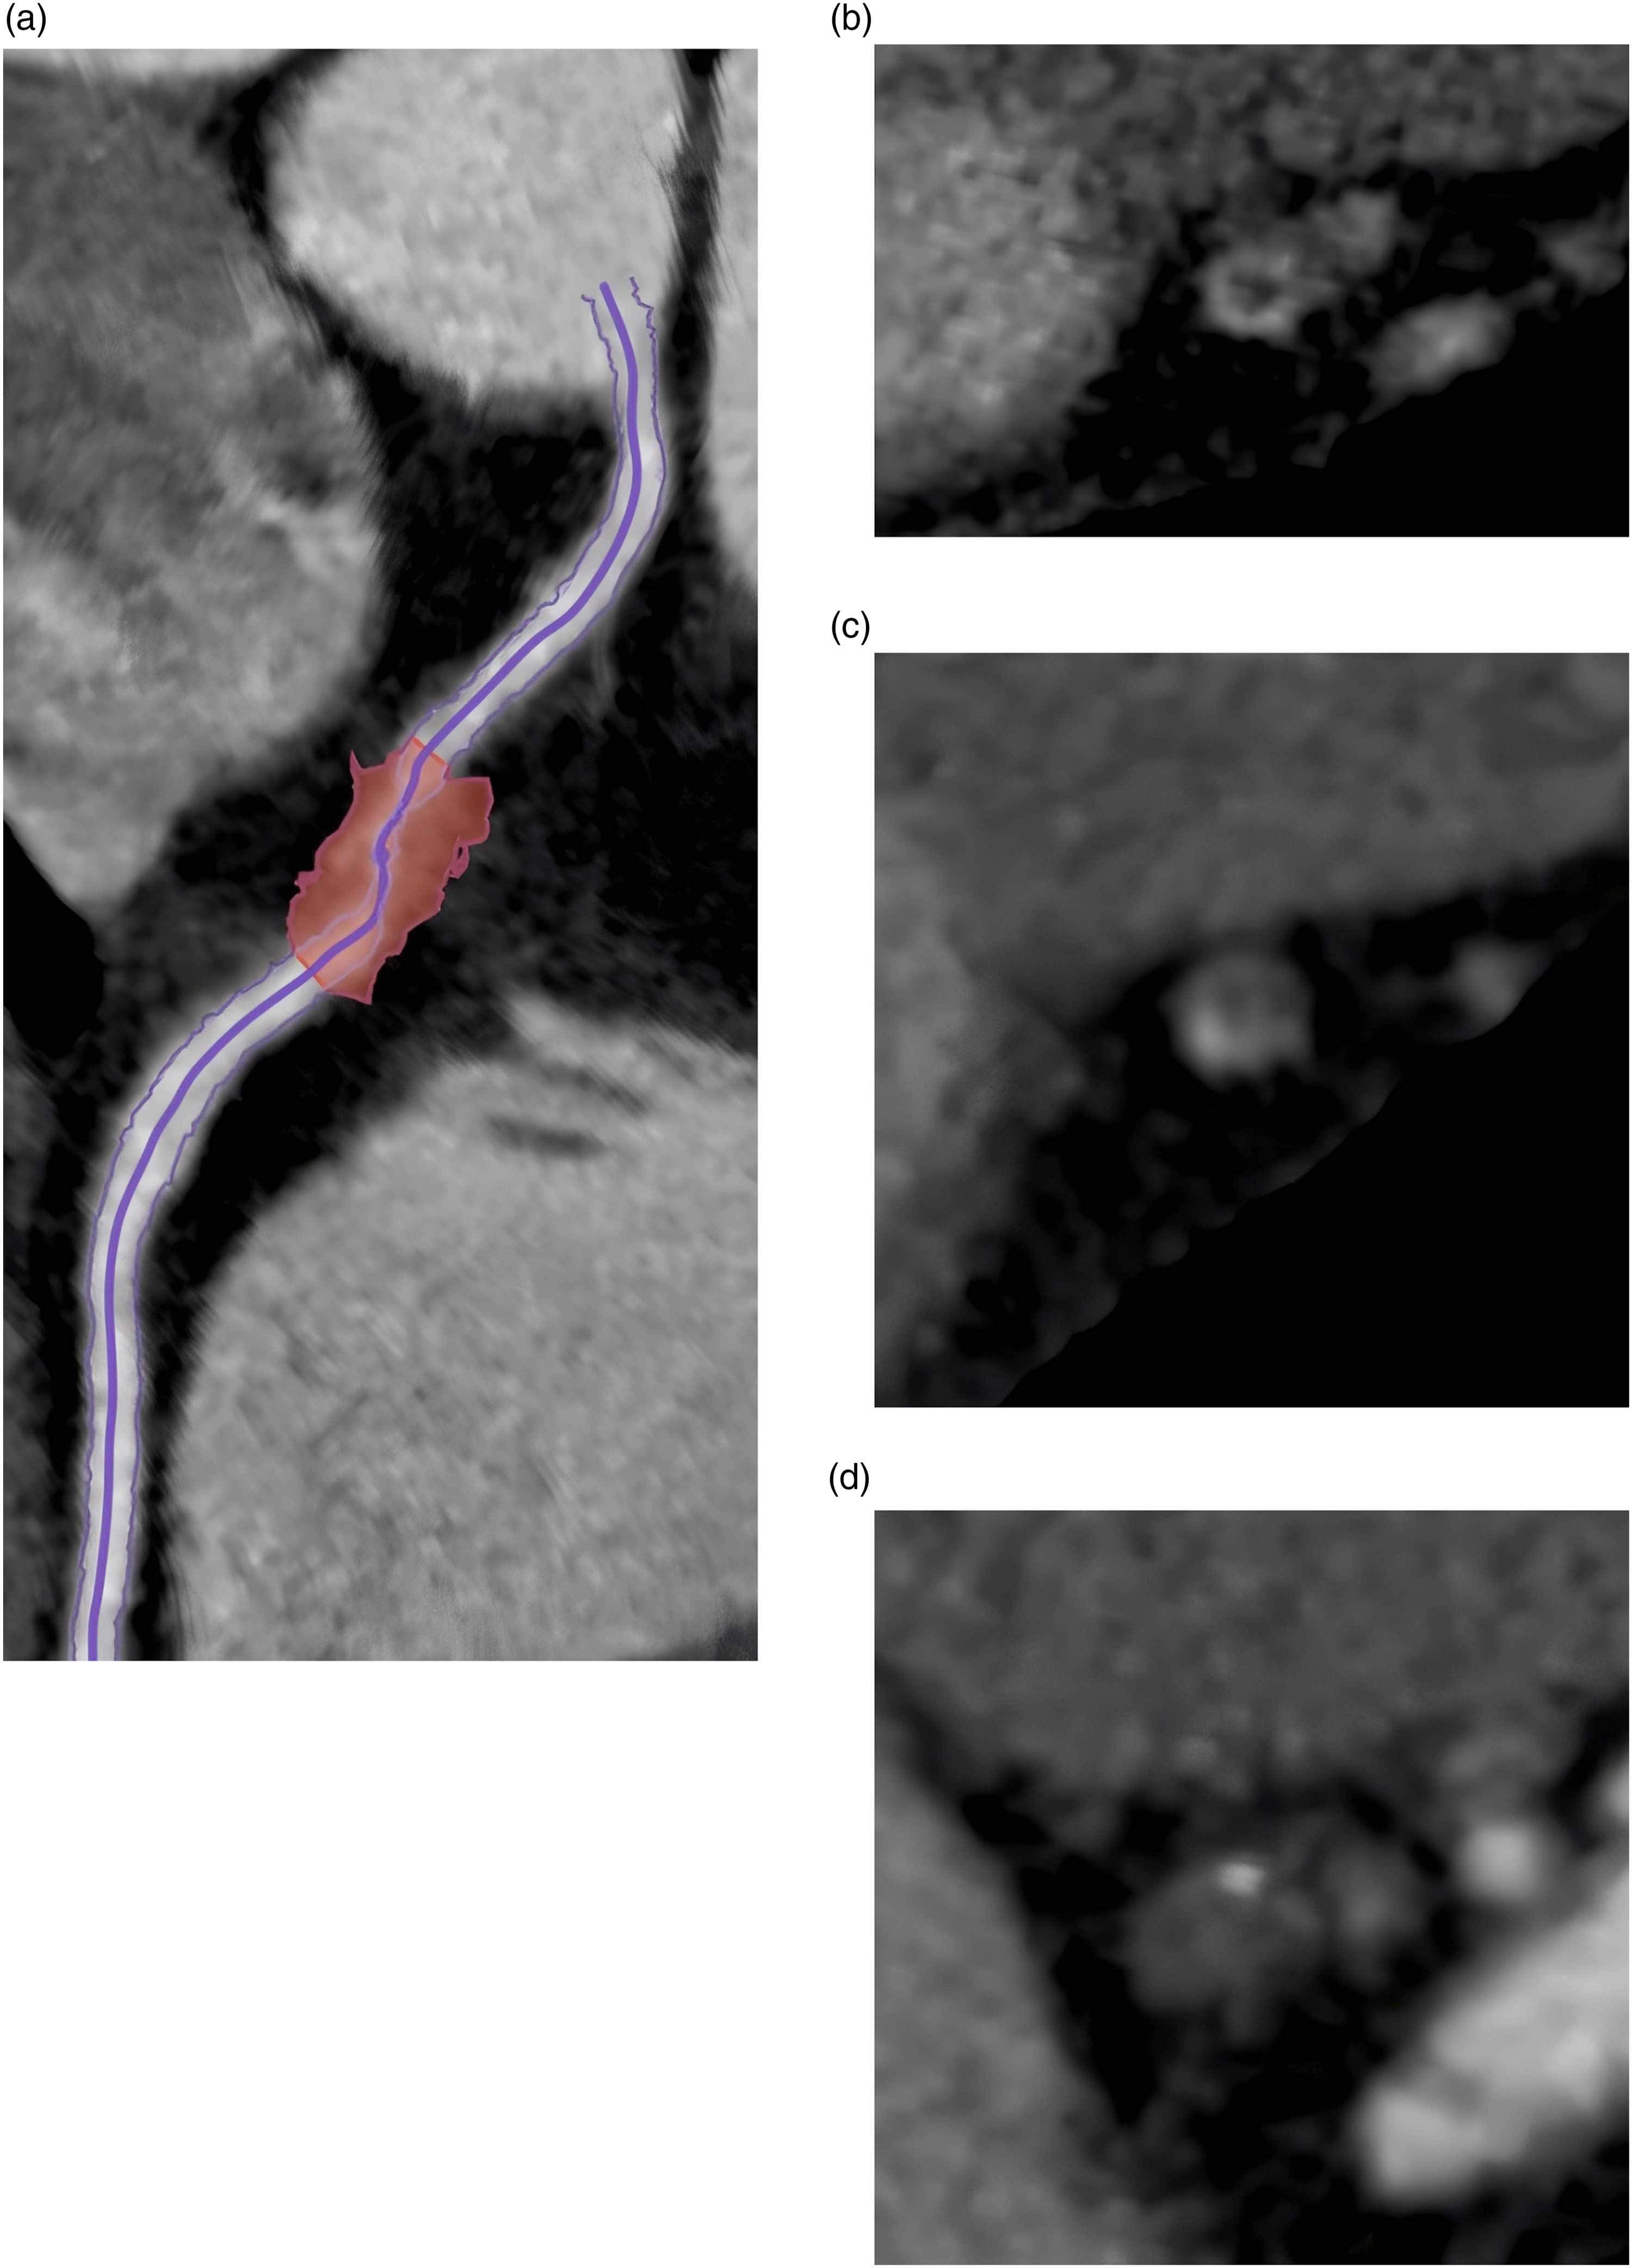
: Positive remodeling, which is defined as a remodeling index greater than 1.1, and it is automatically measured by the software. The “napkin ring sign”,which is defined in a non-calcified plaque cross-sectional image by the presence of two distinct features: a central area of low attenuation plaque that appears to be in contact with the lumen, and a ring-like peripheral rim of higher CT attenuation encircling this central area. Spotty calcium,which is defined as punctate calcium deposits within a plaque. Low attenuation plaque,which is defined as non-calcified plaque exhibiting internal attenuation of less than 30 HU. The identification of all HRP characteristics was collaboratively conducted by the two experienced radiologists mentioned above. In cases of disagreement, the findings were re-evaluated by the radiologist with over 20 years of experience. Figures 3 and 4 illustrate the outline and identification of the aforementioned CCTA features. Schematic diagram of the measurement of coronary artery plaque characteristics. Specifically, (a) Illustrates the process for identifying the centerline of the coronary artery, while (b) depicts the process for quantifying coronary plaque parameters. Schematic diagram of the measurement of HRP. (a) Depicts a plaque exhibiting positive remodeling characteristics; (b) Illustrates a plaque featuring a napkin ring sign; (c) Presents a plaque characterized by punctate calcification, and (d) shows a low-attenuation patch.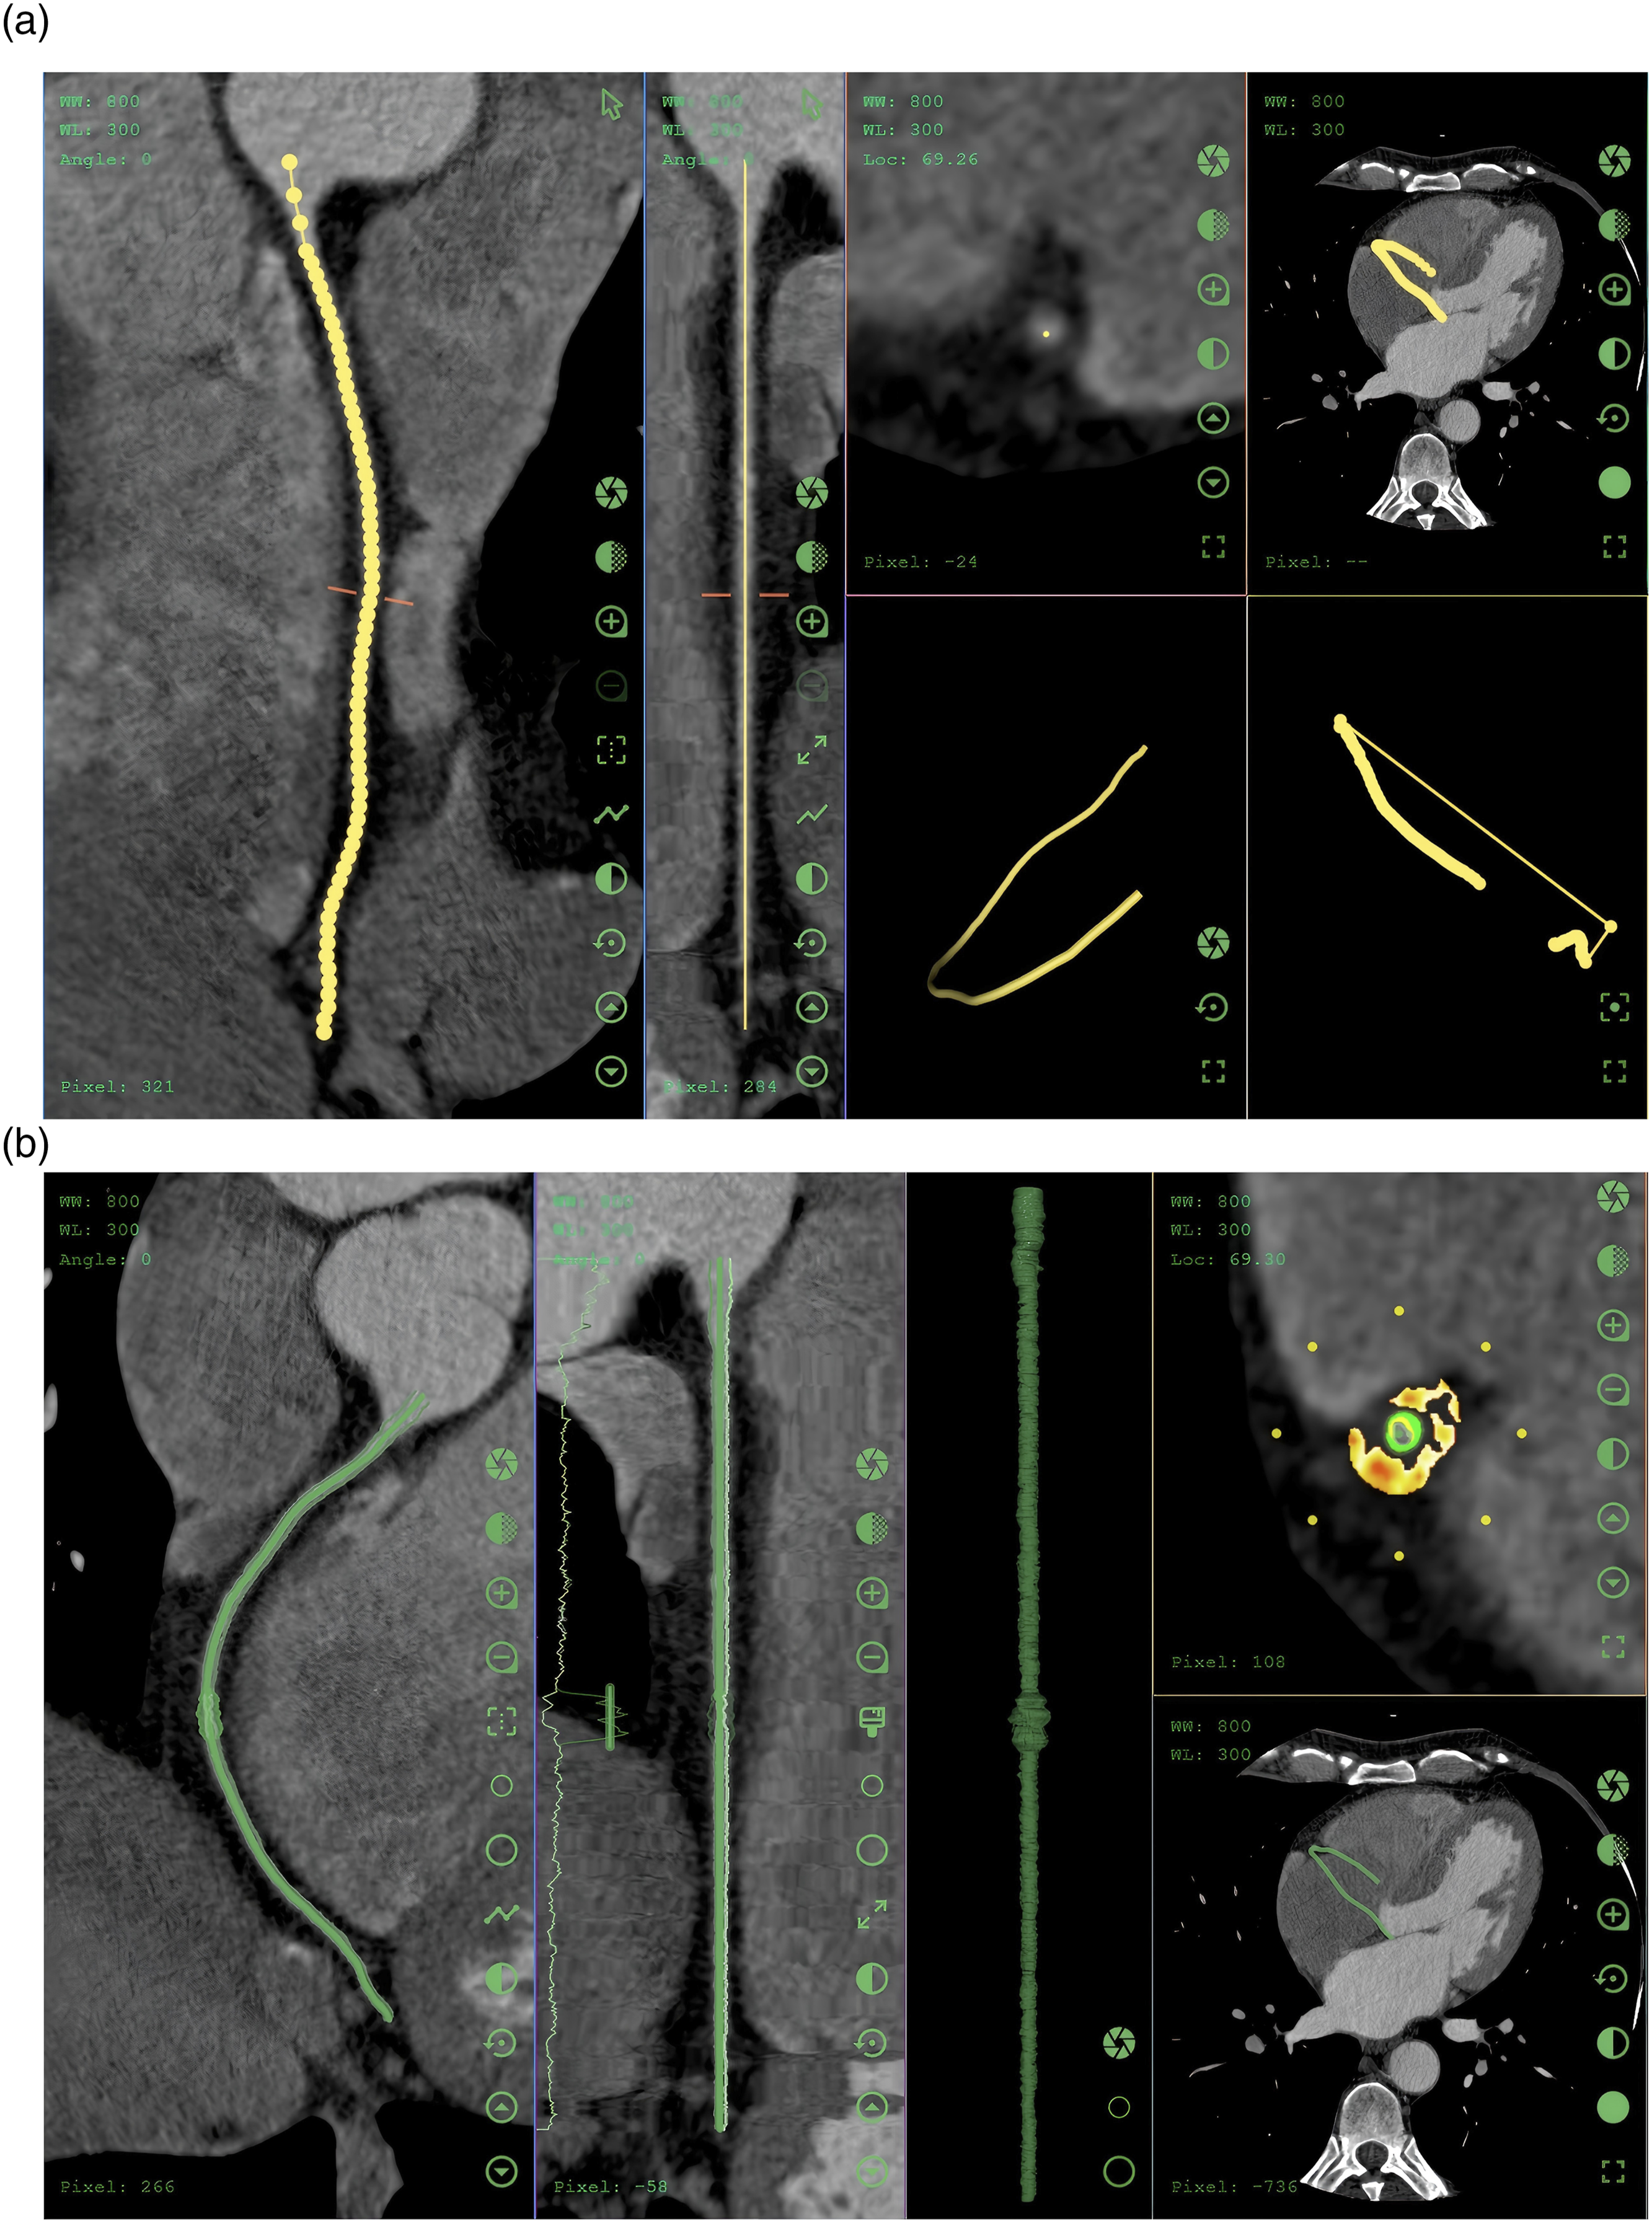
2.5. Determination of culprit lesions
Two cardiologists with over 10 years of experience each jointly identified the culprit lesions according to the ROMICAT criteria. 22 In patients with acute coronary syndrome, if only one significant stenosis is present, this lesion is classified as the culprit lesion; conversely, if two or more significant stenoses are found, the results of the electrocardiogram must be considered. The final determination is based on the results of invasive coronary angiography, with lesions causing significant obstruction of coronary blood flow classified as culprit lesions, while other lesions are categorized as non-culprit lesions.22,23
2.6. Statistical analyses
Statistical analysis was conducted using SPSS 25.0, R 4.3.3, and Zstats 1.0v (https://www.medsta.cn/). Measurement data conforming to a normal distribution were expressed as mean ± standard deviation (±s), and comparisons between groups were performed using the independent samples t-test. Measurement data that did not conform to a normal distribution were expressed as median (interquartile range) [M(Q1, Q3)], with comparisons between groups carried out using the Mann-Whitney U test. Count data were expressed as numbers (n) and percentages (%), with comparisons between groups conducted using either the U test or chi-square test. Categorical variables were analyzed using the chi-square test. The Intraclass Correlation Coefficient (ICC) was used to assess the consistency among different raters within the same group. Preliminary screening of variables was conducted through univariate logistic regression analysis, and independent predictors were selected by employing bidirectional stepwise regression. Variables with P < 0.05 were included in the multivariate logistic regression model. The predictive performance of the model was assessed by plotting the Receiver Operating Characteristic curve (ROC) and calculating the Area Under the Curve (AUC). The model’s goodness of fit was analyzed using the Hosmer-Lemeshow (HL) test. During the model construction process, the ratio of events to variables (EPV), defined as EPV = number of events/number of predictor variables, is taken into account, with a minimum threshold set at ≥10 to ensure the robustness of the model. Finally, a mixed-effects logistic regression method was employed to analyze the clustering effects among multiple vascular data within the same patient and to construct the model. In terms of data preprocessing, continuous variables were filled with the median, and categorical variables were filled with the mode to handle missing values. The interquartile range (IQR) method was used to trim continuous variables to avoid the influence of extreme values, followed by standardization to ensure that variables were on the same scale, meeting model requirements. For the selection of independent variables, the variance inflation factor (VIF) was calculated, and variables with VIF > 10 were removed to avoid distortion of model coefficients, strictly controlling the final number of variables to ≤ 8 to prevent model overfitting. Data were grouped by patient ID to ensure that multiple vascular data from the same patient were either in the training set or the validation set, with stratified sampling prioritized to ensure balanced grouping. Patient ID was included as a random intercept in the model to correct for the correlation of vascular-level observations at the patient level. The internal validation of the mixed-effects logistic regression model utilized 5-fold GroupKFold cross-validation, and the bootstrap method was employed for repeated sampling 100 times to calculate the mean and 95% confidence interval of AUC and OR, assessing the model’s stability and optimistic bias. All tests were conducted as two-sided, and a P-value of less than 0.05 was deemed statistically significant.
3. Results
3.1. Clinical baseline characteristics
The clinical baseline characteristics of the participants.
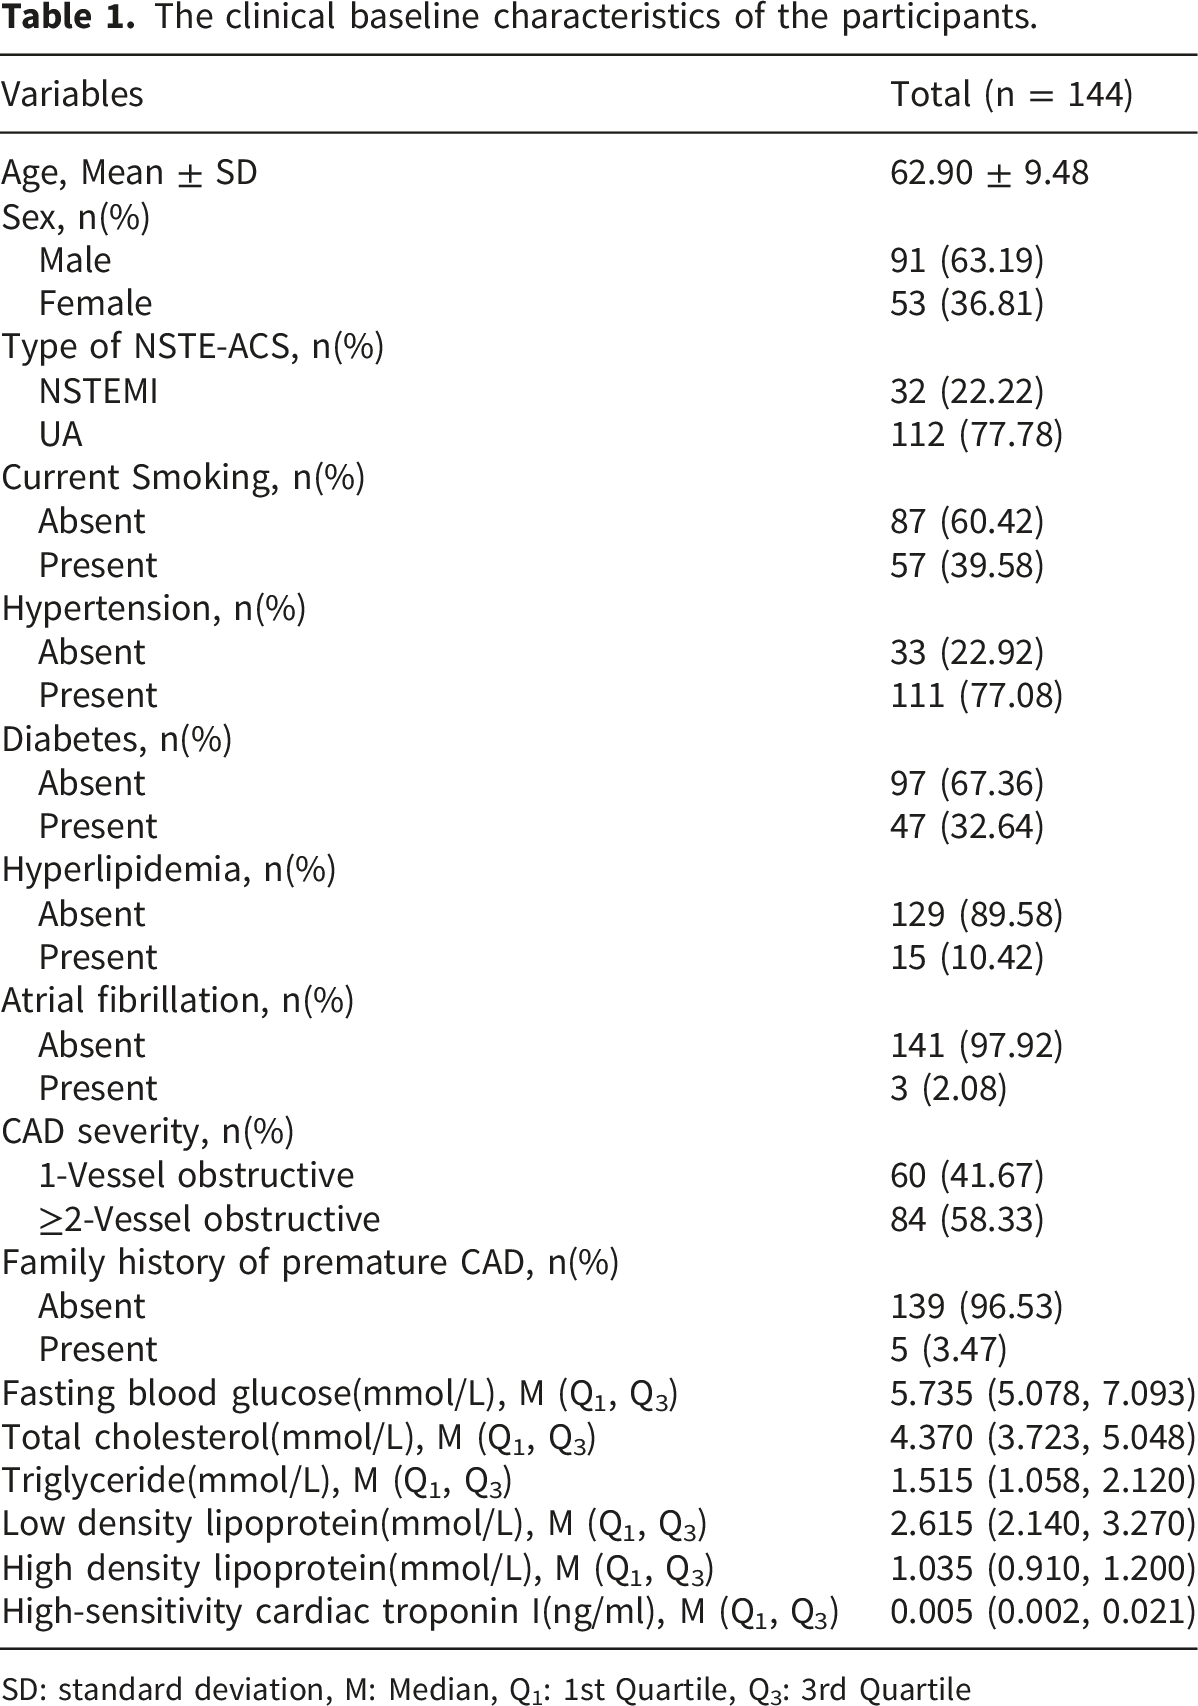
SD: standard deviation, M: Median, Q1: 1st Quartile, Q3: 3rd Quartile
3.2. Comparison of plaque and geometric morphological features by CCTA
The CCTA Characteristics of the training group and the validation group.
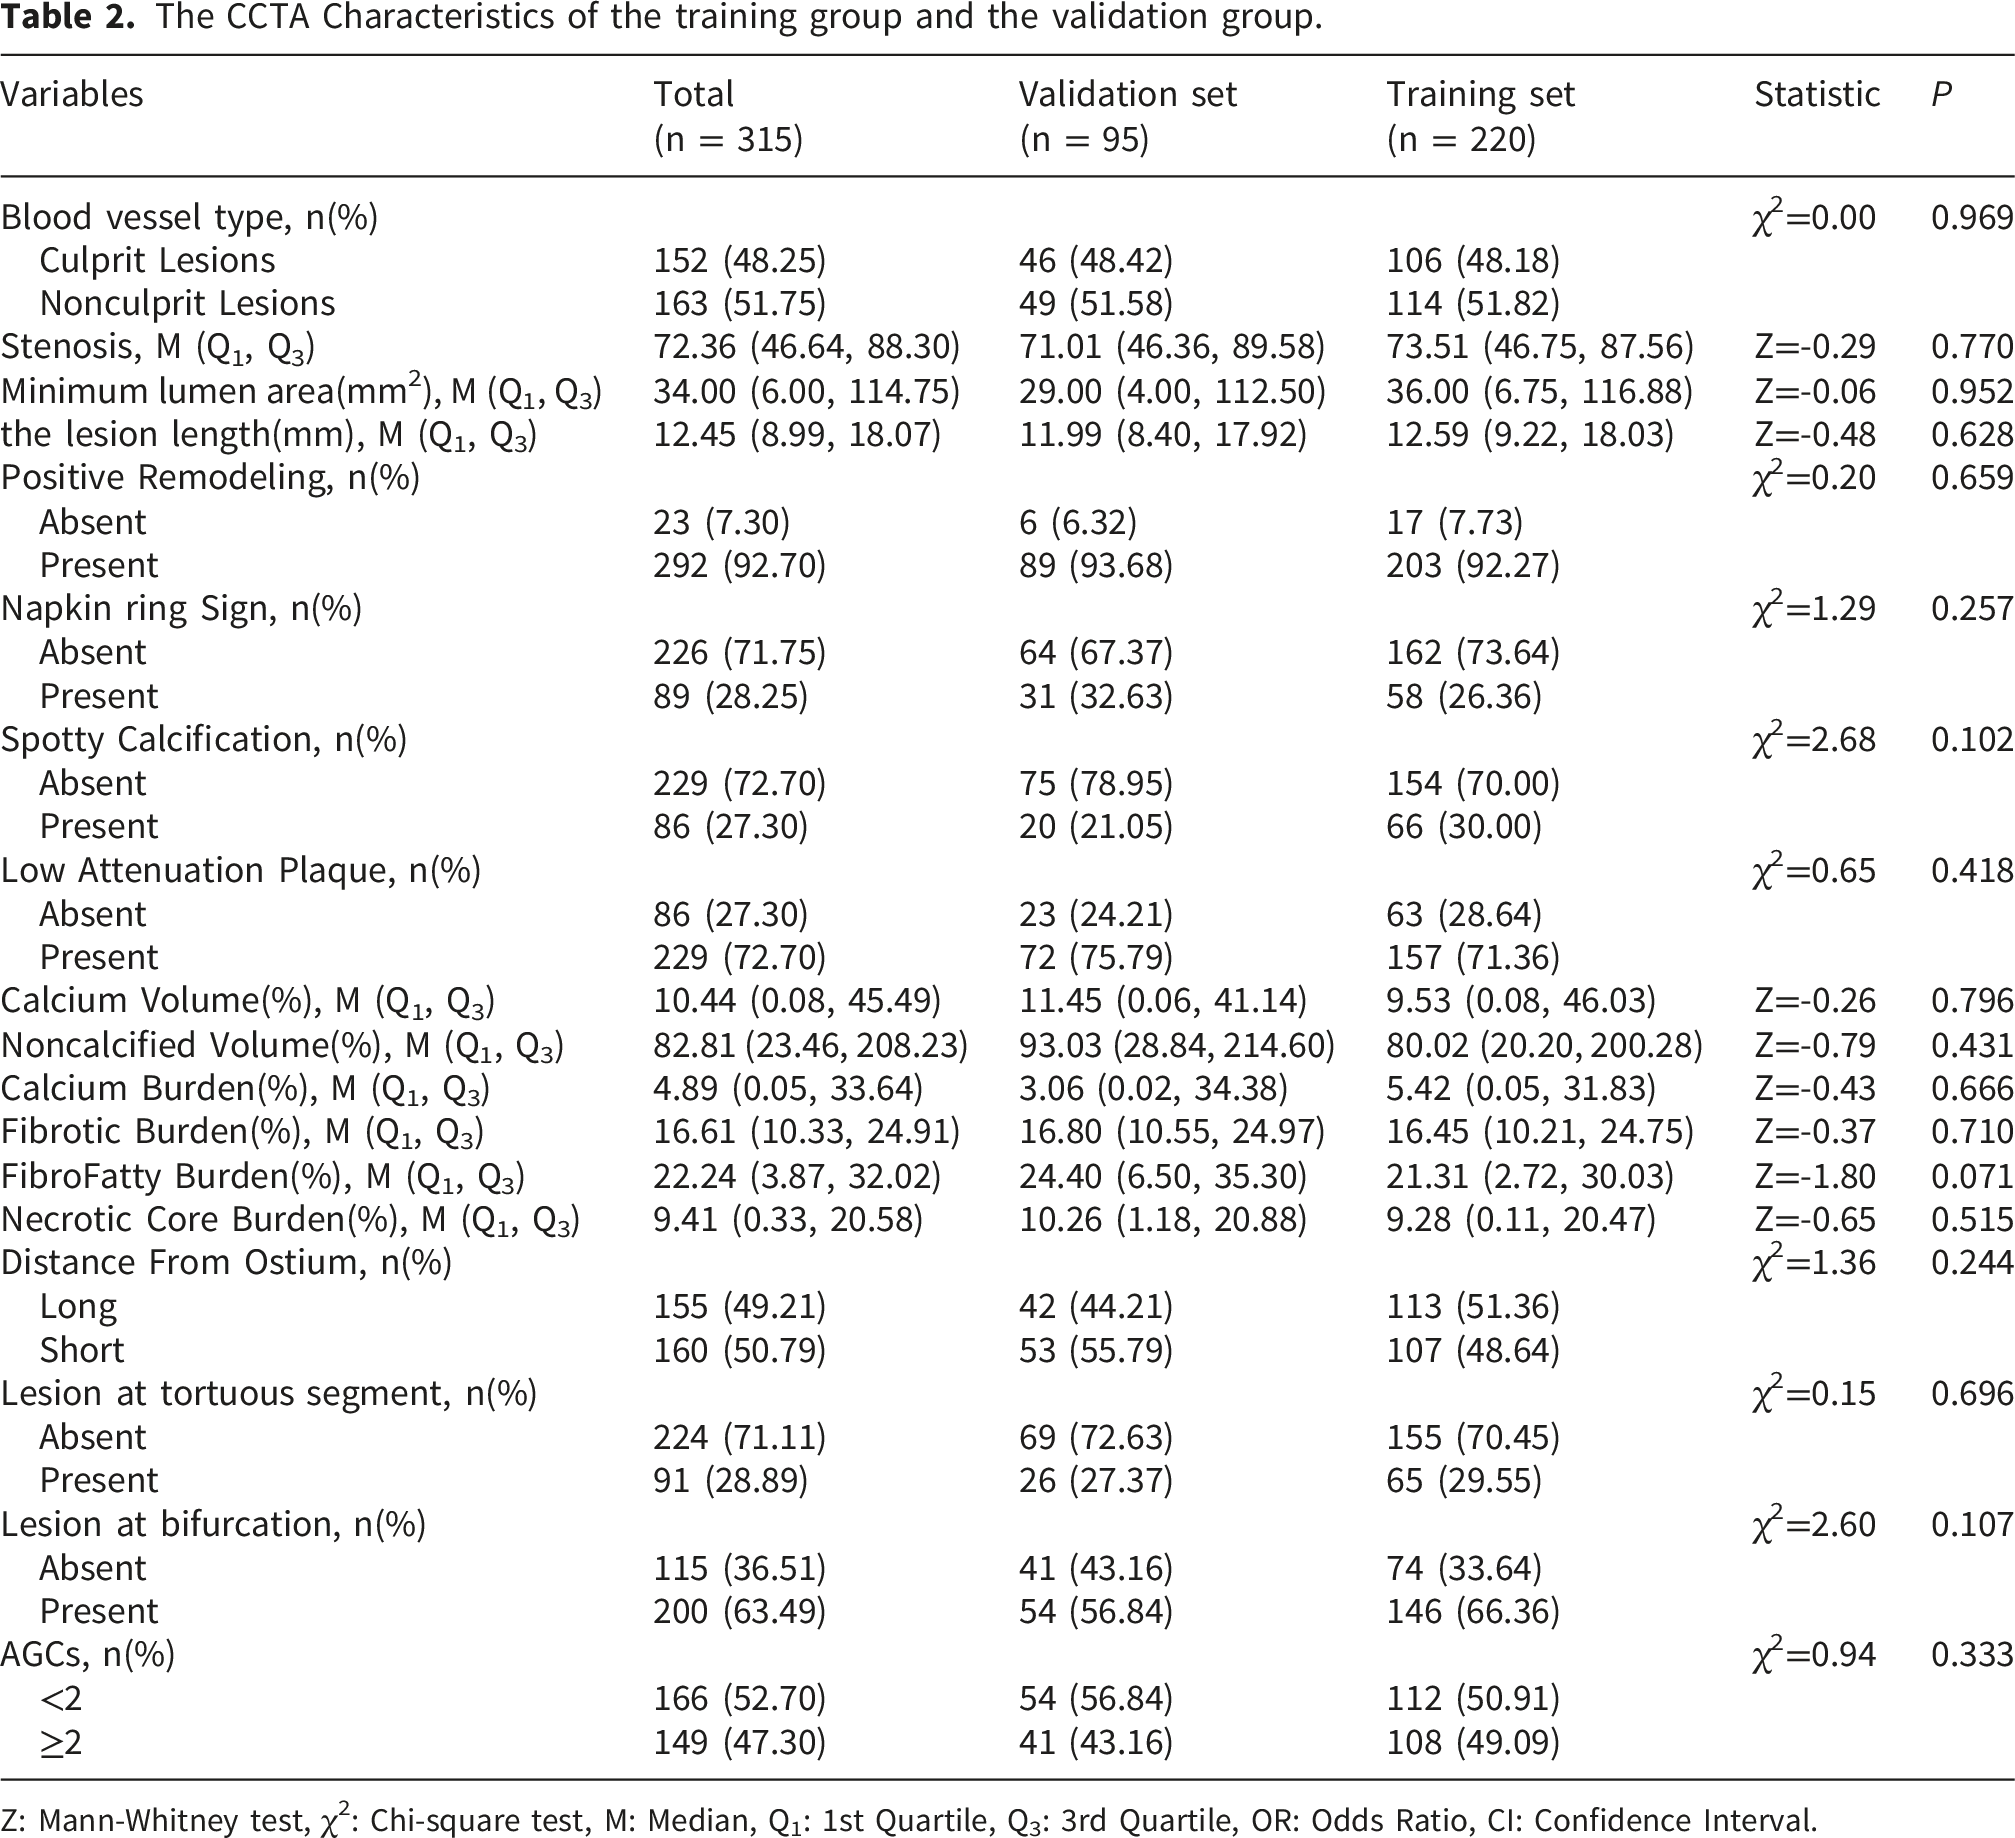
Z: Mann-Whitney test, χ2: Chi-square test, M: Median, Q1: 1st Quartile, Q3: 3rd Quartile, OR: Odds Ratio, CI: Confidence Interval.
3.3. Feature selection, model establishment, and selection for culprit vessel analysis
The results of Model 1.
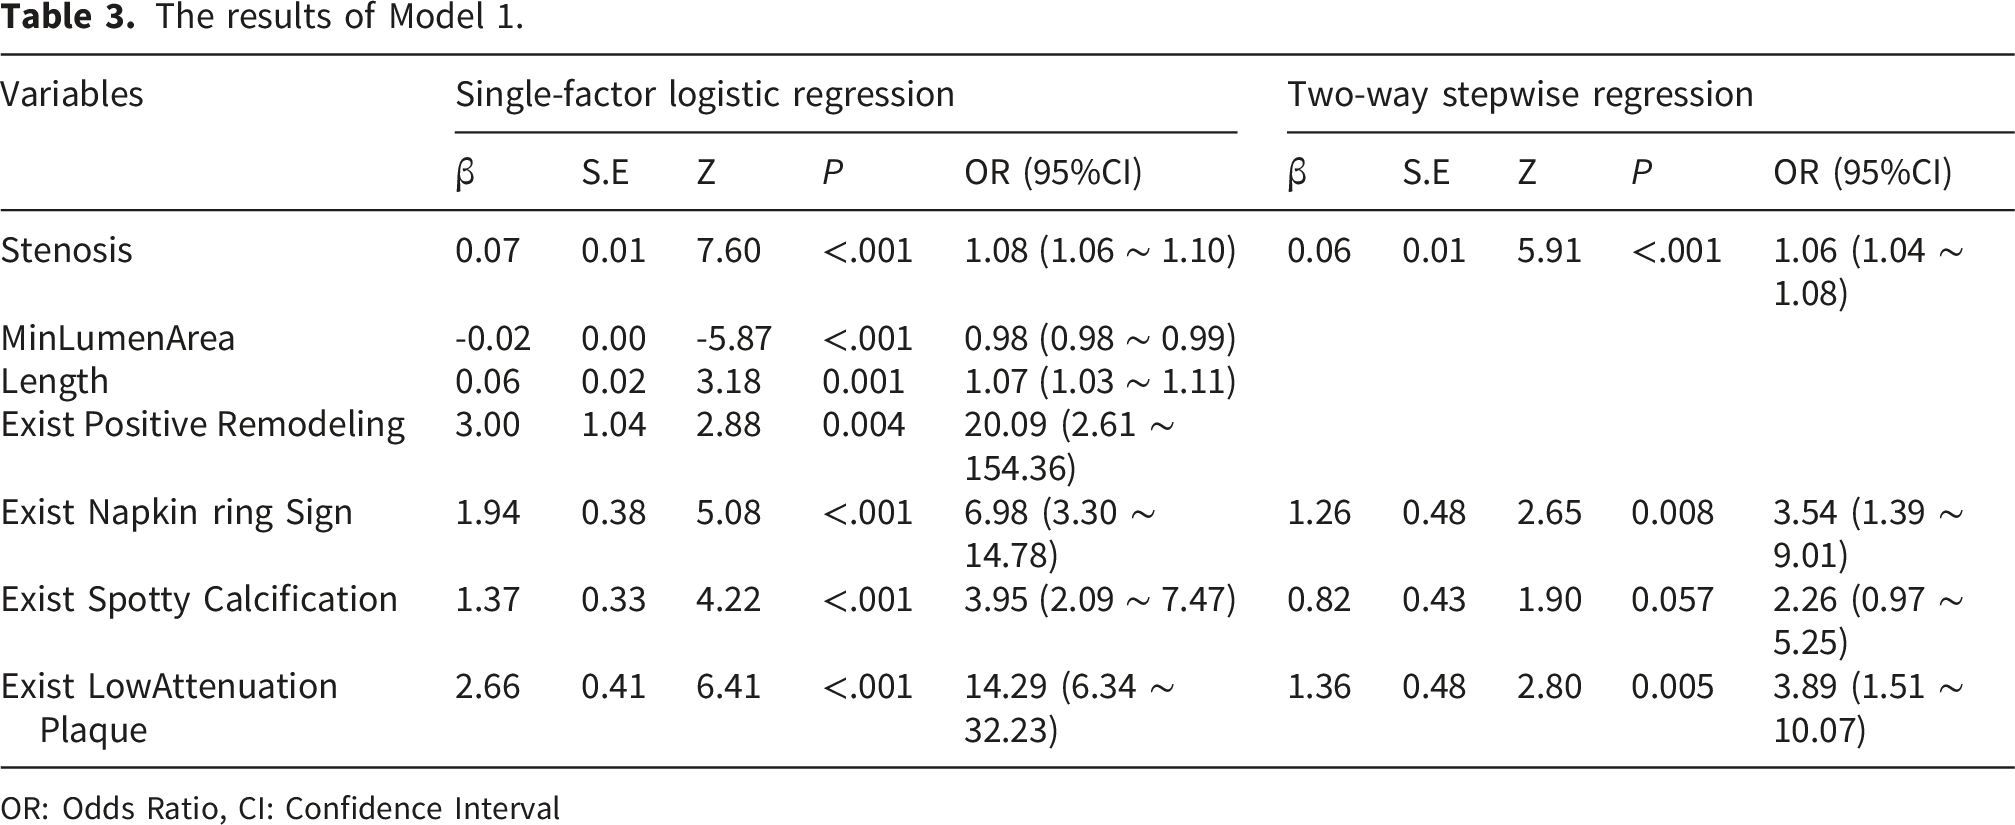
OR: Odds Ratio, CI: Confidence Interval
The results of Model 2.
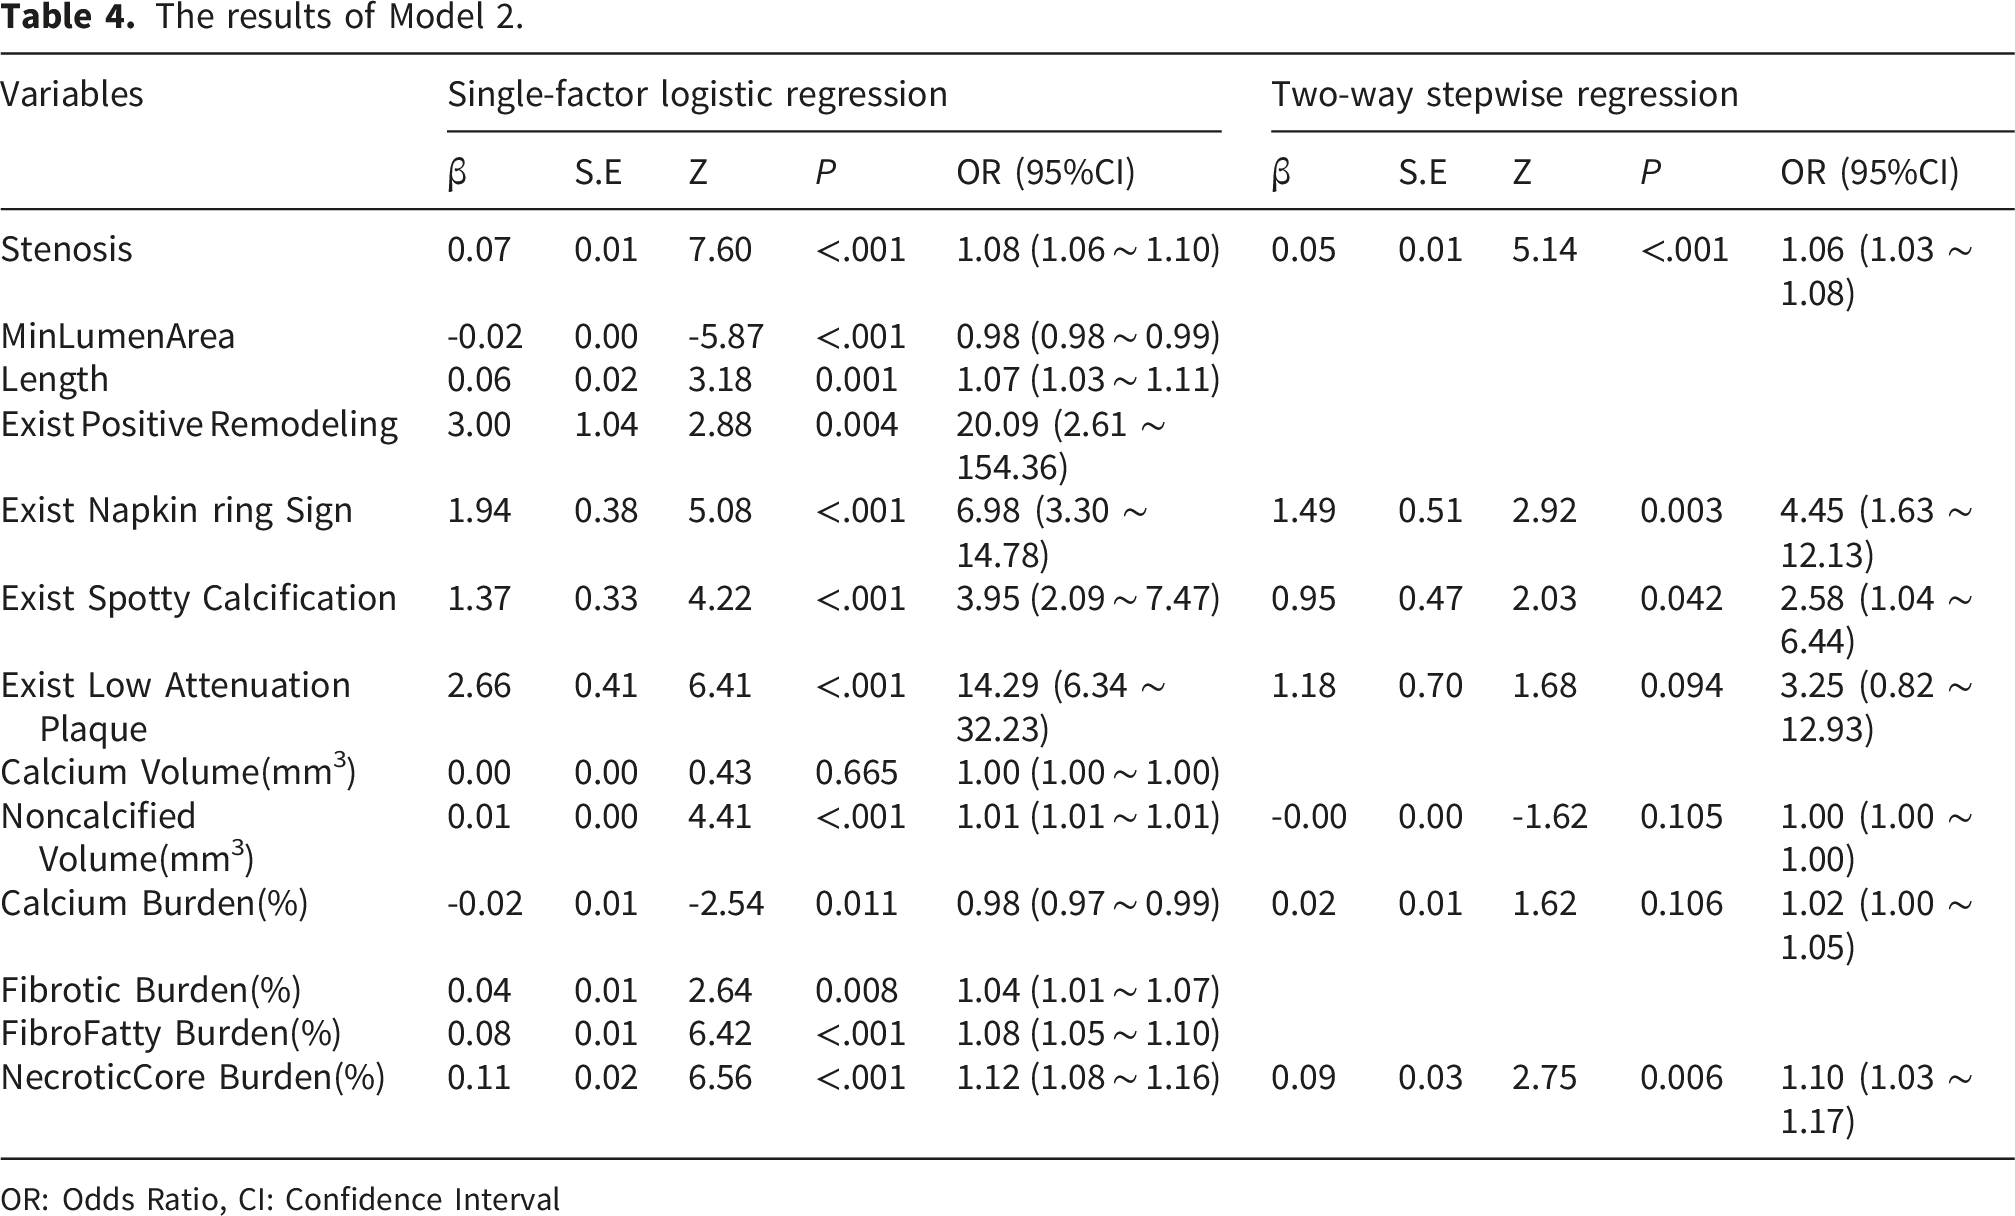
OR: Odds Ratio, CI: Confidence Interval
The results of Model 3.
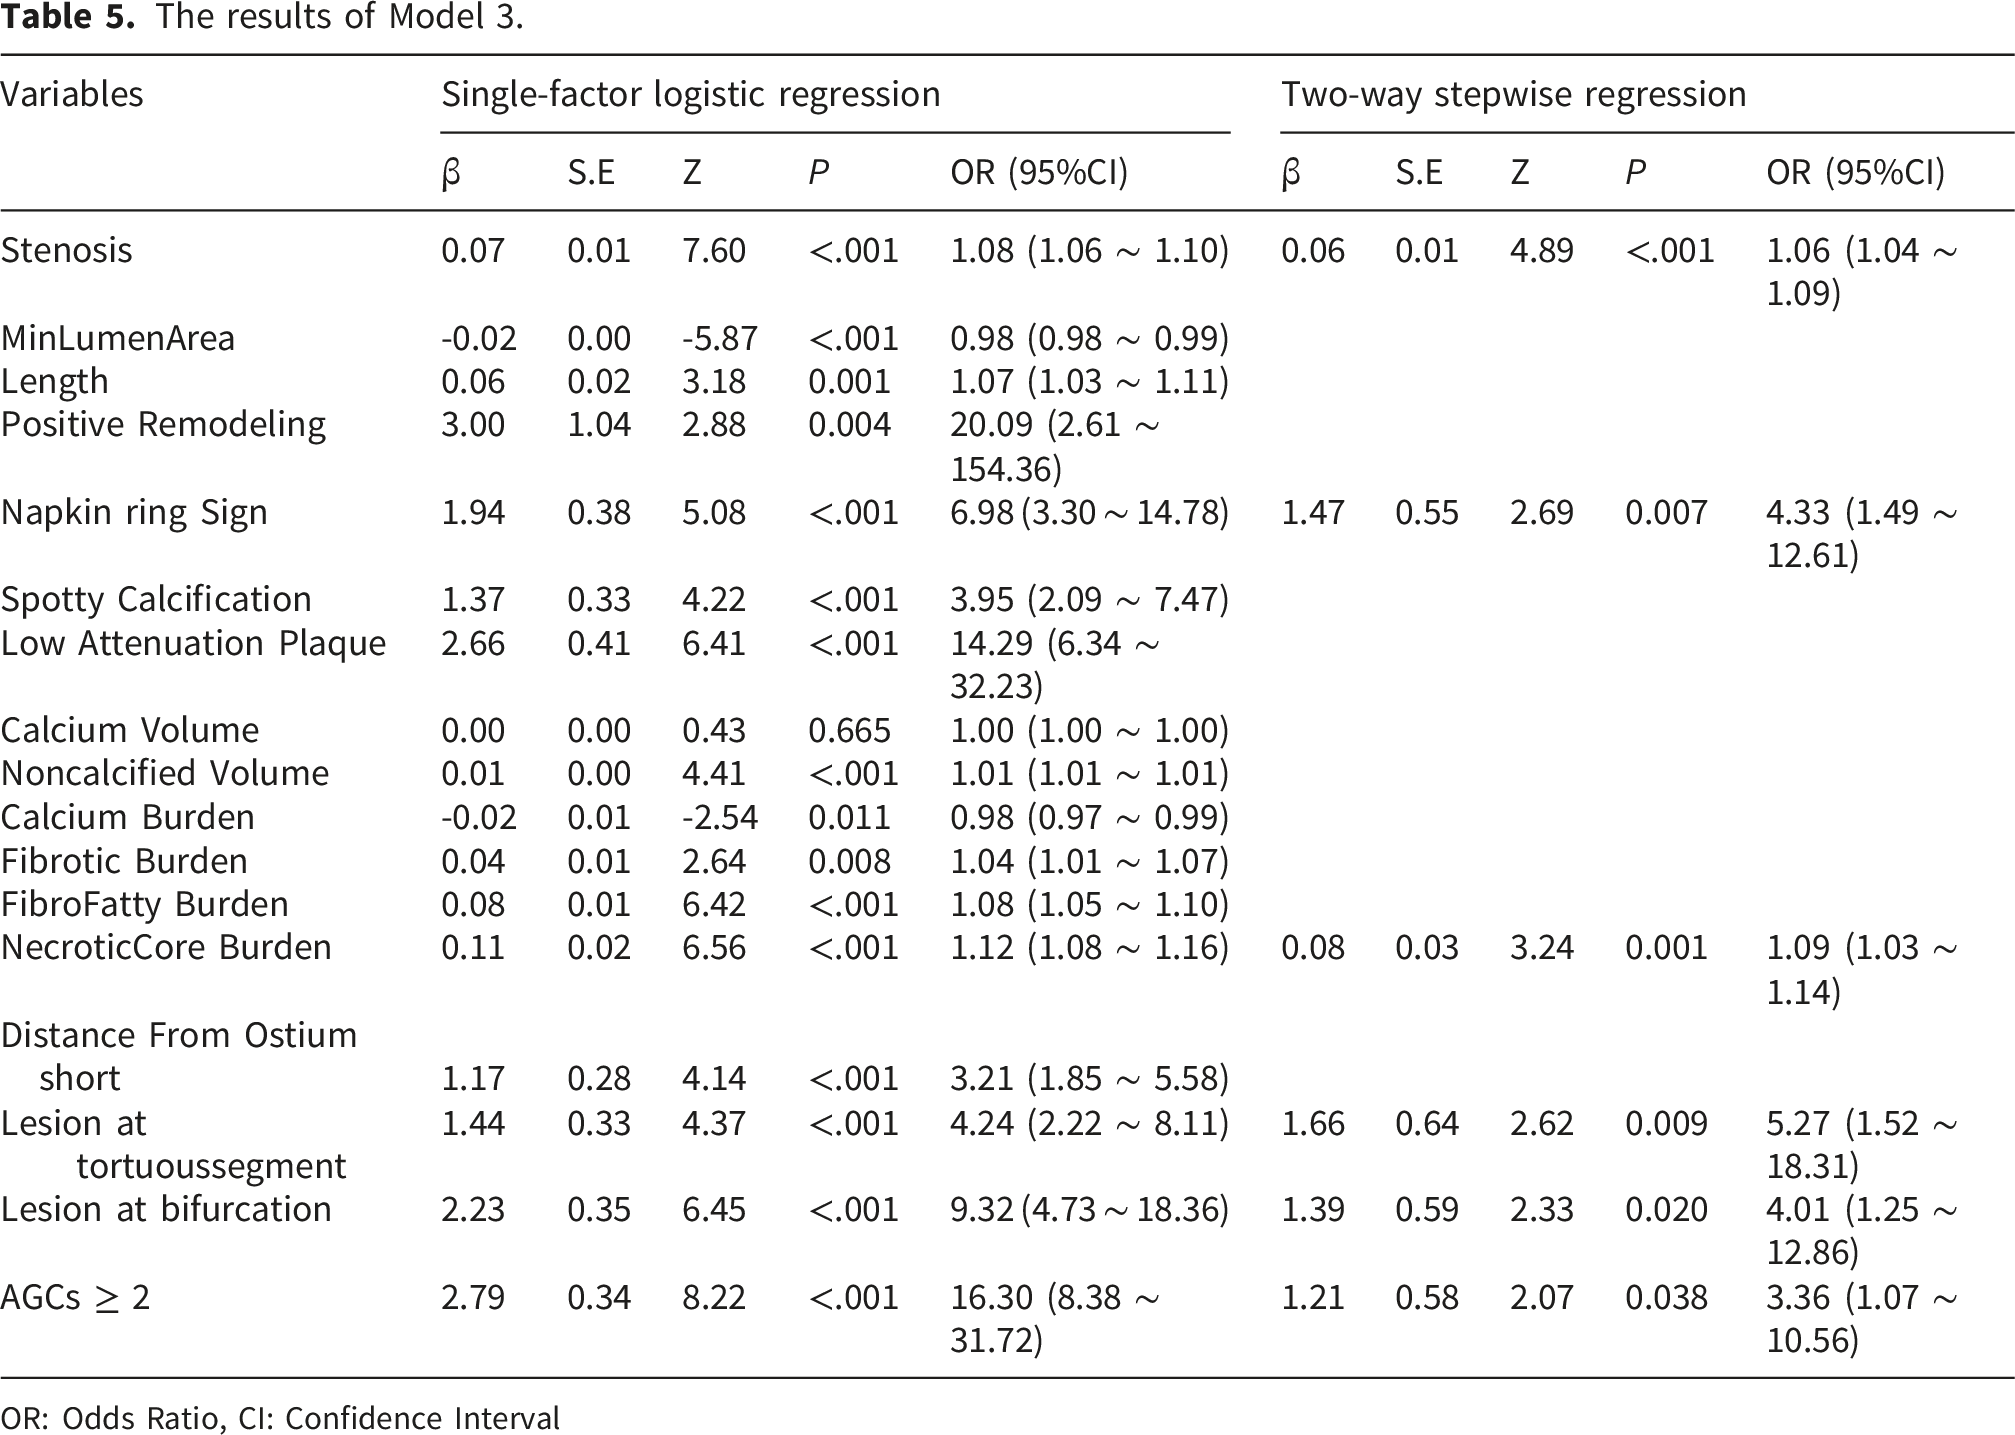
OR: Odds Ratio, CI: Confidence Interval
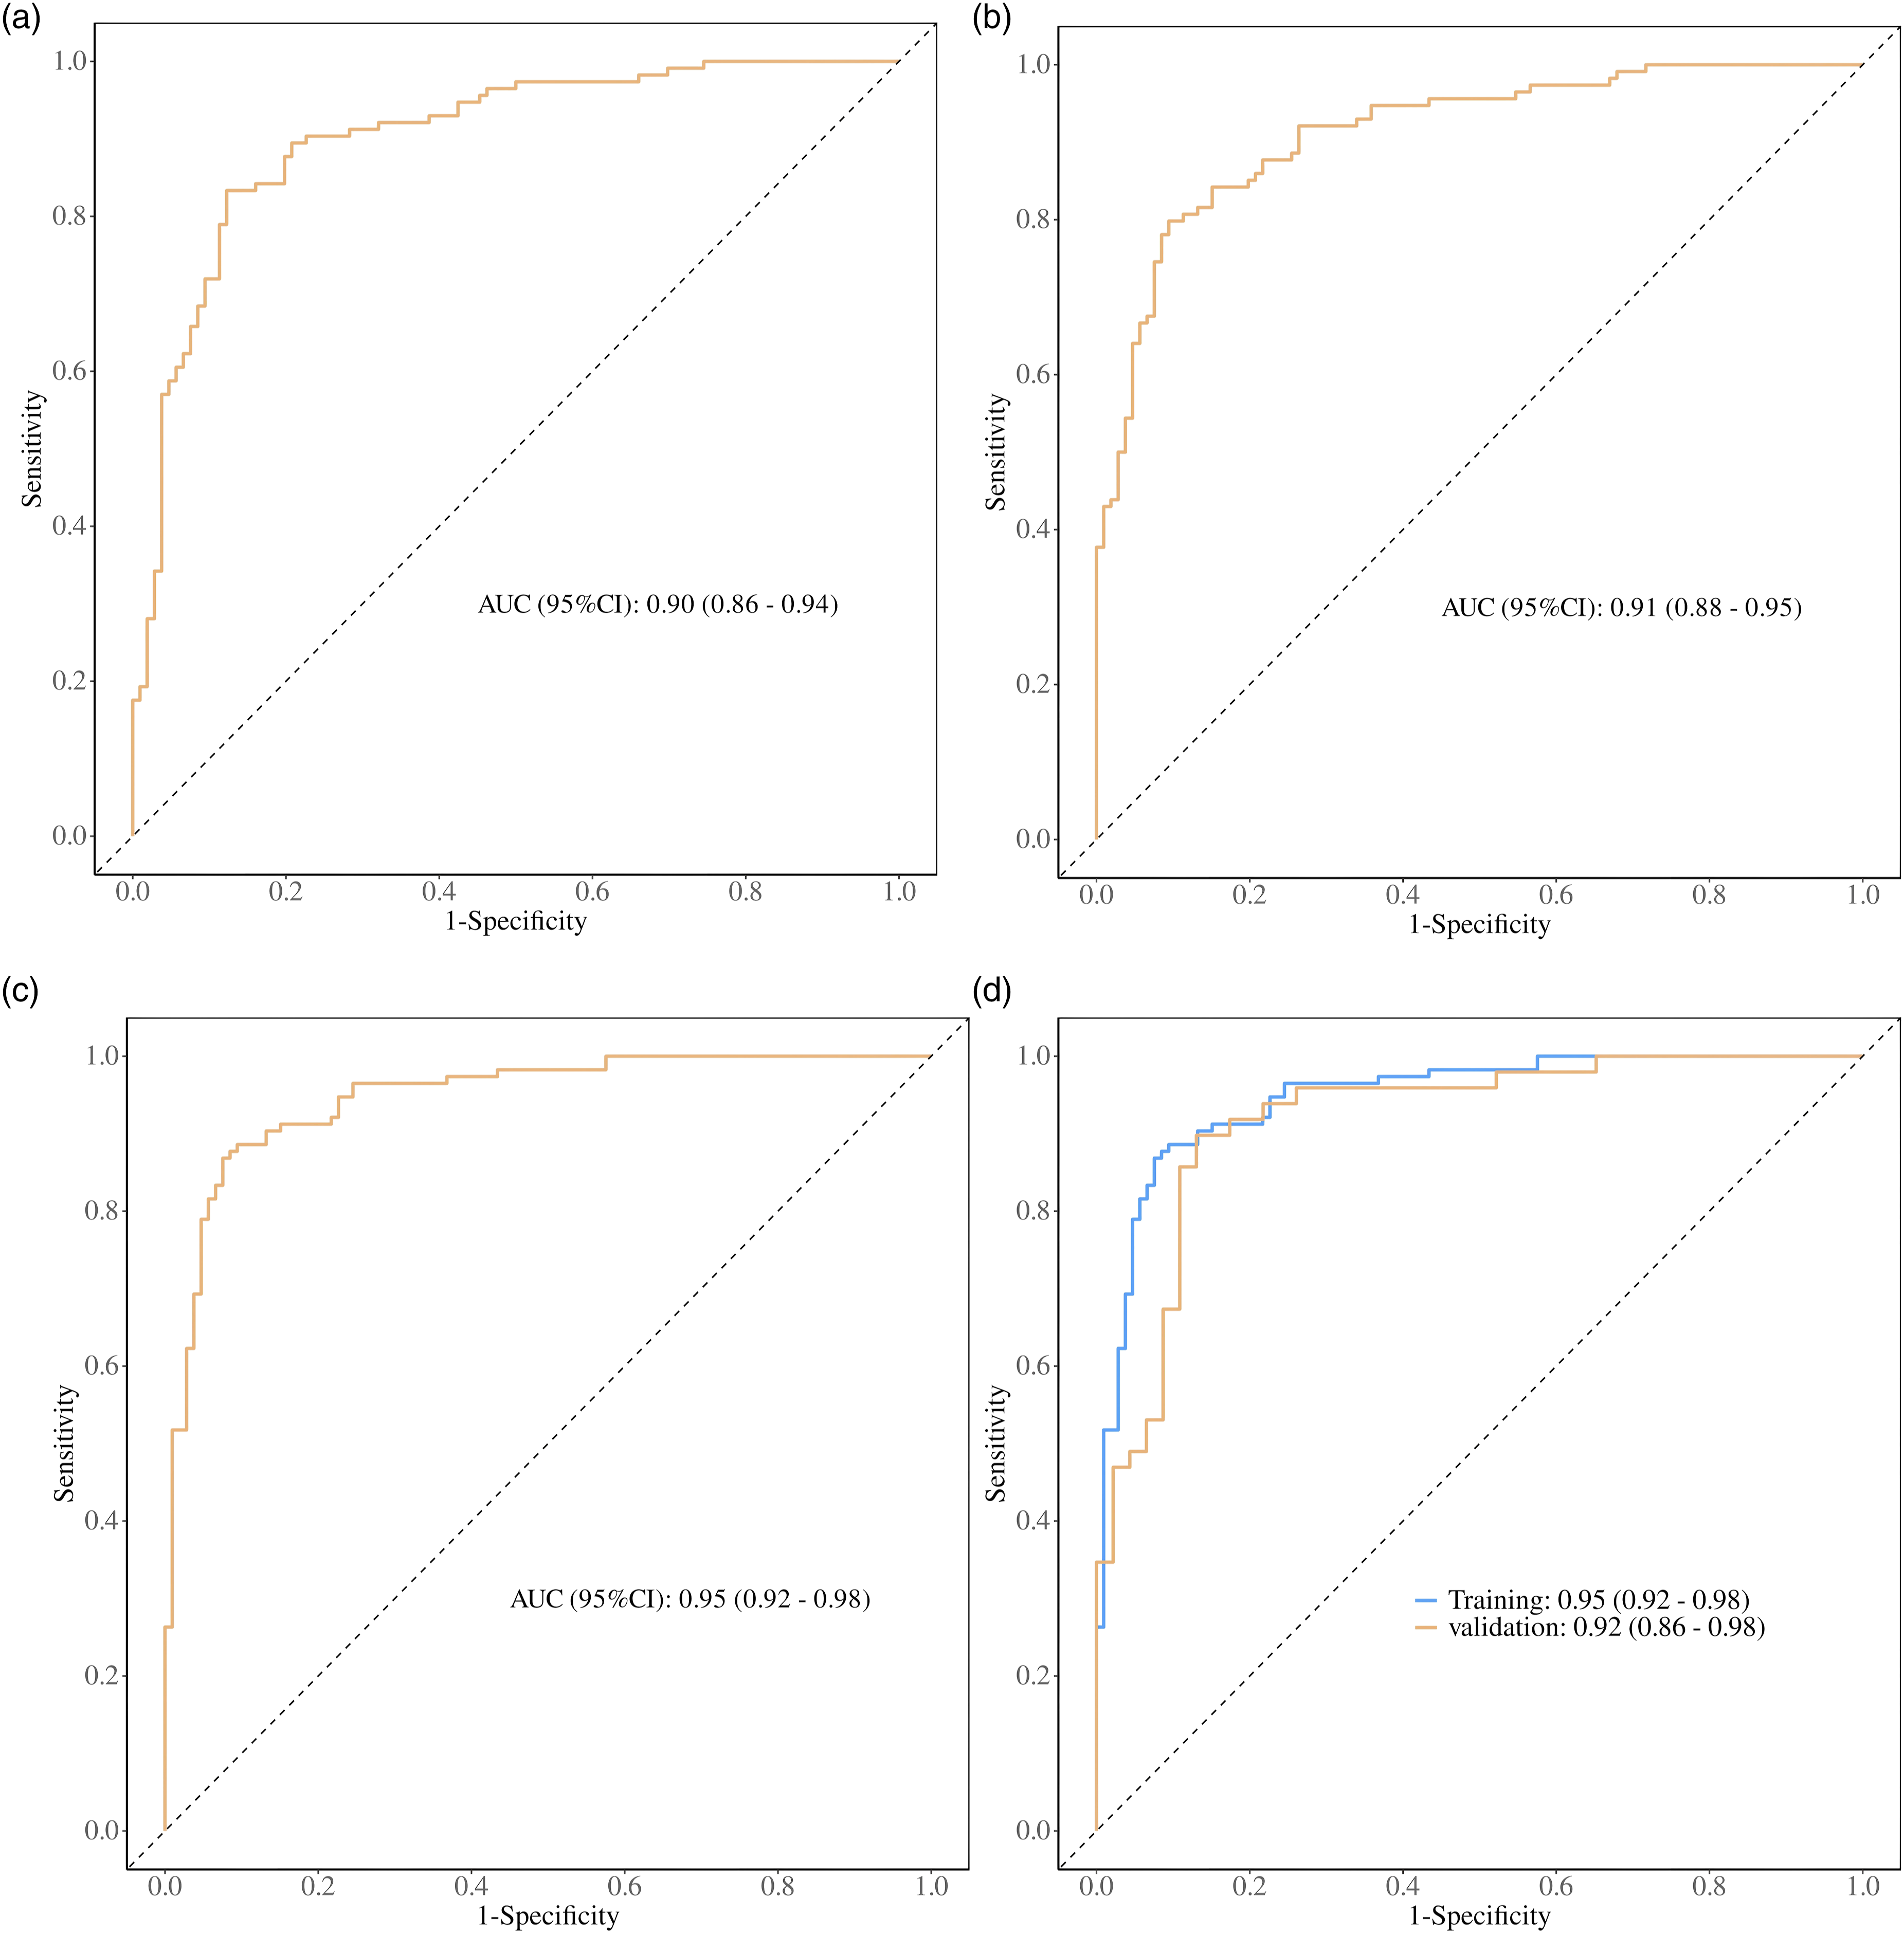
The ROC curves of each model. (a) Illustrates the AUC for model 1, while (b) depicts the AUC for model 2. (c) Presents the AUC for model 3, and (d) highlights the best model, along with the verification of model 3’s AUC for both the training set and the validation set.
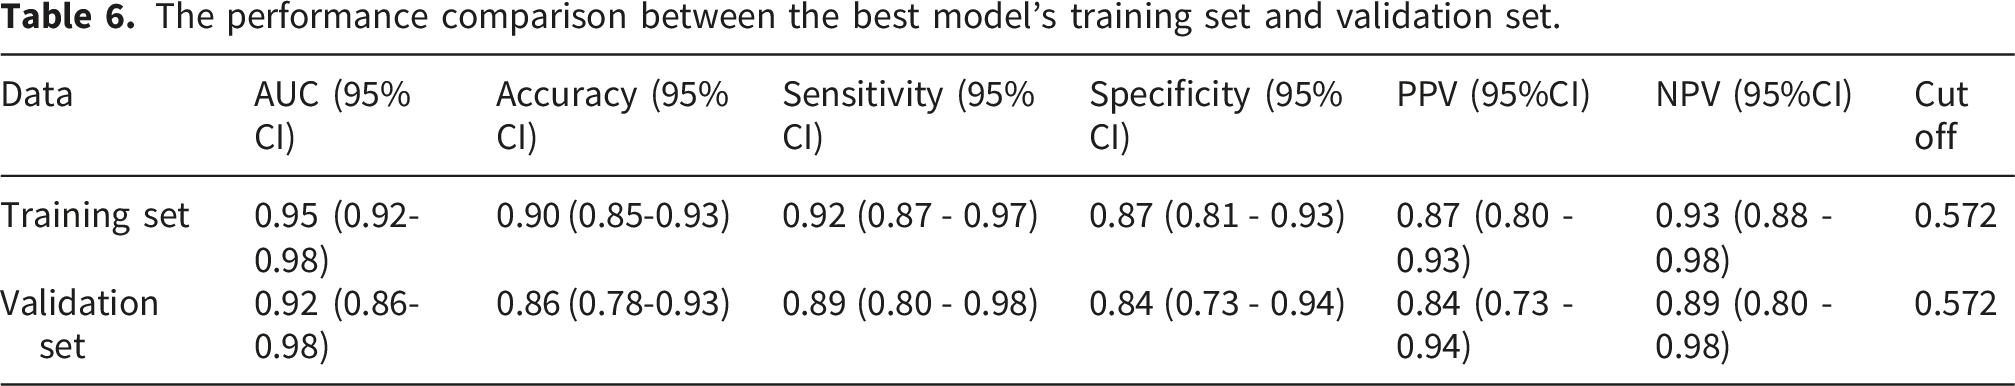
3.4. The performance comparison between the training set and the validation set for the best model
The performance comparison between the best model’s training set and validation set.
3.5. Visualization of nomograms
Using R software and Zstats software, a nomogram was constructed to predict the risk of culprit lesions based on the multivariate logistic regression results of the optimal auxiliary diagnostic model, as illustrated in Figure 6. This nomogram incorporates variables such as the degree of luminal stenosis, Napkin-ring sign, Necrotic core burden, Lesion at tortuous segment, Lesion at bifurcation and AGCs≥2. The nomogram translates the values of each variable into intuitive scores, which are then aggregated to form a total score. This total score is aligned with the corresponding probability values on the lower axis to predict the risk of culprit lesions. When the total score approaches 120, the risk score nears 0.5, indicating an increased risk. Conversely, when the total score exceeds 164, the risk score surpasses 0.9, signifying a significantly increased risk and a higher likelihood of developing into a culprit lesion. A nomogram was constructed based on the optimal auxiliary diagnostic model.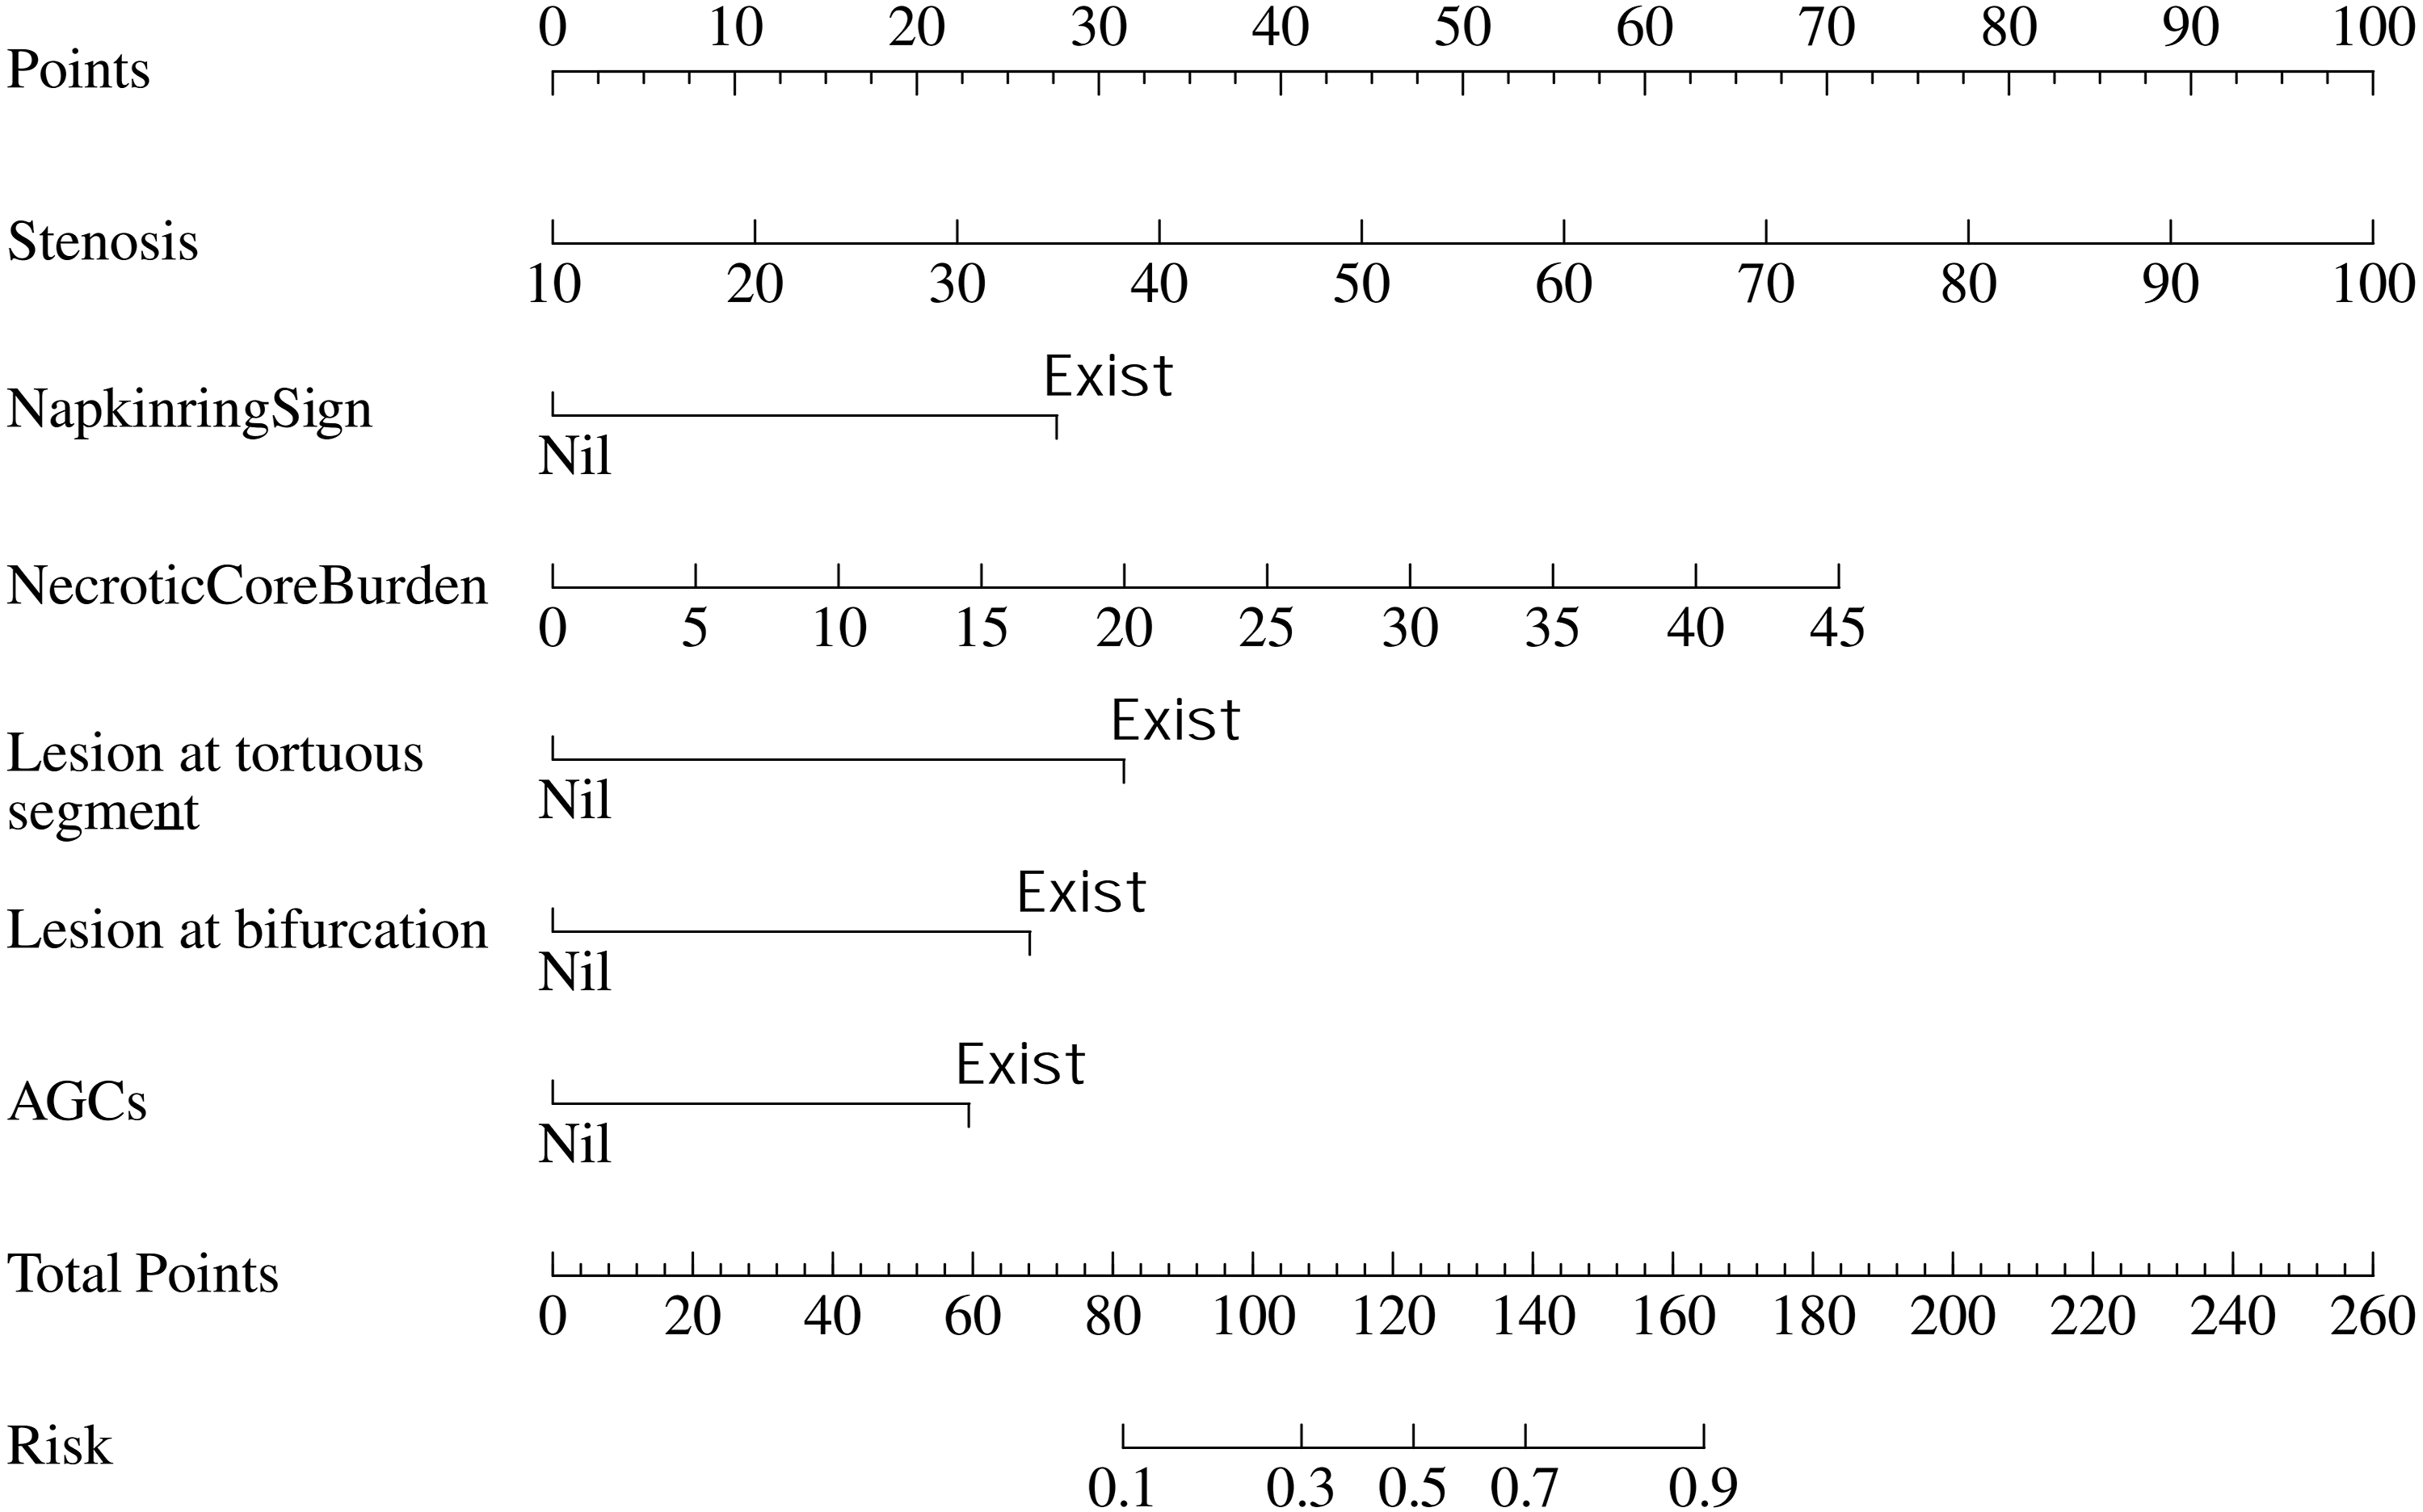
3.6. Calibration curves and clinical decision curves
The calibration curves for the training and validation sets of the optimal auxiliary diagnostic model are illustrated in Figure 7(a) and (c), respectively. The calibration curve for the training group closely aligns with the standard line, while the validation group shows a slight deviation from it. However, the P-value obtained from the Hosmer-Lemeshow (HL) test is greater than 0.05, indicating a good consistency between the predicted and observed actual results. Additionally, this study plotted the clinical decision curve to demonstrate the clinical net benefit of using this model for prediction. The x-axis represents the risk threshold, while the y-axis represents the net benefit of the selected intervention option at that risk threshold. From Figure 7(b) and (d), it is evident that the decision curve of the training set model is positioned above both the full intervention curve and the complete non-intervention horizontal line. Similarly, the decision curve of the validation set model predominantly lies above these curves, suggesting that the model can effectively guide clinical decision-making in the majority of cases, thereby providing greater benefits. In Figure 7(d), a small portion of the curve falls below the horizontal line, indicating that within this risk threshold interval, the use of this predictive model for decision-making results in a lower net benefit compared to complete non-intervention; thus, alternative examinations should be considered. Furthermore, Figure 7(b) and (d) illustrate that at lower risk thresholds, the two curves intersect, indicating that the net benefit of using the model for decision-making is equivalent to that of not using it at this juncture. Calibration curves and decision curve analysis of the optimal model in the training and validation sets. (a) Calibration curve for the training set; (b) DCA for the training set; (c) Calibration curve for the validation set; (d) DCA for the validation set.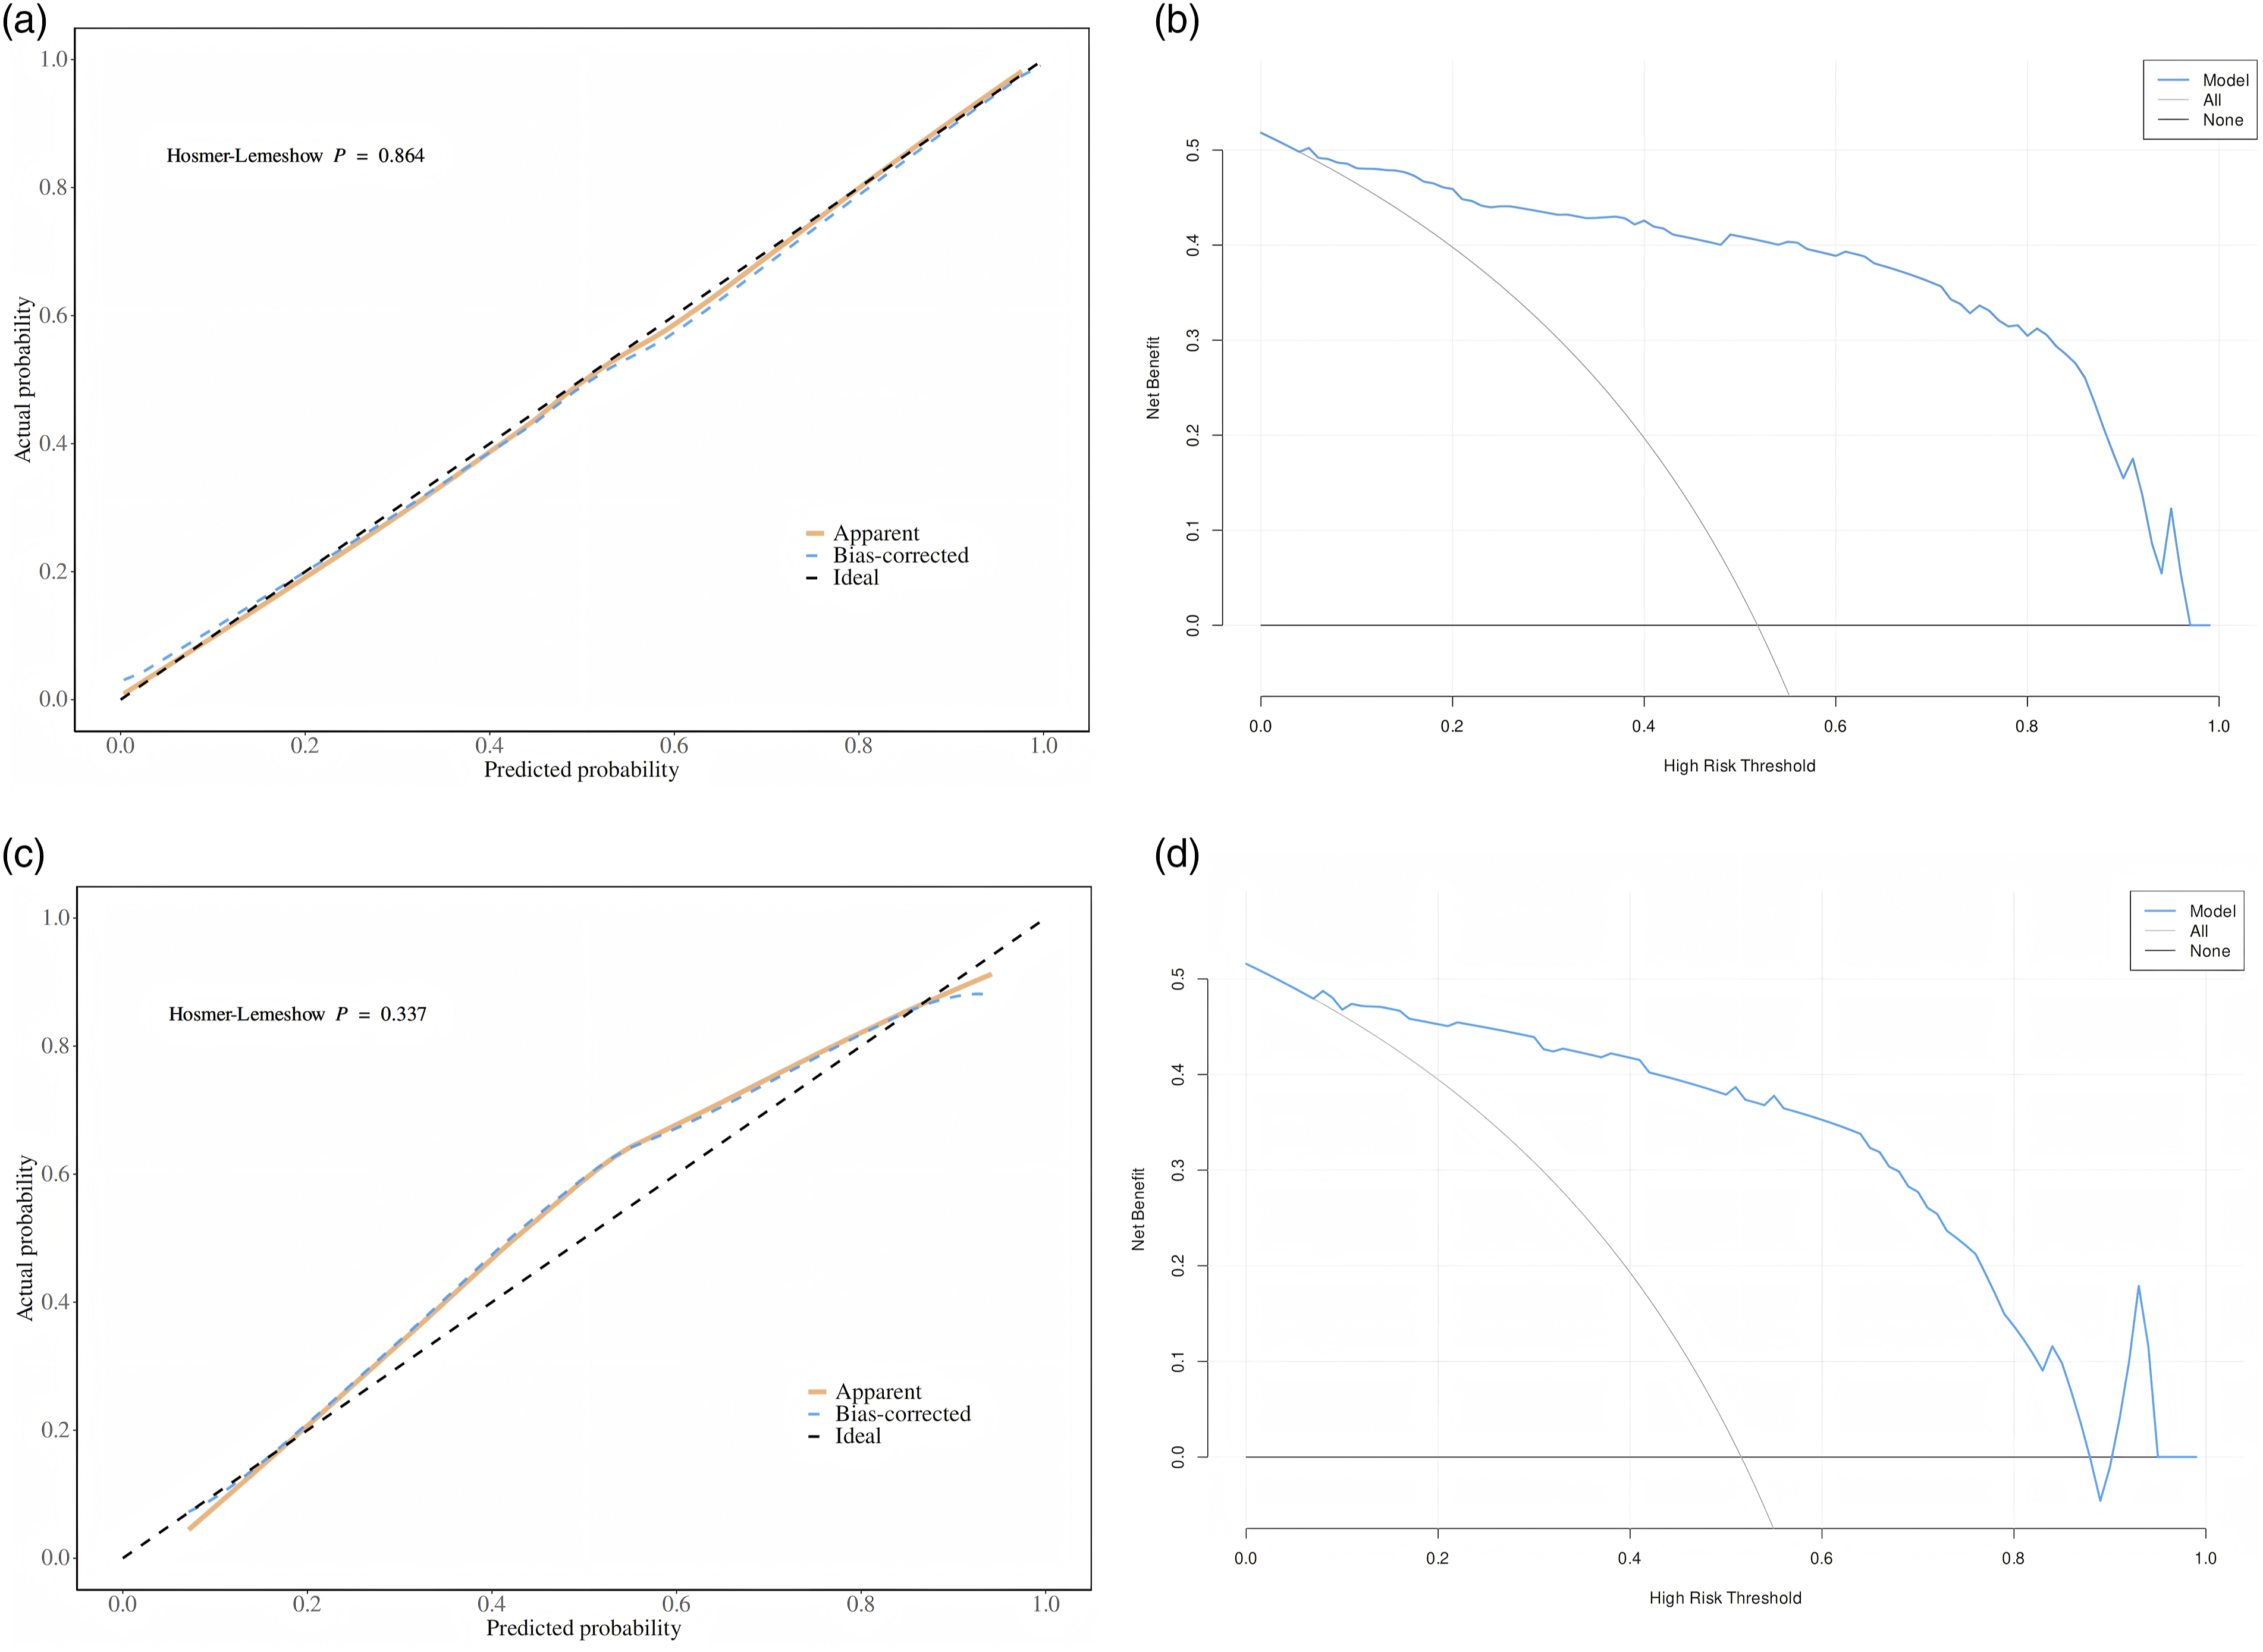
3.7. Analysis of patient-level cluster effects
Results of multivariable analysis using mixed-effects logistic regression.
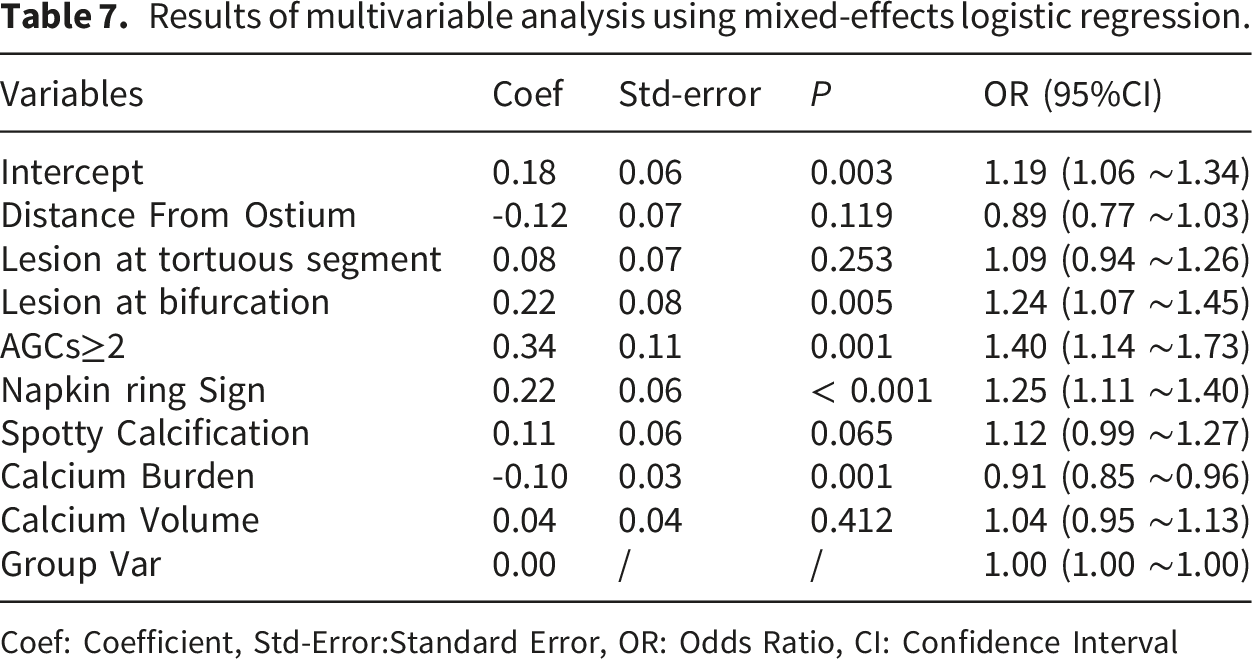
Coef: Coefficient, Std-Error:Standard Error, OR: Odds Ratio, CI: Confidence Interval
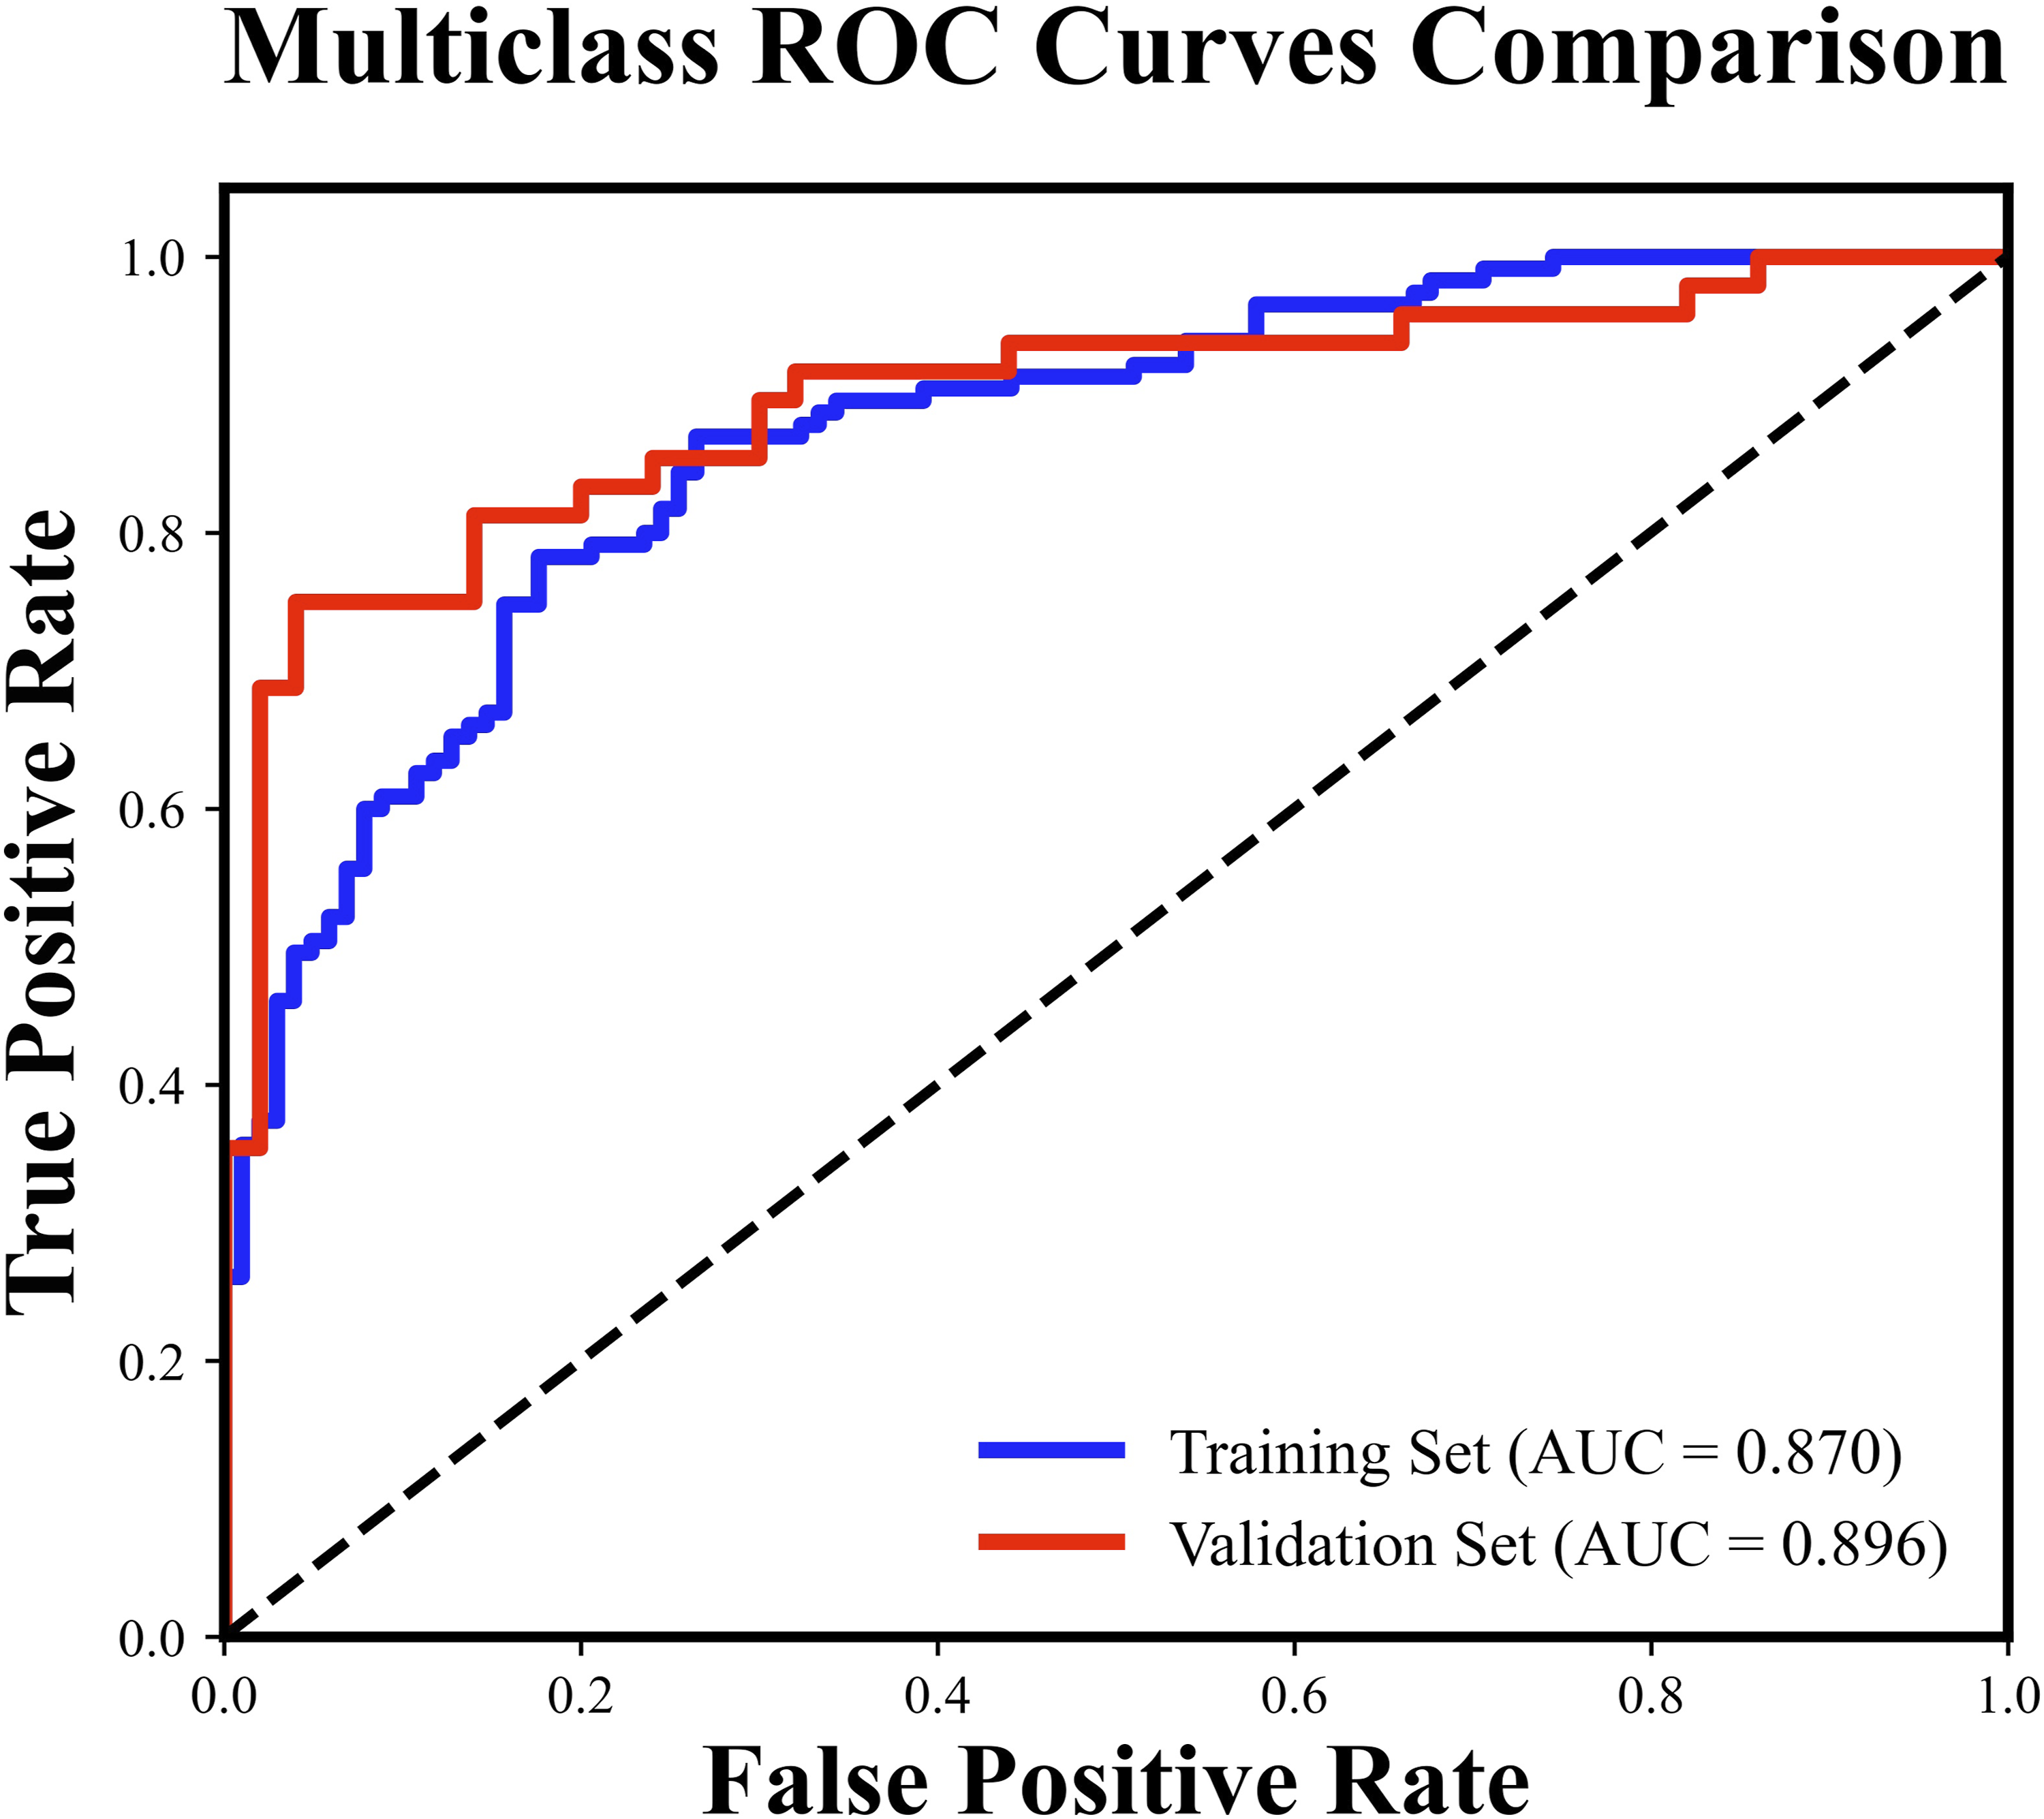
ROC curves of the training and validation sets for the mixed-effects logistic regression model.
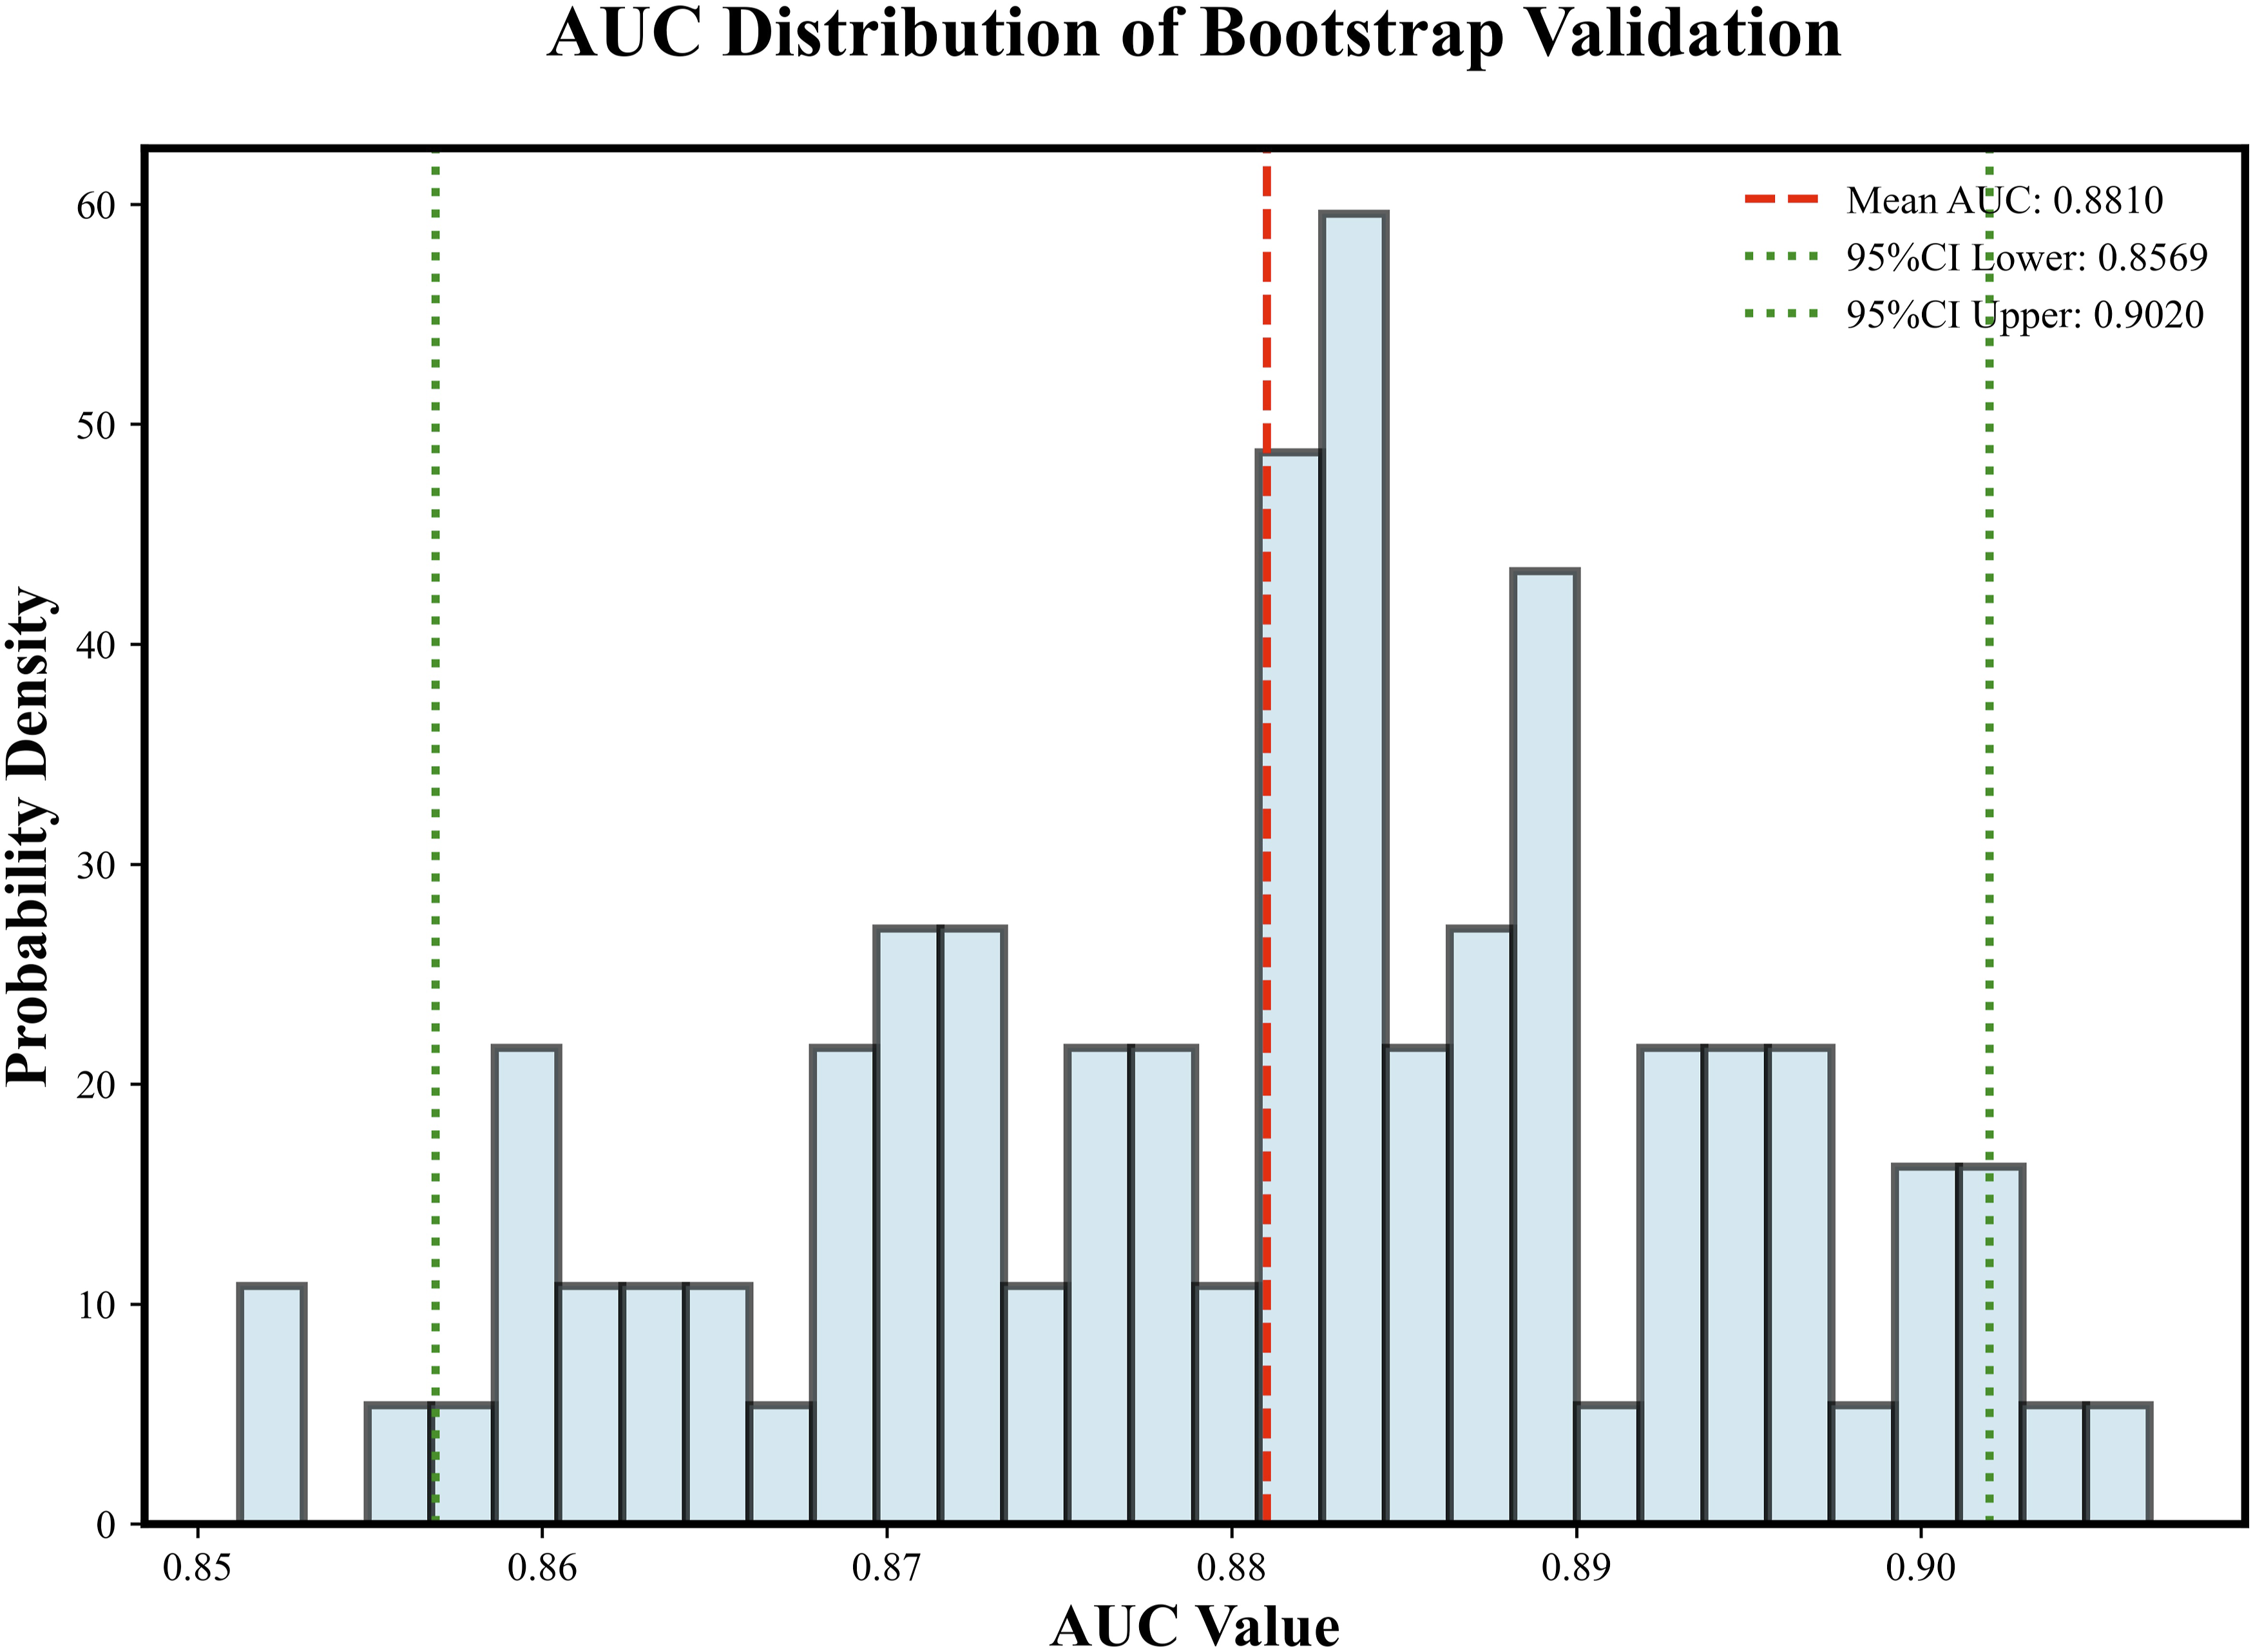
Histogram of the AUC distribution under Bootstrap validation.
4. Discussion
This study examines the risk factors associated with culprit lesions in patients with NSTE-ACS. It develops and validates a novel predictive model for identifying these culprit lesions, alongside a nomogram designed for early detection. This model is applicable to patients with NSTE-ACS and is used as a non-invasive decision-making support tool after completion of CCTA and prior to ICA. It aids in identifying potential culprit vessels, thereby guiding the surgical strategy for invasive coronary angiography. The study provides reliable diagnostic tools, which include factors such as the degree of luminal stenosis, the presence of a napkin ring sign, the load of necrotic core, the location of the lesion within a tortuous vessel, the origin of collaterals within the lesion, and AGCs ≥ 2. Our findings indicate that the calibration plot demonstrates a strong correlation between actual and predicted diagnoses, and the validation set exhibits substantial stability. Furthermore, the clinical decision curve derived from the optimal model suggests that it can effectively guide clinical decision-making in the majority of cases, ultimately yielding greater benefits. Finally, an analysis using mixed-effects logistic regression was conducted, revealing that the clustering effect among multiple vessels within the same patient is relatively weak. After adjusting for the clustering effect at the patient level, the model still demonstrates reliable predictive performance and clinical applicability.
Lumen stenosis is a direct manifestation of coronary atherosclerosis. It is influenced by patient-specific factors such as smoking, diabetes, hyperlipidemia, and inflammatory and immune responses within the vessel, which can induce the formation of unstable plaques. This process may ultimately lead to plaque erosion, rupture, and thrombus formation, thereby resulting in the occurrence of NSTE-ACS. The formation of thrombi typically occurs due to the rupture of unstable plaques or the exposure of their internal lipid core, which activates the blood coagulation mechanism, leading to thrombus embolism within the vessel. Consequently, this results in insufficient coronary blood supply, ultimately causing myocardial injury or myocardial infarction.1–3 This study demonstrates that the degree of luminal stenosis is highly correlated with the formation of culprit lesions in NSTE-ACS and serves as an independent predictor for identifying these lesions. Luminal stenosis obstructs blood flow through the coronary arteries, thereby reducing myocardial blood supply. As the severity of stenosis increases, the restriction of blood flow becomes more pronounced, leading to an insufficient blood supply to the myocardium and subsequent myocardial injury.17,18 However, relying solely on the parameter of diameter stenosis for the assessment of coronary lesions has its limitations, 24 particularly in CCTA images, where calcified plaques may introduce artifacts that affect the accurate measurement of the diameter stenosis. Furthermore, patient-specific factors, such as heart rate and respiratory function, can also influence the assessment of stenosis severity. 1 Therefore, by combining the analysis of high-risk plaque characteristics and the internal components of the plaque, a more comprehensive assessment of the risk of plaque rupture can be achieved.25,26 Research by Han D et al. 18 have shown that the napkin-ring sign is a significant predictor of NSTE-ACS occurrence. In the evaluation of HRP imaging characteristics in this study, after multivariable adjustment, only the napkin ring sign remained independently associated with culprit lesions. This may stem from the high pathological specificity of the napkin ring sign for vulnerable plaques. On CCTA imaging, the napkin ring sign is characterized by a central low-attenuation component surrounded by a high-attenuation rim, which is believed to reflect a lipid-rich necrotic core, intraplaque inflammation, and thinning or rupture of the fibrous cap. 21 Therefore, compared to other high-risk plaque features, the napkin ring sign better represents a comprehensive imaging phenotype of plaque vulnerability rather than a single morphological change. In contrast, positive remodeling and low-attenuation plaques had a very high incidence in this study cohort, which may weaken their ability to differentiate between culprit and non-culprit lesions. Although spotty calcification is generally regarded as a marker of plaque vulnerability, its pathological significance is heterogeneous, depending on the size, distribution, and maturity of the calcification.17,21 Analyzing the quantitative parameters of plaques through CCTA images allows for an accurate determination of the proportions of various components within the plaque, which is significant for predicting plaque rupture and the occurrence of related adverse cardiac events.17,27 A study by Suzuki K et al. demonstrated 28 that plaque rupture is closely related to the proportion and burden of necrotic core components within the plaque. The necrotic core is primarily composed of lipid substances, necrotic cell debris, inflammatory factors, and a small amount of calcified particles. When the proportion of the necrotic core is large, the fibrous cap is typically thin, rendering the plaque more susceptible to rupture. An increase in the burden of necrotic core plaque further indicates a higher likelihood of plaque rupture, thereby inducing the occurrence of NSTE-ACS. This study found that the burden of necrotic core components is an independent predictor for identifying culprit lesions in NSTE-ACS, further emphasizing the critical role of necrotic core components in the identification of culprit lesions. In the analysis using a mixed-effects logistic regression approach, we found that an increase in calcified plaque burden is negatively correlated with the formation of culprit lesions. Previous studies have indicated that an increase in calcified components can enhance plaque stability, thereby reducing the risk of plaque rupture. 1 Although earlier research suggested that punctate calcification may be associated with inflammation and indicate vulnerability, 28 the overall increase in calcification burden may imply that the plaque has entered a more stable phase, which our study further corroborates.
In addition to diameter stenosis and plaque characteristics, the geometric morphology of the coronary arteries significantly influences the occurrence, development, and prognosis of NSTE-ACS.9,29 Previous studies have confirmed18,29 that the occurrence of Major Adverse Cardiac Events (MACE) is associated not only with severe coronary obstruction but also closely linked to the overall plaque burden in the coronary artery tree. Experimental studies using CAG as the evaluation criterion have shown30,31 that thrombotic occlusions leading to acute coronary syndrome tend to occur in the proximal third of the coronary arteries. By assessing the distance between the plaque and the coronary sinus ostium, it is possible to effectively identify potential precursor lesions of the culprit and predict the risk of future acute coronary events. However, this study did not find that the distance between the plaque and the coronary sinus ostium has independent predictive value for identifying the culprit vessel in NSTE-ACS, which may be due to individual differences and the clinical characteristics of the included subjects. Among the included cases, 84 patients had multivessel disease. Using CAG as the gold standard, a total of 152 culprit vessels were identified, with a relatively even distribution between culprit and non-culprit vessels. This may lead to increased sample heterogeneity, thereby diminishing the predictive power of this indicator for culprit vessels. Nonetheless, the results hold scientific significance, reflecting the diversity and individualized characteristics present in clinical reality, indicating that the clinical features of different patients may require more detailed analysis and personalized risk assessment. Apart from plaque location, other vascular geometric characteristics, namely coronary tortuosity and bifurcation, also play significant roles in the occurrence and progression of NSTE-ACS.31,32 Firstly, coronary tortuosity is a common imaging finding in CCTA examinations and is associated with aging, hypertension, atherosclerosis, and other diseases. The study by Yurdam FS et al. 33 indicates that coronary tortuosity is closely related to coronary atherosclerosis, which can lead to changes in local hemodynamics, thereby inducing the erosion or rupture of coronary plaques and resulting in the occurrence of major adverse cardiovascular events (MACE). This study has demonstrated that coronary tortuosity is an independent predictor of culprit vessels in NSTE-ACS, consistent with the conclusions of previous studies. Secondly, the coronary artery bifurcation is also considered a high-risk area for the occurrence of coronary atherosclerosis and culprit lesions. 34 Due to alterations in blood flow patterns, vascular bifurcations typically exhibit complex hemodynamic characteristics, such as secondary flows and elevated shear stress. These factors can facilitate the accumulation of lipids, cholesterol, and other blood components on the vessel walls, leading to the formation of atherosclerosis. 32 The auxiliary diagnostic model constructed based on the aforementioned CCTA features demonstrated outstanding performance and potential. The total number of vessels analyzed in this study (n=315) and the number of outcome events (culprit vessels, n=152) surpasses the scale reported in similar preliminary studies. 35 This study evaluated the diagnostic efficacy of the model by employing a multifactorial regression model combined with bidirectional stepwise regression, thereby exploring the application value of different categories of models in identifying culprit vessels. Due to the inclusion of numerous CCTA characteristics in this study, which encompass multiple dimensions such as lumen stenosis, HRP features, quantitative plaque parameters, and vascular geometry, there may be information overlap or correlation among some variables. Directly incorporating all variables into a multifactorial model could lead to excessive model complexity, unstable coefficients, and overfitting. Therefore, an initial screening is conducted through univariate logistic regression, followed by bidirectional stepwise regression to further optimize the predictive factors. This approach aids in maintaining clinical information while reducing redundant variables, thereby enhancing the model’s simplicity and interpretability. The stepwise regression method is not a purely mechanical selection devoid of clinical significance, but is conducted within a clear imaging and pathological framework. 36 Subsequently, three predictive models were constructed by gradually incorporating different variable combinations—encompassing four categories of factors: diameter stenosis, high-risk plaque characteristics, quantitative plaque parameters, and coronary geometry. These models were then validated using multivariate logistic regression.The model evaluation results indicate that the AUC values for all three models exceeded 0.90, demonstrating strong diagnostic efficacy. Among these, Model 3 achieved the highest AUC value, reflecting its superior predictive capability. This model exhibited high accuracy, with a training set accuracy of 0.90 and a validation set accuracy of 0.86, facilitating accurate sample classification. Furthermore, the model displayed commendable sensitivity and specificity, with a training set sensitivity of 0.92 and a validation set sensitivity of 0.89, signifying a robust ability to identify culprit lesions. The training set specificity was recorded at 0.87, while the validation set specificity was 0.84, underscoring the model’s effectiveness in correctly identifying non-culprit lesions. Additionally, the predictive value of the model is reliable, as evidenced by a PPV of 0.87 and an NPV of 0.93 in the training set, alongside a PPV of 0.84 and an NPV of 0.89 in the validation set. This indicates that the model’s predictions for both positive and negative outcomes are highly trustworthy. This study employs various methods to reduce the risk of overfitting and validate the robustness of the model. Firstly, the model exhibits consistent performance across various metrics in both the training and validation sets, with no significant fluctuations. This consistency indicates that the model possesses excellent stability and generalization ability, maintaining relatively stable predictive performance across different datasets.This consistency suggests that the model possesses strong stability and generalization capabilities, maintaining relatively stable performance across different datasets. Meanwhile, the EPV calculated based on the optimal model is approximately 25, which is above the minimum threshold of 10. This indicates that the risk of model overfitting is relatively low and supports the stability of the model estimates.These findings indicate that the incorporation of parameters related to coronary diameter stenosis, high-risk plaque characteristics, and plaque composition analysis—particularly when combined with vascular geometric morphology features—can significantly enhance the identification efficacy of culprit vessels, thereby demonstrating higher accuracy and reliability in predicting these vessels. The nomogram constructed based on this model is suitable for evaluating the study population. The consistency between the model’s predicted values and the actual diagnostic results was assessed through calibration curves, which indicated a good fit between the two. This finding suggests that the model’s predictions are statistically reliable, providing a more comprehensive and objective method for identifying pathological lesions. Furthermore, the DCA chart derived from this model demonstrates its capability to guide clinical decision-making in the vast majority of cases, potentially yielding greater benefits. After correcting for the clustering effect between the internal vessels of patients using a mixed-effects logistic regression model, the results showed a low ICC (ICC = 0.0002). This suggests that the correlation between multiple vessels within the same patient is not significant, indicating that the occurrence of culprit vessels is influenced not only by significant systemic factors of the patients but also by local plaque characteristics and geometric morphology. 37 A lower ICC does not imply that the mixed-effects model lacks value. On the contrary, this result suggests that the clustering effect within patients is weak, and the estimates from the standard logistic regression model are less likely to be significantly biased due to the intra-patient correlation. Additionally, the introduction of mixed-effects models can serve as a robustness and sensitivity analysis method to evaluate the impact of potential clustering effects on the model results, thereby further supporting the stability and reliability of the model conclusions. The model constructed based on the mixed-effects logistic regression method demonstrated excellent diagnostic performance, with AUCs of 0.870 and 0.896 for the training and validation sets, respectively. The mean AUC validated by the Bootstrap method was 0.881 (95% CI: 0.86-0.90), and the average AUC from 5-fold cross-validation was 0.866 ± 0.051, indicating that the model has robust discriminative ability and a low risk of overfitting. The above results further support the conclusion that the model exhibits good internal stability and a low risk of overfitting.
Although this study achieved favorable results in model construction and validation, several limitations warrant further exploration. First, all research results of this study are derived from a single center. Although internal validation through bootstrapping and cross-validation suggests good model stability, the lack of external validation leaves the generalizability of this model in other scenarios unclear. Future multi-center studies, supplemented by external validation, are urgently needed to confirm the robustness and clinical applicability of this model. Secondly, the retrospective and single-center design of this study inevitably introduces selection bias. This study only included patients who underwent both CCTA and ICA, resulting in a study cohort that is more biased towards patients with a high clinical suspicion of coronary artery disease, positive CCTA results, or significant symptoms. This may limit the model’s application value in low-risk populations and those receiving non-invasive conservative treatment. Future prospective studies will consider continuously including all patients with NSTE-ACS and conducting follow-ups to validate the model in a more representative research context. Furthermore, the determination of culprit lesions in this study relied on the results of invasive coronary angiography as the gold standard and followed the ROMICAT criteria for assessment, a method that has been repeatedly used in previous CCTA studies and has high clinical acceptability. However, the lack of functional or intravascular imaging confirmation may introduce discrimination bias, potentially affecting the model’s accuracy. In the future, we will consider using intravascular imaging as the gold standard to further validate the diagnostic value of this model. Finally, this model is primarily constructed based on CCTA imaging and anatomical metrics. Due to the lack of software capable of providing hemodynamic data, parameters such as wall shear stress were not included in this study. Future research will attempt to integrate such functional parameters with existing models through computational fluid dynamics simulations, aiming to establish a more comprehensive assessment system and enhance the model’s predictive power and clinical applicability.
5. Conclusion
The degree of luminal stenosis, the napkin ring sign, necrotic core burden, the location of the lesion within a tortuous vessel, the presence of collateral origins within the lesion, and AGCs ≥ 2 have been confirmed as independent predictors of NSTE-ACS culprit lesions. The preoperative auxiliary diagnostic model based on CCTA demonstrates high predictive ability. Notably, the introduction of vascular geometric features enhances the predictive performance of the model, providing a more clinically valuable tool for the accurate identification of NSTE-ACS culprit lesions.
Footnotes
Acknowledgments
We thank all patients, their families and all investigators involved in the present study. We extend our gratitude to the Key Laboratory of Cardiovascular Imaging Medicine in Liaoning Province, China, for developing the TimeSlice platform (![]() ), which offers technical assistance and valuable tools for the analysis of coronary artery data.
), which offers technical assistance and valuable tools for the analysis of coronary artery data.
Author contributions
All authors contributed to the study conception and design. Material preparation, data collection and analysis were performed by Peng You, Ying Zhang, Congzhen Jia, Meng Wei and Zhen Lei. The first draft of the manuscript was written by Peng You and all authors commented on previous versions of the manuscript. All authors read and approved the final manuscript.
Funding
The authors received no financial support for the research, authorship, and/or publication of this article.
Declaration of conflicting interests
The authors declared no potential conflicts of interest with respect to the research, authorship, and/or publication of this article.
Data Availability Statement
The data generated in this study are strictly governed by our institution's data security policy and therefore cannot be publicly shared.