
Abstract
Objective
This cross-sectional study aimed to examine the association between combined healthy lifestyle factors and the prevalence of osteoarthritis (OA) among middle-aged and older U.S. adults using nationally representative data from the National Health and Nutrition Examination Survey (NHANES).
Methods
Data were collected from 15,617 adults participating in NHANES (2005–2020). A healthy lifestyle score (range 0-6) was constructed based on six modifiable factors: smoking status, alcohol consumption, physical activity, diet quality, waist circumference, and sleep duration. Weighted multivariable logistic regression models were utilized to analyze the relationships between healthy lifestyle scores and the prevalence of OA, controlling for demographic, socioeconomic, and health-related variables. Robustness was assessed through stratified, interaction, and sensitivity analyses, including propensity score adjustment, E-value analysis, and restricted cubic spline modeling.
Results
Among 15,617 participants, OA was present in 2,275 individuals. In the crude model, the association between the healthy lifestyle score and OA was not statistically significant for the per-factor trend. After adjustment for covariates, a higher healthy lifestyle score was significantly associated with lower odds of OA. Participants with 5–6 healthy lifestyle factors had 31% lower odds of OA, and each additional factor was associated with 7% lower odds of OA. Key factors associated with lower odds of OA included non-smoking, optimal waist circumference, and adequate sleep. The association was more pronounced in adults under 60 years. Sensitivity analyses confirmed a consistent inverse association between the lifestyle score and OA odds.
Conclusions
Our findings suggest that adherence to a greater number of healthy lifestyle factors may be associated with lower odds of OA, particularly among younger adults. Notably, smoking avoidance, maintaining optimal waist circumference, and adequate sleep duration demonstrated particularly robust inverse associations. These results highlight the potential of integrated lifestyle modifications for OA-related public health strategies at both individual and population levels.
Keywords
Introduction
Osteoarthritis (OA) is the most common form of arthritis and a major cause of disability among middle-aged and older adults worldwide. 1 It is characterized by the progressive degeneration of articular cartilage and subchondral bone, resulting in pain and functional impairment. 2 As populations age, OA imposes a growing burden on individuals and healthcare systems. 3 While aging and genetic predisposition are nonmodifiable risk factors, increasing evidence highlights the pivotal role of modifiable lifestyle behaviors—such as smoking, diet, physical activity, and sleep—in shaping OA risk and progression. 4 Importantly, the concept of “pre-osteoarthritis” has been proposed to capture the early, potentially reversible stages of the disease, during which lifestyle modifications may be most relevant.5–7
A growing body of epidemiological research suggests that maintaining healthy lifestyle patterns may be associated with OA prevalence and progression through both mechanical and metabolic pathways. 8 Recent studies have highlighted that OA is not merely a mechanical wear-and-tear disorder but rather a systemic and metabolically influenced disease, with distinct phenotypes, including a metabolic OA phenotype, characterized by obesity, dyslipidemia, and insulin resistance.9,10 However, most prior studies have focused on isolated lifestyle behaviors, often producing inconsistent or conflicting results regarding their individual impact. For instance, moderate physical activity may be associated with lower odds of OA, whereas occupational overuse can exacerbate joint stress.11,12 Likewise, poor sleep and obesity contribute to systemic inflammation and metabolic dysregulation, both key mechanisms in OA pathogenesis.
Despite these insights, few studies have evaluated the combined effect of multiple lifestyle behaviors.13–15 From a public health perspective, understanding how healthy behaviors interact synergistically could inform integrated health-promotion strategies, early interventions, and health promotion programs targeting aging populations.16,17 Comprehensive lifestyle-based health-promotion approaches have been increasingly advocated for OA management, including the 2021 EULAR recommendations and recent reviews emphasizing multi-domain behavioral interventions.4,18,19 Given the increasing prevalence of OA and the modifiable nature of these risk factors, identifying optimal lifestyle combinations represents a critical opportunity for risk-factor identification and health policy development.20–22
Therefore, this study aimed to examine the association between combined healthy lifestyle factors and the prevalence of OA among middle-aged and older U.S. adults using nationally representative data from the National Health and Nutrition Examination Survey (NHANES). We hypothesized that adherence to a greater number of healthy lifestyle factors would be associated with lower odds of OA in a dose-dependent manner.
Methods
Study population
NHANES is a comprehensive program aimed at evaluating the health and nutritional status of adults and children in the United States, conducting annual surveys of around 5,000 non-institutionalized civilians. The reporting of this study conforms to the Strengthening the Reporting of Observational Studies in Epidemiology (STROBE) guidelines. 23 This study was conducted in accordance with the Declaration of Helsinki of 1975 as revised in 2024. The original NHANES protocol was reviewed and approved by the National Center for Health Statistics (NCHS) Research Ethics Review Board, and all participants provided written informed consent at the time of enrollment. Because the present analysis used only de-identified, publicly available NHANES data, additional ethical review was waived by our institutional review board, and all patient information was de-identified prior to analysis.
For the purpose of eligibility screening in this cross-sectional study, we selected a cohort of 29,231 adults aged 40 to 79 from NHANES cycles conducted between 2005 and 2020. A total of 17,034 adults remained in the study after excluding 77 individuals lacking arthritis data and 12,120 individuals with incomplete lifestyle information. Additionally, 1,417 participants who lacked covariate data were also omitted. Consequently, the final sample for this cross-sectional study comprised 15,617 middle-aged and older adults. All patient details in this study are de-identified. Figure 1 provides a detailed overview of the eligibility screening process. Flow of eligible participants selection.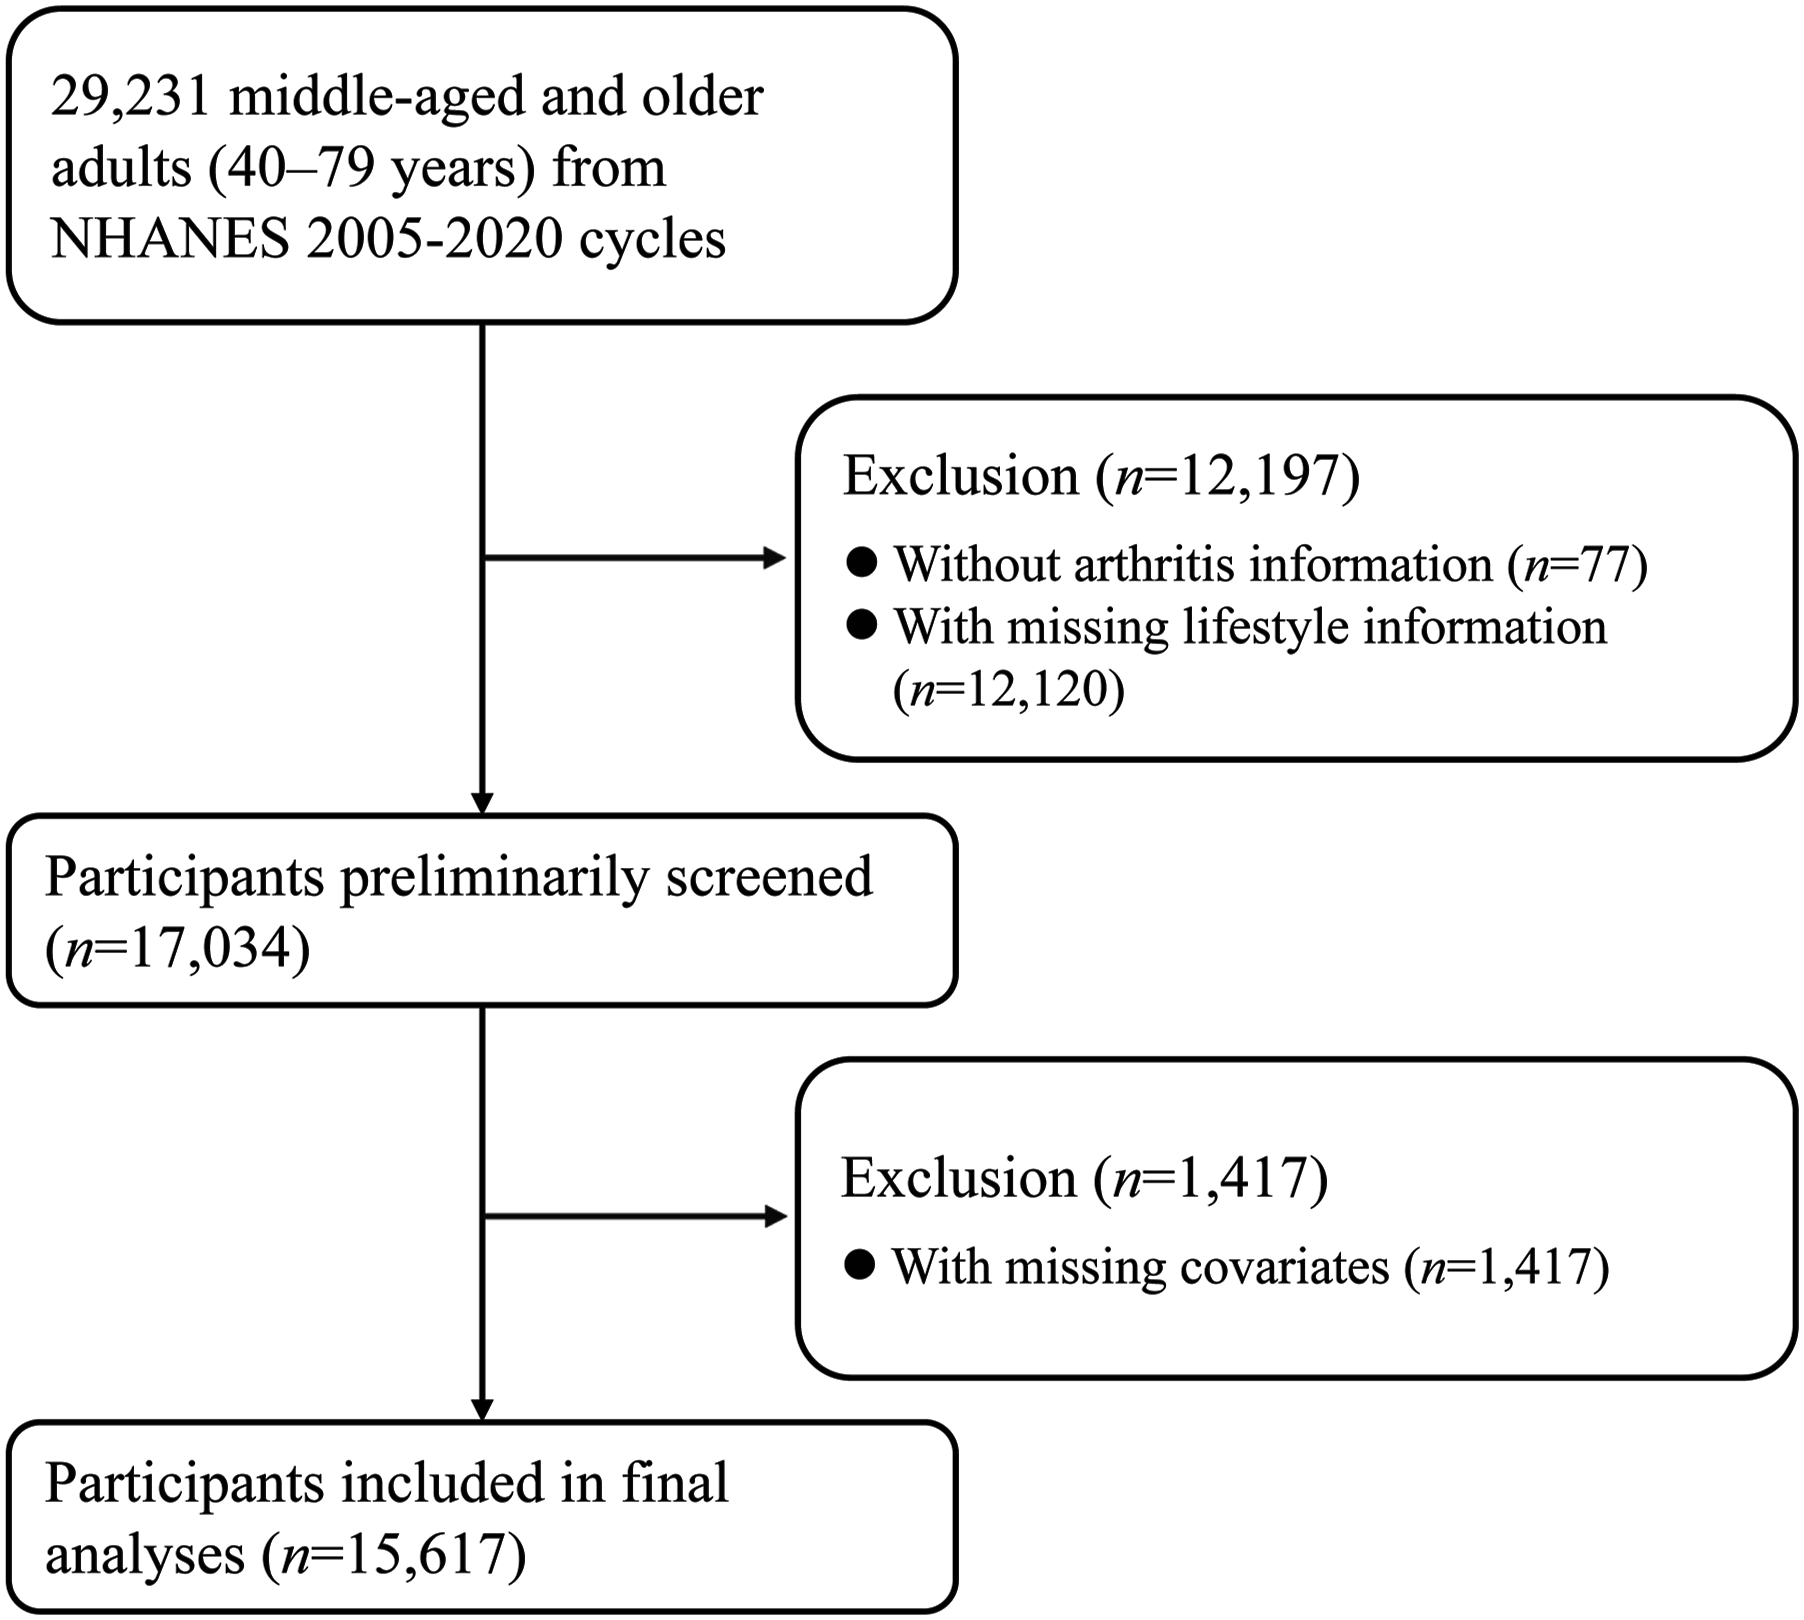
Handling of missing data
Missing data were handled using complete-case analysis. Specifically, participants with missing values for any covariates (including smoking status, alcohol consumption, physical activity, diet, waist circumference, or sleep duration) were excluded from the analysis. This complete-case approach excluded 13,614 of 29,231 initially eligible participants, corresponding to approximately 46.6% of the eligible sample. We assessed the missing data patterns to determine if they were missing completely at random, missing at random, or missing not at random. To evaluate the potential for selection bias introduced by complete-case analysis, we compared baseline characteristics (age, sex, race/ethnicity, education, income, and available lifestyle factors) between included participants (n = 15,617) and those excluded due to missing data (n = 13,614). The comparison showed that excluded participants were slightly older, had a higher proportion of non-Hispanic Black individuals, lower education levels, and lower family PIR, suggesting that the analytic sample may underrepresent socioeconomically disadvantaged subgroups. Because these excluded participants had characteristics associated with both lifestyle patterns and OA prevalence, complete-case analysis may have introduced selection bias; the direction of this bias is uncertain, but underrepresentation of older and socioeconomically disadvantaged participants could have led to underestimation of OA prevalence or attenuation of the observed associations. Sensitivity analyses were performed to examine the robustness of the results to different approaches for handling missing data.
Construction of healthy lifestyle score
A healthy lifestyle score was established by summing behavioral and metabolic/body-composition factors, which include current nonsmoking status, low-to-moderate alcohol consumption, adequate physical activity, a healthy diet, optimal waist circumference, and sufficient sleep duration.24–26 A score from 0 to 6 represented the healthy lifestyle score, where higher values denoted healthier living. Table S1 displays the definitions of healthy lifestyle factor levels. Waist circumference was included in the composite score as a proxy for central adiposity and metabolic health status. Although it reflects body composition rather than a discrete behavior, central adiposity is a well-established modifiable risk factor for OA that integrates the cumulative effects of dietary habits, physical activity, and metabolic function.9,10 Its inclusion is consistent with prior composite lifestyle scoring systems used in large epidemiological studies.24–26 Accordingly, the composite score should be interpreted as a combined behavioral and metabolic/body-composition index rather than a score composed exclusively of discrete lifestyle behaviors. Physical activity and diet measures are simplified proxies in our study and cannot comprehensively assess the lifestyle; hence, measurement error should be acknowledged.
Definition of OA
The determination of OA was done through a self-report questionnaire. Specifically, participants were asked: “Has a doctor or other health professional ever told you that you had arthritis?” Those who answered “yes” were then asked a second question: “Which type of arthritis was it?” Participants were classified as having OA based on their self-report of physician-diagnosed osteoarthritis. It should be noted that this approach is subject to potential misclassification. Self-reported physician-diagnosed OA in NHANES has not been validated against radiographic criteria, and this case definition may lead to both underascertainment of early or asymptomatic OA and misclassification between arthritis subtypes. 27 If this outcome misclassification is nondifferential with respect to lifestyle status, it would generally be expected to bias the observed associations toward the null.
Assessment of covariates
Information on demographics, socioeconomic status, and lifestyle was obtained by trained interviewers using a computer-assisted personal interview system. Race and ethnicity were classified into non-Hispanic white, non-Hispanic Black, Mexican American, and other groups. Marital status was divided into married, single (including widowed, divorced, separated, or never married), and cohabiting with a partner. The self-reported education levels were organized into under high school, high school, and higher than high school. The poverty-income ratio (PIR) for families was determined by dividing the family’s income by the poverty guidelines for the survey year to assess income status. Mercury sphygmomanometers were employed by examiners to measure blood pressure. A diagnosis of hypertension can be made if the systolic blood pressure is 140 mmHg or higher, the diastolic blood pressure is 90 mmHg or higher, a physician has diagnosed it, or if the individual is taking prescribed medication for it. Diabetes was identified by fasting plasma glucose levels of 126 mg/dL or more, HbA1c of 6.5% or higher, self-reported diagnosis by a physician, or the use of insulin or oral hypoglycemic agents.
Statistical methods
In our analyses, we incorporated sampling weights, strata, and primary sampling units to account for unequal selection probabilities and the oversampling of certain subpopulations. Continuous variables were expressed using weighted means and standard errors (SEs), whereas categorical variables were represented by numerical values and weighted percentages. For continuous variables, means were compared using linear regression, and for categorical variables, proportions were compared using logistic regression.
A weighted multivariable logistic regression model was utilized to examine the association between a healthy lifestyle score and the odds of OA. In multivariable model 1, we adjusted for age (<60, ≥60 years), sex (male, female), and race/ethnicity (non-Hispanic white, others). In multivariable model 2, we further adjusted for marital status (married, others), family PIR (<3.5, ≥3.5), education attainment (above high school, high school and below), hypertension (yes, no), and diabetes (yes, no). Additionally, we computed the multivariable-adjusted odds ratio and 95% confidence interval for OA in relation to each added healthy lifestyle factor. To examine whether the aforementioned confounders modified the association of healthy lifestyle score with OA status, we performed stratified and multiplicative interaction analyses. To examine the contributions of different lifestyle factors, we first assessed the associations of six lifestyle factors with OA, with all lifestyle factors mutually adjusted for. After that, we generated new healthy lifestyle scores by eliminating one lifestyle factor each time and made adjustments in the models for the eliminated factor.
To test the reliability of our results, the following sensitivity analyses were carried out. Initially, we reclassified healthy alcohol consumption as either none or low-to-moderate drinking (up to 28 grams per day for men and 14 grams per day for women). Secondly, propensity score adjustment was employed to address observed confounding. We performed an assessment of potential residual confounding utilizing E-values. These E-values represent the minimum strength of association, on the odds ratio (OR) scale, that an unmeasured confounder would need to exhibit with both the exposure and the outcome in order to fully account for the observed association between the exposure and outcome, after adjusting for the measured covariates.28,29 We ultimately created a weighted healthy lifestyle score to more precisely reflect the relative contribution of each healthy living element to the outcome. A score of 1 was allocated to individuals exhibiting a healthy lifestyle, while a score of 0 was assigned otherwise. The weighted standardized healthy lifestyle score was computed utilizing the β coefficients derived from a logistic regression model that incorporated all six lifestyle factors, with adjustments made for all covariates. The process involved multiplying each binary lifestyle factor by the β coefficients, summing the results, dividing by the sum of the β coefficients, and multiplying by 6. The weighted score, which spans from 0 to 6, takes into account the sizes of the adjusted OR for each lifestyle within each lifestyle pattern, combining six lifestyle factors. Subsequently, we divided the weighted lifestyle scores into quartiles to avoid extreme groupings. A restricted cubic spline (RCS) with three knots was utilized to depict the dose-response relationship between the weighted healthy lifestyle score and OA.
R version 4.4.2 was used for all statistical analyses, courtesy of The R Foundation for Statistical Computing in Vienna, Austria. A two-sided P-value of less than 0.05 was regarded as statistically significant.
Power analysis
A post-hoc power analysis was conducted to evaluate the adequacy of the sample size. Given the total sample size (N = 15,617), baseline OA prevalence (P0 = 0.17), observed odds ratio (OR = 0.93), and a significance level of α = 0.05, the calculated statistical power was 0.89. This indicates that the study had sufficient power to detect the observed association between healthy lifestyle scores and OA prevalence.
Model diagnostics
We evaluated potential multicollinearity among covariates using variance inflation factors (VIFs), and all VIF values were below 10, suggesting no serious multicollinearity. Because this study aimed to examine associations rather than build a predictive model, other model diagnostics (e.g., residual analysis and linearity in the logit) were not reported.
Results
Population characteristics
Characteristics of study participants.
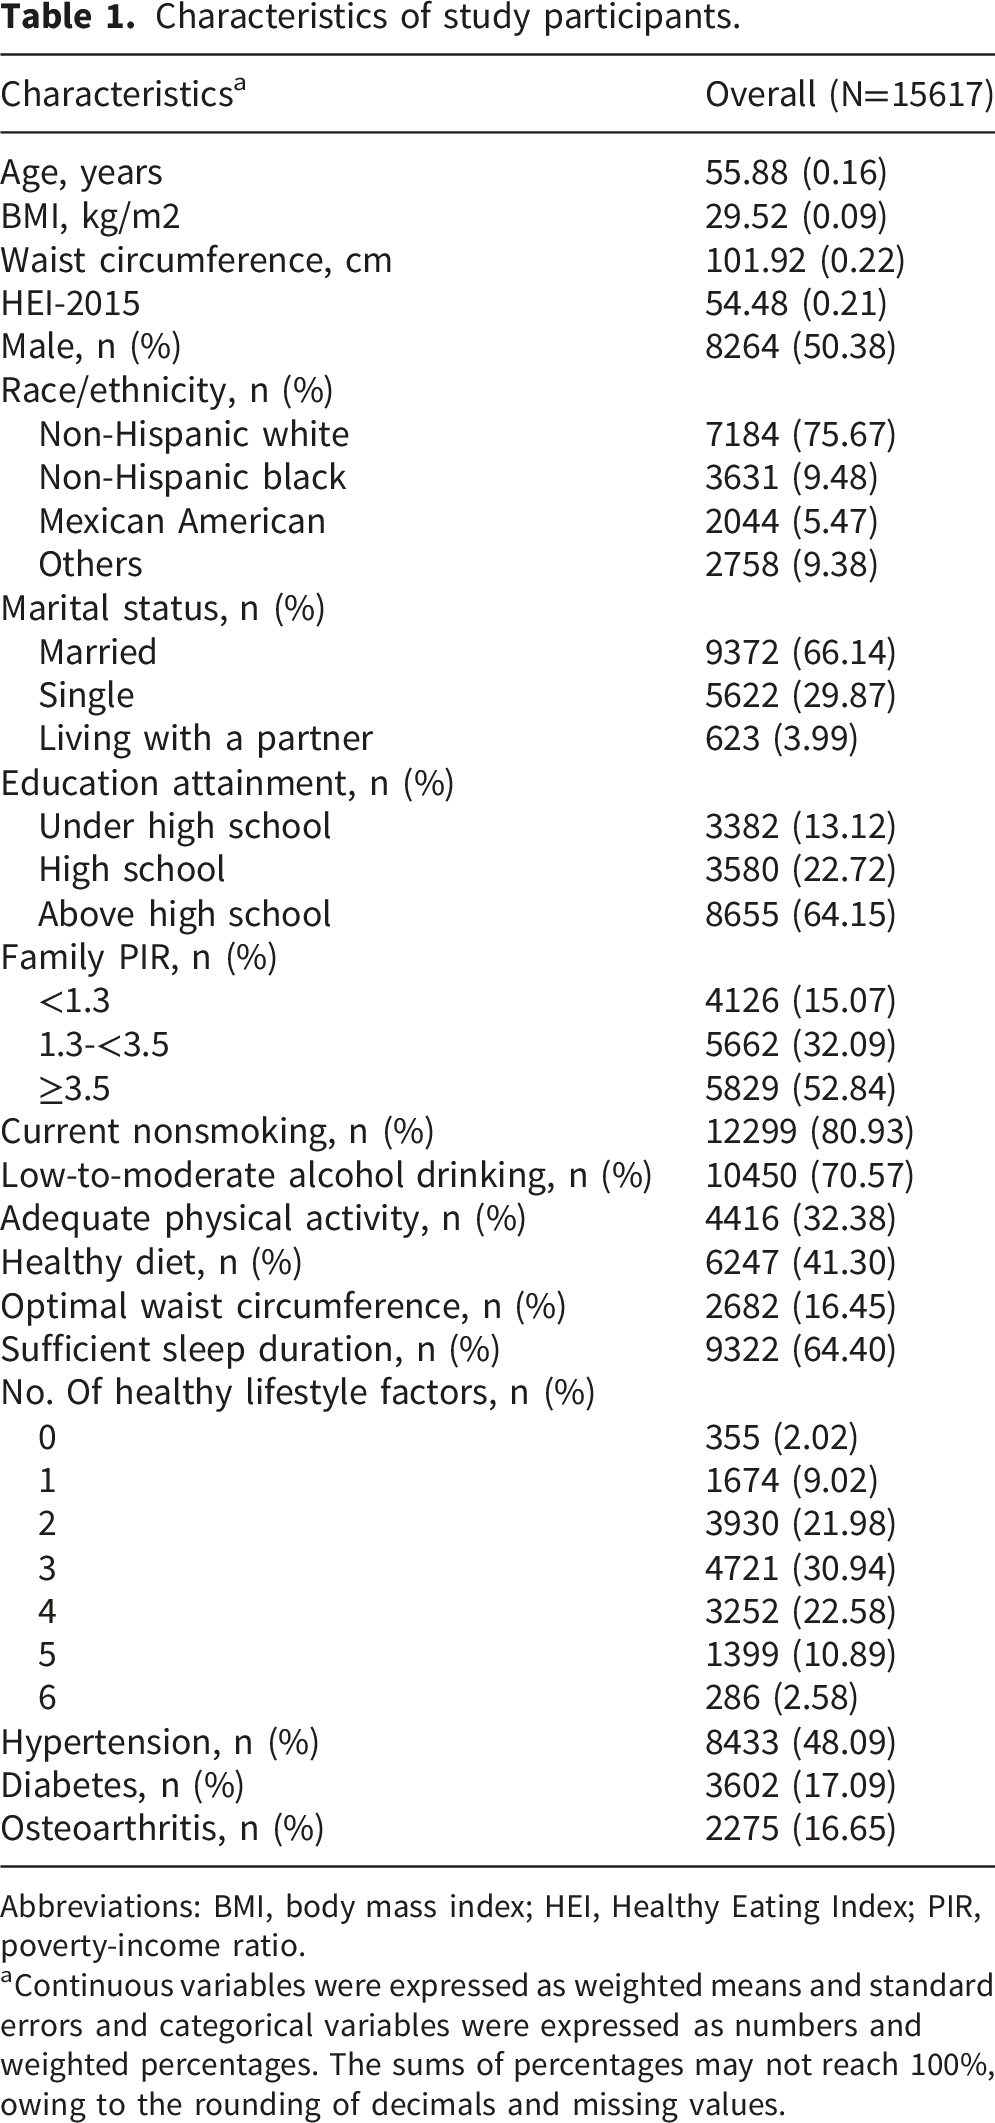
Abbreviations: BMI, body mass index; HEI, Healthy Eating Index; PIR, poverty-income ratio.
aContinuous variables were expressed as weighted means and standard errors and categorical variables were expressed as numbers and weighted percentages. The sums of percentages may not reach 100%, owing to the rounding of decimals and missing values.
Association of healthy lifestyle score with OA
Association of healthy lifestyle score with risk of osteoarthritis.
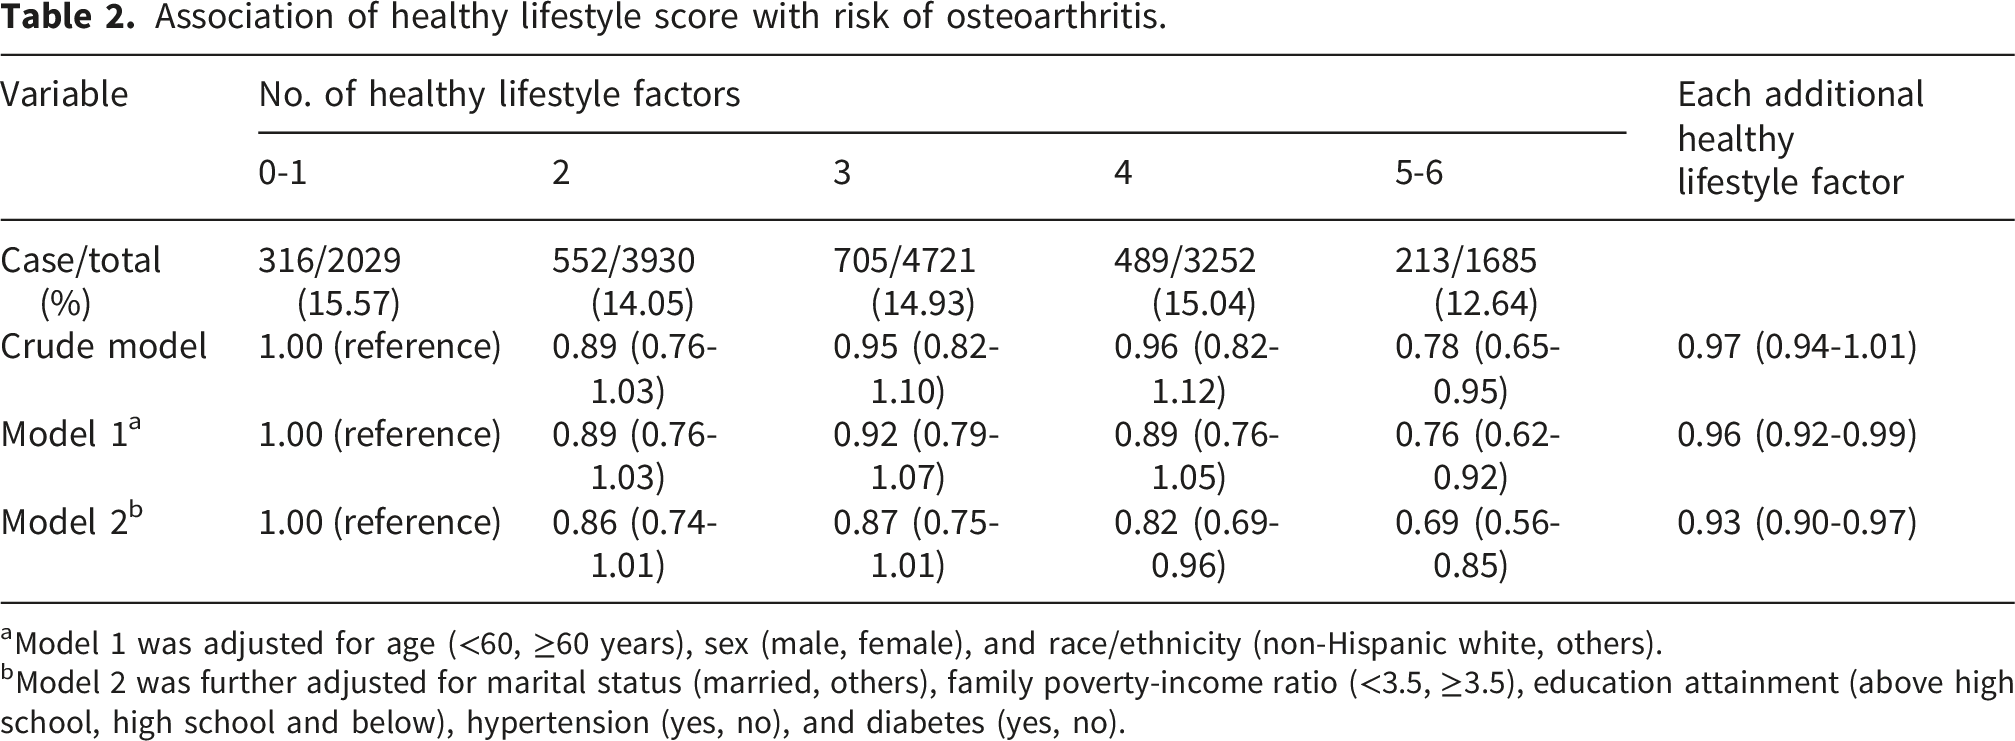
aModel 1 was adjusted for age (<60, ≥60 years), sex (male, female), and race/ethnicity (non-Hispanic white, others).
bModel 2 was further adjusted for marital status (married, others), family poverty-income ratio (<3.5, ≥3.5), education attainment (above high school, high school and below), hypertension (yes, no), and diabetes (yes, no).
Stratified, interaction, and sensitivity analyses
To examine whether the association between healthy lifestyle score and OA status was modified by confounders, including age, sex, race/ethnicity, marital status, family PIR, education attainment, hypertension, and diabetes, we performed stratified and interaction analyses (Table S3). A significant inverse association between healthy lifestyle score and OA was found among those aged <60 years, while combined healthy lifestyles were not significantly associated with OA among adults aged ≥60 years (P-interaction < 0.001). A significant age interaction in the association between combined healthy lifestyles and OA was found.
As for individual lifestyle factors, current nonsmoking, optimal waist circumference, and sufficient sleep duration were significantly associated with OA with ORs (95% CIs) of 0.88 (0.77–0.99), 0.68 (0.58–0.79), and 0.89 (0.81–0.98), respectively (Table S4). No significant correlations were observed between moderate alcohol consumption, adequate exercise, and a healthy diet with OA in mutually adjusted models. The link between five-component lifestyle scores and OA disappeared when adequate sleep duration was excluded from the score, with an OR (95% CI) of 0.87 (0.73–1.02) when comparing 4–5 to 0–1 healthy lifestyle factors (Table S5). We further performed the following sensitivity analyses to evaluate the robustness of our results and consistently observed the inverse association. The inverse association was consistently observed in sensitivity analysis redefining the healthy level of alcohol drinking (Table S6), with OR (95% CI) for OA associated with each additional healthy lifestyle factor being 0.93 (0.90–0.97). Applying PS adjustment to cope with observed confounders, the OR for OA comparing participants with 5–6 vs 0–1 healthy lifestyle factors was 0.71 (95% CI: 0.59–0.86) (Table S7). The E-value was 2.26 (Table S8), suggesting that it would take very strong confounding to negate the inverse association observed in our study. Finally, a weighted healthy lifestyle score was constructed to better reflect the relative contribution of each healthy lifestyle factor to the outcome. As shown in Table S9, optimal waist circumference contributed most to the weighted healthy lifestyle score (weighted β = 0.61). After adjusting for all covariates, adults with the highest weighted healthy lifestyle score quartile had 31% lower odds of OA (OR: 0.69, 95% CI: 0.60–0.81) as compared with those with the lowest weighted healthy lifestyle score quartile (Table S10). The RCS illustrated an inverse and linear dose-response relationship between the weighted healthy lifestyle score and OA (P-overall < 0.001, P-nonlinearity = 0.426) (Figure 2). Association of weighted healthy lifestyle score with odds of osteoarthritis. Line represents multivariable-adjusted OR, and shaded area represents 95% CI.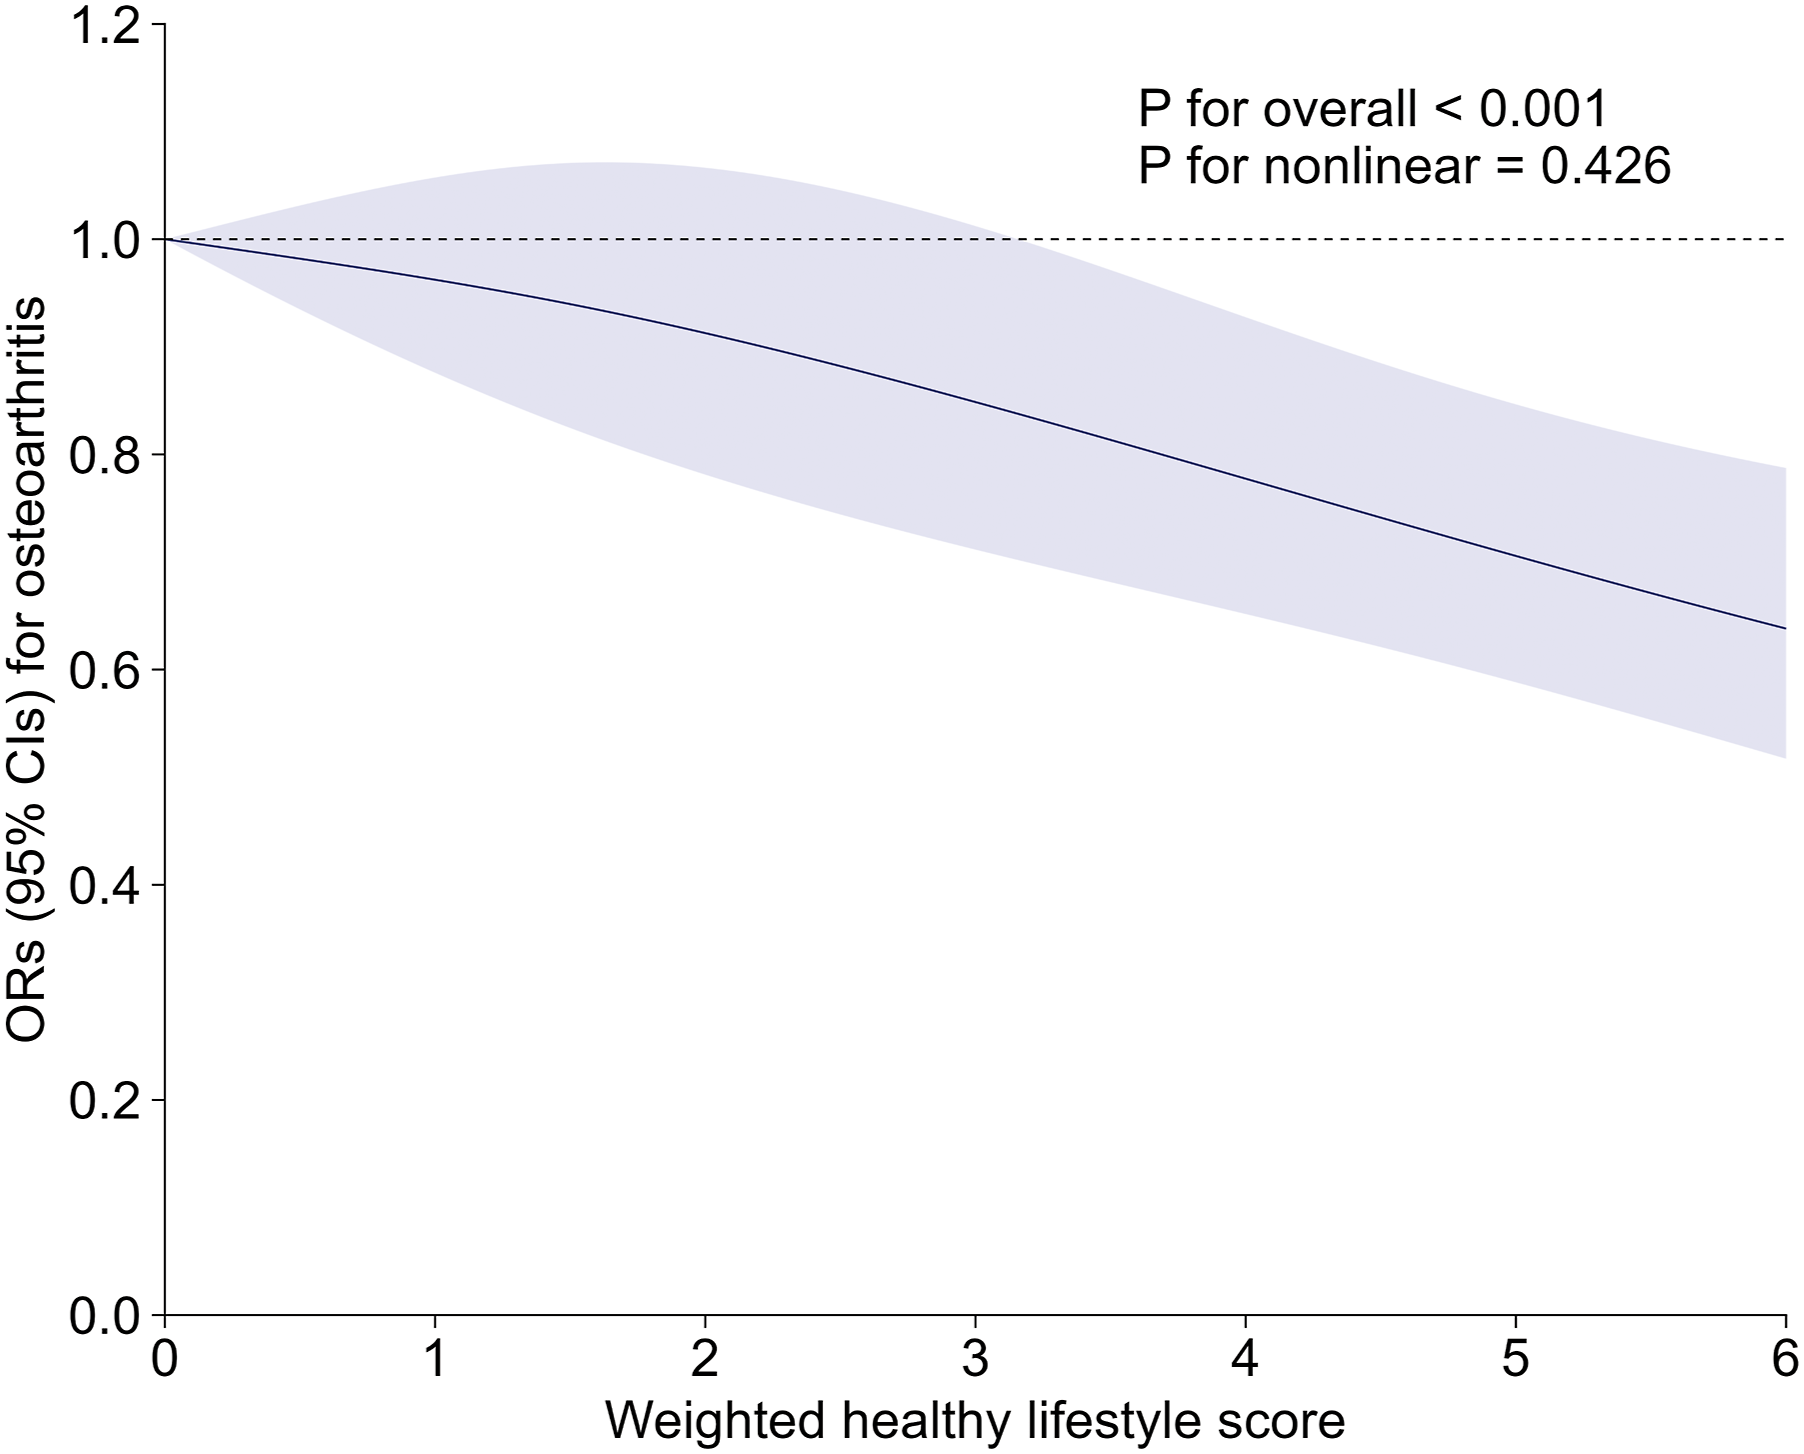
Discussion
In this cross-sectional study, we observed a significant inverse association between adherence to multiple healthy lifestyle factors and the prevalence of OA among middle-aged and older U.S. adults. Participants who followed a greater number of healthy behaviors demonstrated lower odds of OA, supporting the hypothesis that integrated lifestyle behaviors may have a joint inverse association with OA prevalence. These findings align with previous population-based studies that have reported similar inverse associations of composite health metrics on musculoskeletal outcomes. 30 For example, studies examining cardiovascular health scores have shown a graded inverse association with OA odds as adherence to healthy behaviors increases. 31
Therefore, our OR of approximately 0.69 for high versus low healthy scores aligns with previous studies that have also identified non-linear dose–response relationships. When examining individual factors, we determined that non-smoking, maintaining an optimal waist circumference, and obtaining adequate sleep were most strongly associated with lower odds of OA. These findings are consistent with previous research, as demonstrated by Zhu et al., who reported a higher prevalence of OA among current or former smokers compared to individuals who have never smoked, 32 and Antoine et al. showed that larger waist circumference strongly predicts knee OA independent of body weight. 33 Similarly, Ma et al. identified a U-shaped relationship between sleep duration and OA, wherein both insufficient and excessive sleep were associated with higher odds of OA. 34 In our study, maintaining 7–8 hours of sleep, as opposed to insufficient or excessive sleep, was associated with lower odds of OA. In conclusion, our findings support and expand upon recent research by illustrating that the combination of multiple lifestyle components may show significant inverse associations with OA.
Notably, physical activity and a healthy diet were not significantly associated with OA in our mutually adjusted models. This finding should not be interpreted as evidence of a true absence of association; rather, it may reflect measurement simplification, including dichotomous physical activity thresholds and broad diet-quality scoring that may not capture activity type, intensity, duration, occupational loading, or specific dietary components relevant to OA. Several explanations may account for this finding. First, our physical activity measure was a simplified dichotomous proxy (≥150 min/week of moderate-to-vigorous leisure-time physical activity), which may not capture the complexity of activity type, intensity, and occupational or domestic activity patterns that influence joint health. Second, the HEI-2015 score assesses overall diet quality rather than specific dietary components (e.g., omega-3 fatty acids, antioxidants) that have been more directly linked to cartilage health. 25 Third, in the mutually adjusted model, the dominant effects of waist circumference—which itself reflects the cumulative influence of diet and activity behaviors—may have attenuated the independent associations of these upstream factors. Sensitivity analyses excluding physical activity or diet individually from the composite score showed that the overall inverse association of the remaining lifestyle factors persisted, suggesting that the composite lifestyle approach captures a broader health profile that extends beyond any single behavioral component.
Several plausible biological pathways may link the lifestyle factors we assessed to OA prevalence, although these mechanisms remain hypothetical in the context of our cross-sectional data. Excess central adiposity (high waist circumference) is thought to increase biomechanical loading on weight-bearing joints and may also promote a pro-inflammatory milieu via adipokines (leptin, adiponectin) and cytokines. 33 In our analyses, waist circumference had an outsized impact on the lifestyle–OA association, consistent with the proposed role of obesity-driven joint damage. Recent evidence has further suggested that metabolic OA may represent a distinct phenotype characterized by systemic metabolic dysfunction, low-grade inflammation, and altered lipid metabolism, rather than purely mechanical factors.9,10 Insufficient sleep may further exacerbate metabolic dysregulation, suggesting that poor sleep could be linked to higher OA prevalence indirectly by promoting weight gain and systemic inflammation. Conversely, healthy diet patterns (such as a Mediterranean diet rich in antioxidants and omega-3 fatty acids) have been hypothesized to support cartilage health by reducing oxidative stress and inflammation. 25 It should be emphasized that these pathways, while supported by prior literature, were not directly tested in the present study and should be regarded as plausible hypotheses that warrant investigation in future mechanistic studies.
The observation that the association between lifestyle factors and OA was more pronounced in younger adults (under 60 years) compared to older adults merits careful consideration and should be interpreted as hypothesis-generating given the cross-sectional design. Several non-mutually exclusive explanations may account for this finding. Aging is the most significant risk factor for OA, and a substantial number of older adults may already exhibit subclinical joint degeneration; in older age, the cumulative effects of biological aging and comorbidities may overshadow the relative influence of current lifestyle behaviors. Survival or selection bias represents another plausible explanation: older individuals in the analytic sample may represent a healthier-than-average survivor population, thereby reducing observable differences in OA prevalence across lifestyle categories. Additionally, reverse causation may play a role; individuals with long-standing OA might alter their behaviors, such as reducing physical activity or changing dietary habits, following diagnosis, which could diminish the predictive value of current lifestyle factors on disease outcomes in older adults. Cohort effects and generational differences in health behaviors and self-reporting practices may further contribute to the observed age-dependent pattern. It should be noted that these mechanisms are not formally tested in the present analysis, and the cross-sectional design precludes causal inference. Nonetheless, the finding suggests that encouraging healthy lifestyle adoption earlier in adulthood may be associated with the most favorable OA profile, a notion consistent with the concept of “pre-osteoarthritis” and the rationale for early health promotion.5–7 Future longitudinal and interventional studies should explore how the timing and duration of healthy habits relate to OA occurrence across different age groups.
Our findings should be considered within the broader context of contemporary OA risk-factor and phenotyping frameworks. The integrated lifestyle approach used in this study aligns well with recent calls for multi-domain health-promotion strategies for OA, including the 2021 EULAR recommendations on lifestyle behaviours 4 and evidence supporting combined physical activity, weight management, and dietary interventions for lower OA burden.18,19 Furthermore, the dominant contribution of waist circumference to the weighted lifestyle score in our analysis resonates with the growing recognition of metabolic or systemic OA phenotypes, in which central adiposity, insulin resistance, and low-grade systemic inflammation—rather than mechanical loading alone—contribute to disease occurrence and progression.9,10 Future studies integrating lifestyle assessments with biomarker profiling may help clarify which individuals are most likely to benefit from targeted lifestyle interventions within the spectrum of OA phenotypes.
This study’s strengths lie in its use of a large, nationally representative sample of U.S. adults and a comprehensive assessment of various lifestyle factors, including sleep duration and waist circumference. We accounted for a wide range of confounding variables and performed thorough sensitivity analyses, including propensity-score adjustment and E-value analysis, to validate the robustness of our findings. The application of both simple and weighted lifestyle scores revealed clear dose–response relationships, thereby strengthening the evidence for a potential association.
From a public health perspective, our findings have important implications for public health strategies. Promoting integrated healthy lifestyle interventions, such as smoking cessation, weight management, and sleep hygiene, may be associated with a lower OA burden and could inform low-cost public health approaches in aging populations. These behaviors are already embedded in global non-communicable disease (NCD) health-promotion frameworks, and our results support their inclusion in musculoskeletal health programs. Community-based interventions, workplace wellness programs, and primary care counseling could be tailored to encourage simultaneous improvements in multiple lifestyle domains rather than focusing on single behaviors. Such multidimensional strategies may enhance adherence and yield broader health benefits beyond OA-related outcomes.
However, it is important to recognize specific limitations. First, our study, being a cross-sectional analysis, is unable to establish causality; the concurrent evaluation of lifestyle factors and OA status presents the possibility of reverse causation. Second, OA was assessed with self-reported questionnaires, which is subject to misclassification. Self-reported physician-diagnosed OA in NHANES has not been validated against radiographic criteria; therefore, radiographically mild or asymptomatic OA may be missed, and some participants may misclassify other arthritis subtypes as OA. If this outcome misclassification is nondifferential across lifestyle categories, it would be expected to bias the observed associations toward the null, potentially leading to conservative estimates. Future studies employing clinical or imaging-based OA definitions would help verify these findings. Third, the inclusion of waist circumference within the lifestyle score reflects metabolic status and body composition rather than a discrete behavior; while this is consistent with prior composite lifestyle scores and captures an important modifiable risk factor, readers should interpret the composite score as representing a combination of behavioral and metabolic–body composition–related factors rather than purely behavioral constructs. This clarification is important because waist circumference captures central adiposity and metabolic status, whereas smoking, alcohol consumption, physical activity, diet, and sleep duration represent behavioral components. Fourth, in the primary analysis, alcohol abstainers were classified in the “unhealthy” category, which is unconventional and may raise concerns. Abstainers may include former heavy drinkers or individuals with chronic illness who ceased drinking (“sick quitter” bias), potentially inflating the apparent benefit of moderate consumption. However, our sensitivity analysis reclassifying abstainers as “healthy” produced consistent results, supporting the robustness of this finding. Fifth, the use of complete-case analysis excluded 13,614 of 29,231 initially eligible participants, corresponding to approximately 46.6% of the eligible sample. This degree of exclusion may have introduced selection bias. As shown in the comparison of included and excluded participants (Table S11), excluded participants were slightly older and more likely to have lower socioeconomic status and other characteristics that may be related to both lifestyle patterns and OA prevalence. Therefore, the analytic sample may underrepresent participants with less favorable lifestyle profiles and potentially higher OA prevalence. Such selection could bias prevalence estimates downward and may attenuate or otherwise alter the observed association between the composite lifestyle score and OA. Because the direction and magnitude of this bias cannot be fully determined from the available data, the results should be interpreted with caution. Sixth, unmeasured factors, such as a history of joint injury, genetic predisposition, precise dietary quality, or sleep disorders, could potentially confound the associations observed. Future longitudinal or prospective cohort studies are warranted to clarify the temporal sequence and determine whether adherence to healthy lifestyles can lower OA incidence rather than merely reflect post-diagnosis behavioral changes.
Conclusion
In conclusion, our findings suggest that adherence to a greater number of healthy lifestyle factors may be associated with lower odds of OA, particularly among younger adults. Public health strategies that advocate for comprehensive lifestyle modifications, such as maintaining an optimal waist circumference and ensuring sufficient sleep, may be associated with lower OA prevalence in aging populations. Future longitudinal and interventional studies are needed to validate these associations, clarify the underlying mechanisms, and determine whether lifestyle modifications may be associated with lower OA prevalence over time.
Supplemental material
Supplemental material - Combined healthy lifestyles and osteoarthritis among middle-aged and older adults: A cross-sectional study in US adults
Supplemental material for Combined healthy lifestyles and osteoarthritis among middle-aged and older adults: A cross-sectional study in US adults by Pengfei Shi, and Jinmin Zhao in Science Progress.
Footnotes
Acknowledgements
We appreciate the cooperative efforts of the NHANES study collaborators.
Author contributions
Pengfei Shi contributed significantly to the conceptualization, design, data collection, analysis, and interpretation of the study, as well as to the drafting and critical revision of the manuscript. Jinmin Zhao provided essential research guidance, participated in the conceptualization, design, data analysis, and interpretation, and engaged in the critical revision of the manuscript. All authors have granted final approval and have agreed to assume responsibility for all aspects of the work.
Funding
The authors disclosed receipt of the following financial support for the research, authorship, and/or publication of this article: This research was funded by the Guangxi Science and Technology Base and Talent Special Project (Grant No. GuikeAD19254003).
Declaration of conflicting interests
The authors declared no potential conflicts of interest with respect to the research, authorship, and/or publication of this article.
Data Availability Statement
Supplemental material
Supplemental material for this article is available online.
Appendix
References
Supplementary Material
Please find the following supplemental material available below.
For Open Access articles published under a Creative Commons License, all supplemental material carries the same license as the article it is associated with.
For non-Open Access articles published, all supplemental material carries a non-exclusive license, and permission requests for re-use of supplemental material or any part of supplemental material shall be sent directly to the copyright owner as specified in the copyright notice associated with the article.