
Abstract
Shaking table testing is a crucial method for evaluating the seismic performance of structures; however, the resulting data are typically characterized by massive volumes, high sampling rates, and complex multi-channel arrays. Traditional manual processing methods relying on commercial spreadsheet software (e.g., Excel, Origin) present significant limitations regarding processing efficiency, mathematical transparency, and result reproducibility. To address these methodological gaps, this paper proposes a novel, fully automated data processing and analysis framework tailored for high-density structural dynamic testing using an open-source Python toolchain. Unlike conventional “black-box' commercial software, this method provides a transparent, end-to-end pipeline—from automated raw multi-channel data alignment and signal pre-processing to advanced time-frequency domain analysis and standardized visualization. The framework’s efficacy is validated using a shaking table test of a 1:2 scaled village masonry structure. The extracted experimental results clearly indicate that the masonry structure exhibits a significant low-pass filtering effect on high-frequency inputs (5–15 Hz), with response energy concentrated within the natural frequency range of 2–4 Hz. Furthermore, the pipeline integrates an automated structural health evaluation module; by comparing the Power Spectral Density (PSD) of white noise sweeps before and after seismic inputs, the method successfully and rapidly identified that while the structure exhibited displacement amplification under the 0.2 g operating condition, no significant stiffness degradation occurred. Ultimately, this study contributes a scalable, reproducible, and highly efficient methodological blueprint for big data analysis in structural seismic evaluation.
Keywords
1. Introduction
Shaking table testing simulates real ground motion inputs and is the most direct method for studying structural dynamic responses, failure mechanisms, and validating seismic design theories. With advancements in testing technology, modern shaking table tests have been widely applied to various engineering structures, including railway ballast beds, pile foundations, shear walls, and large-span bridges.1–6 These tests are often equipped with dozens or even hundreds of sensors (accelerometers, displacement meters, strain gauges, etc.), generating massive amounts of test data.
Currently, the engineering field relies heavily on commercial software such as Excel, Origin, and SPSS for data processing. While Excel has a high penetration rate, it faces significant performance bottlenecks when processing long-duration, high-frequency data and lacks professional signal processing libraries. Although Origin and SPSS offer powerful visualization and statistical capabilities, their batch processing abilities are weak. Furthermore, the inherent limitations of traditional big data analysis methods in handling massive, unstructured datasets have become increasingly prominent. 7 It is difficult to implement highly customized analysis flows (such as specific filtering or integral drift correction) in these software packages, and their licensing costs are high.
In recent years, the paradigm of data analysis in structural engineering has significantly shifted towards open-source, automated workflows. Recent international studies have increasingly emphasized the necessity of automated signal processing to handle the massive, high-dimensional datasets generated by modern Structural Health Monitoring (SHM) systems and large-scale experiments.8,9 For instance, automated operational modal analysis, machine-learning-based damage detection algorithms, and real-time sensor data fusion have become focal points in modern SHM and dynamic testing research. 10
Concurrently, Python has gradually become the tool of choice for developing these advanced methodologies, due to its rich scientific computing ecosystem (NumPy, SciPy) and powerful visualization libraries (Matplotlib, Seaborn). Domestically, researchers have successfully implemented Python-based workflows for real-time hybrid testing, complex theoretical modeling, and finite element model updating.11–15 Internationally, comprehensive open-source Python toolchains have been developed specifically for structural dynamics and advanced shaking table control.16,17
However, despite these significant advancements in continuous SHM and numerical post-processing, the application of a standardized, open-source framework for the full-process automated analysis of shaking table tests is still relatively rare. Unlike long-term SHM, shaking table testing poses unique data processing challenges, such as the need for precise multi-channel synchronization, transient high-frequency noise filtering, and rapid operational modal identification (e.g., PSD comparisons) between successive seismic excitations.
To bridge the aforementioned research gap regarding the lack of standardized, open-source processing frameworks for high-density experimental data, this paper takes the shaking table test of a typical low-rise village masonry structure as the background to develop a novel, end-to-end Python-based automated data analysis workflow. The specific scientific contribution of this study lies in the formulation of a fully reproducible data processing pipeline that integrates automated multi-channel signal alignment, transient noise filtering, and rapid operational modal identification (e.g., PSD comparisons for structural health evaluation). By deeply mining acceleration, displacement, and white noise sweep data, and comparing the results with traditional “black-box' commercial tools, this study verifies the accuracy, efficiency, and scalability of this method in processing complex dynamic test data, thereby providing a robust methodological blueprint for future structural seismic experiments.
2. Experimental overview
2.1. Prototype and model design
The experimental prototype is a two-story masonry residential building common in villages, with a seismic fortification intensity of 8 degrees. The walls are built with MU10 bricks and M5 mixed mortar, and the floors and roof are 120 mm thick cast-in-place reinforced concrete slabs, as shown in Figure 1. According to the Load Code for the Design of Building Structures and the Code for Design of Masonry Structures,13,14 this structure is classified as a rigid scheme building. Structural prototype plan and south elevation.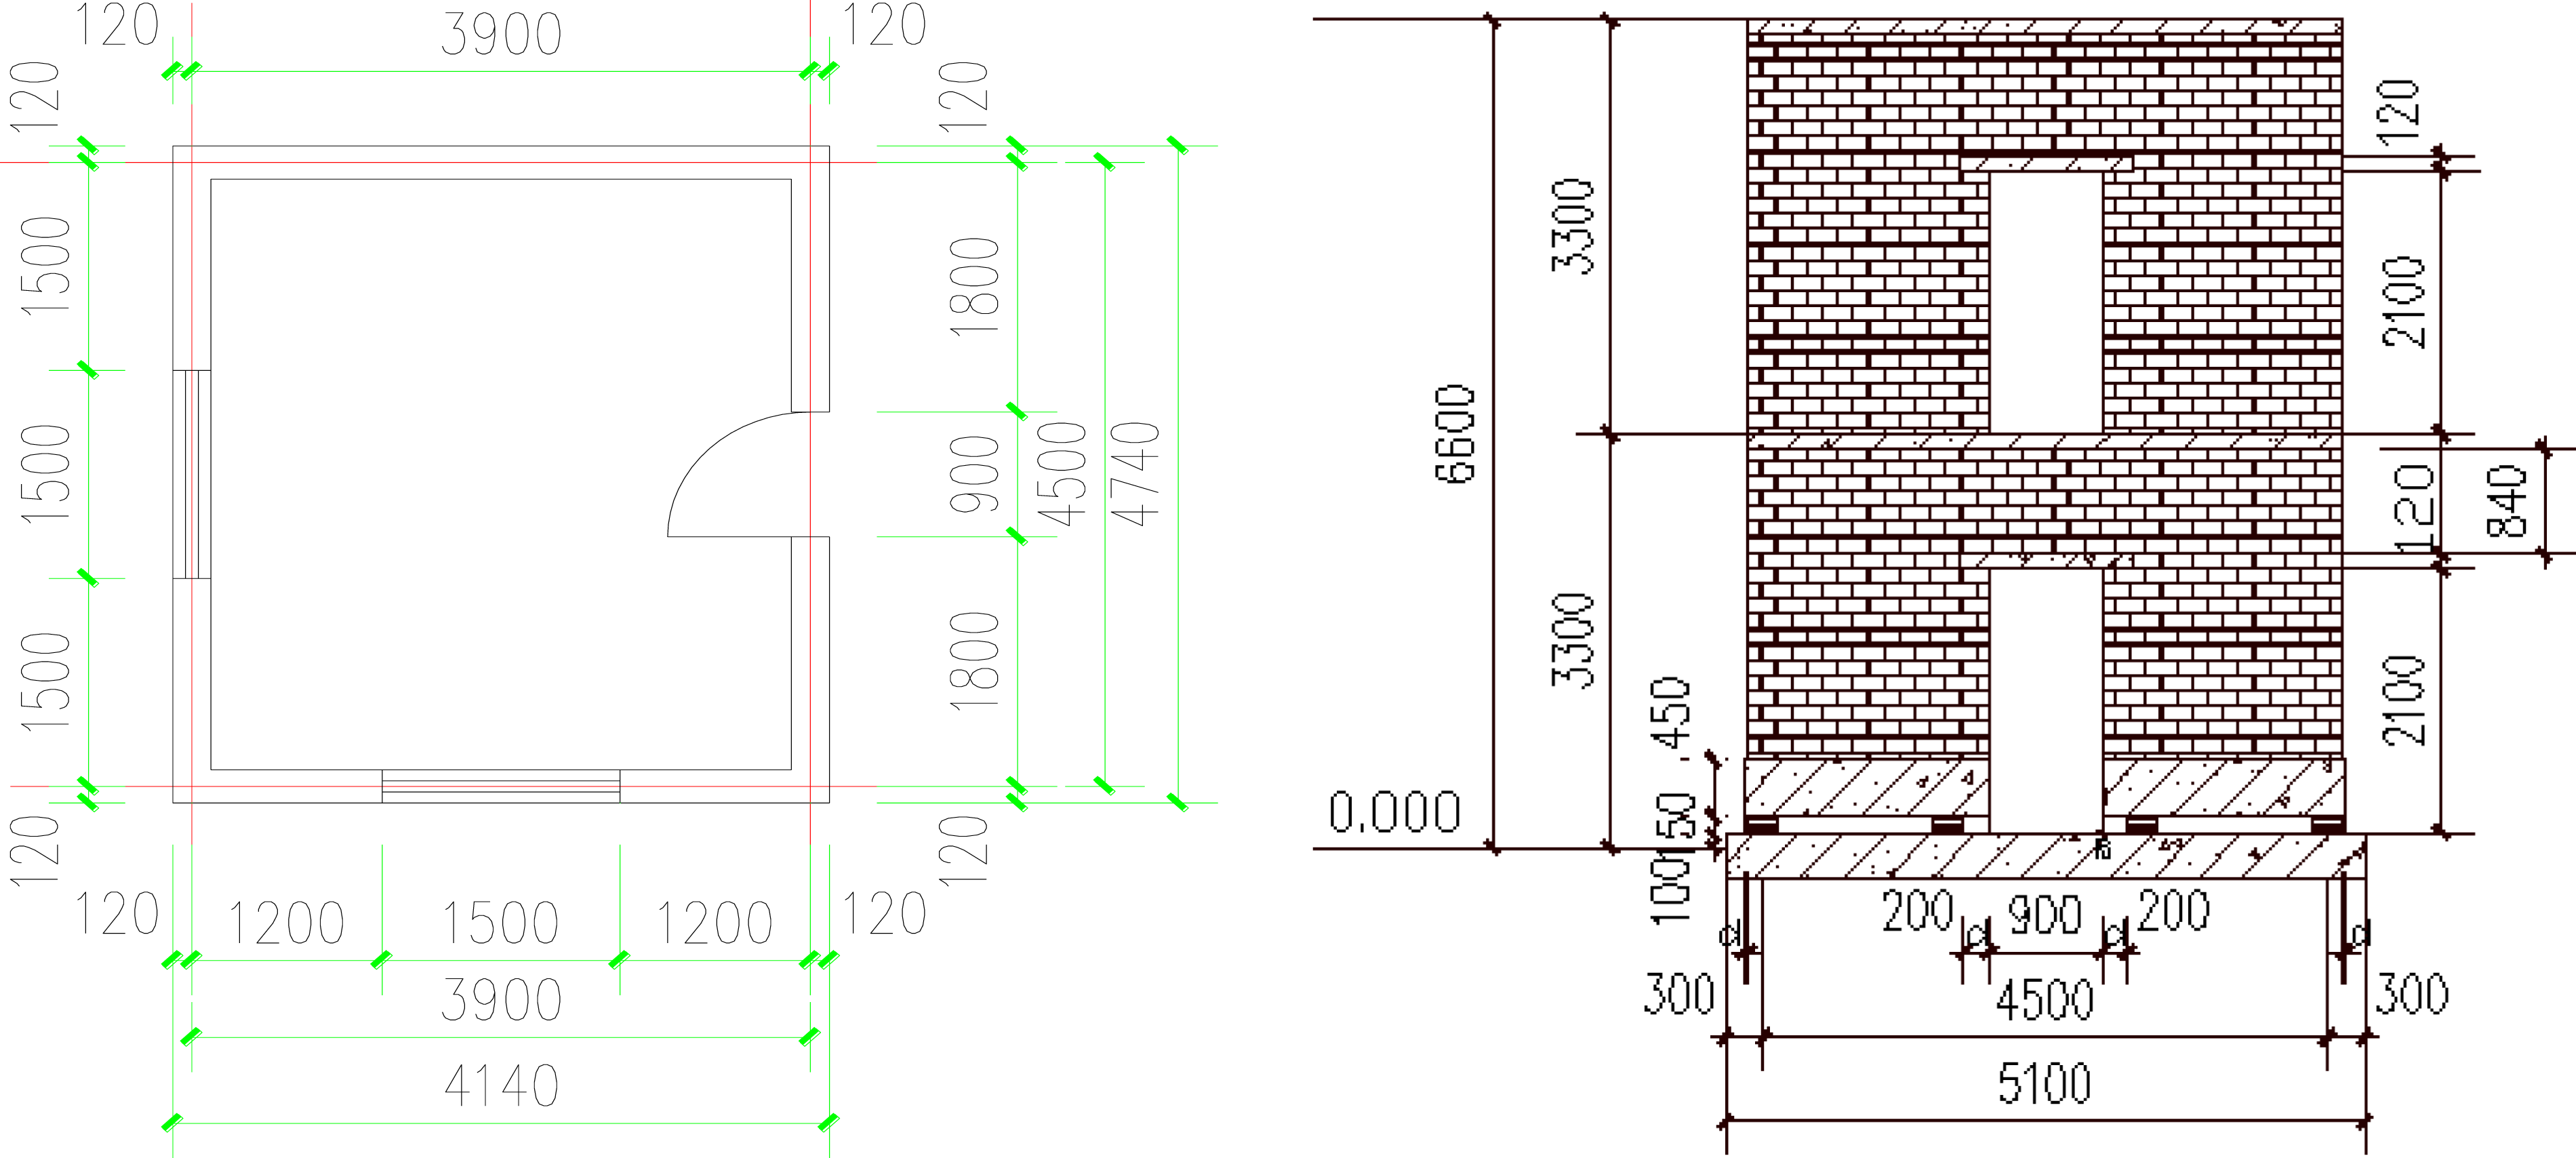
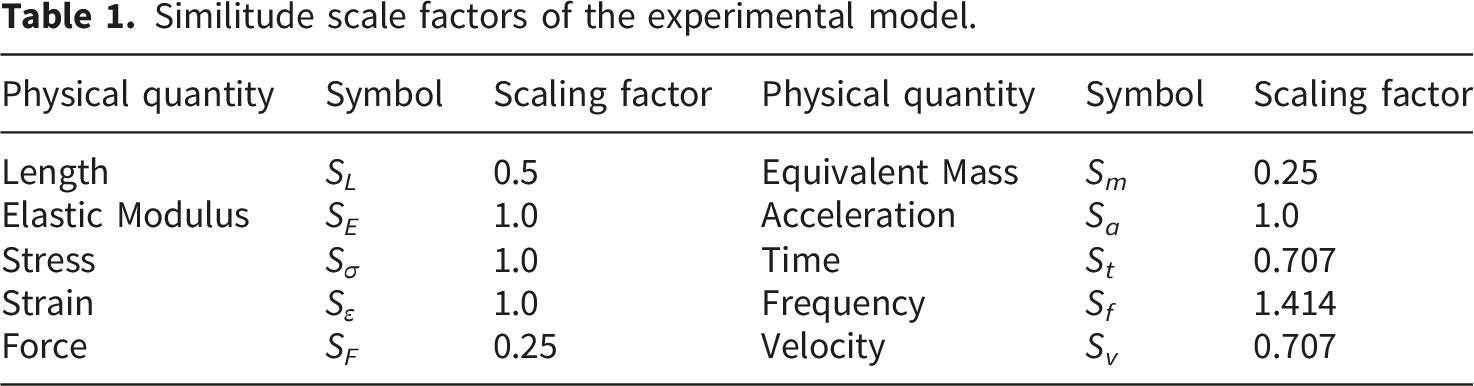
Similitude scale factors of the experimental model.
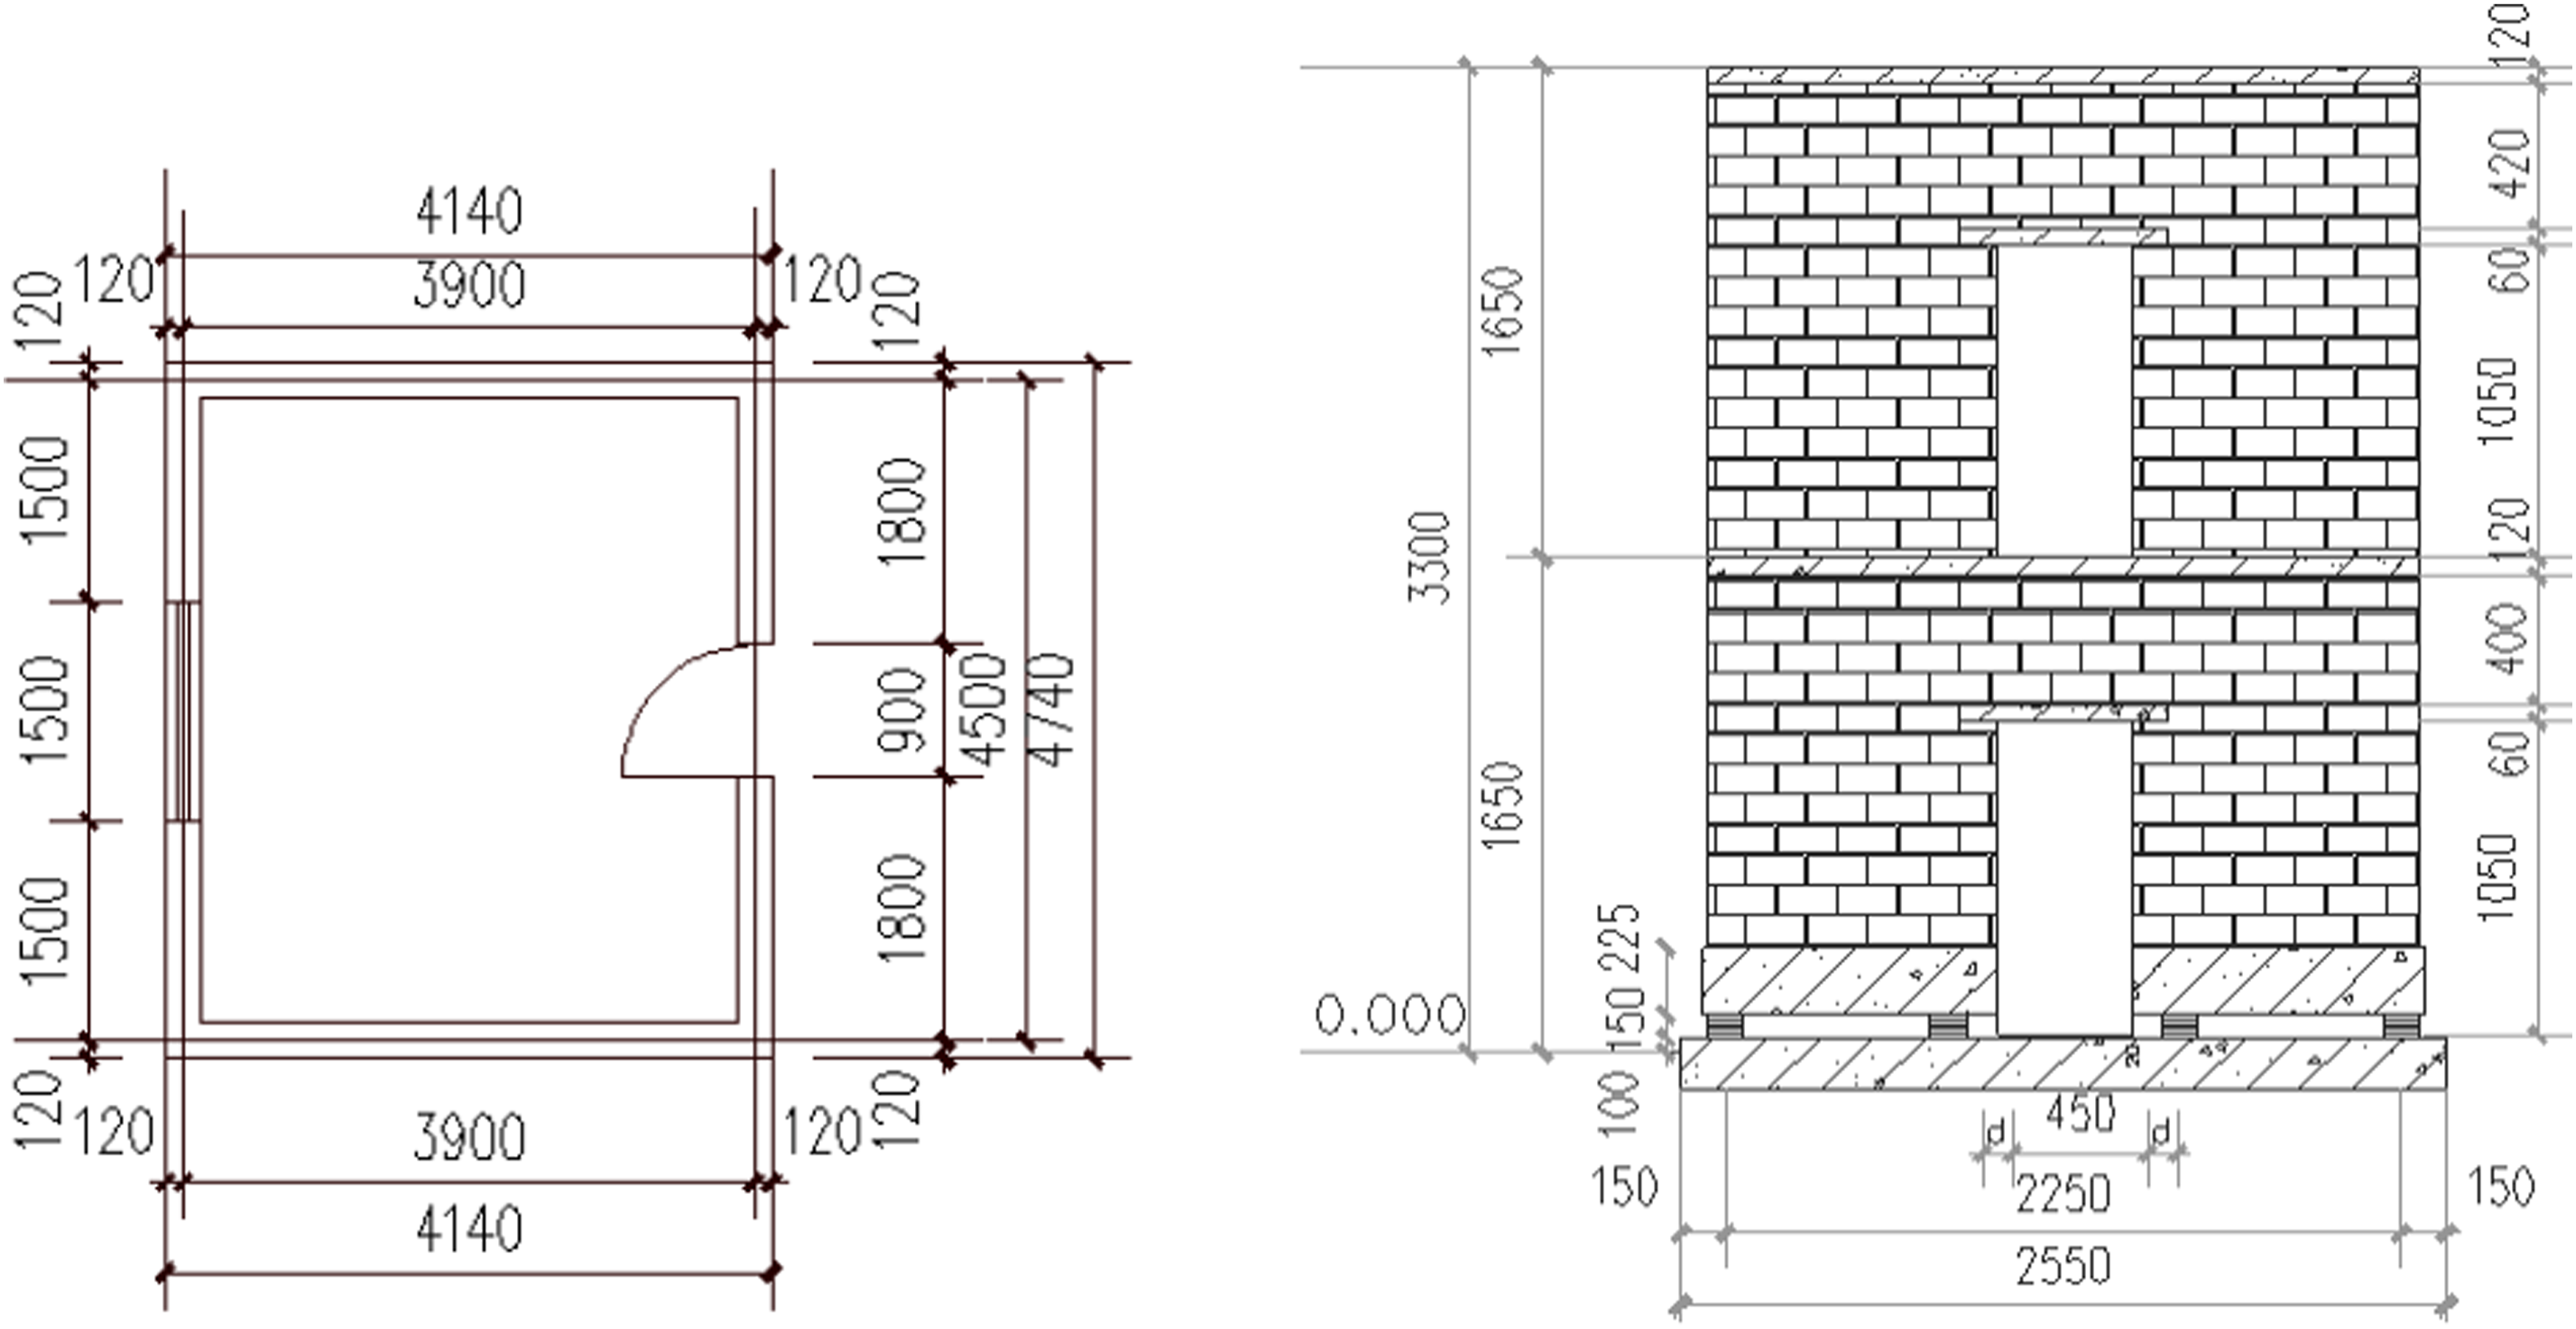
The model dimensions are 2.25 m × 1.95 m × 3.3 m, with a wall thickness of 120 mm. To accurately replicate the mechanical behavior of the masonry structure, the material properties and construction methods were strictly controlled. Specifically, MU10 solid bricks and M7.5 cement mortar were adopted for the model construction. The experiment utilized both standard prototype bricks and scaled model bricks (cut while retaining the original 53 mm thickness). The three types of masonry units have dimensions of 240 mm × 115 mm × 53 mm, 120 mm × 115 mm × 53 mm, and 60 mm × 115 mm × 53 mm, respectively, as shown in Figure 2. The walls were constructed using a one-stretcher one-header masonry bond (English bond). The resulting model wall thickness is half that of the prototype wall, as depicted in Figure 3(b). To meet the gravity similarity requirements and compensate for the mass deficiency inherent in the scaled model, a total artificial mass of 6.54 t was applied to the model. The total weight of the model is 16.5 t, which meets the load-bearing requirements of the shaking table. The model arrangement is shown in Figure 3(a). Shaking table surface and model arrangement. Detailed construction of the scaled masonry model: (a) Dimensions of the three types of model bricks; (b) The one-stretcher one-header masonry bond.
2.2. Sensor Layout and Loading Protocol
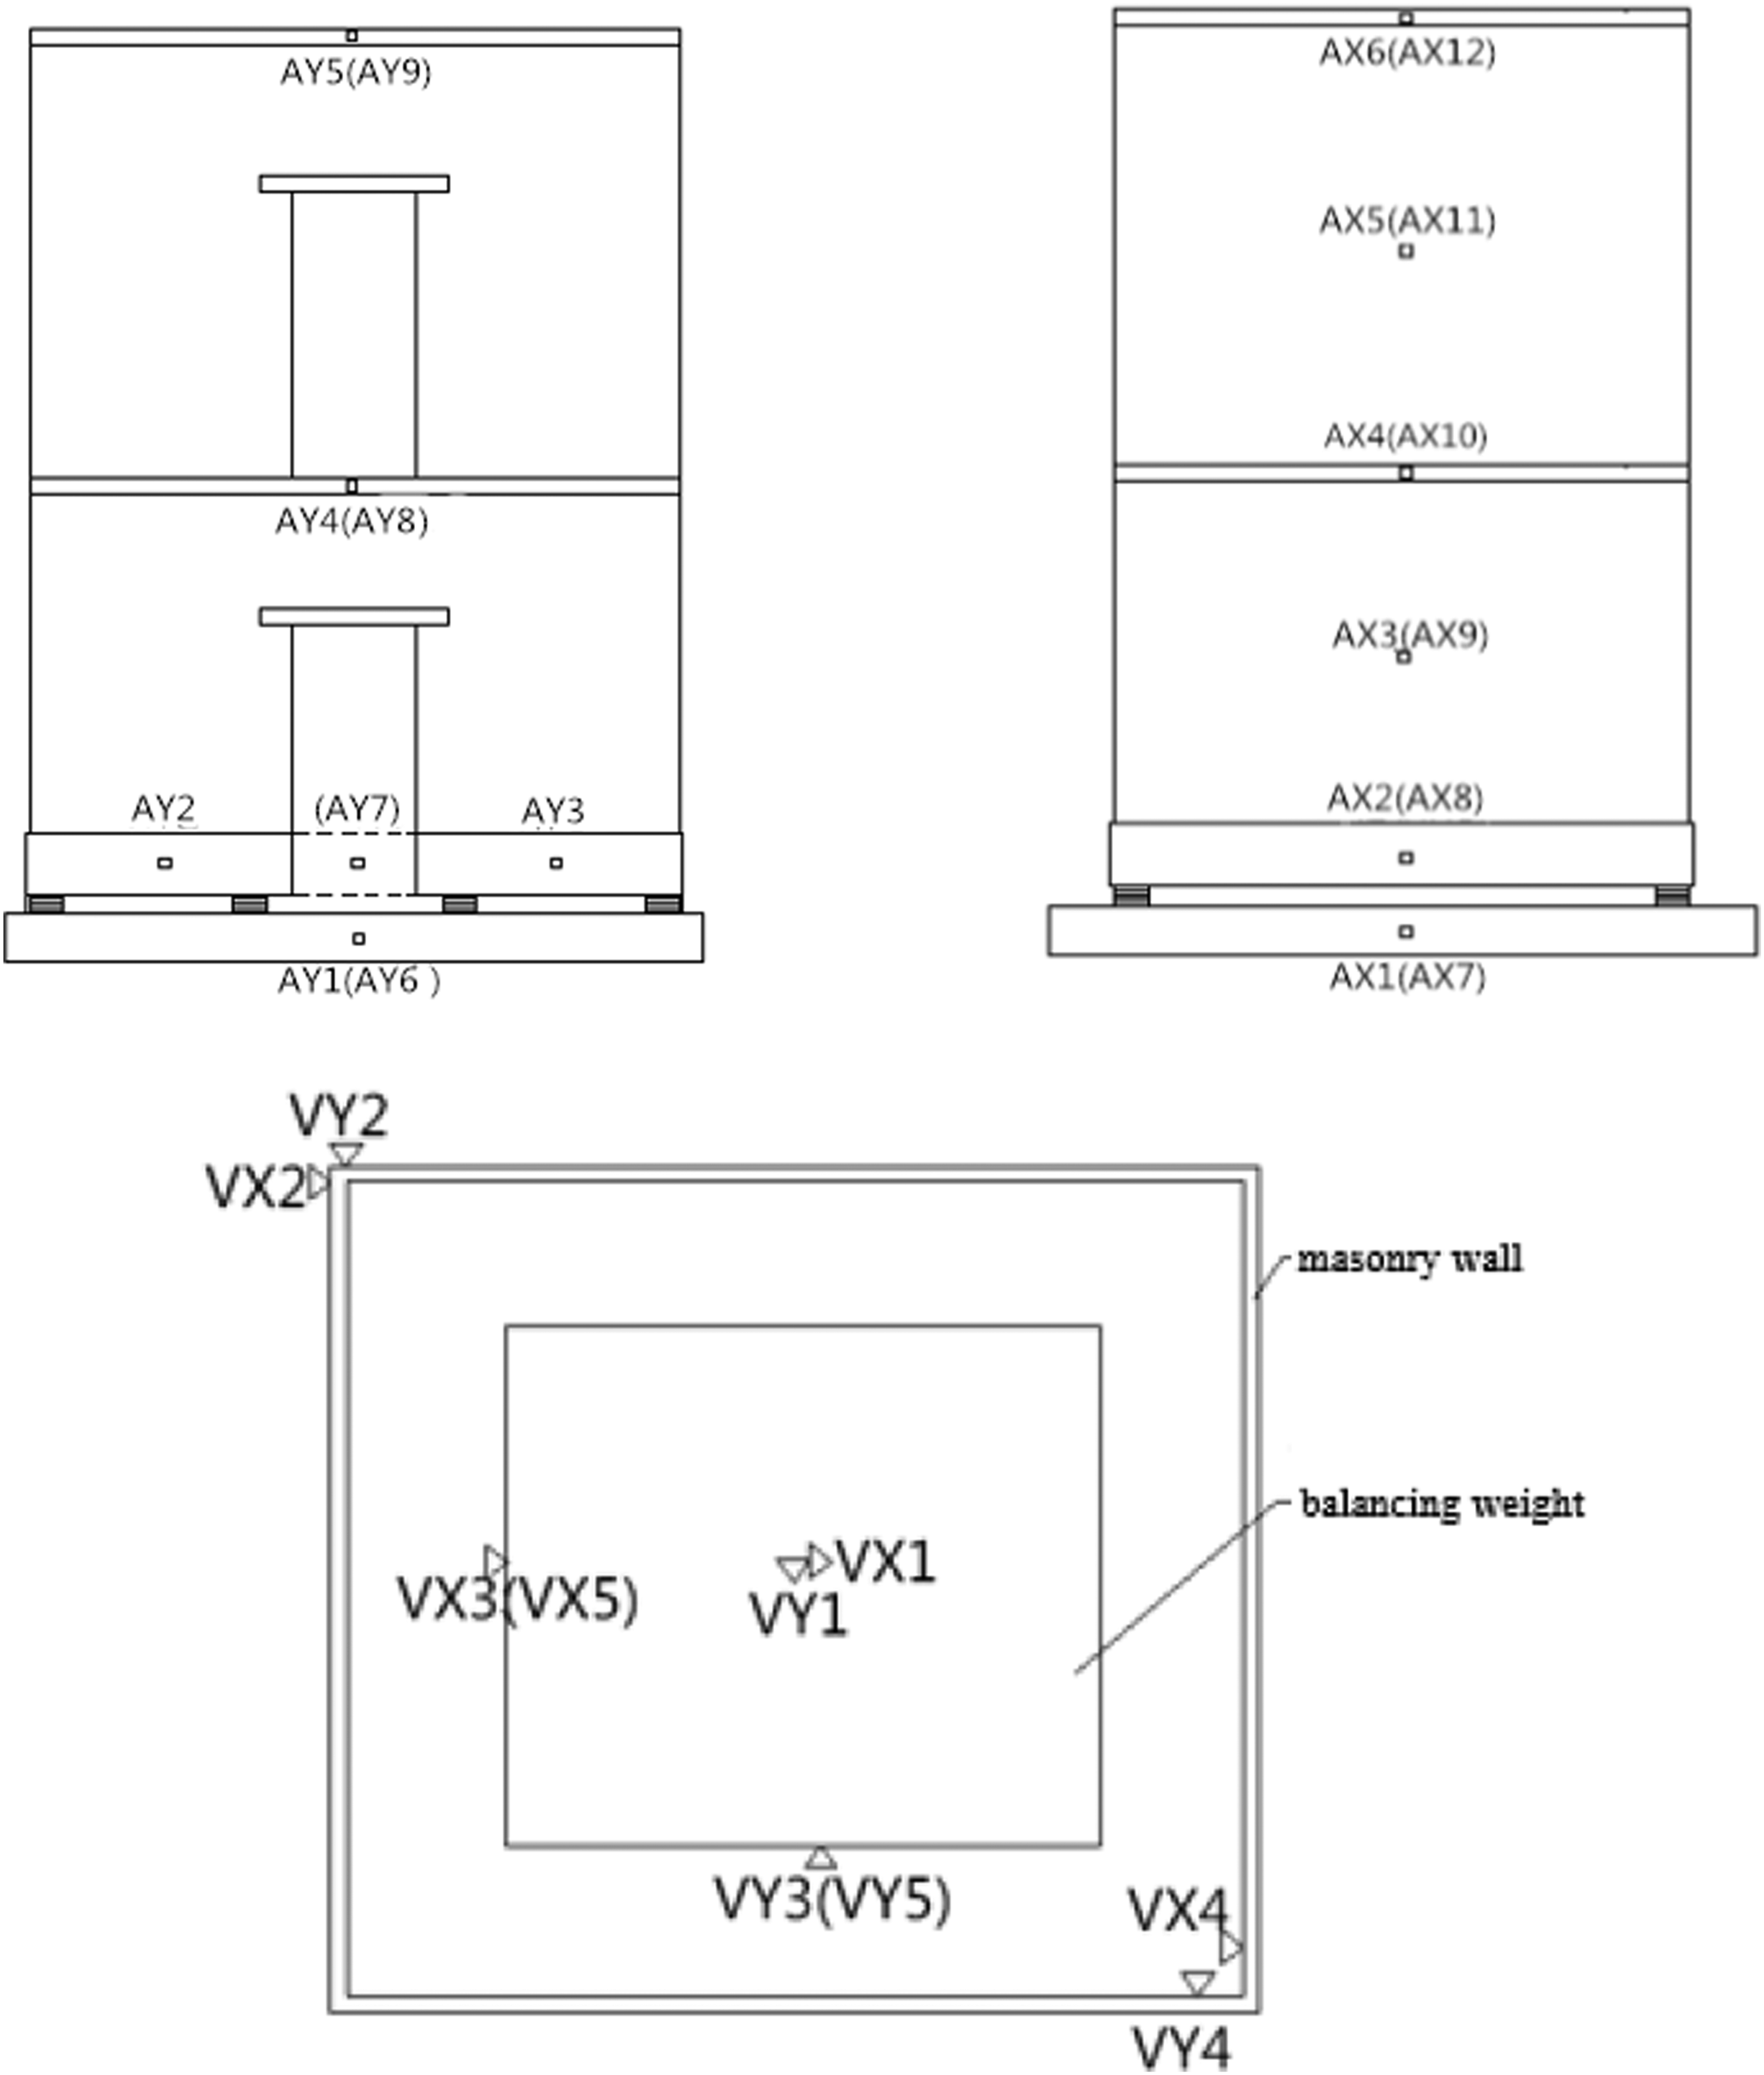
The test was conducted on a 4 m × 4 m three-dimensional, six-degree-of-freedom shaking table. • • Layout of accelerometers and displacement meters.
3. Methodology of data analysis based on python
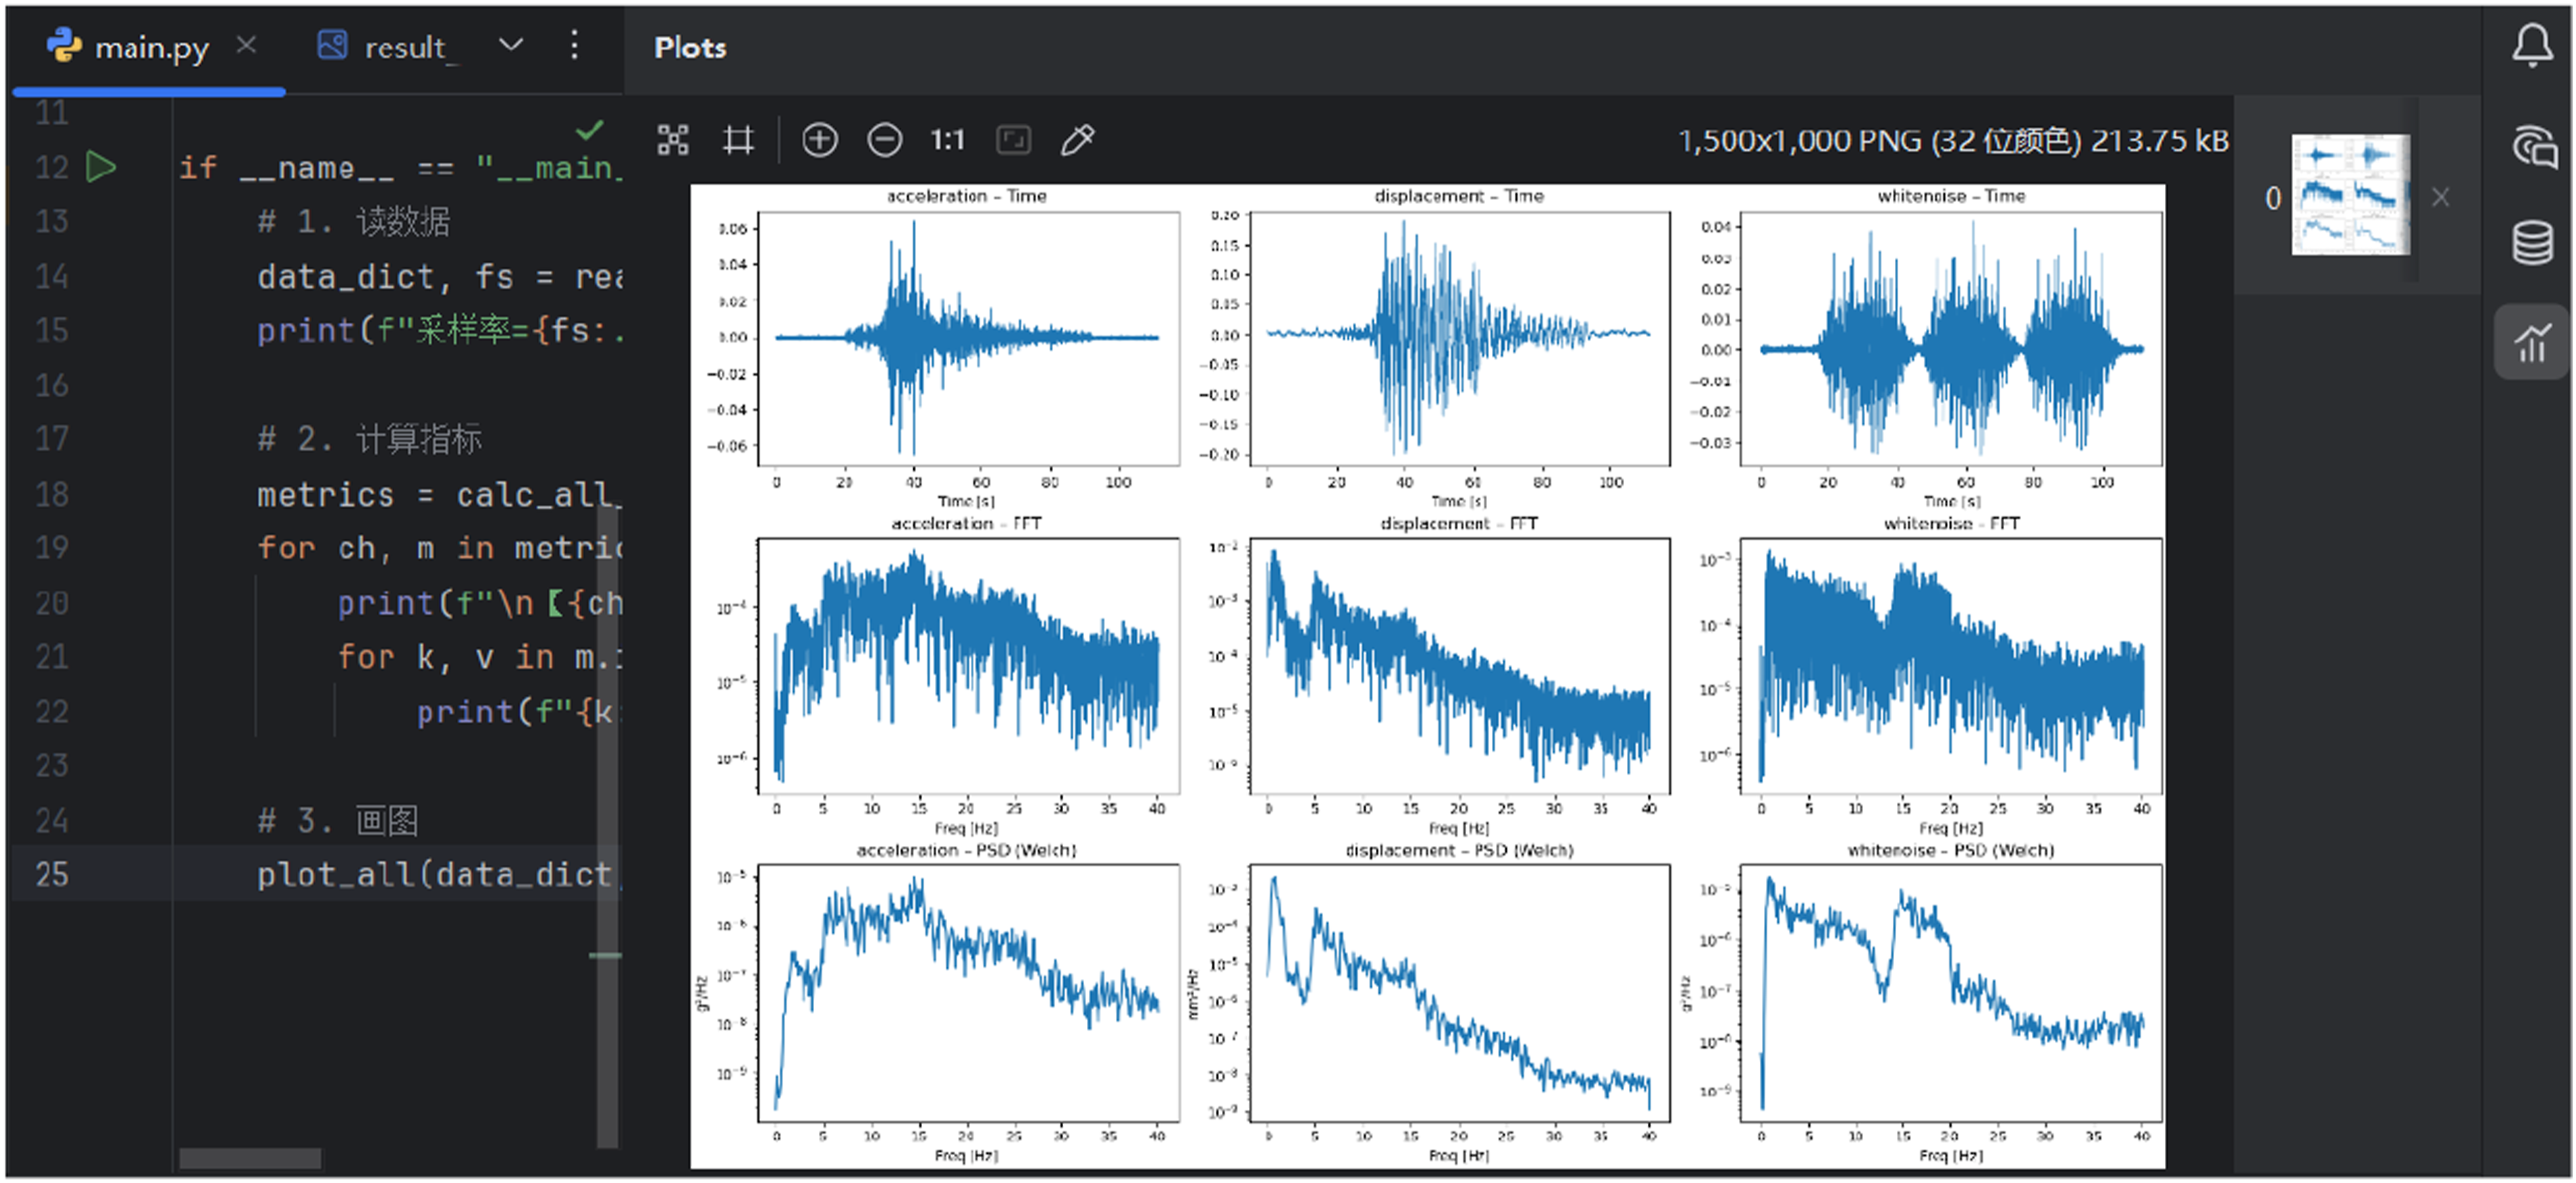
Addressing the pain points of traditional manual analysis, this paper constructs an integrated “Reading-Calculation-Visualization' analysis architecture within the PyCharm integrated development environment.
3.1. Technical architecture and environment configuration
The analysis platform is based on Python 3.9+. The main dependent libraries include: • • •
To ensure high reproducibility and ease of maintenance, the project structure is designed in a strictly modular form orchestrated by a central execution script (main.py). The automated data pipeline flows sequentially through three core modules: (1) signal_io.py is responsible for multi-format data parsing, synchronization, and dynamic sampling rate extraction; (2) signal_metrics.py handles the core numerical computations, systematically applying SciPy-based algorithms to extract dynamic indicator calculations (such as RMS, Peak, and THD); and (3) signal_plotter.py manages the standardized visualization rendering and exports publication-ready graphics. This decoupled architecture allows researchers to easily customize, replace, or upgrade specific analytical functions without altering the overall workflow (See Appendix A for code implementation details).
3.2. Key algorithm implementation

3.3. Algorithm validation and comparison
To rigorously validate the reliability and accuracy of the proposed Python-based automated analysis workflow, a comparative verification was conducted against industry-standard commercial software (i.e.,MATLAB and Origin). Using the standard El-Centro seismic wave as a benchmark dataset, the frequency-domain transformation (PSD estimation) and dynamic indicator extractions were processed simultaneously by both the proposed Python pipeline and MATLAB’s built-in signal processing toolbox. The comparison revealed that the relative error of the calculated dynamic indicators (such as Peak, RMS, and Main Frequency) between the two methods was strictly bounded within
Furthermore, compared to the traditional manual operation in Origin, the Python workflow achieved identical visualization accuracy while dramatically improving computational efficiency. Performance profiling on a standard workstation (Intel Core i7 CPU, 16 GB RAM) demonstrated that processing a massive multi-channel dataset (approximately 500 MB, containing over 1 million data points per channel) required an average computation time of only 4.2 seconds. Additionally, memory tracking revealed that the peak memory usage was strictly constrained below 850 MB during the entire batch processing operation. This comparative validation confirms that the proposed Python algorithm is not only highly efficient and memory-optimized, but also mathematically robust and entirely equivalent to established benchmark tools.
4. Results and discussion
Based on the Python analysis workflow described above, a deep analysis was conducted on the test data under the 8-degree fortification (0.2 g) Jiangyou wave condition.
4.1. Acceleration response and filtering effect
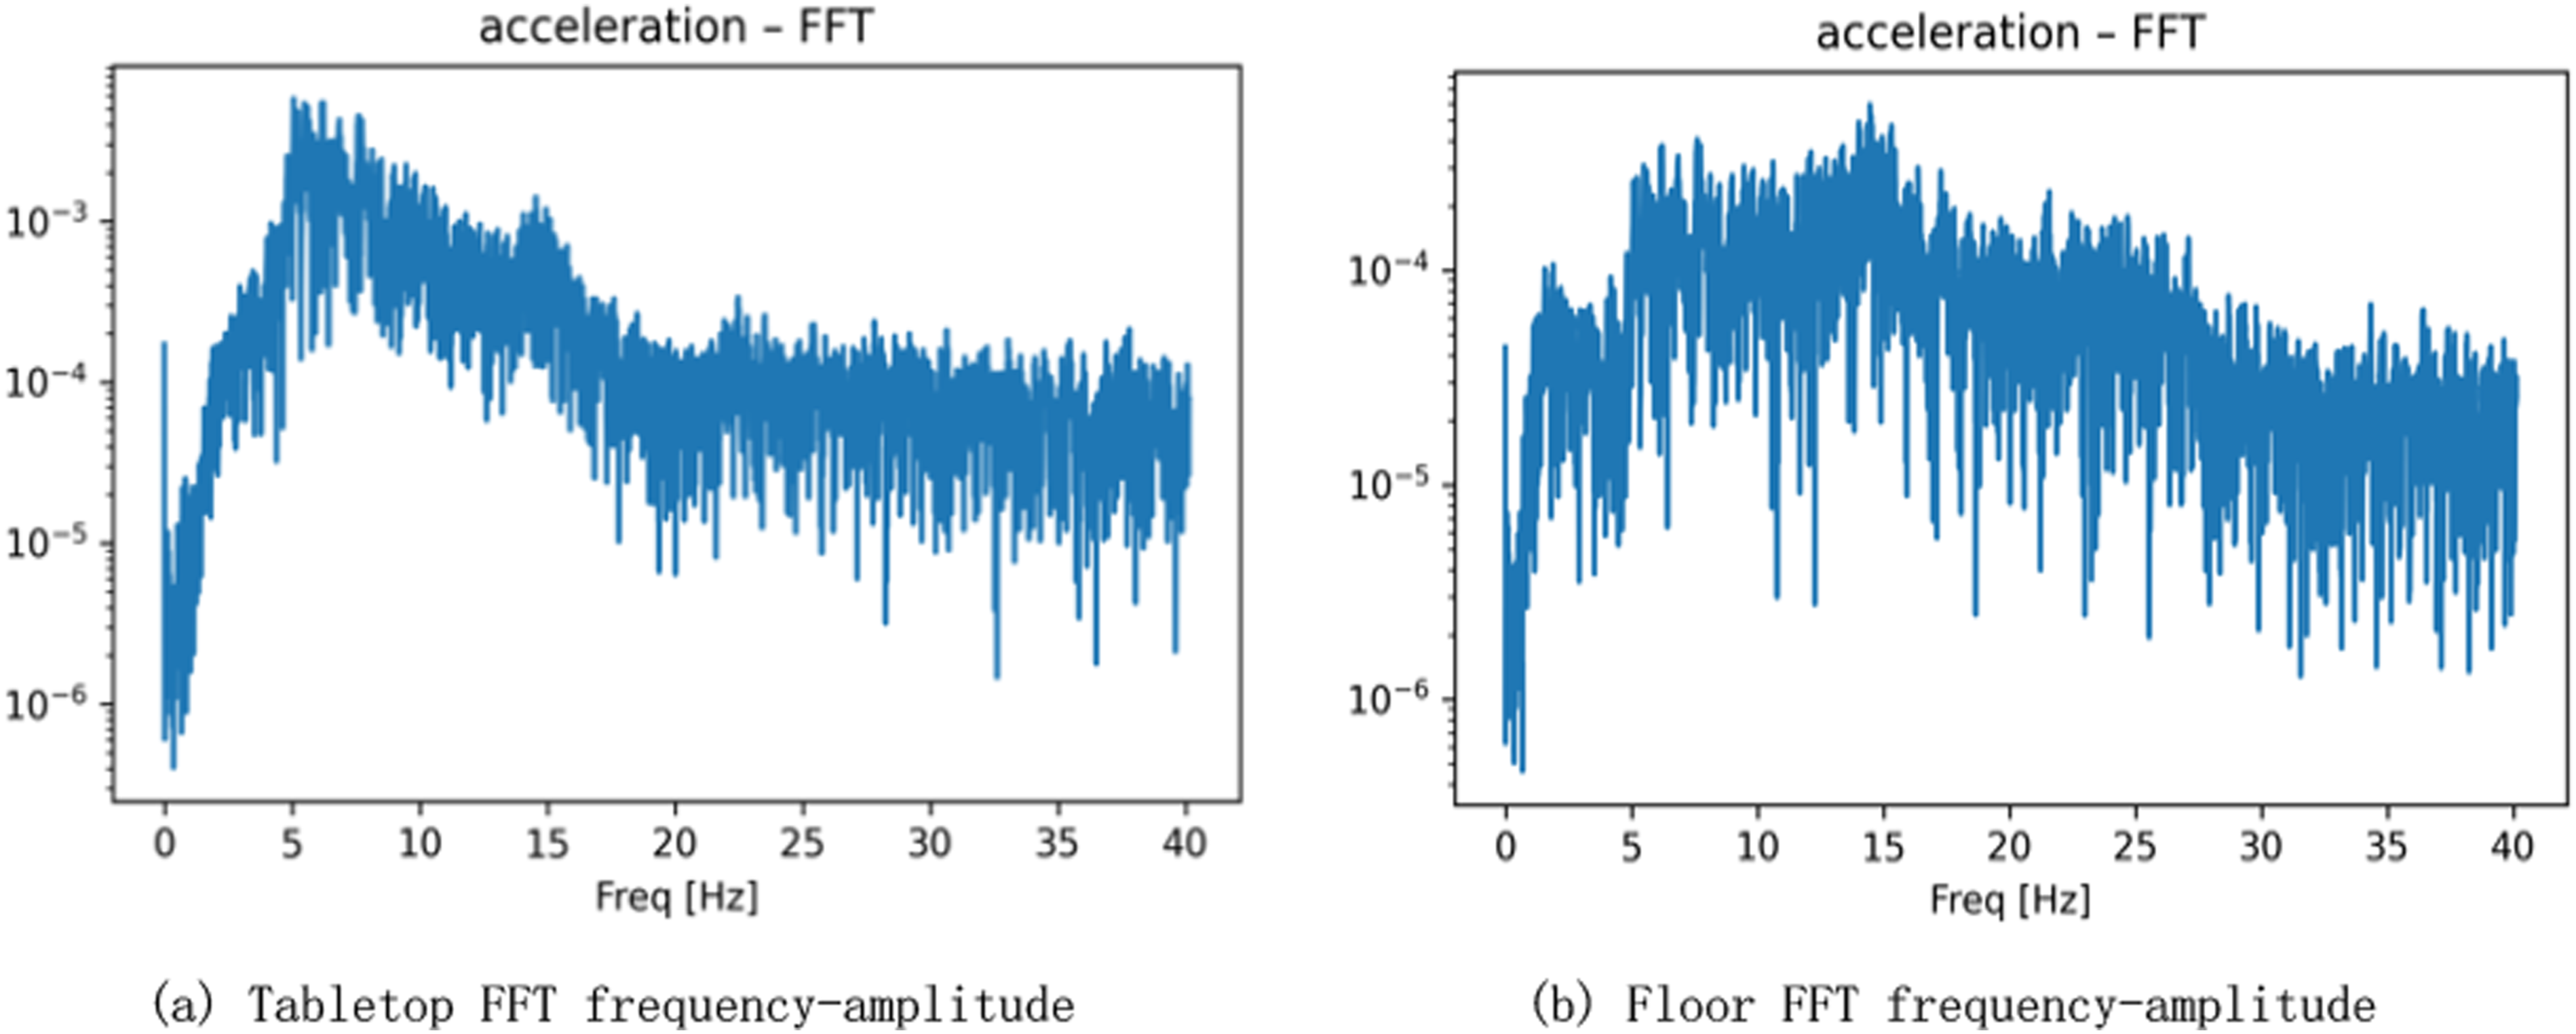
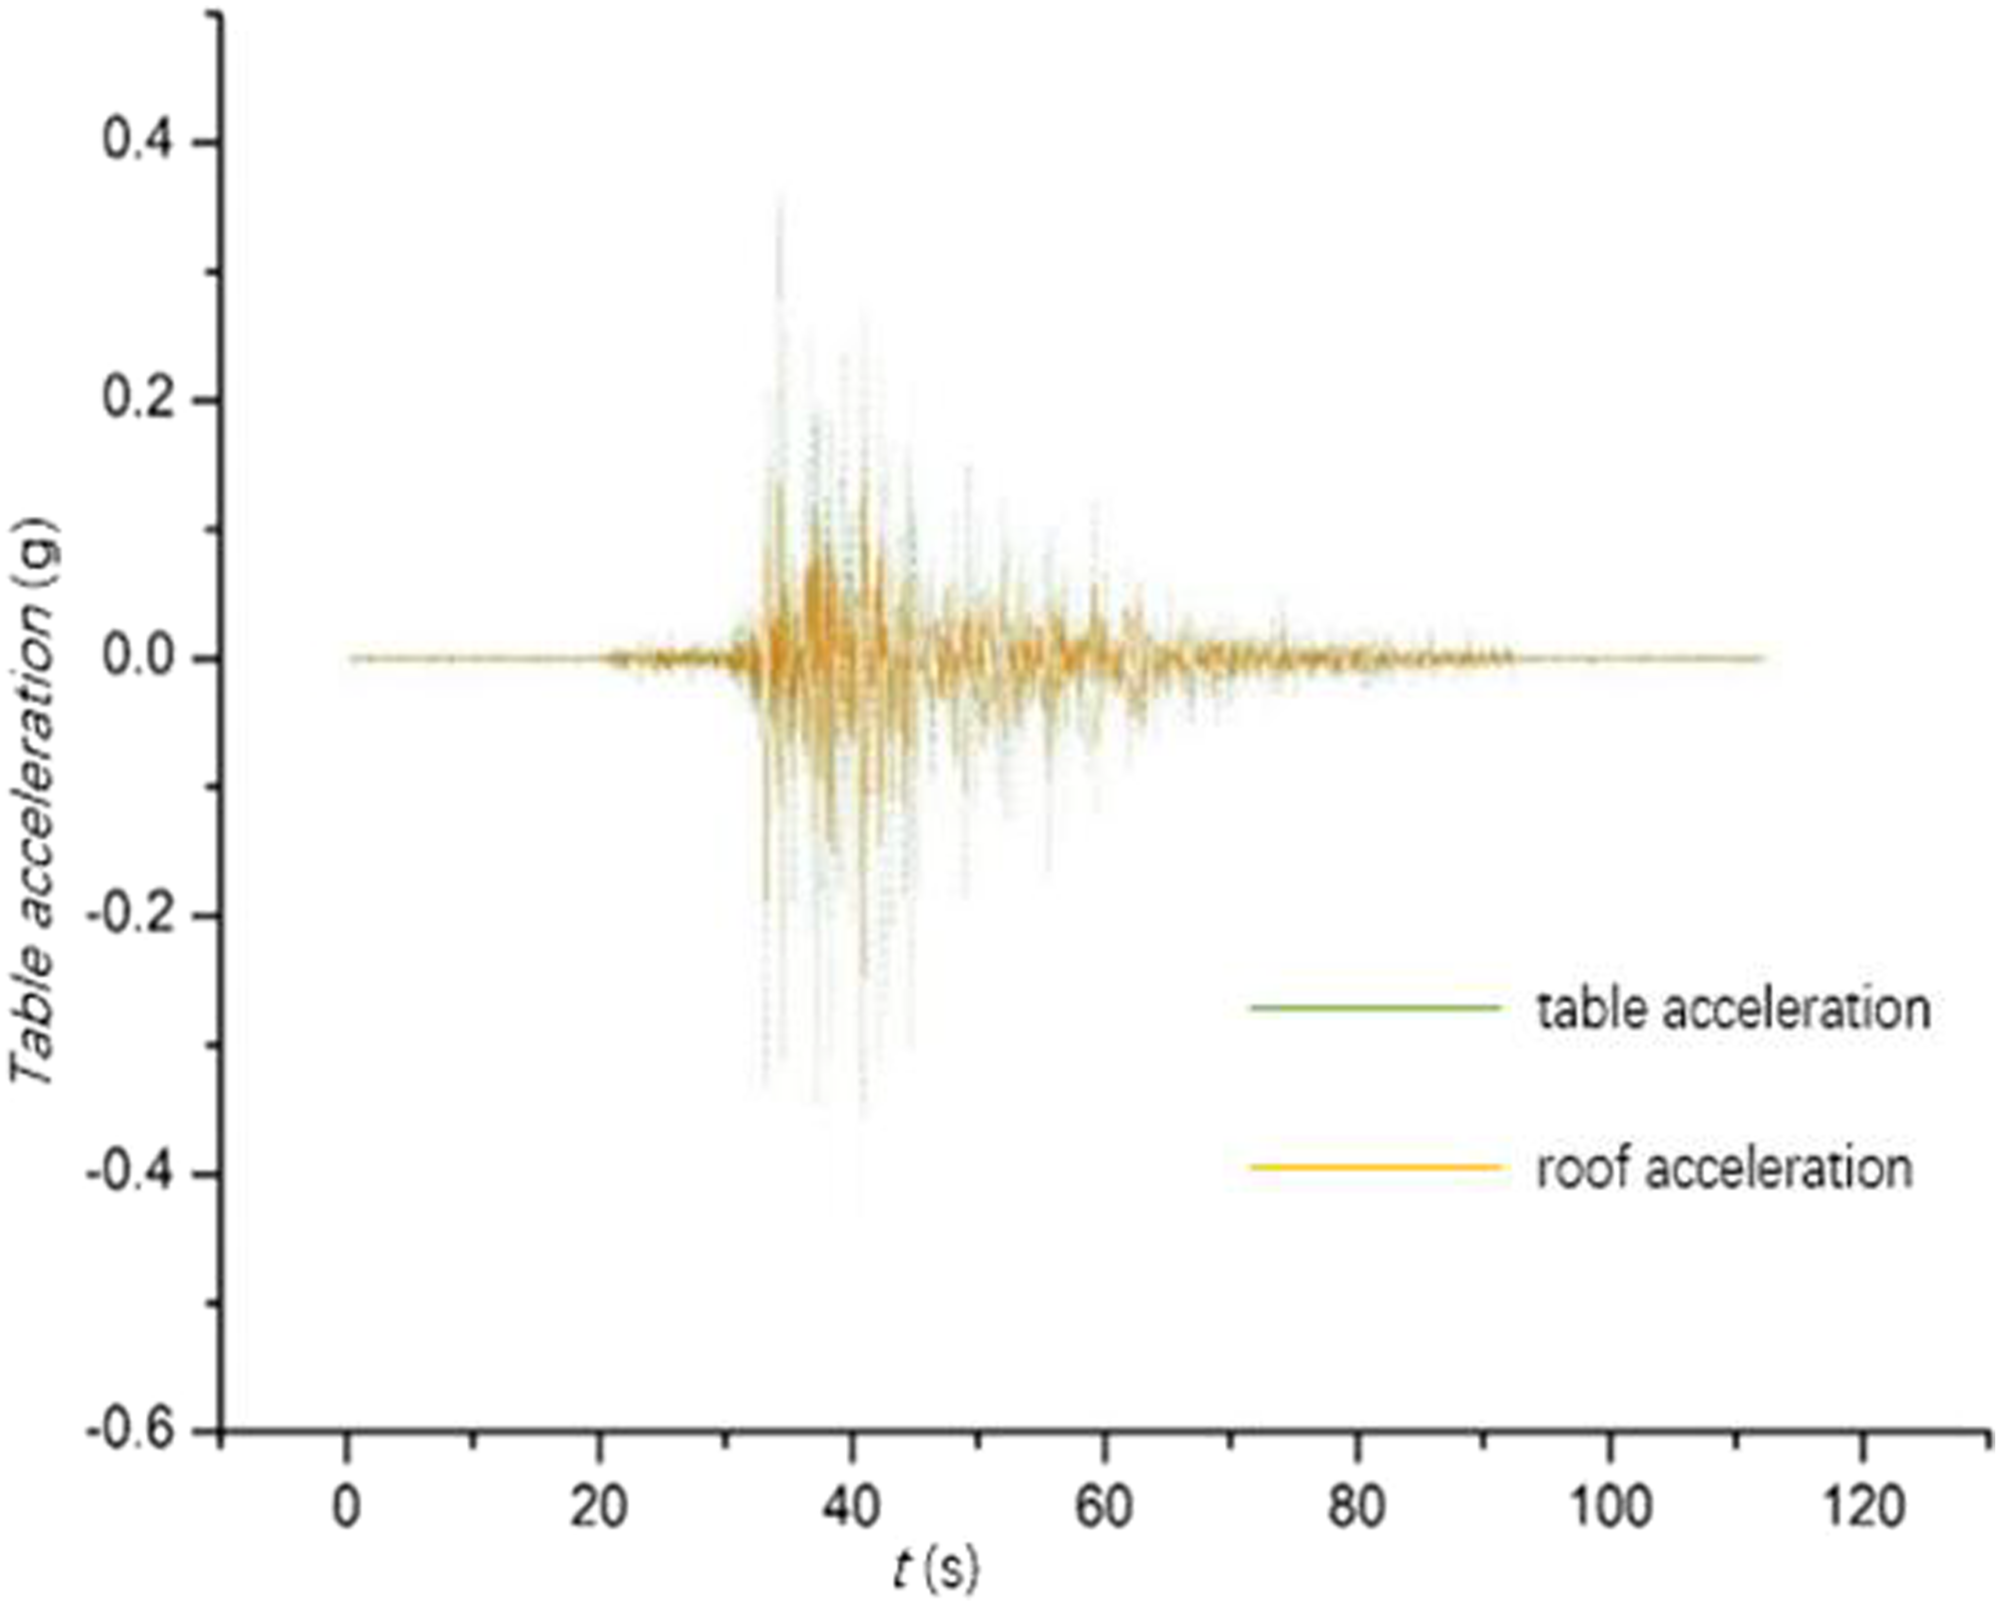
Figures 5–8 (generated by the Python script) show the time history and spectrum comparison between the table input and the floor response. • Analysis chart of successful execution of vibration table test data code. AY1, VY5 vibration table data code operation analysis. AY5, VY1 vibration table data code operation analysis. Acceleration time history analysis from PyCharm results.(a) At measuring points on the vibration table (b) At measuring point on the second floor. Acceleration response spectrum (Sa) analysis was integrated into the python workflow.
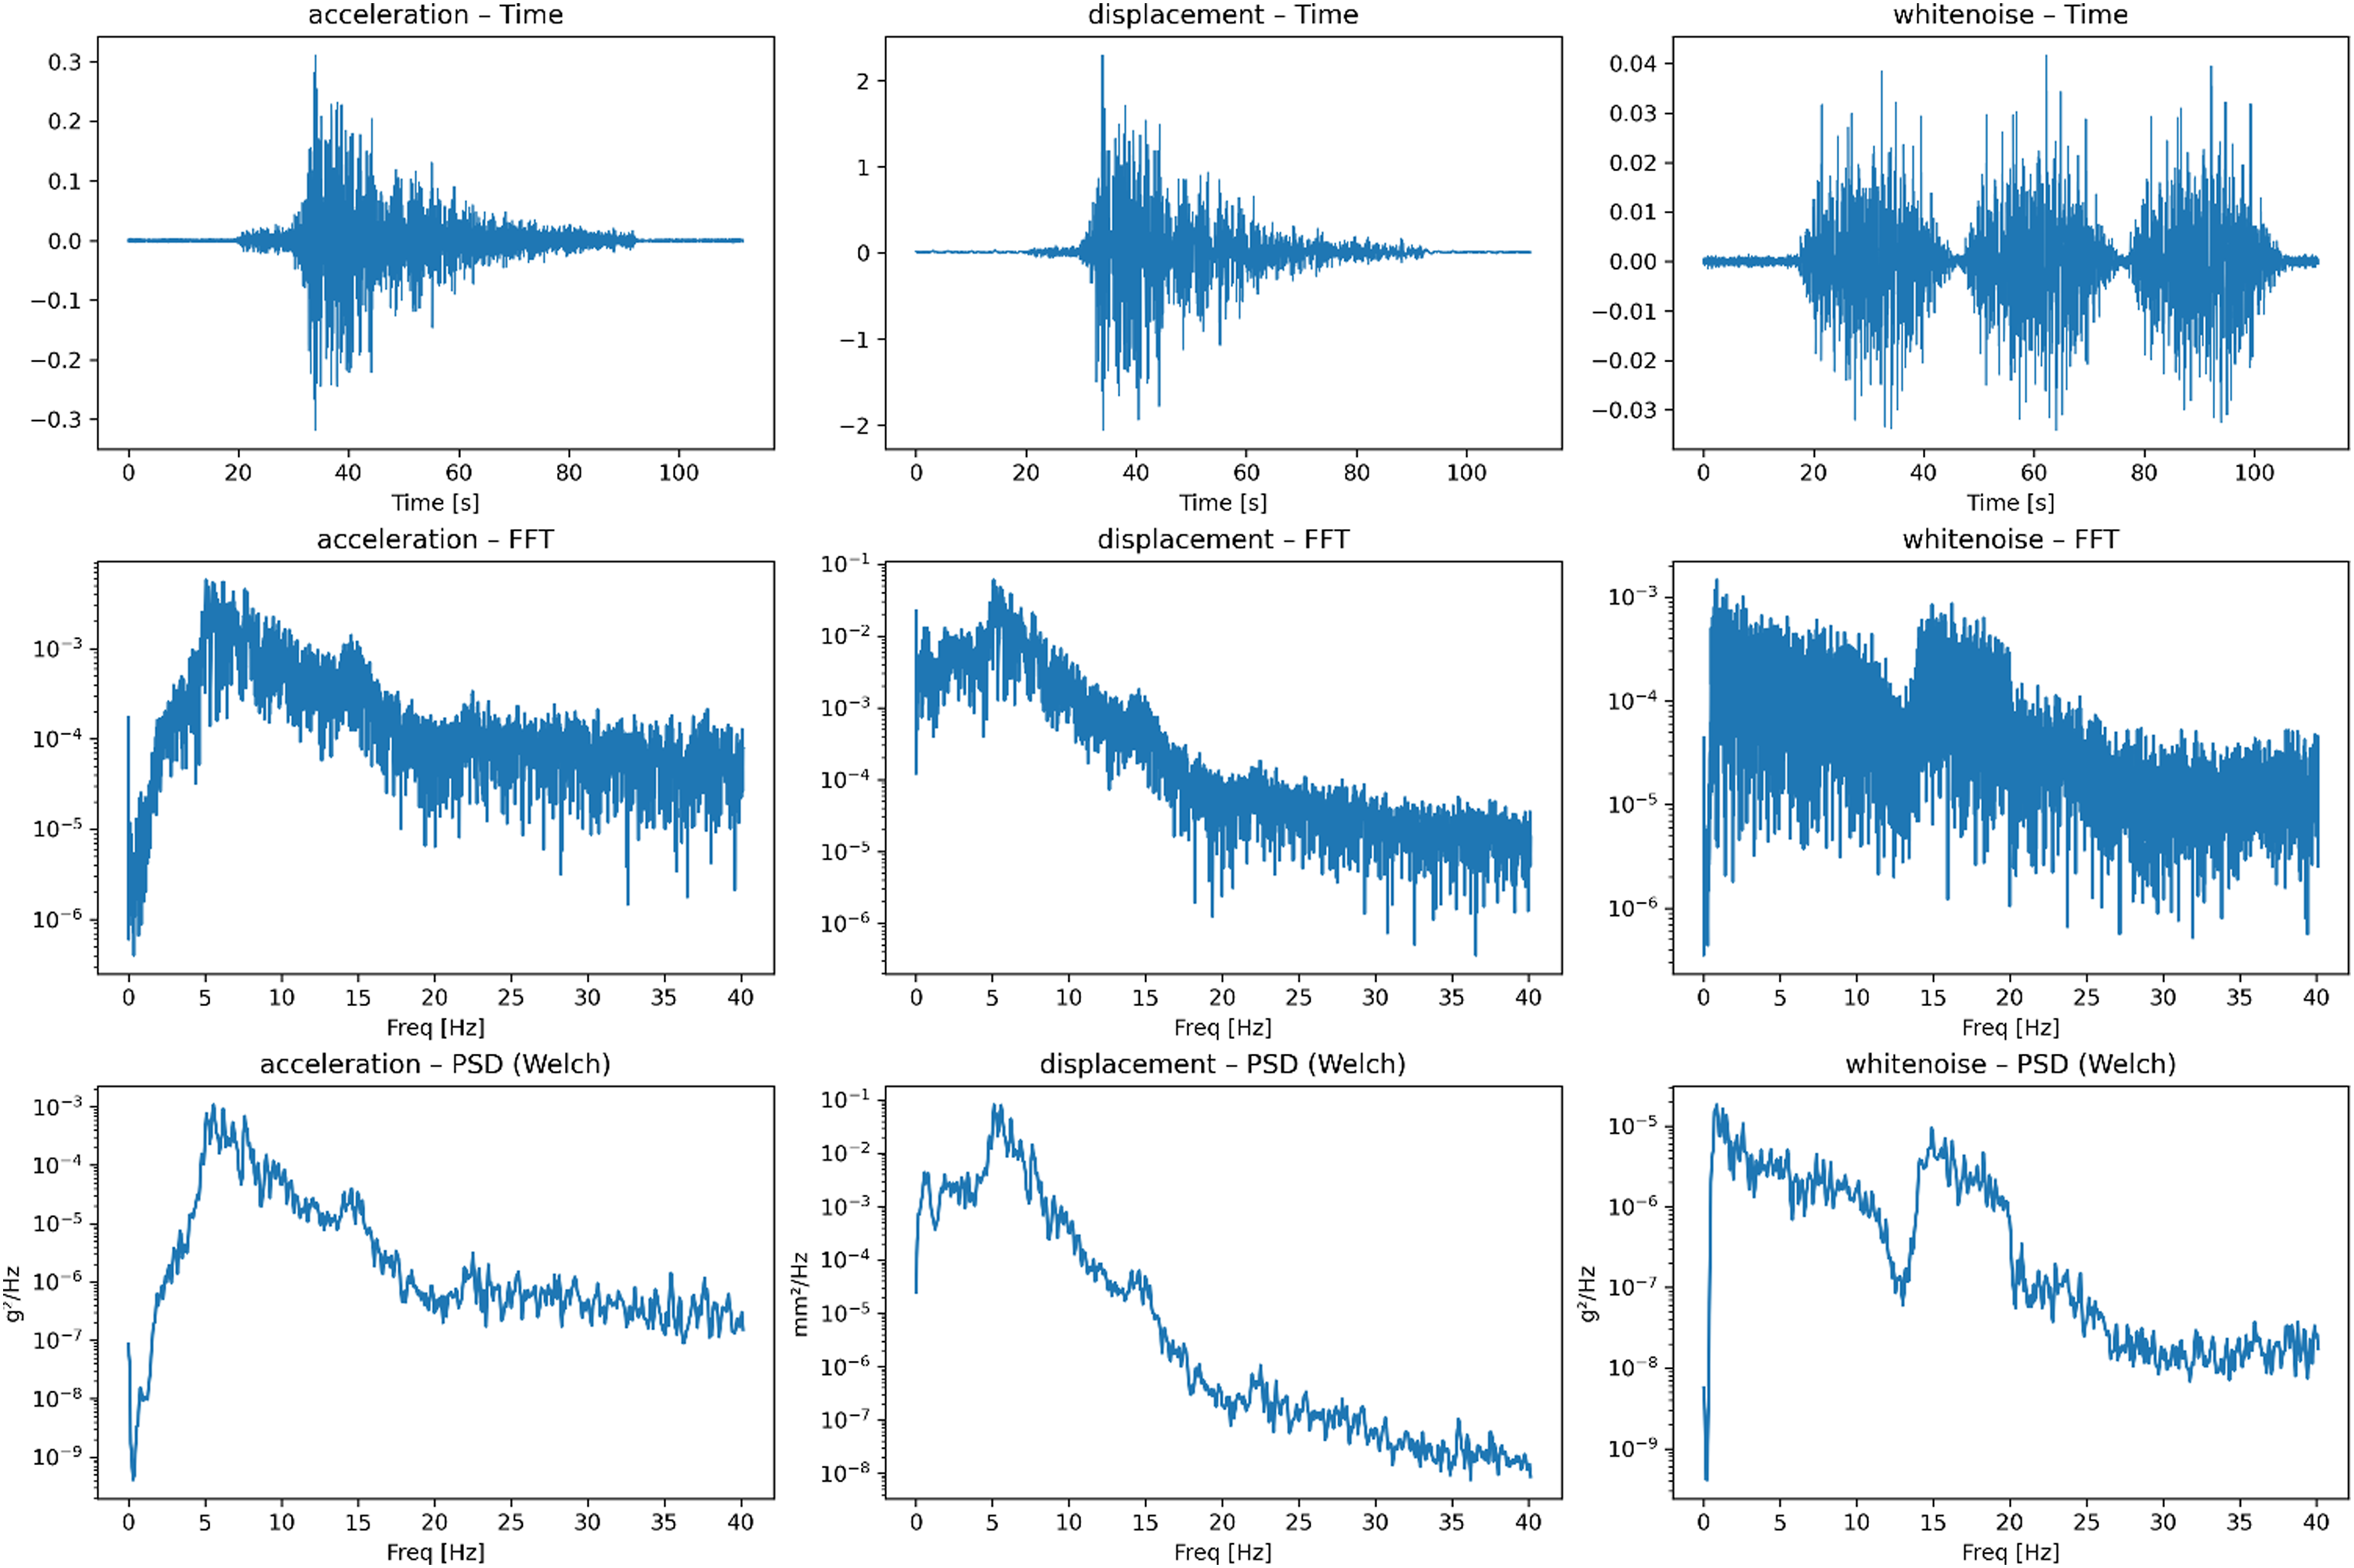
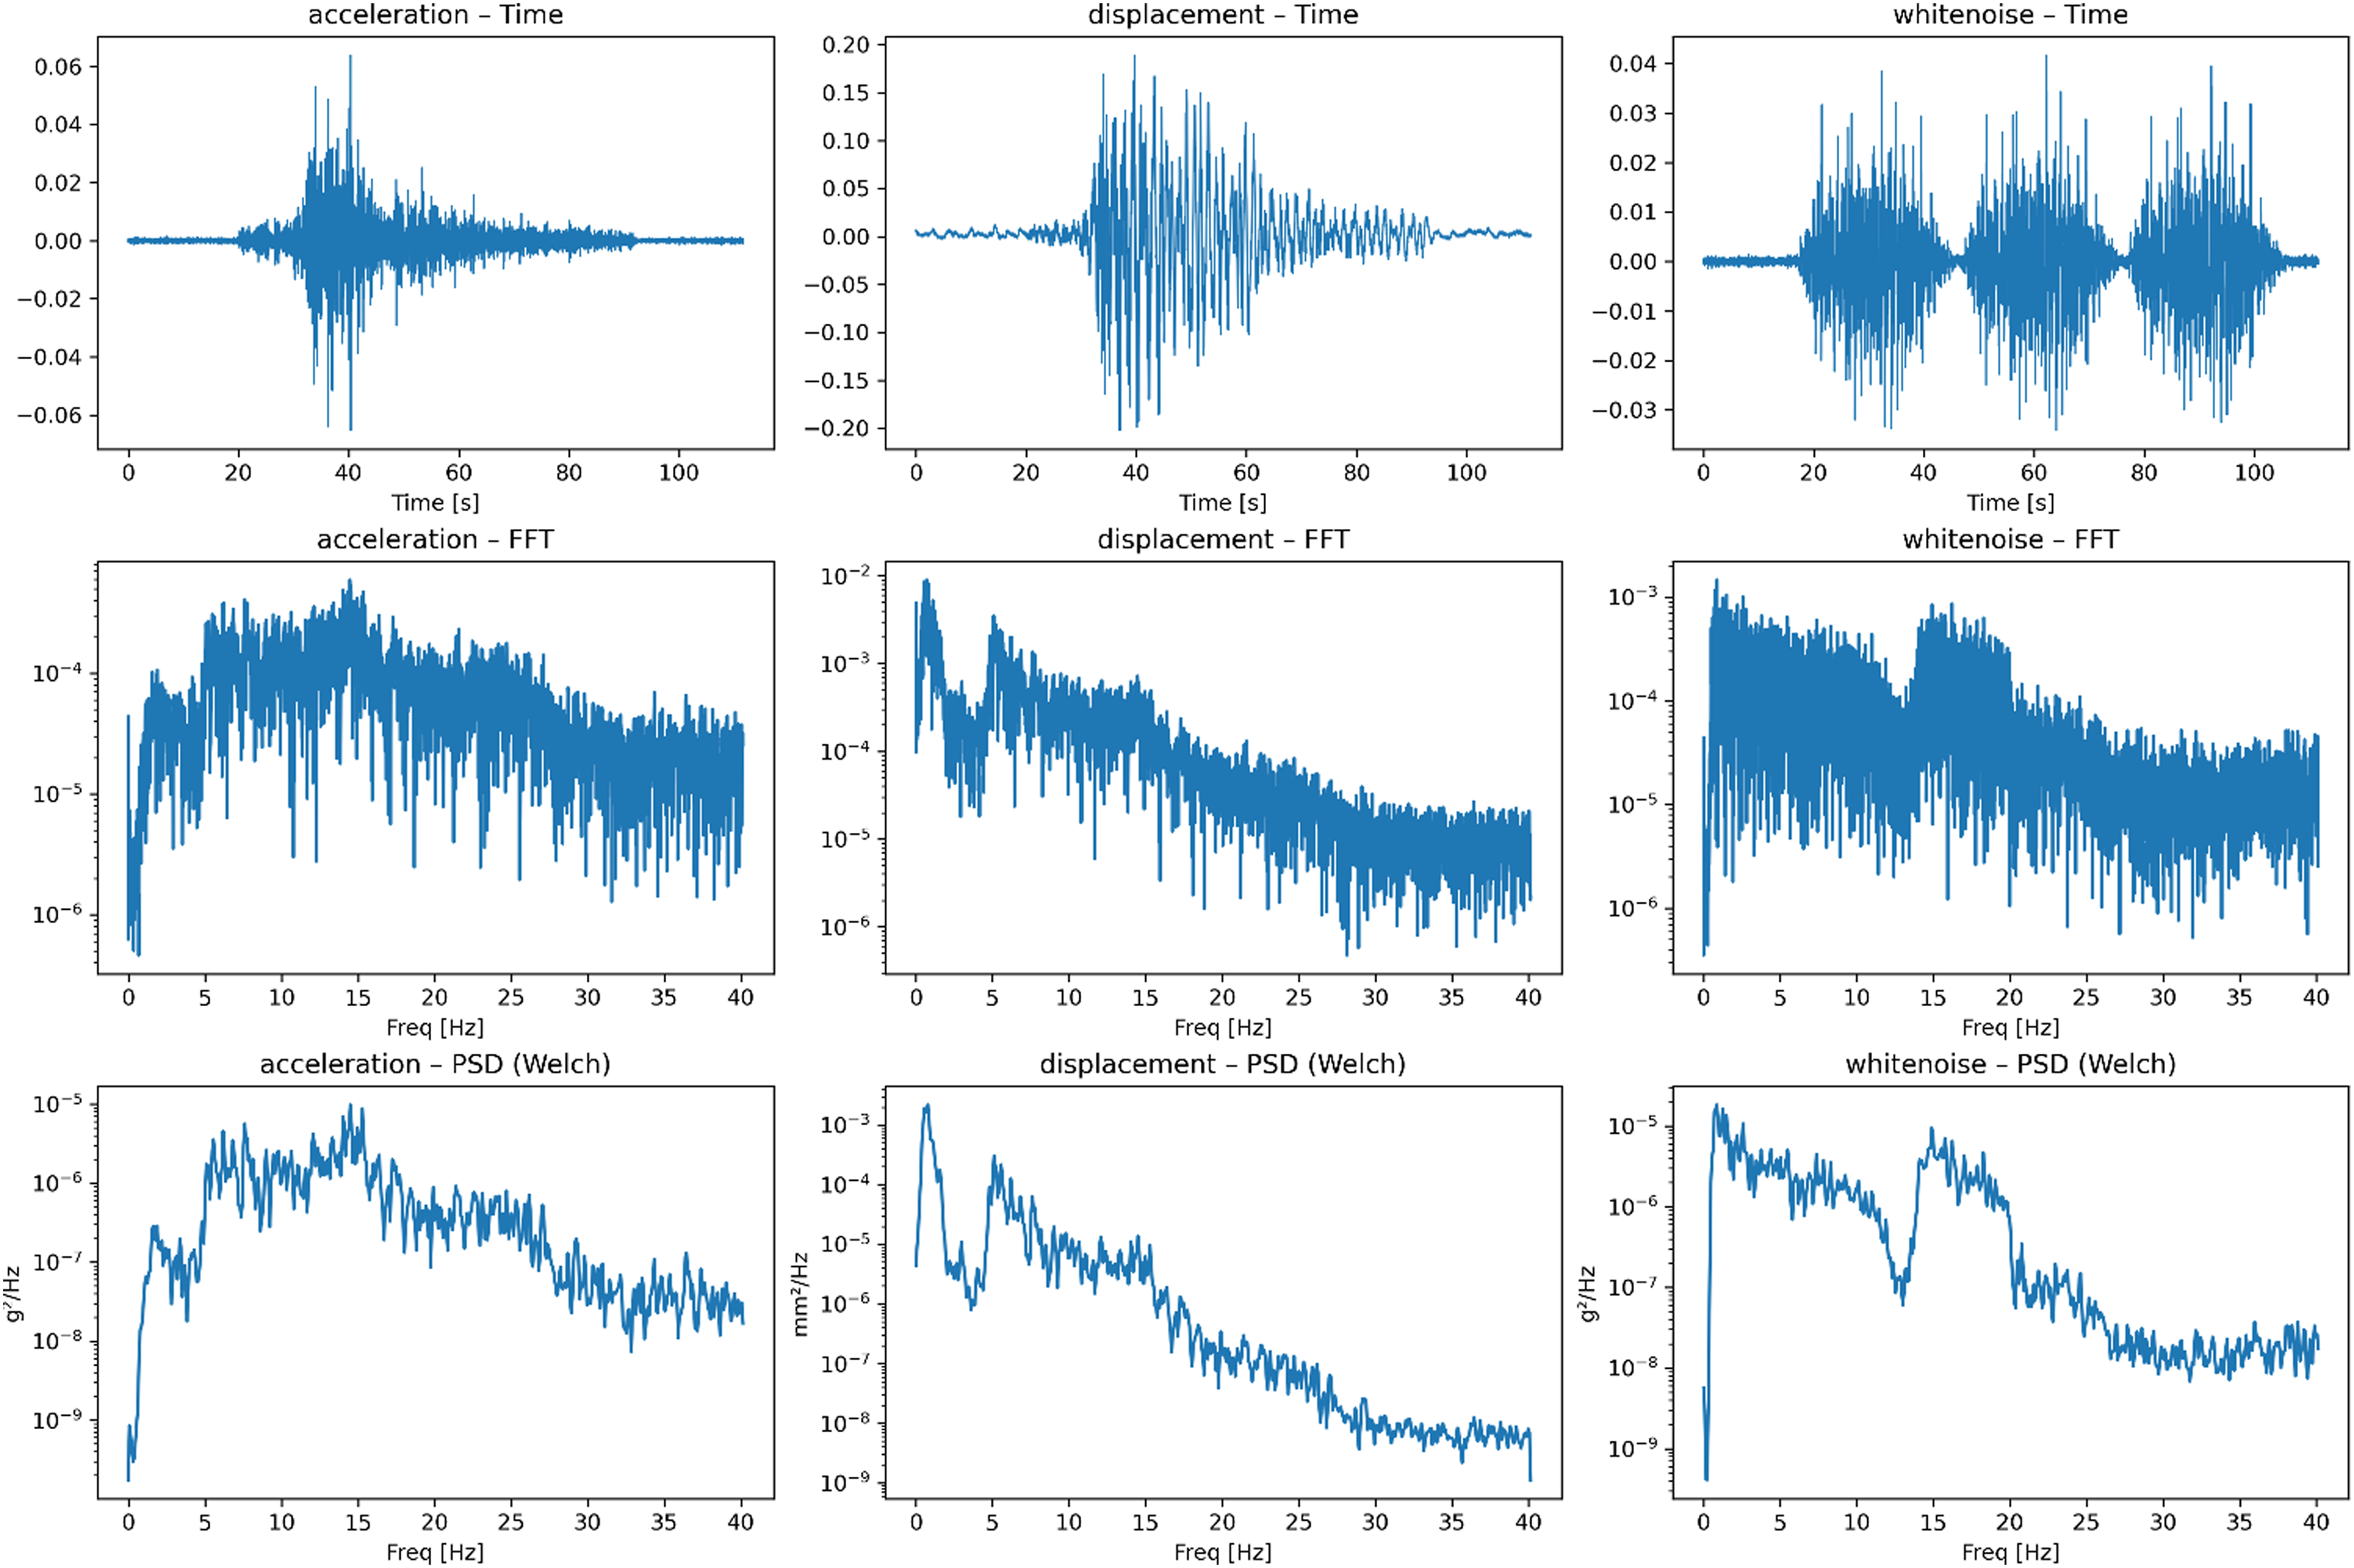
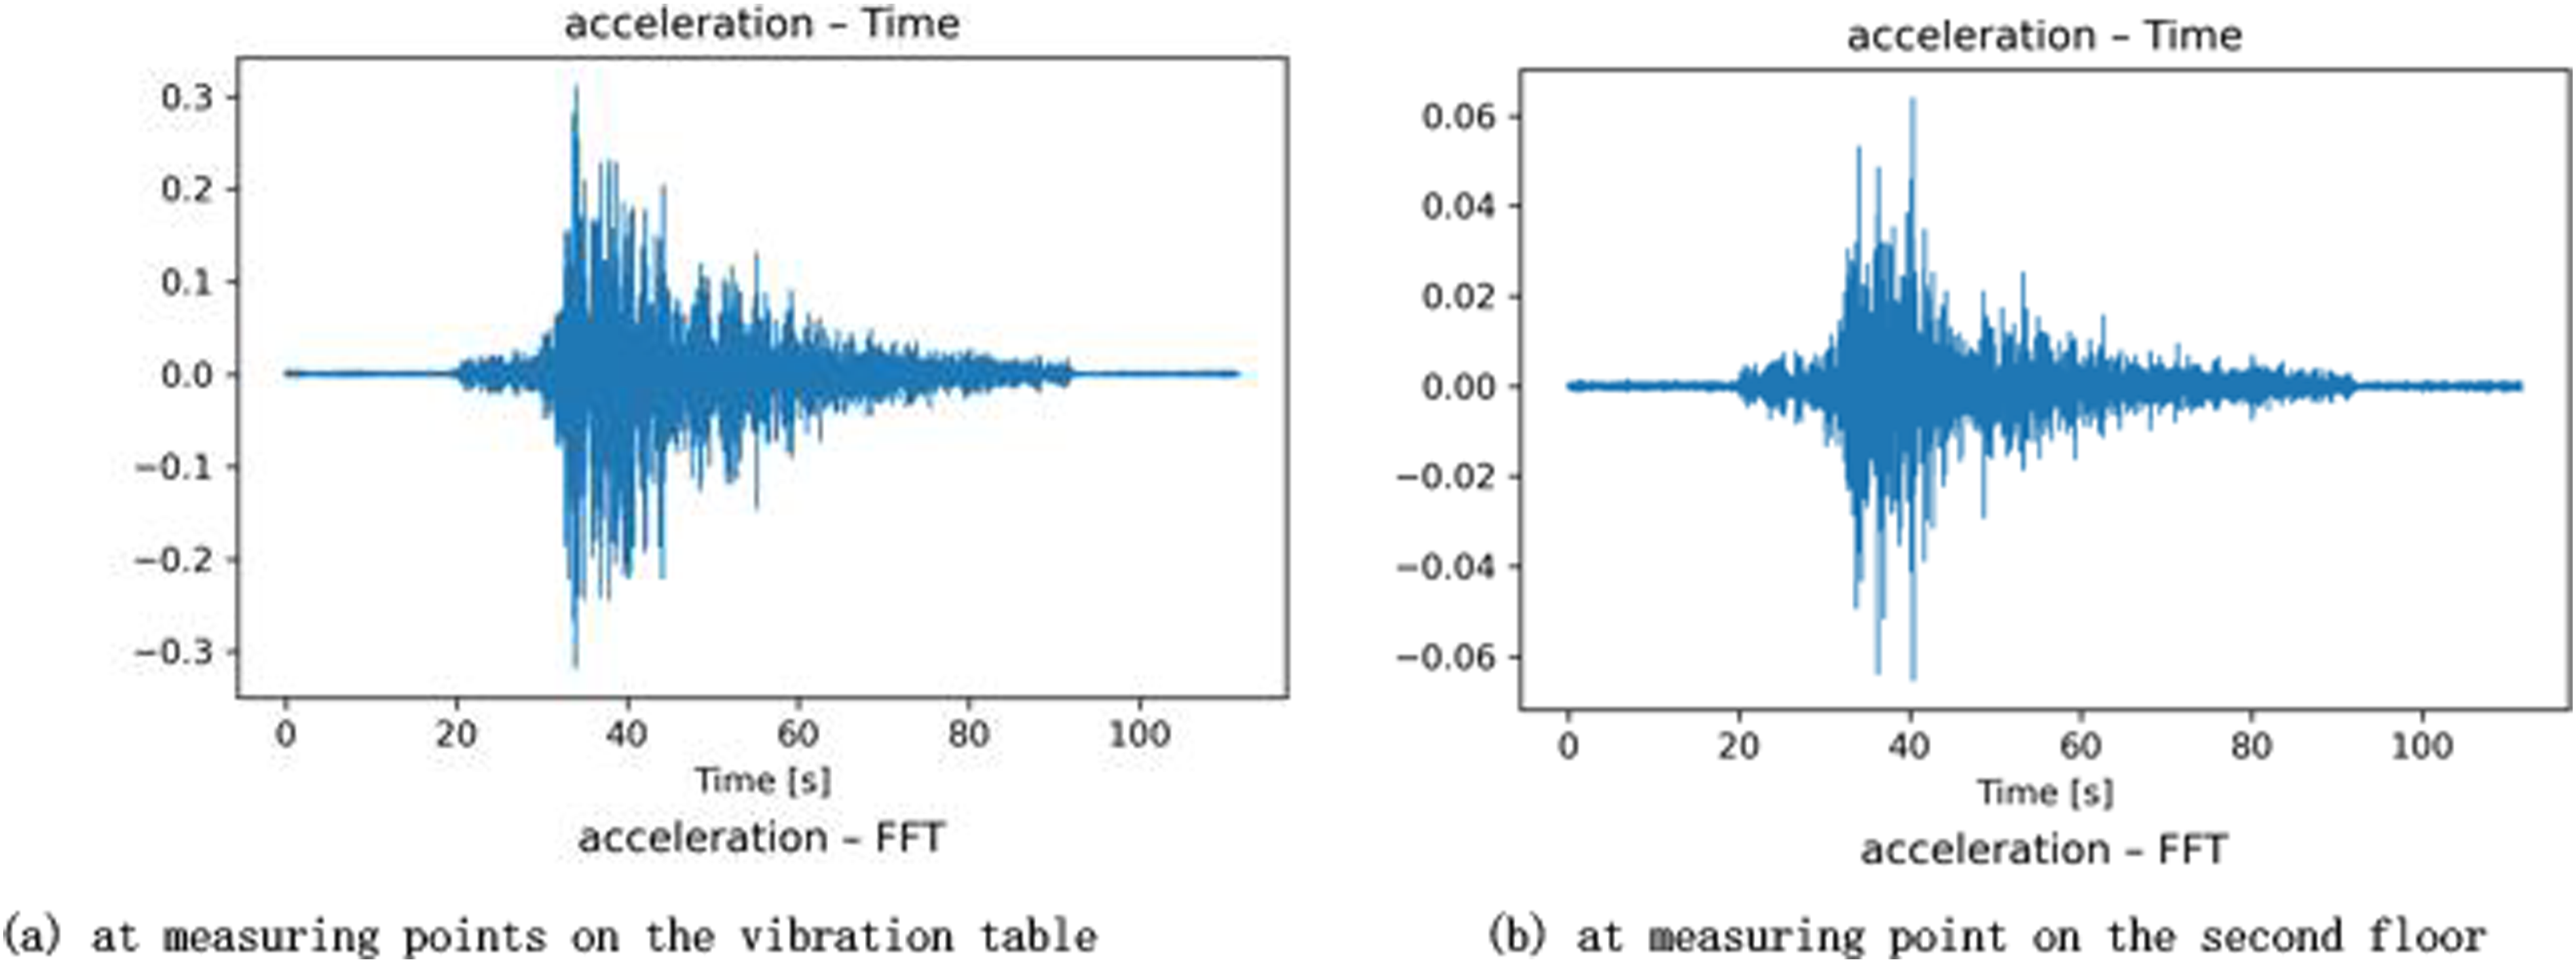
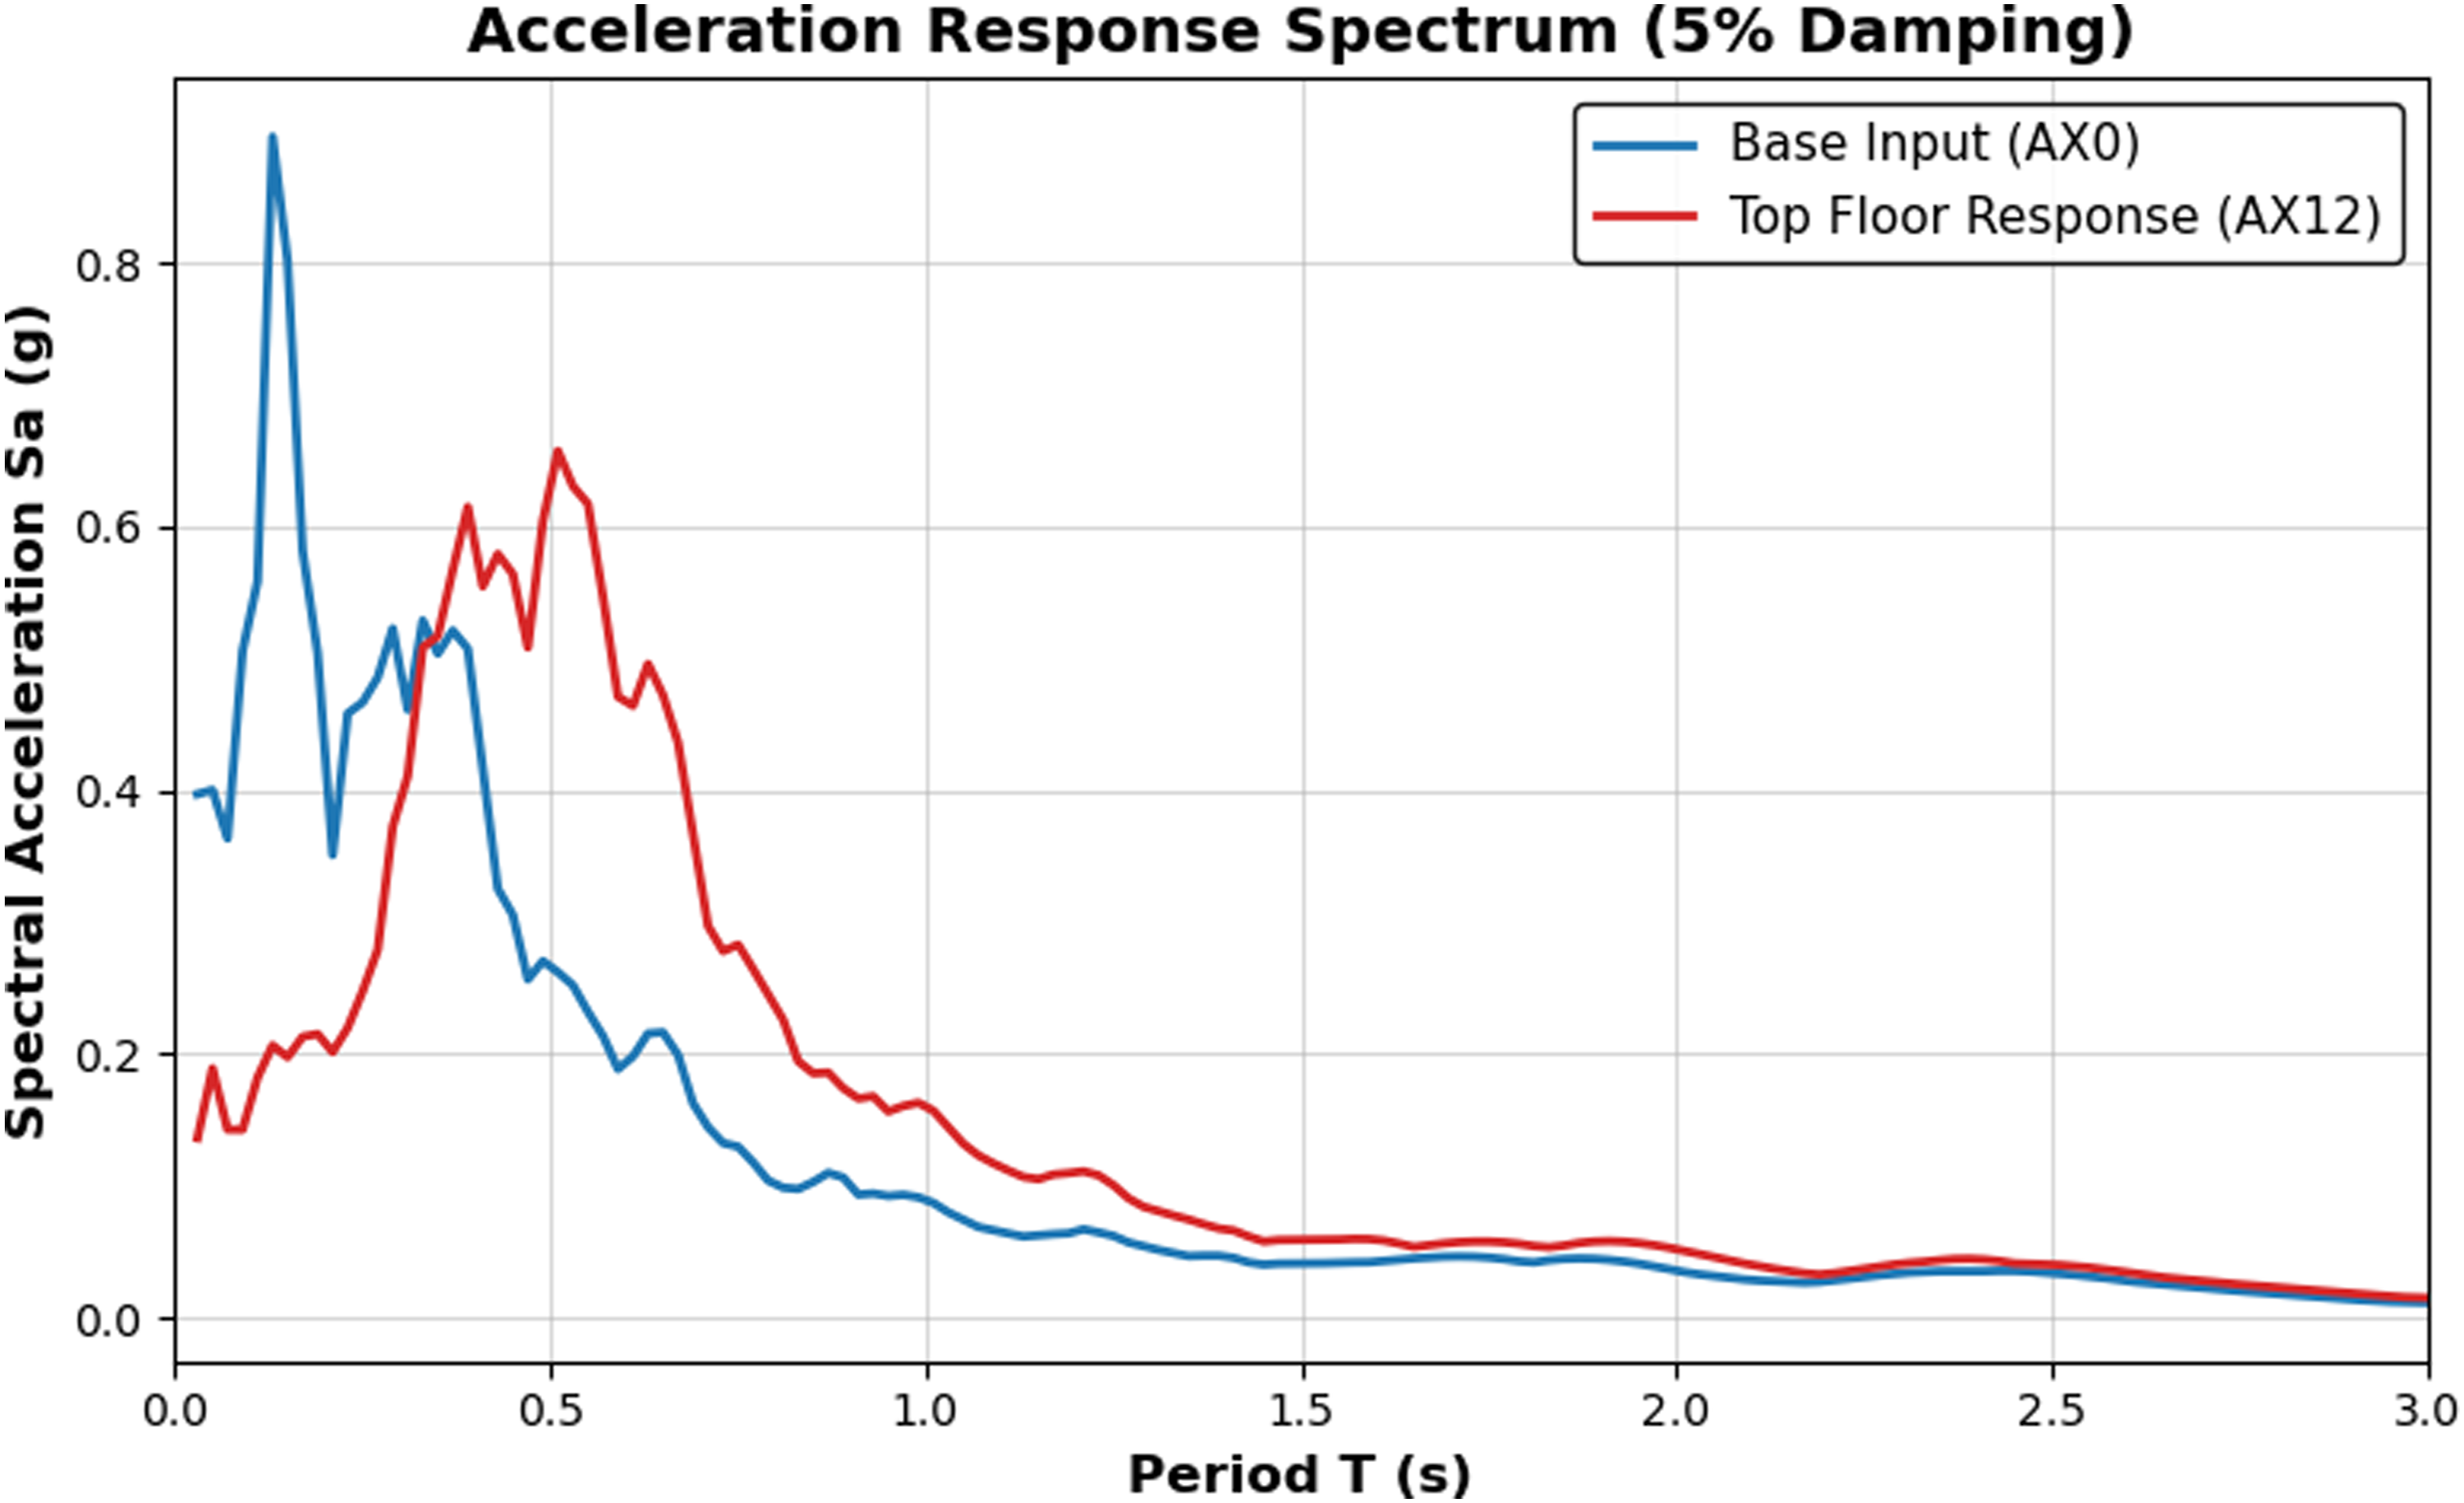
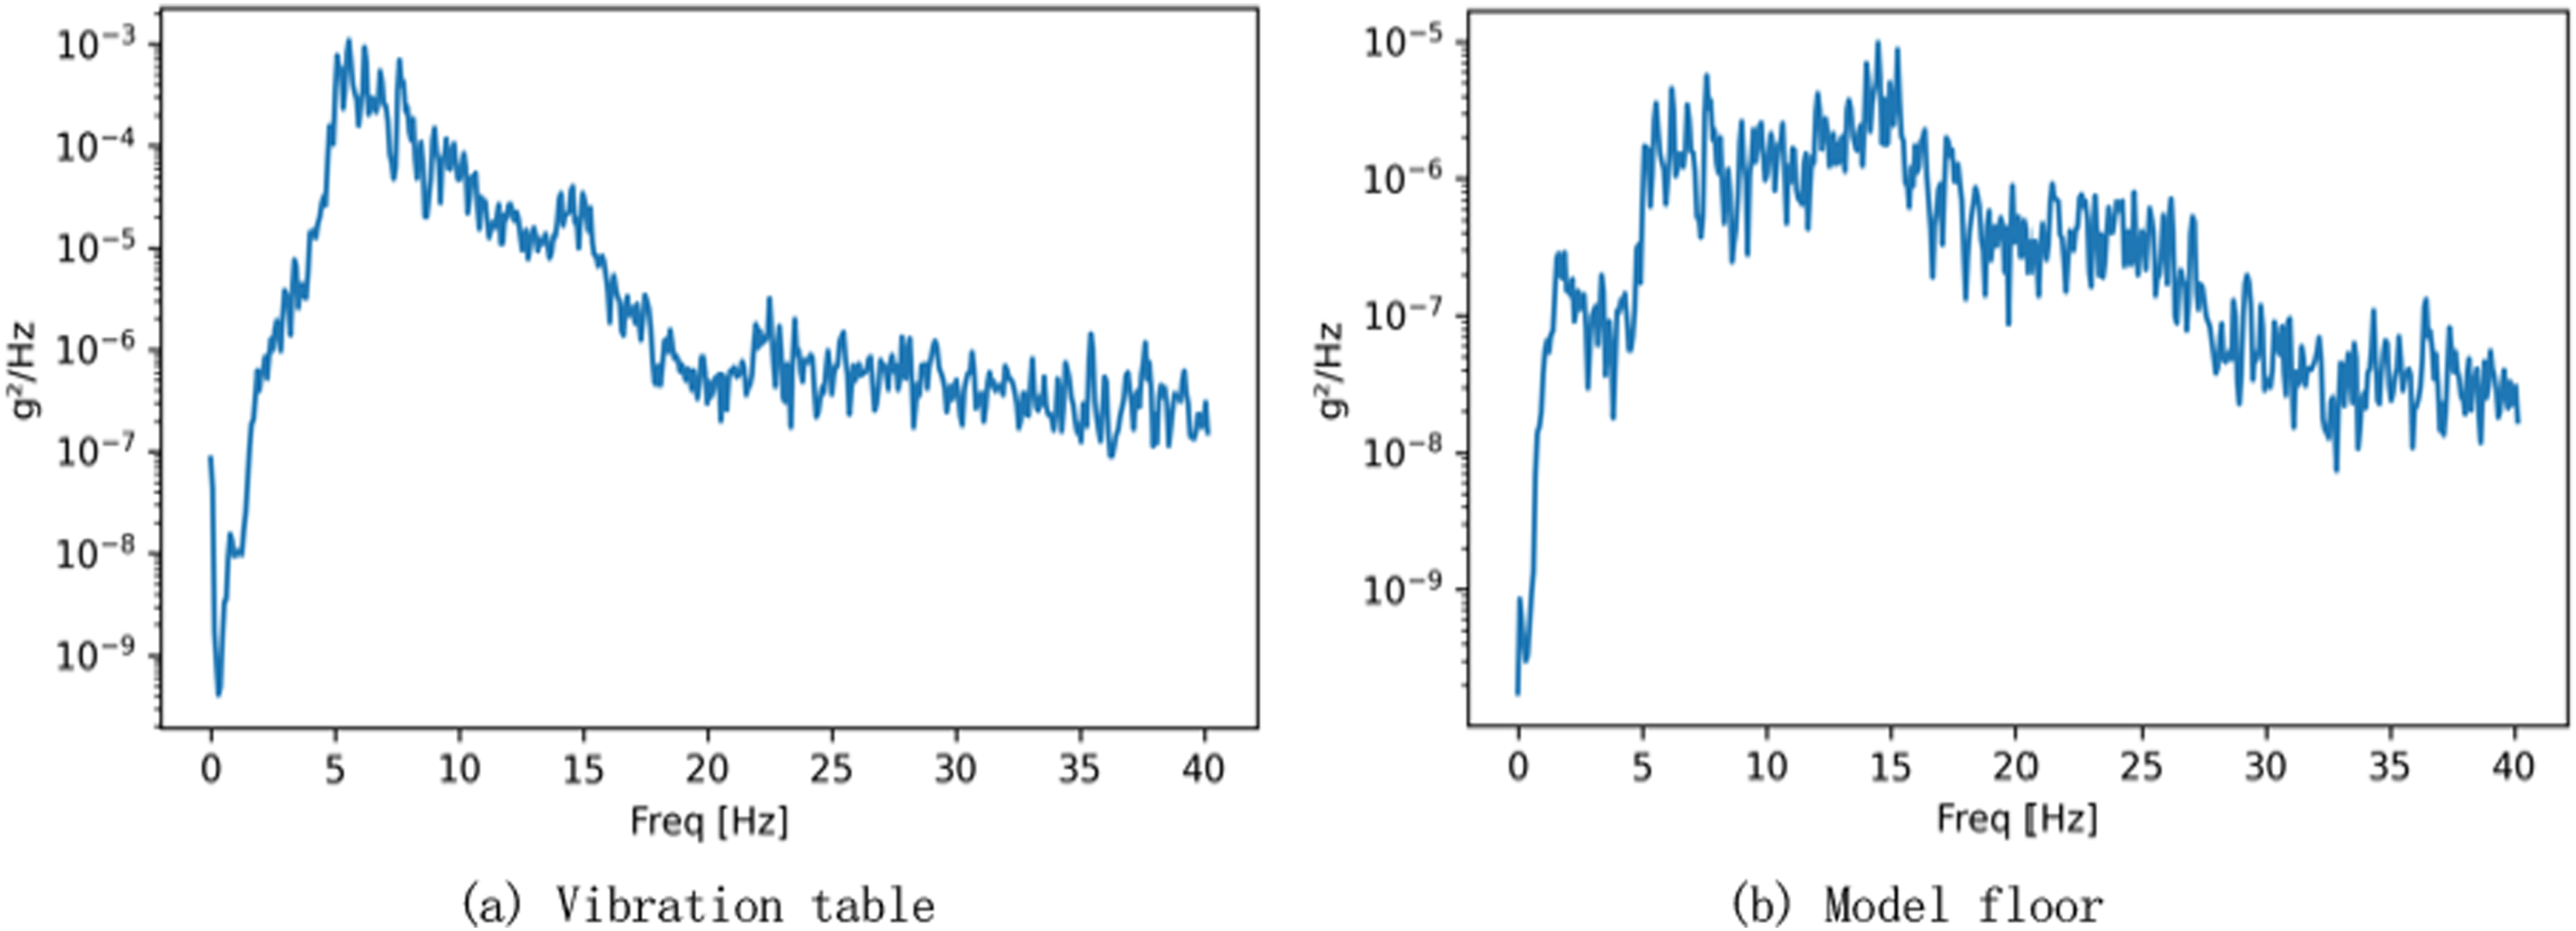
The spectral acceleration of the top floor response (AX12) is substantially suppressed compared to the base input (AX0) across almost the entire period range, particularly near the dominant period of the excitation. This spectral deamplification not only explicitly confirms the remarkable energy-dissipation effectiveness of the isolation layer but also demonstrates that the proposed Python-based toolchain is fully capable of executing advanced, complex structural dynamic analyses far beyond standard FFT. • • Table and floor acceleration-FFT.(a) Tabletop FFT frequency-amplitude (b) Floor FFT frequency-amplitude. Table and floor acceleration-PSD (Welch) curves.(a) Vibration table (b) Model floor.
4.2. Displacement response and quasi-resonance phenomenon
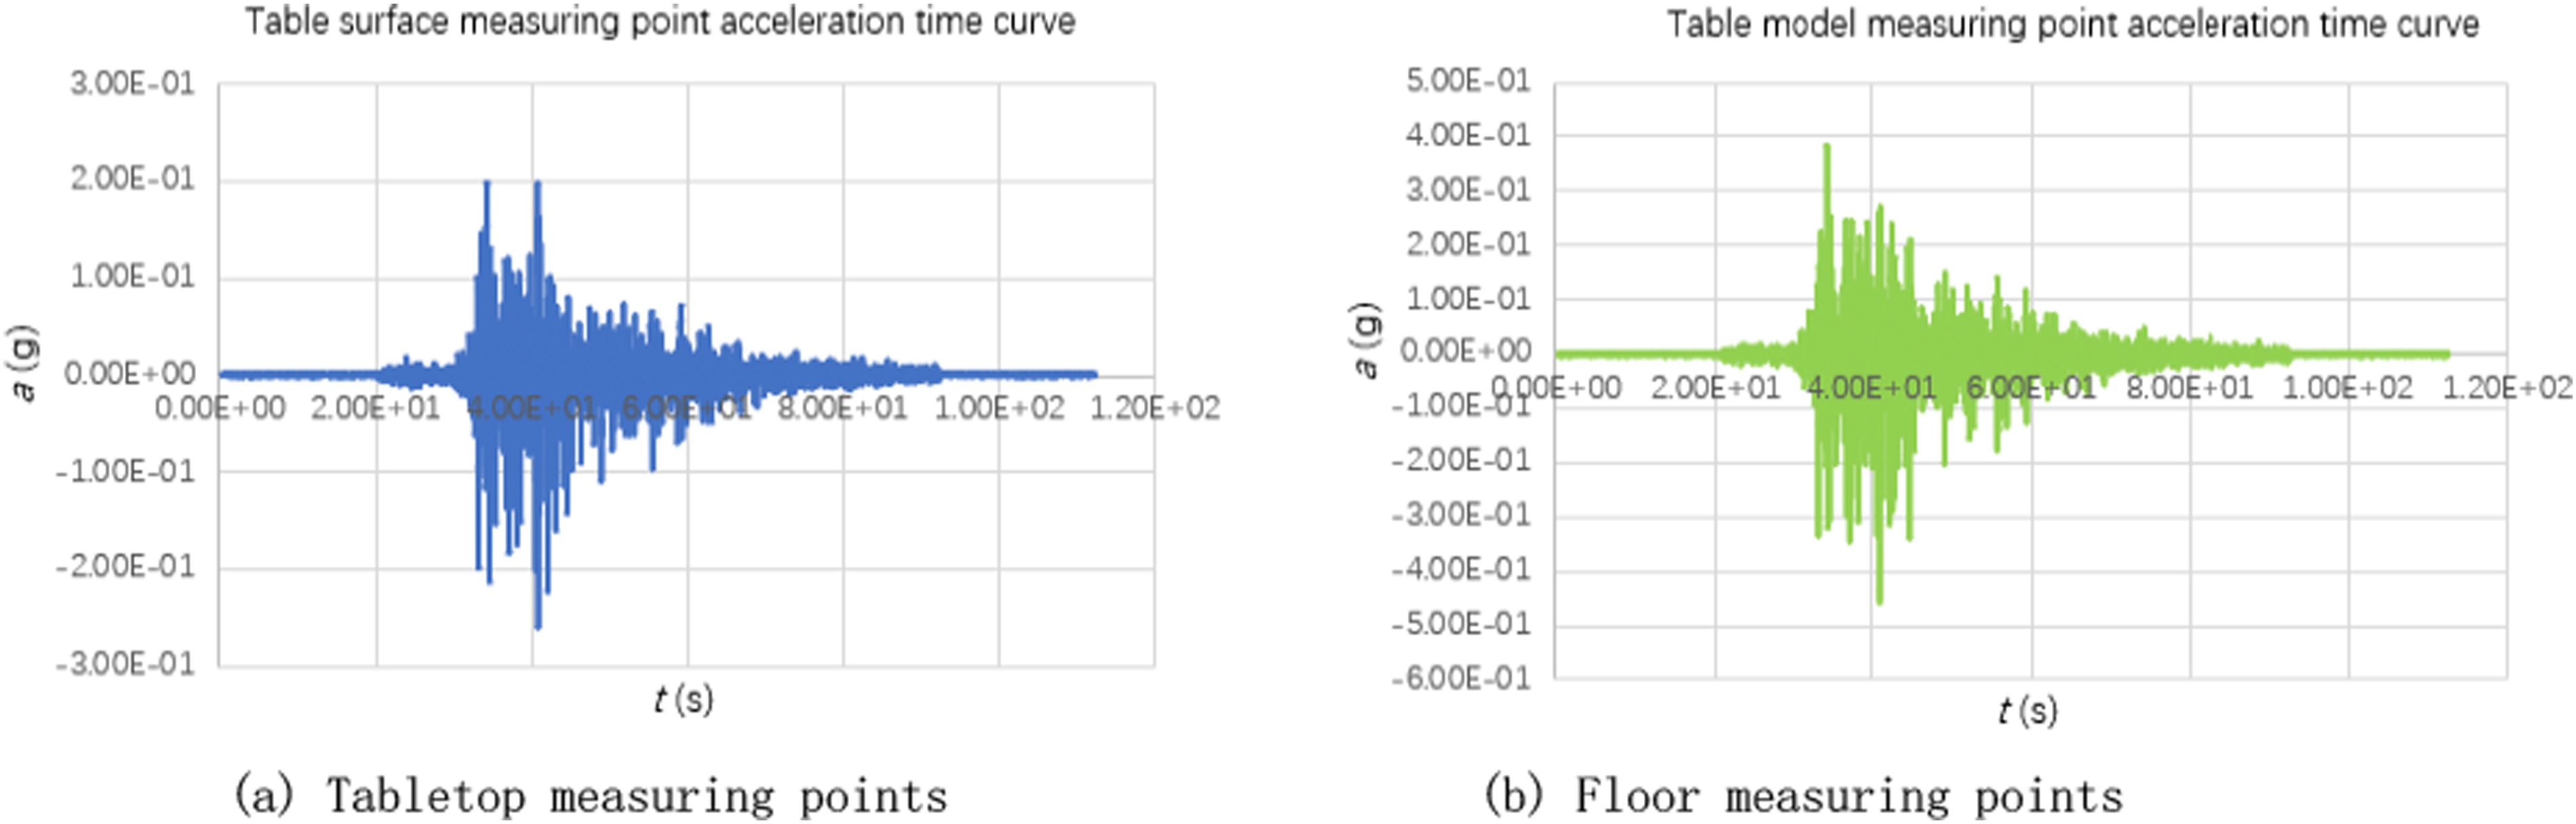
Unlike the attenuation of acceleration, the displacement response exhibits an amplification effect (Figures 12–14). Displacement time history curves of table and floor points.(a) Tabletop measuring points (b) Floor measuring points. Tabletop and floor displacement - FFT plot.(a) Table displacement -FFT (b) Floor displacement -FFT. Displacement-PSD (Welch) curves.(a) Table displacement -PSD (b) Floor displacement -PSD.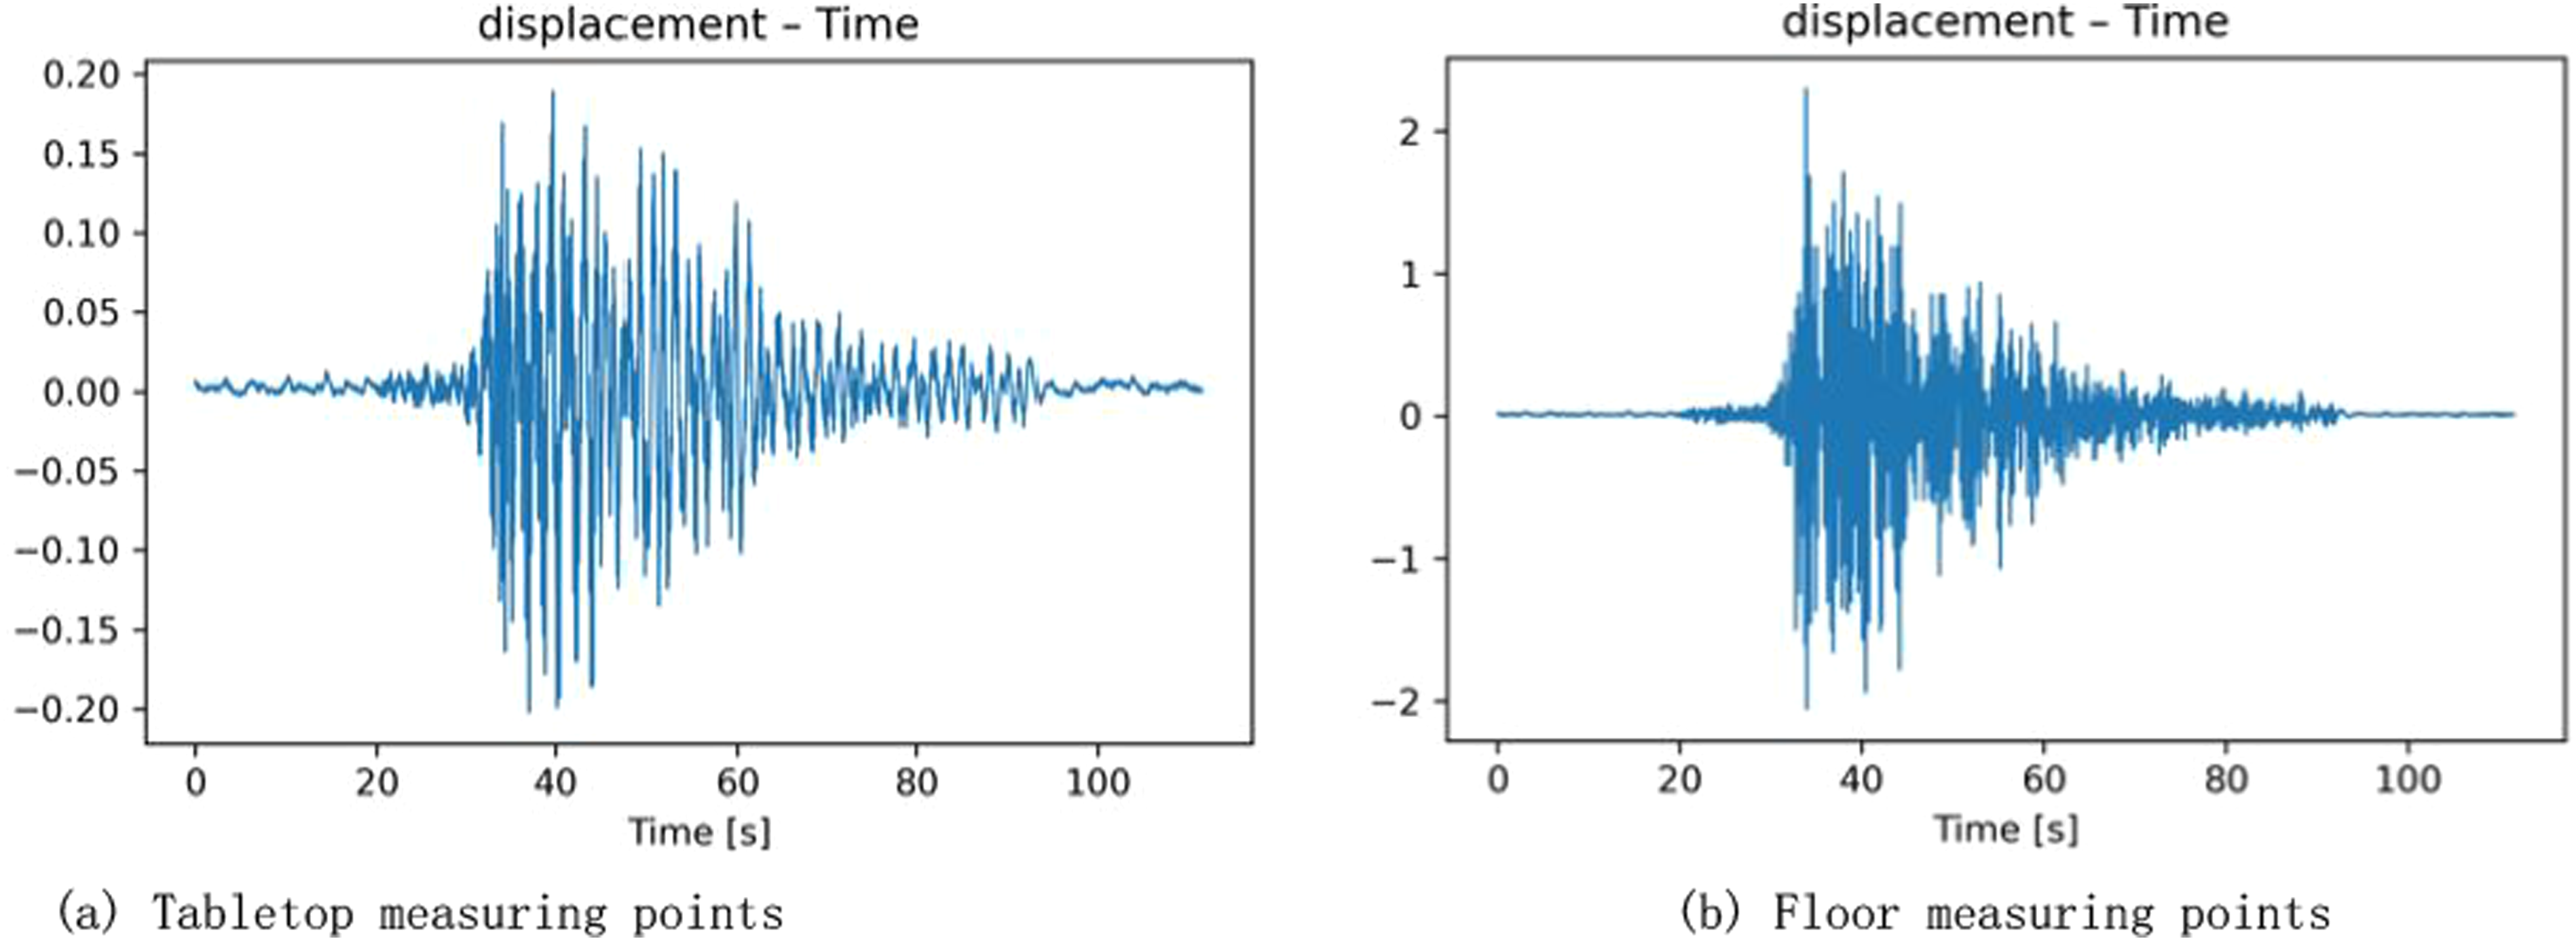
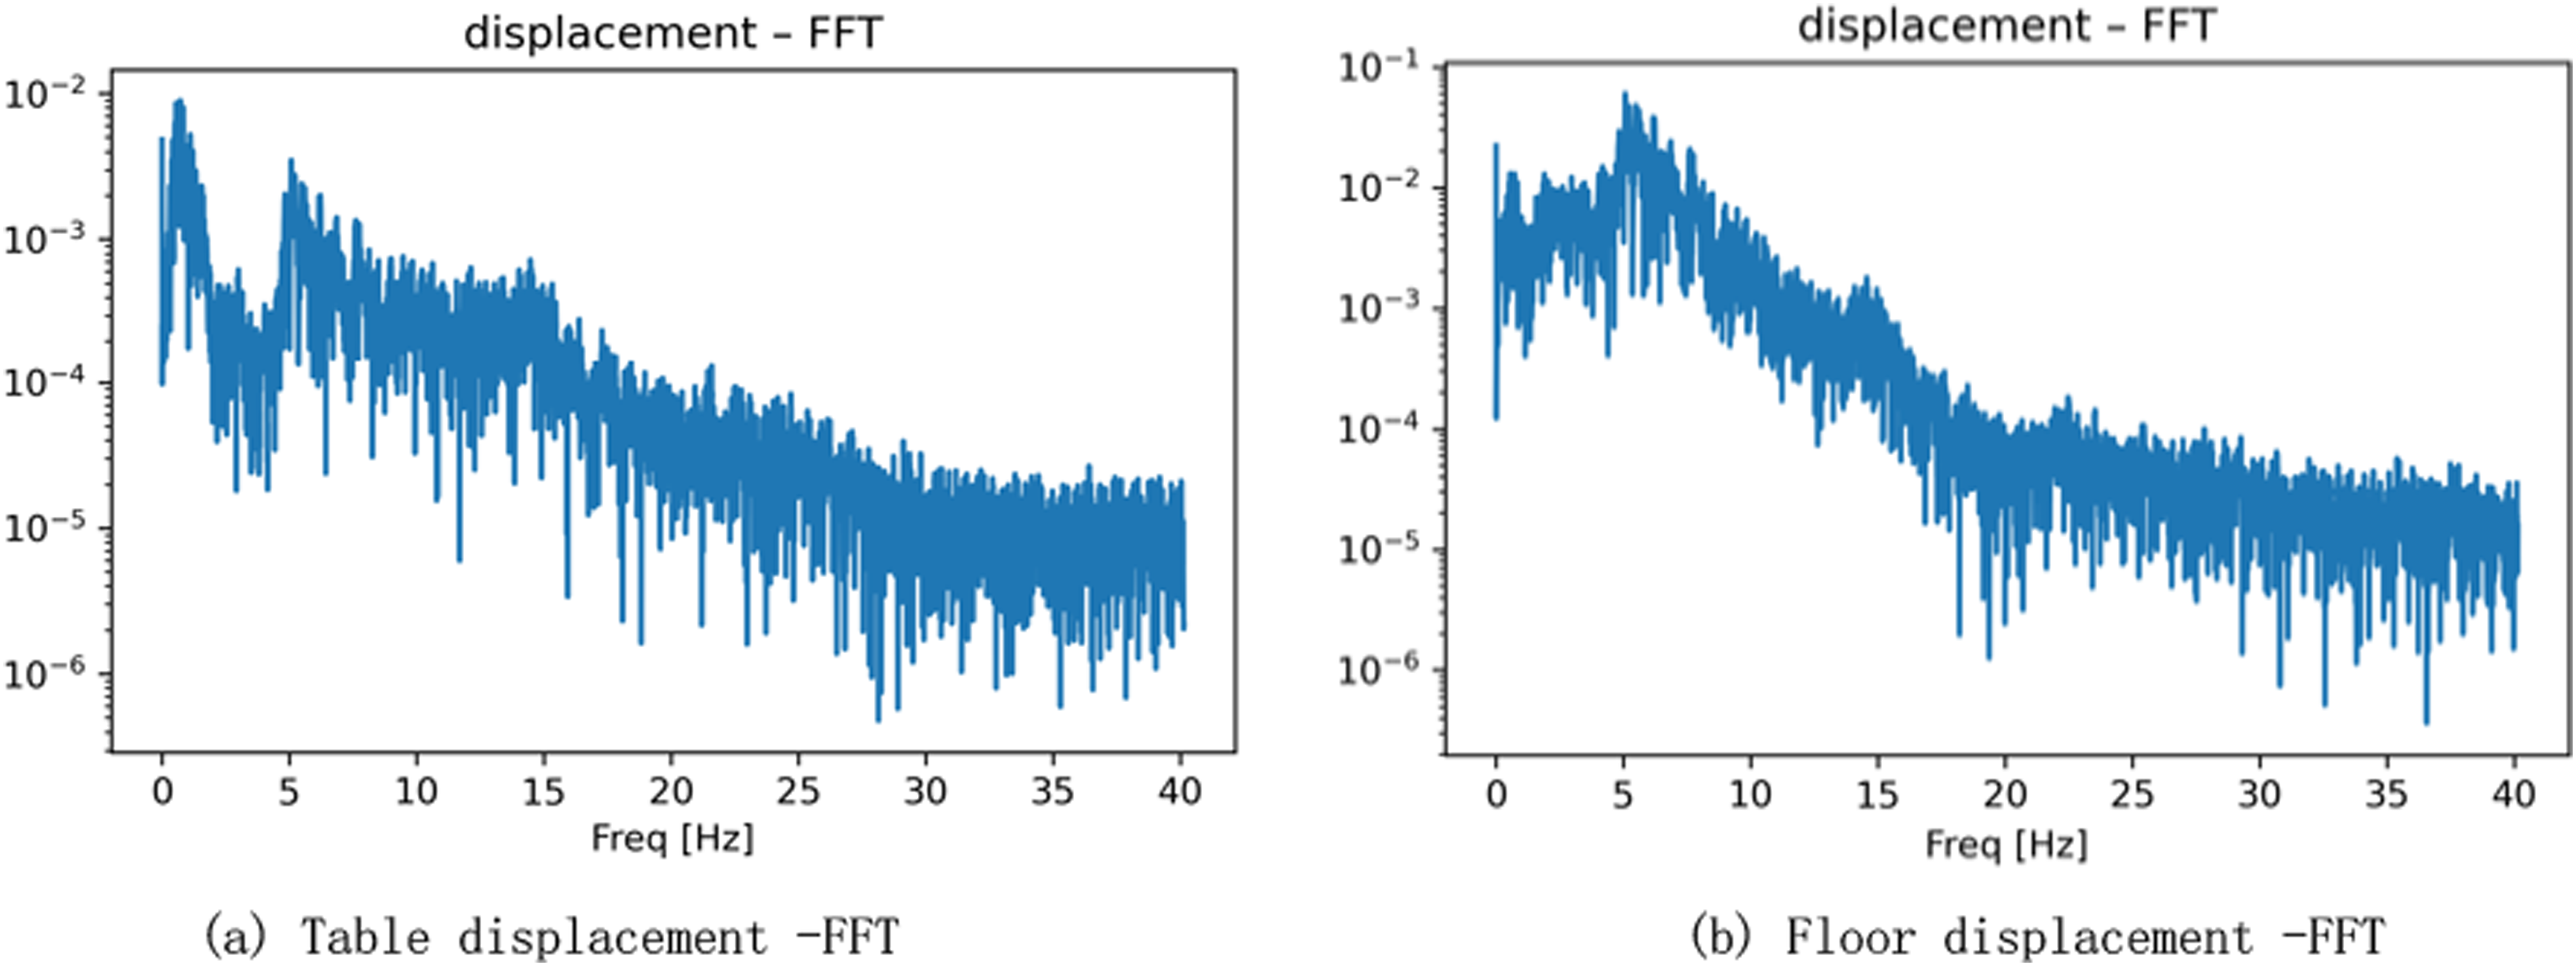
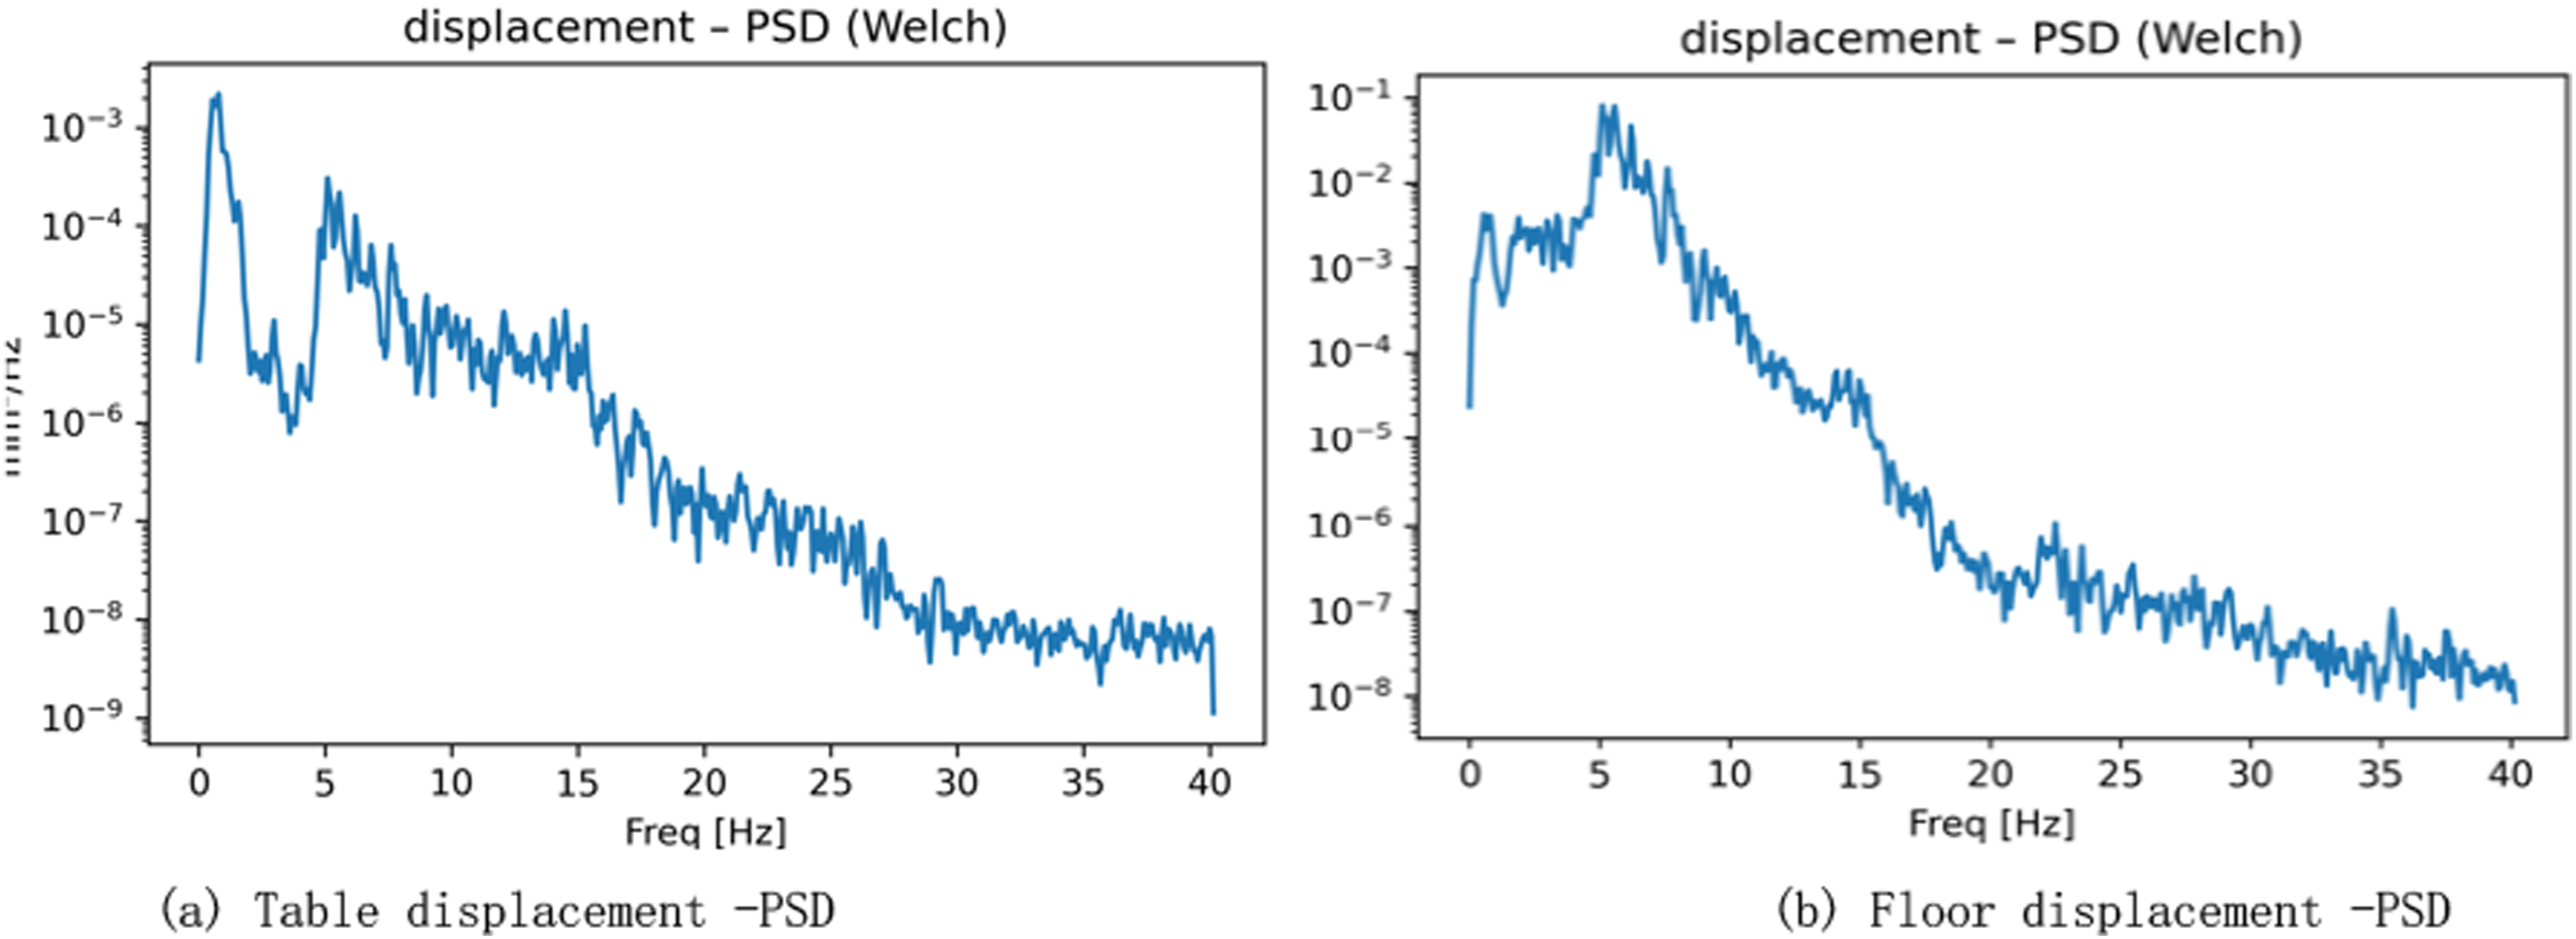
The table input displacement peak is only ±0.2 mm (high-frequency vibration), while the floor displacement peak reaches ±2 mm, an amplification of about 10 times. PSD analysis shows that the structure “focuses' the broadband input energy near its natural frequency of 2–4 Hz, leading to significant amplification of displacement power in this frequency band.
Calculations indicate a maximum inter-story drift ratio of approximately 1/500 under this operating condition. According to seismic performance evaluation standards for masonry structures, this drift level exceeds the purely elastic deformation limit (typically around 1/800 to 1/1000) and reaches the critical threshold for initial slight damage. At an inter-story drift of 1/500, the amplified lateral displacement induces concentrated shear and principal tensile stresses within the structural walls. When these local stresses exceed the adhesive bond strength between the MU10 bricks and the M7.5 mortar, the structure initiates the formation of hairline micro-cracks. These micro-cracks typically propagate along the stepped mortar joints or initiate near stress concentration zones, such as the corners of window and door openings. While these initial micro-cracks do not immediately precipitate severe structural failure or global collapse, their progressive accumulation and subsequent expansion under continuous or repeated seismic loading significantly elevate the risk of sudden brittle failure. Therefore, identifying this threshold warrants rigorous monitoring of long-term stiffness degradation and structural health.
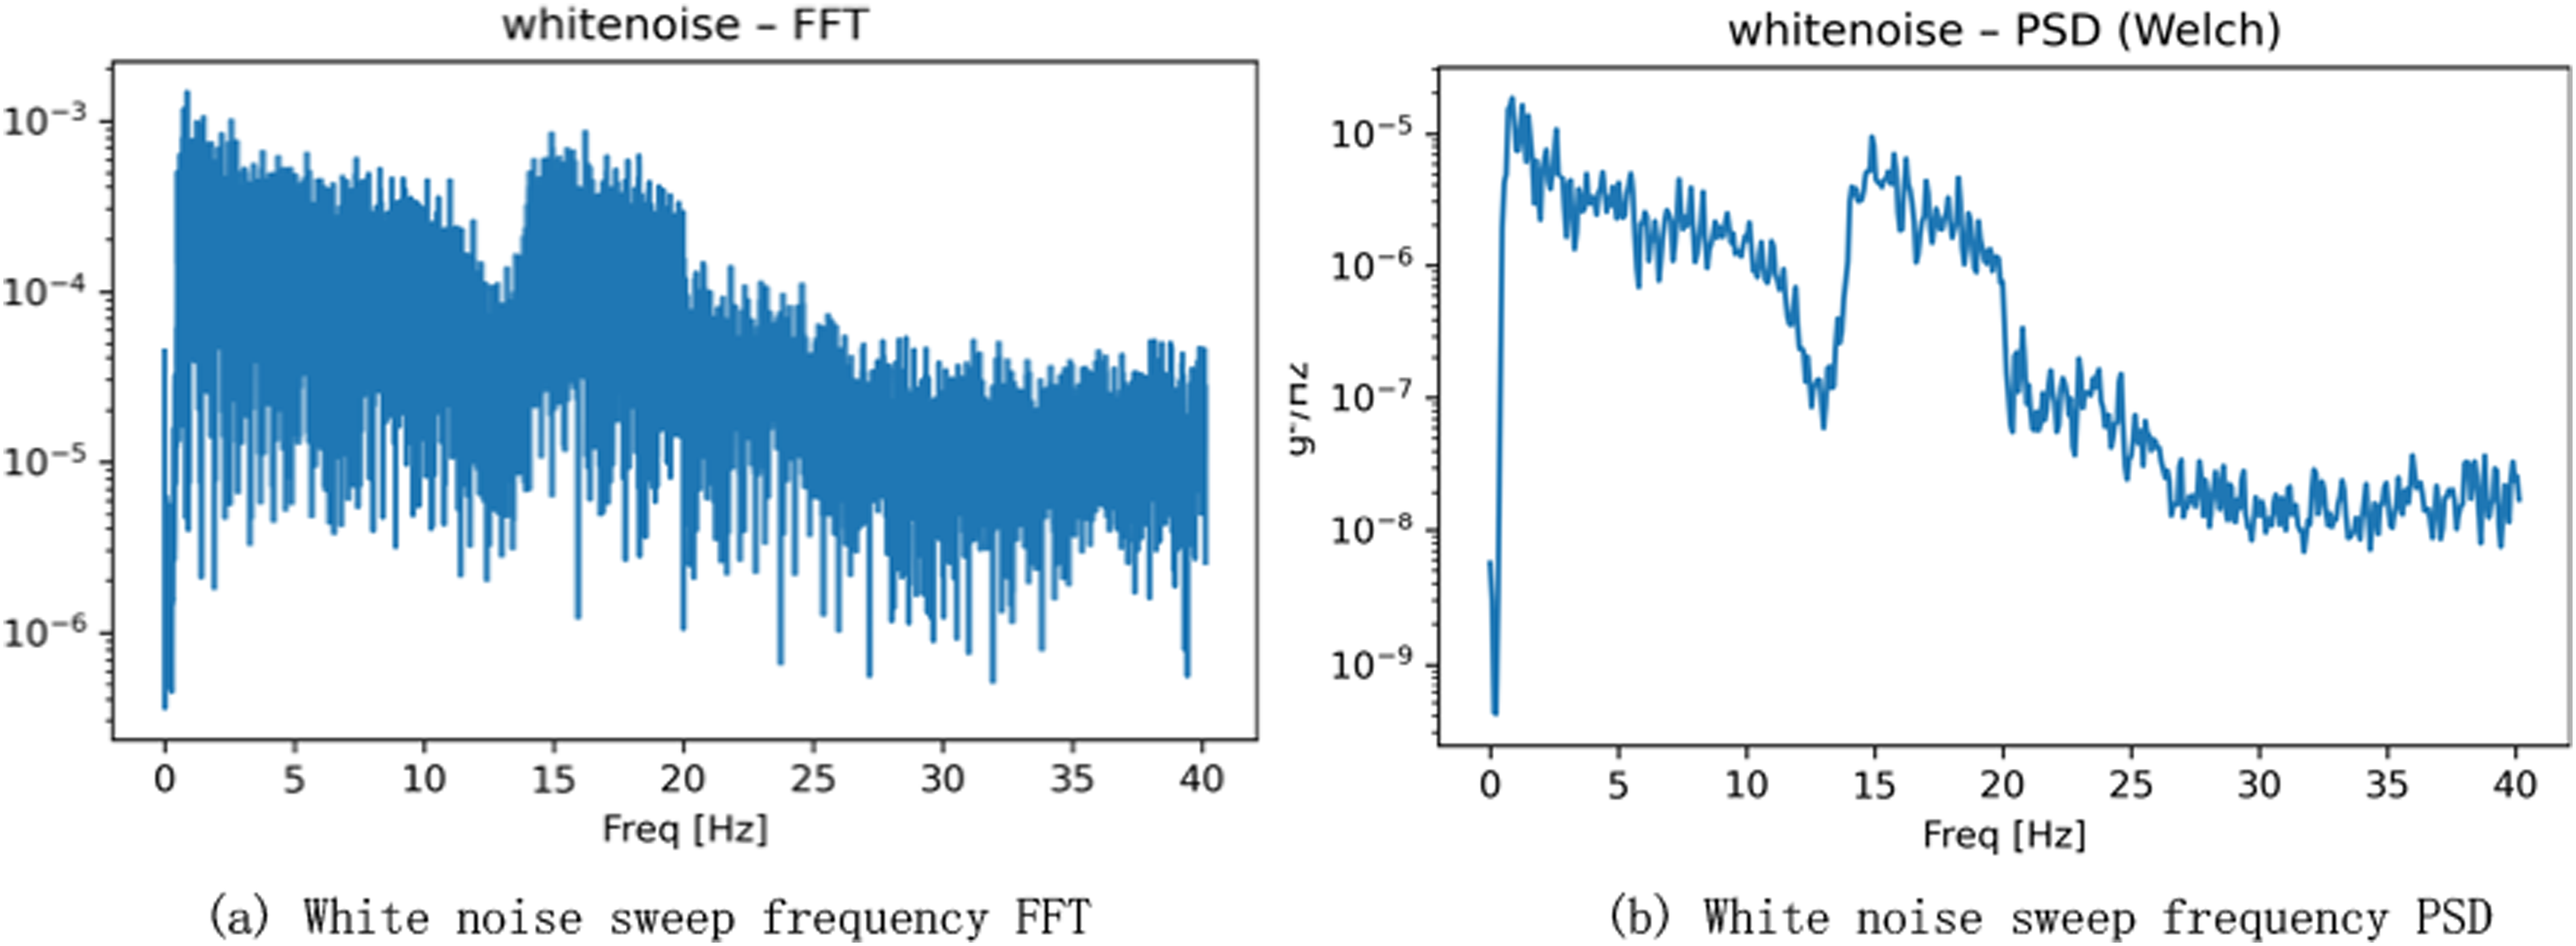
4.3. Damage identification based on white noise sweep
By comparing the white noise sweep data before and after the seismic wave input (Figure 15), the structural health status was evaluated. • • • White noise sweep FFT and PSD after seismic input.(a) White noise sweep frequency FFT (b) White noise sweep frequency PSD.
Furthermore, to quantitatively validate the reliability of the identified results, rigorous statistical analysis and error metrics were incorporated into the dynamic characteristic evaluation. The precision of the identified natural frequencies is inherently governed by the frequency resolution (
5. Comparison and evaluation of analysis methods
The Python analysis results were compared with those processed by traditional Excel and Origin (Figures 16 and 17). • • • • • Acceleration time history in excel.(a) Tabletop measuring points (b) Floor measuring points. Comparison of acceleration time history in origin.
6. Conclusions
Addressing the needs of masonry structure shaking table test data analysis, this paper developed an automated processing method based on the Python open-source toolchain. Combined with experimental data, the following conclusions are drawn:
Future Recommendations: Building upon the proposed Python-based framework, future studies should focus on integrating machine learning algorithms to enable automatic damage pattern recognition and crack propagation prediction based on the extracted dynamic indicators. Furthermore, transitioning this offline data processing pipeline into a real-time structural health monitoring (SHM) system during shaking table tests would provide immediate safety feedback. Finally, developing a user-friendly Graphical User Interface (GUI) and establishing an open-source database will further lower the programming barrier for civil engineers, promoting standardized data sharing and collaborative research across the global seismic engineering community.
Supplemental material
Supplemental material - Automated data processing and analysis method for shaking table tests of masonry structures based on python open-source toolchain
Supplemental material for Automated data processing and analysis method for shaking table tests of masonry structures based on python open-source toolchain by Zheng yao, Wang Yijun in Science Progress
Footnotes
Author Contributions
Conceptualization, Y.W.; methodology, Y.W.; software, Y.W.; validation, Y.W.; formal analysis, Y.W.; writing—original draft preparation, Y.W. All authors have read and agreed to the published version of the manuscript.
Funding
The authors disclosed receipt of the following financial support for the research, authorship, and/or publication of this article: This study was supported by the The National Science and Technology Support Program Project (2014BAL06B04) and Ph.D. Research Development Fund (25SKY013).
Declaration of conflicting interests
The authors declared no potential conflicts of interest with respect to the research, authorship, and/or publication of this article.
Data Availability Statement
The data presented in this study are available on request from the corresponding author.
Supplemental material
Supplemental material for this article is available online.
References
Supplementary Material
Please find the following supplemental material available below.
For Open Access articles published under a Creative Commons License, all supplemental material carries the same license as the article it is associated with.
For non-Open Access articles published, all supplemental material carries a non-exclusive license, and permission requests for re-use of supplemental material or any part of supplemental material shall be sent directly to the copyright owner as specified in the copyright notice associated with the article.