






Abstract
Objective
To evaluate the accuracy of ultrasound-based fetal weight estimation and to develop and internally validate a prediction model for low birth weight.
Methods
A retrospective cohort study was conducted among 269 individuals.
Results
The accuracy of ultrasound weight estimation was 72.9%, with 27.1% of estimates falling outside ±10% of actual birth weight. The Pearson correlation for estimated fetal weight and actual birth weight was 0.92. Using LASSO regression eight predictors were selected and entered in the multivariable analysis of which gestational age, estimated fetal weight, timing of estimation, and placental location were found significant. The original model demonstrated strong discrimination of AUC of 95.9% 95%CI (93.1-98.0%), and good calibration. Internal validation via 1000-bootstrap resampling yielded a bias-corrected AUC of 94.3%, indicating preserved predictive performance with minimal optimism. An integer-based risk score was derived to enhance clinical usability. The risk score model achieved acceptable discrimination (AUC = 76.8%, 95% CI: 70.0–83.0%) and good calibration (p = 0.301). Agreement between the full prediction model and the simplified risk score was fair (Cohen’s Kappa = 0.353, p < 0.0001), indicating that the simplified score is best suited as a pragmatic bedside risk-stratification tool rather than a direct substitute for the full model. Women were stratified into low (0–10 points), medium (11–21), and high-risk (22–36) groups corresponding to increasing predicted probabilities of low birth weight (3.2%–96.3%).
Conclusion
Ultrasound-based fetal weight estimation using the Hadlock-III formula indicated acceptable accuracy and strong correlation with actual birth weight. We developed and internally validated prediction model for low birth weight with excellent discrimination, good calibration, and predictive value beyond estimated fetal weight alone. A risk-score tool was created to facilitate rapid bedside risk stratification. However, given the single-center nature of the study and the absence of external validation, further multicenter validation is required before broader clinical implementation.
Introduction
Estimating fetal weight is one of the most important components of the follow-up of pregnant women. Accurately estimating fetal weight (EFW) is critically important for assessing fetal growth, deciding the mode of delivery, and counseling parents on perinatal morbidity and mortality, It is also important for management of labor abnormalities 1 and for prevention of intrapartum and postnatal complications. Especially, in high risk pregnancies, estimating fetal weight is very important.2–4
Before the introduction of ultrasound, abdominal palpation and other physical examination oriented fetal weight estimation was being practiced. Currently, estimating fetal weight is a standard of practice and is highly dependent on ultrasound. 5
Studies show that compared to clinical estimation, ultrasound based fetal weight estimation strongly predicts actual birth weight.6–9 Nevertheless, there are reports that show systematic and random errors in ultrasound estimated fetal weight. The accuracy of birth weight estimation varied from institution to institution and from formulas to formulas.10–15
Several regression formulas have been developed different scientific organizations. Standard measurement of head circumference, biparietal diameter, abdominal circumference and femoral length are common measurements used to calculate the fetal weight.1,16,17 Various sonographic formulae have been compared to determine the most accurate method for estimating fetal weight, with Hadlock IV and Vintzileos formulas showing significant associations with accurate birth weight prediction 16 and these formulas are recommended by the international society of ultrasound in obstetrics and gynecology (ISUOG). 18 However, there is no superior model prescribed for every setting and population. 19
In addition to the formula being used,10,16 there are also other different factors that affect the accuracy of ultrasound based estimated birth weight. These factors include; maternal age, 11 maternal BMI,20–22 position, 23 neonatal weight and length, 24 time interval between sonographic weight estimation and delivery,25,26 fetal gender,15,26 presentation,24,26,27 gestational age,28,29 amniotic fluid15,18,30 and the experience of sonographers.15,26
To improve neonatal health in addition to understanding the role of US based birth weight estimation; predicting low birth weight based on easy to assess maternal, pregnancy and neonatal related factors, and identifying the added diagnostic value US based fetal weight is quite essential for early decision making for clinicians. 31 In the Ethiopian context, despite the routine fetal weight estimation before admission, there is no published evidence on how accurate our fetal weight estimation is with respect to actual birth weight; moreover, there are limited studies on prediction of low birth weight for early stratification of pregnancies for risk tailored interventions. Therefore, this study aimed to assess the accuracy of ultrasound birth weight estimation and develop a predictive model for low birth weight among neonates in Tibebe Gion specialized hospital (TGSH).
Method and materials
Study design, area and period
This is a retrospective cohort study conducted at Tibebe Ghion Specialized hospital in Bahir Dar city; we used hospital based patient record data of pregnant individuals followed during antenatal care and delivery. Mothers who gave birth at Tibebe Ghion Specialized Hospital between January–July 2024 were our source population. Following the receipt of our ethical permission, data collection was performed in August 2024.
Bahir Dar is the capital city of Amhara national regional state which is located 565 km from Addis Ababa. The city has two governmental specialized hospitals, one primary hospital, four private hospitals and ten health centers. Tibebe Ghion specialized hospital is a university hospital under college of medicine and health sciences of Bahir Dar university which has a large maternal service area with labor and delivery ward, high risk ward, maternity ward and gynecology ward allocating 70 beds in patient and 12 outpatients’ rooms. Twenty actively working senior consultants, 49 residents, and 20 midwives are currently (at the time of data collection) giving the service.
Population
All mothers who gave birth in Tibebe Ghion specialized hospital during the study period and with inclusion criteria of having ultrasound fetal weight estimation within 7 days before birth were the study population. Mothers with stillbirth and structural anomalies involving the head circumference, biparietal diameter, femoral length and abdominal circumference were excluded from the study.
Study variables
For the diagnostic accuracy analysis, accuracy of ultrasound-based fetal weight estimation was defined as an estimated fetal weight within ±10% of the actual birth weight; estimates outside this range were classified as inaccurate.
LBW was defined according to the WHO classification as birth weight < 2500 g, irrespective of gestational age. Birth weight was abstracted from delivery records within one hour of birth 32
Operational and standard definition
Timing of fetal weight estimation is the time from estimation to the time of delivery.11,20
Accurate weight estimation is considered when the estimated fetal weight is within 10 % of the actual birth weight.15–17,33 Estimated fetal weight is the most recent ultrasound estimation of fetal weight prior to the delivery.
Intrapartum ultrasound was defined as an ultrasound assessment conducted after the onset of regular painful contractions with cervical dilatation ≥4 cm (active phase of labor). When fetal head descent limited visualization of standard BPD or HC planes, sonographers optimized probe angulation and maternal positioning and relied on abdominal parameters (AC and FL) when necessary, in accordance with established obstetric sonography practice12,34,35
Birth weight: is neonatal weight measured immediately after delivery using a weight scale.
Ultrasound model: in our hospital we use a Samsung HS40 model curvilinear transducer.
Ultrasound examinations were performed by both senior resident physicians enrolled in the obstetrics (who are 3 years and more residency training) and gynecology specialty training program or by senior physicians (specialists/consultants). The secondary dataset did not include granular operator-level experience indicators such as years of practice, the number of ultrasound examinations performed, or certification status. However, all staff performing measurements had formal ultrasound training and followed standardized hospital protocols for fetal biometry assessment.
Sample size determination and sampling procedures
The sample size was computed using sample size determination in a population survey in Epi info version 7.2.6.0 software by considering confidence level of 95%, and the proportion of weight estimated within 10% from Uganda using Hadlock was 78.4%. So, the total sample size was 286 including the 10% non-response rate. 18 Based on the previous 6 months before January 1st, there were 2320 women who gave birth in the database, and since sample size calculated is 286, every 8th mother was taken using systematic random sampling procedure.
Data collection tool and procedure
A checklist was used to extract the data from the study participants, medical records (case notes, ultrasound evaluation, delivery summaries, operation notes, and discharge summaries) and last ultrasound evaluation. Location of the placenta, sex, side of spine, presentation and other variables were taken from the ultrasound evaluation form. The actual birth weight was taken from the delivery summaries measured using birth weight scale. Data was collected using epicollect5 software. The supervisor and main investigator examined and checked the checklist for completeness, accuracy, and consistency, and corrective steps were made. To assure the quality of the data training was given to data collectors and supervisors on how to retrieve and extract data from selected medical charts. The supervisor and investigators closely followed the data collection process. The fetal weight estimation by Hadlock III was used. The Hadlock III formula was selected because it was the routine fetal weight estimation method used at Tibebe Ghion Specialized Hospital during the study period and was the formula recorded in the ultrasound reports available in the secondary dataset. Since this study relied on retrospective medical record review, alternative formulas such as Hadlock IV or INTERGROWTH-21st could not be consistently reconstructed from the available data.
In the routine care health care in hospitals in Ethiopia, ultrasound examinations were performed by either resident physicians enrolled in the obstetrics and gynecology specialty training program or by senior physicians (specialists/consultants).
Data management and analysis
After data collection, the data was downloaded into Excel, where it was checked for completeness and coded. The dataset was then exported as a CSV file into R and Statistical Package for the Social Sciences (SPSS) version 27 for analysis. To explain the study population in relation to relevant variables, descriptive statistics such as frequencies and percentages were calculated.
The accuracy analysis was performed using contingency tables to compare ultrasound-estimated birth weights (EFW) with actual birth weights (BW) for inaccurate vs. accurate. The frequency distribution of differences between EFW and BW within 10% of the discrepancies was computed.
A Correlation and Agreement Analysis was also conducted using the mean percentage error (MPE) which is ((EFW-BW)/BW) *100, and mean absolute percentage error (MAPE) which is (│EFW-BW│/BW) *100. MPE was considered as marker for the systematic error, and the corresponding standard deviation and MAPE as marker for the random error, respectively. The 95% confidence intervals (CI) for MPE were used to identify significant differences from zero. The Pearson correlation coefficients were calculated between ultrasound-estimated and actual birth weights to evaluate correlation between the two. In addition, the Bland-Altman Plot was generated to assess agreement between ultrasound estimates and actual birth weights in terms of bias, lines of agreement, systematic trend and outliers.
We applied Least Absolute Shrinkage and Selection Operator (LASSO) regression to identify relevant predictors and reduce model overfitting. A total of approximately 18 candidate predictors were initially entered in LASSO model development with 76 low birth weight events available for analysis. Although this is below commonly recommended thresholds for stable prediction model development, LASSO penalization was applied to reduce dimensionality and minimize overfitting by shrinking less informative coefficients toward zero. Predictors with non-zero coefficients were retained for multivariable logistic regression. Variable retention was guided primarily by predictive contribution identified through LASSO penalization and overall model performance rather than solely by statistical significance in the multivariable regression model.36,37 Predictors considered clinically relevant were retained to preserve the interpretability and bedside applicability of the simplified risk score. The regression coefficients with their 95% confidence intervals and p-values were reported for the models.
LASSO predictor selection and penalty tuning were performed once on the full development dataset prior to bootstrap internal validation. The selected predictors were subsequently entered into the multivariable logistic regression model, and bootstrap resampling (1000 repetitions with replacement) was applied to estimate optimism-corrected model performance. Therefore, the bootstrap validation assessed the finalized model and did not repeat the complete variable selection process within each bootstrap replicate. Bootstrap resampling was selected for internal validation because it is considered one of the most efficient approaches for estimating optimism and evaluating prediction model stability in logistic regression models.38,39
Model performance was evaluated using the area under the receiver operating characteristic curve (AUC) for discrimination, calibration plots, calibration slope, calibration-in-the-large, Brier score, and decision curve analysis (DCA). The bootstrap procedure and corresponding estimates were re-computed and verified after correcting an earlier reporting inconsistency identified during manuscript revision. Comparisons between the apparent model and the internally validated bootstrap model were performed using different performance metrics including AUC, Dxy, calibration slope, calibration-in-the-large, and Brier score to assess optimism and loss of predictive accuracy.
Decision curve analysis (DCA) was used to evaluate the potential clinical and public health utility of the model by estimating standardized net benefit across a range of threshold probabilities (0–1).
We developed an easy to use risk score based on the regression coefficients obtained from the multivariable regression modeling. The coefficients were divided into a scaling factor of 0.2 and rounded to the nearest integer. We determined the total score for each individual by assigning the points for each variable present and adding them up. For simple interpretation in a clinical setting, we categorized the total risk score into three based on the risk distribution in the population and practical sensibility. In addition, we developed a graph showing risk distribution based on the risk level of the population given their predicted risk and an easy to use table containing predictors along with their risk score.
This study was conducted and reported in accordance with the TRIPOD (Transparent Reporting of a Multivariable Prediction Model for Individual Prognosis or Diagnosis) and The STROBE (Strengthening the Reporting of Observational Studies in Epidemiology) statement.40,41 Completed STROBE and TRIPOD checklists are provided as supplementary materials.
Ethical clearance
Ethical clearance was obtained from the institutional review board (IRB) of Bahir Dar University, college of medicine and health science on July 22, 2024, with meeting ID: 004/2024, and protocol number: 1071/2024. The IRB determined that the study was collected in a fully anonymized manner based on secondary data; as a result the need for participant consent was waived by the ethics committee. The Ethical permission was communicated to Tibebe Ghion Specialized hospital before the commencement of the data collection. All patient data were fully de-identified prior to analysis. No personally identifiable information was accessed or included in the dataset to ensure confidentiality and privacy. The study was conducted in accordance with the ethical principles of the Helsinki Declaration of 1975, as revised in 2024.
Results
Demographic, obstetric, medical and weight estimation related factors
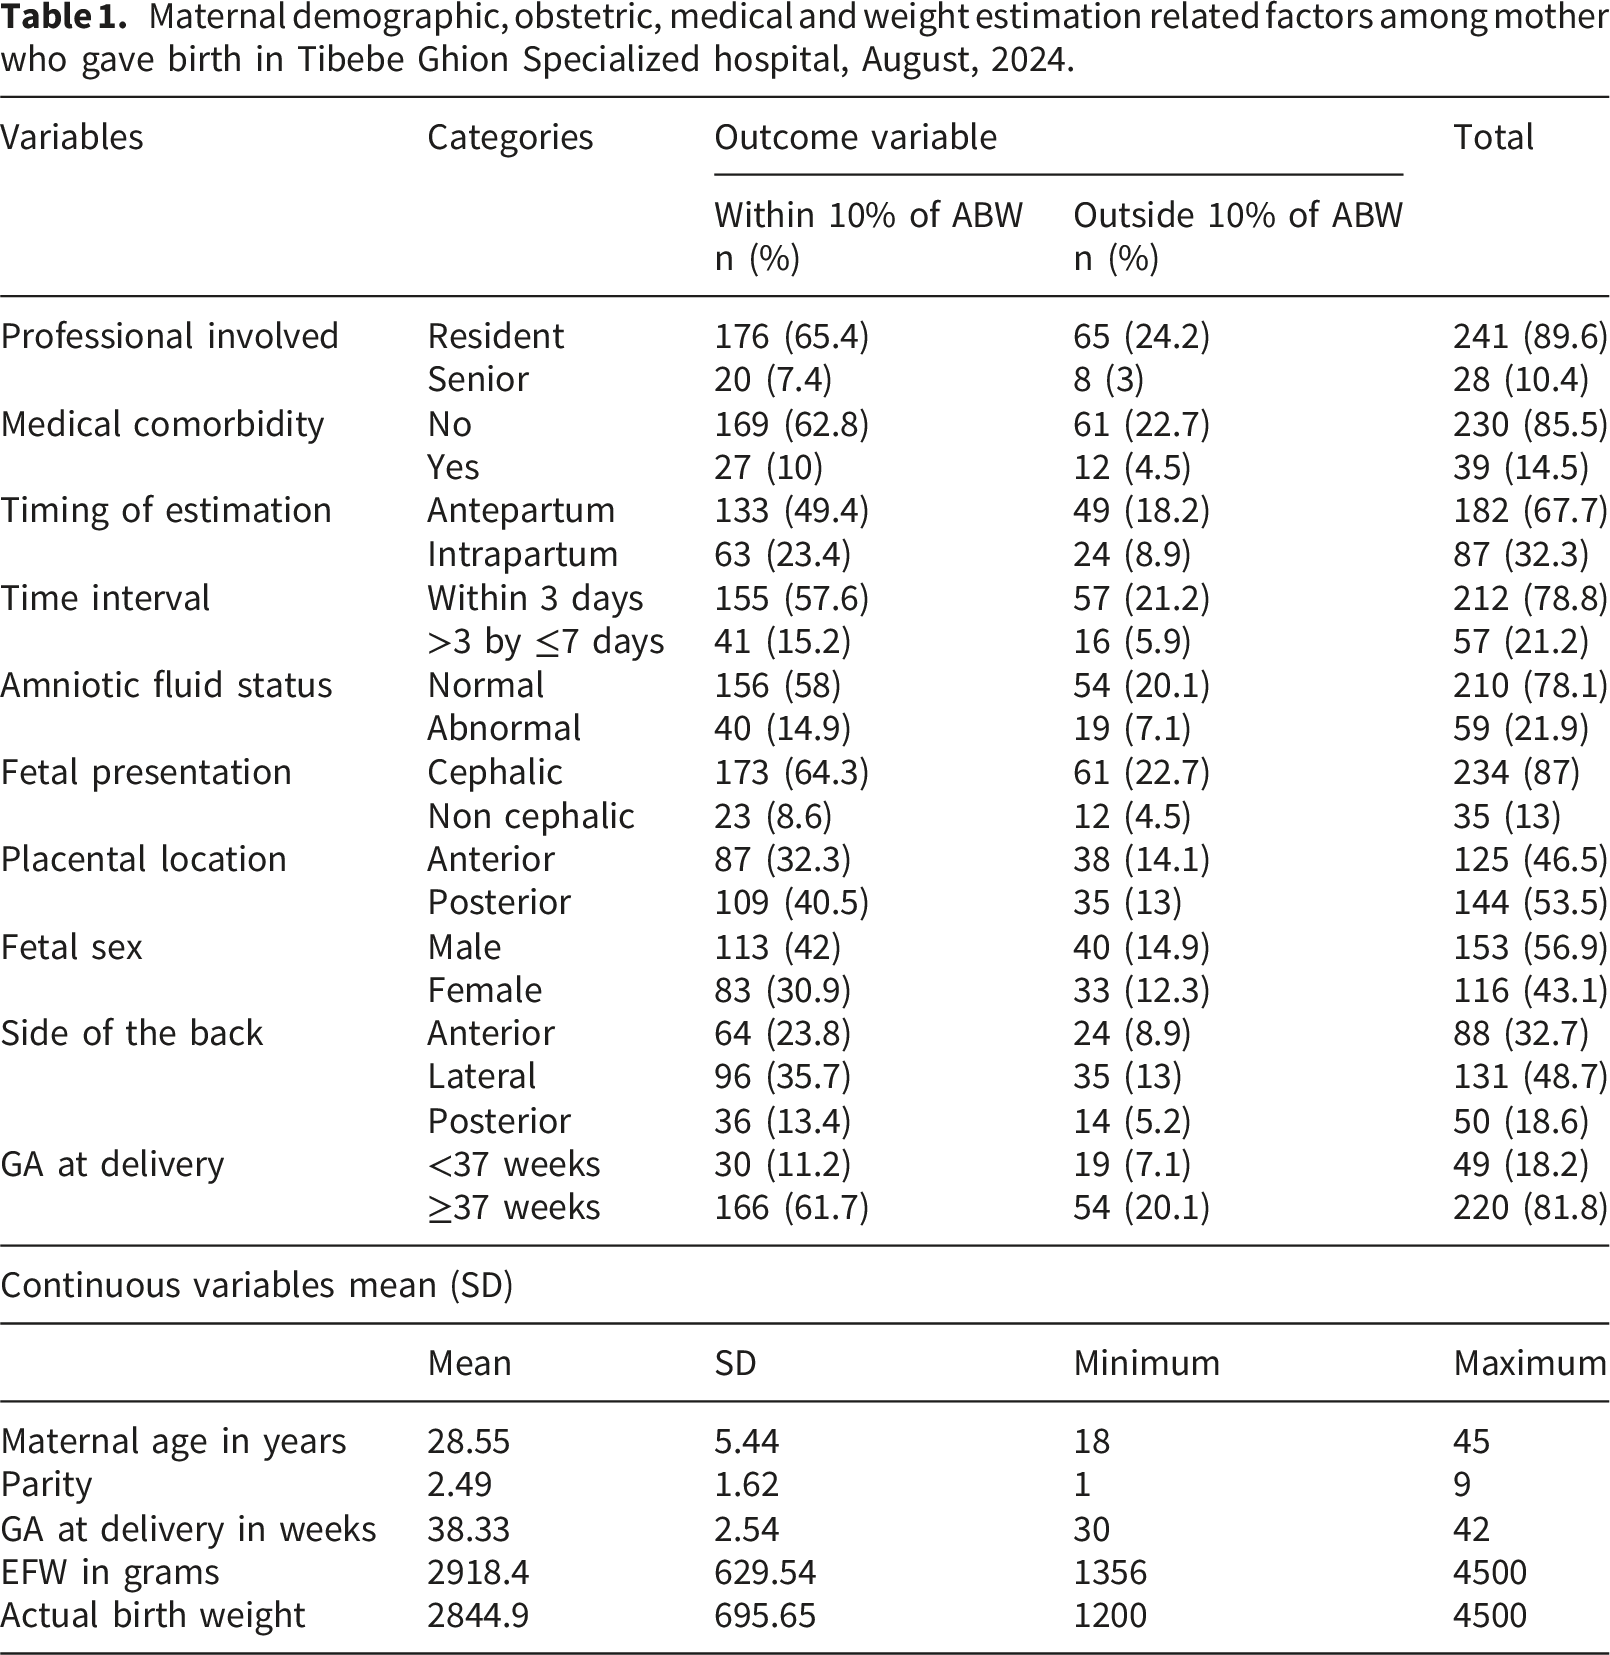
A total of 2320 women gave birth were identified in the database, 43 were excluded because of missing important information including estimated birth weight estimation, therefore, 269 were included in our final analysis (Figure 1). The mean maternal age of the study population was 28.55±5.45 years. The mean gestational age at delivery was 38.3±2.54 weeks. Flowchart of the study participants.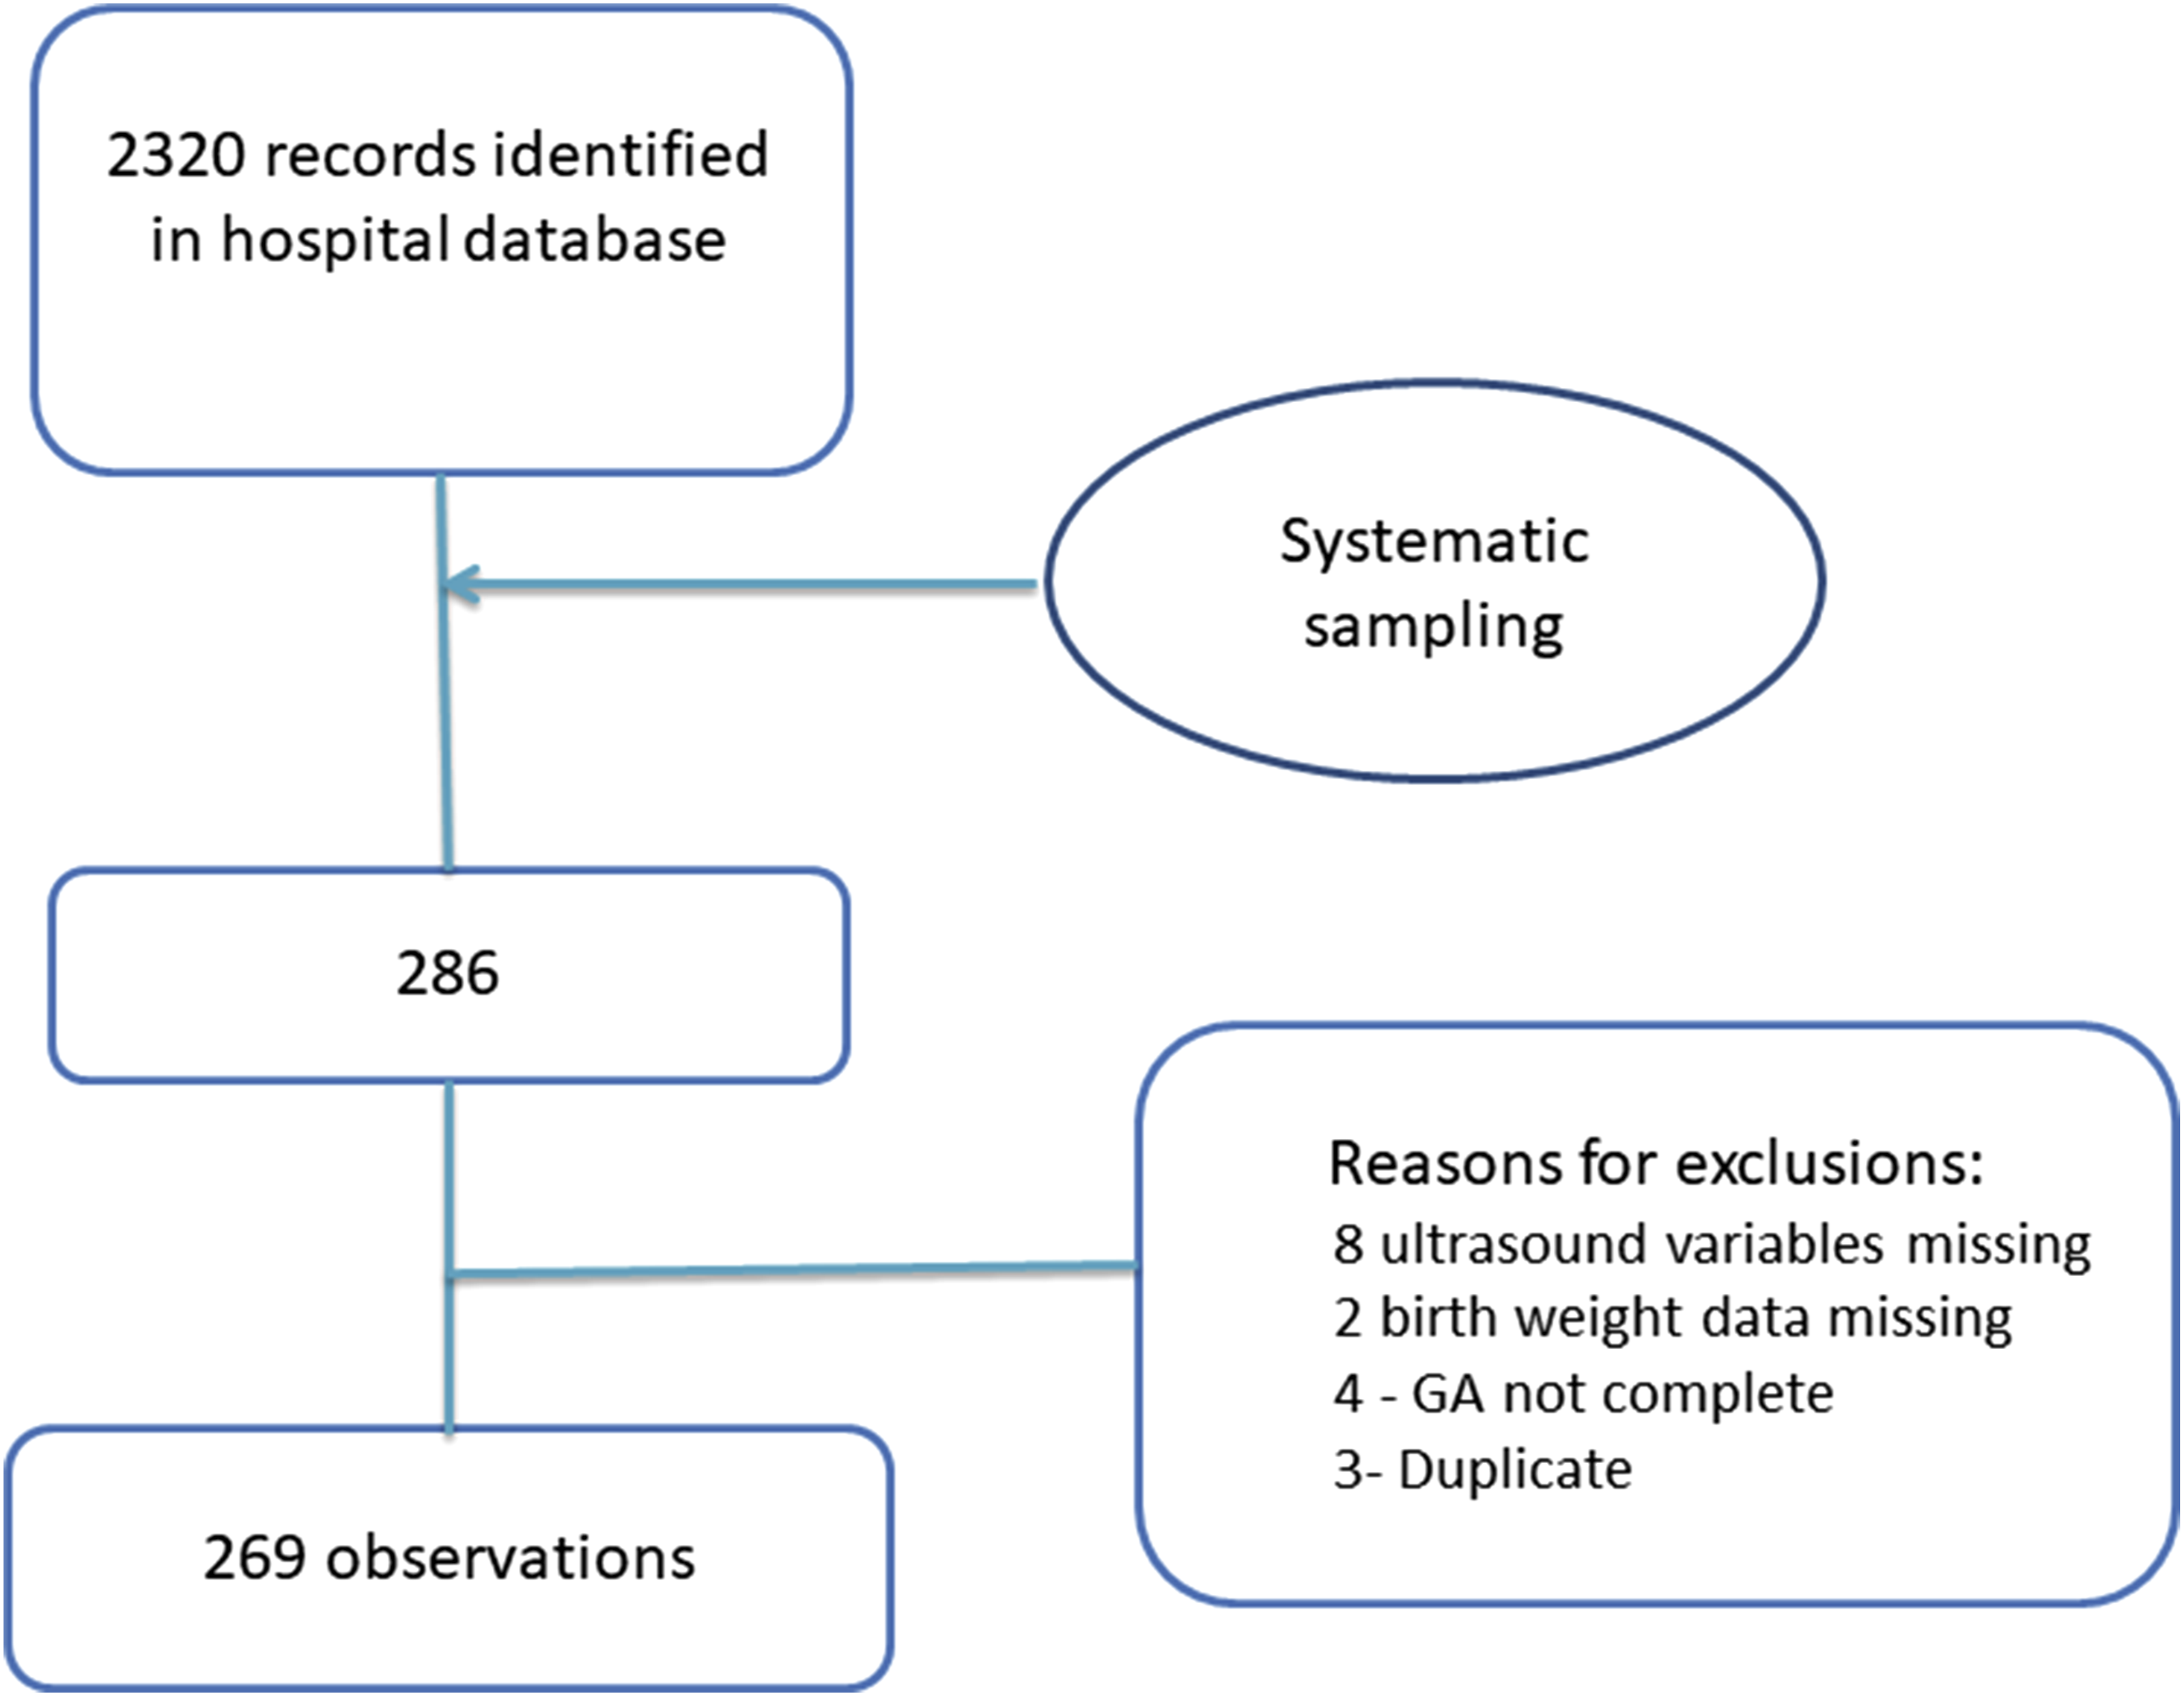
About 89% of the fetal weight estimations were done by the residents, 67.7% of the estimations were done in the antepartum period before the onset of labor and 78.8% of the estimations were within 3 days prior to the delivery. While the mean of estimated fetal weight was 2918.4±629.54gm, the mean of actual birth weight was 2844.9±695.65 gm.
Majority (78.1%) of the individuals had a normal amniotic fluid status at time of fetal weight estimation and 13% of them had non cephalic presentation including breech and transverse lie. The back of fetus at time of ultrasound was lateral in 48.7% of the cases and 8.9% of them had the back anterior. In 53.5% of the mothers the placenta was posterior during ultrasound evaluation. Male sex was 56.9% newborns and 82% of the deliveries were at term.
Maternal demographic, obstetric, medical and weight estimation related factors among mother who gave birth in Tibebe Ghion Specialized hospital, August, 2024.
Accuracy of fetal weight estimation
The accuracy of ultrasound fetal weight estimation using Hadlock III formula was found to be 169 (72.9%) and 73 (27.1%) of ultrasound estimations were outside the margin of ± 10% of the actual birth weight.
Measurements of accuracy metrics and correlation of fetal weight estimation and actual birth weight.
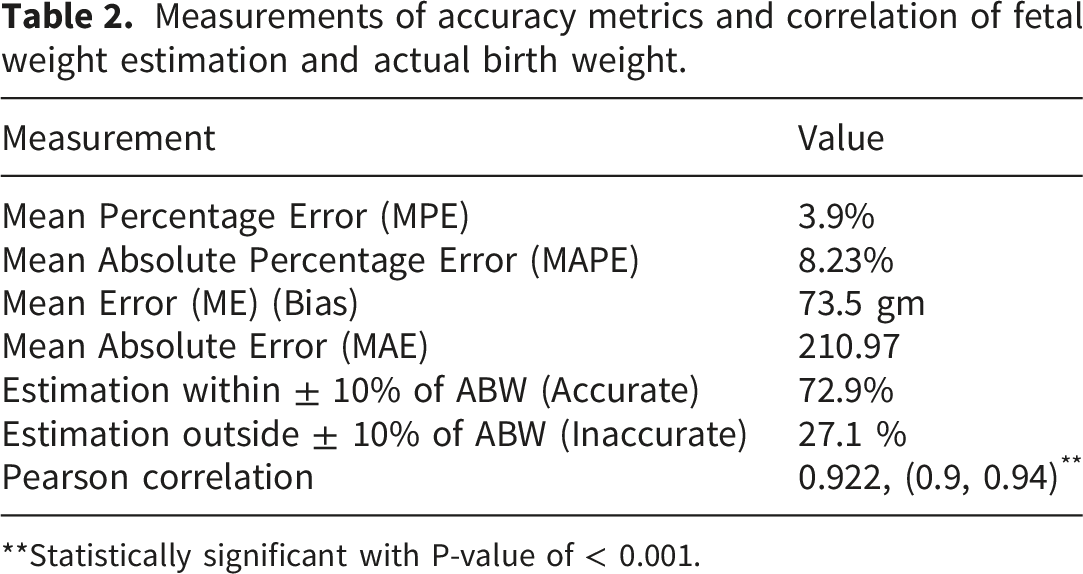
**Statistically significant with P-value of < 0.001.
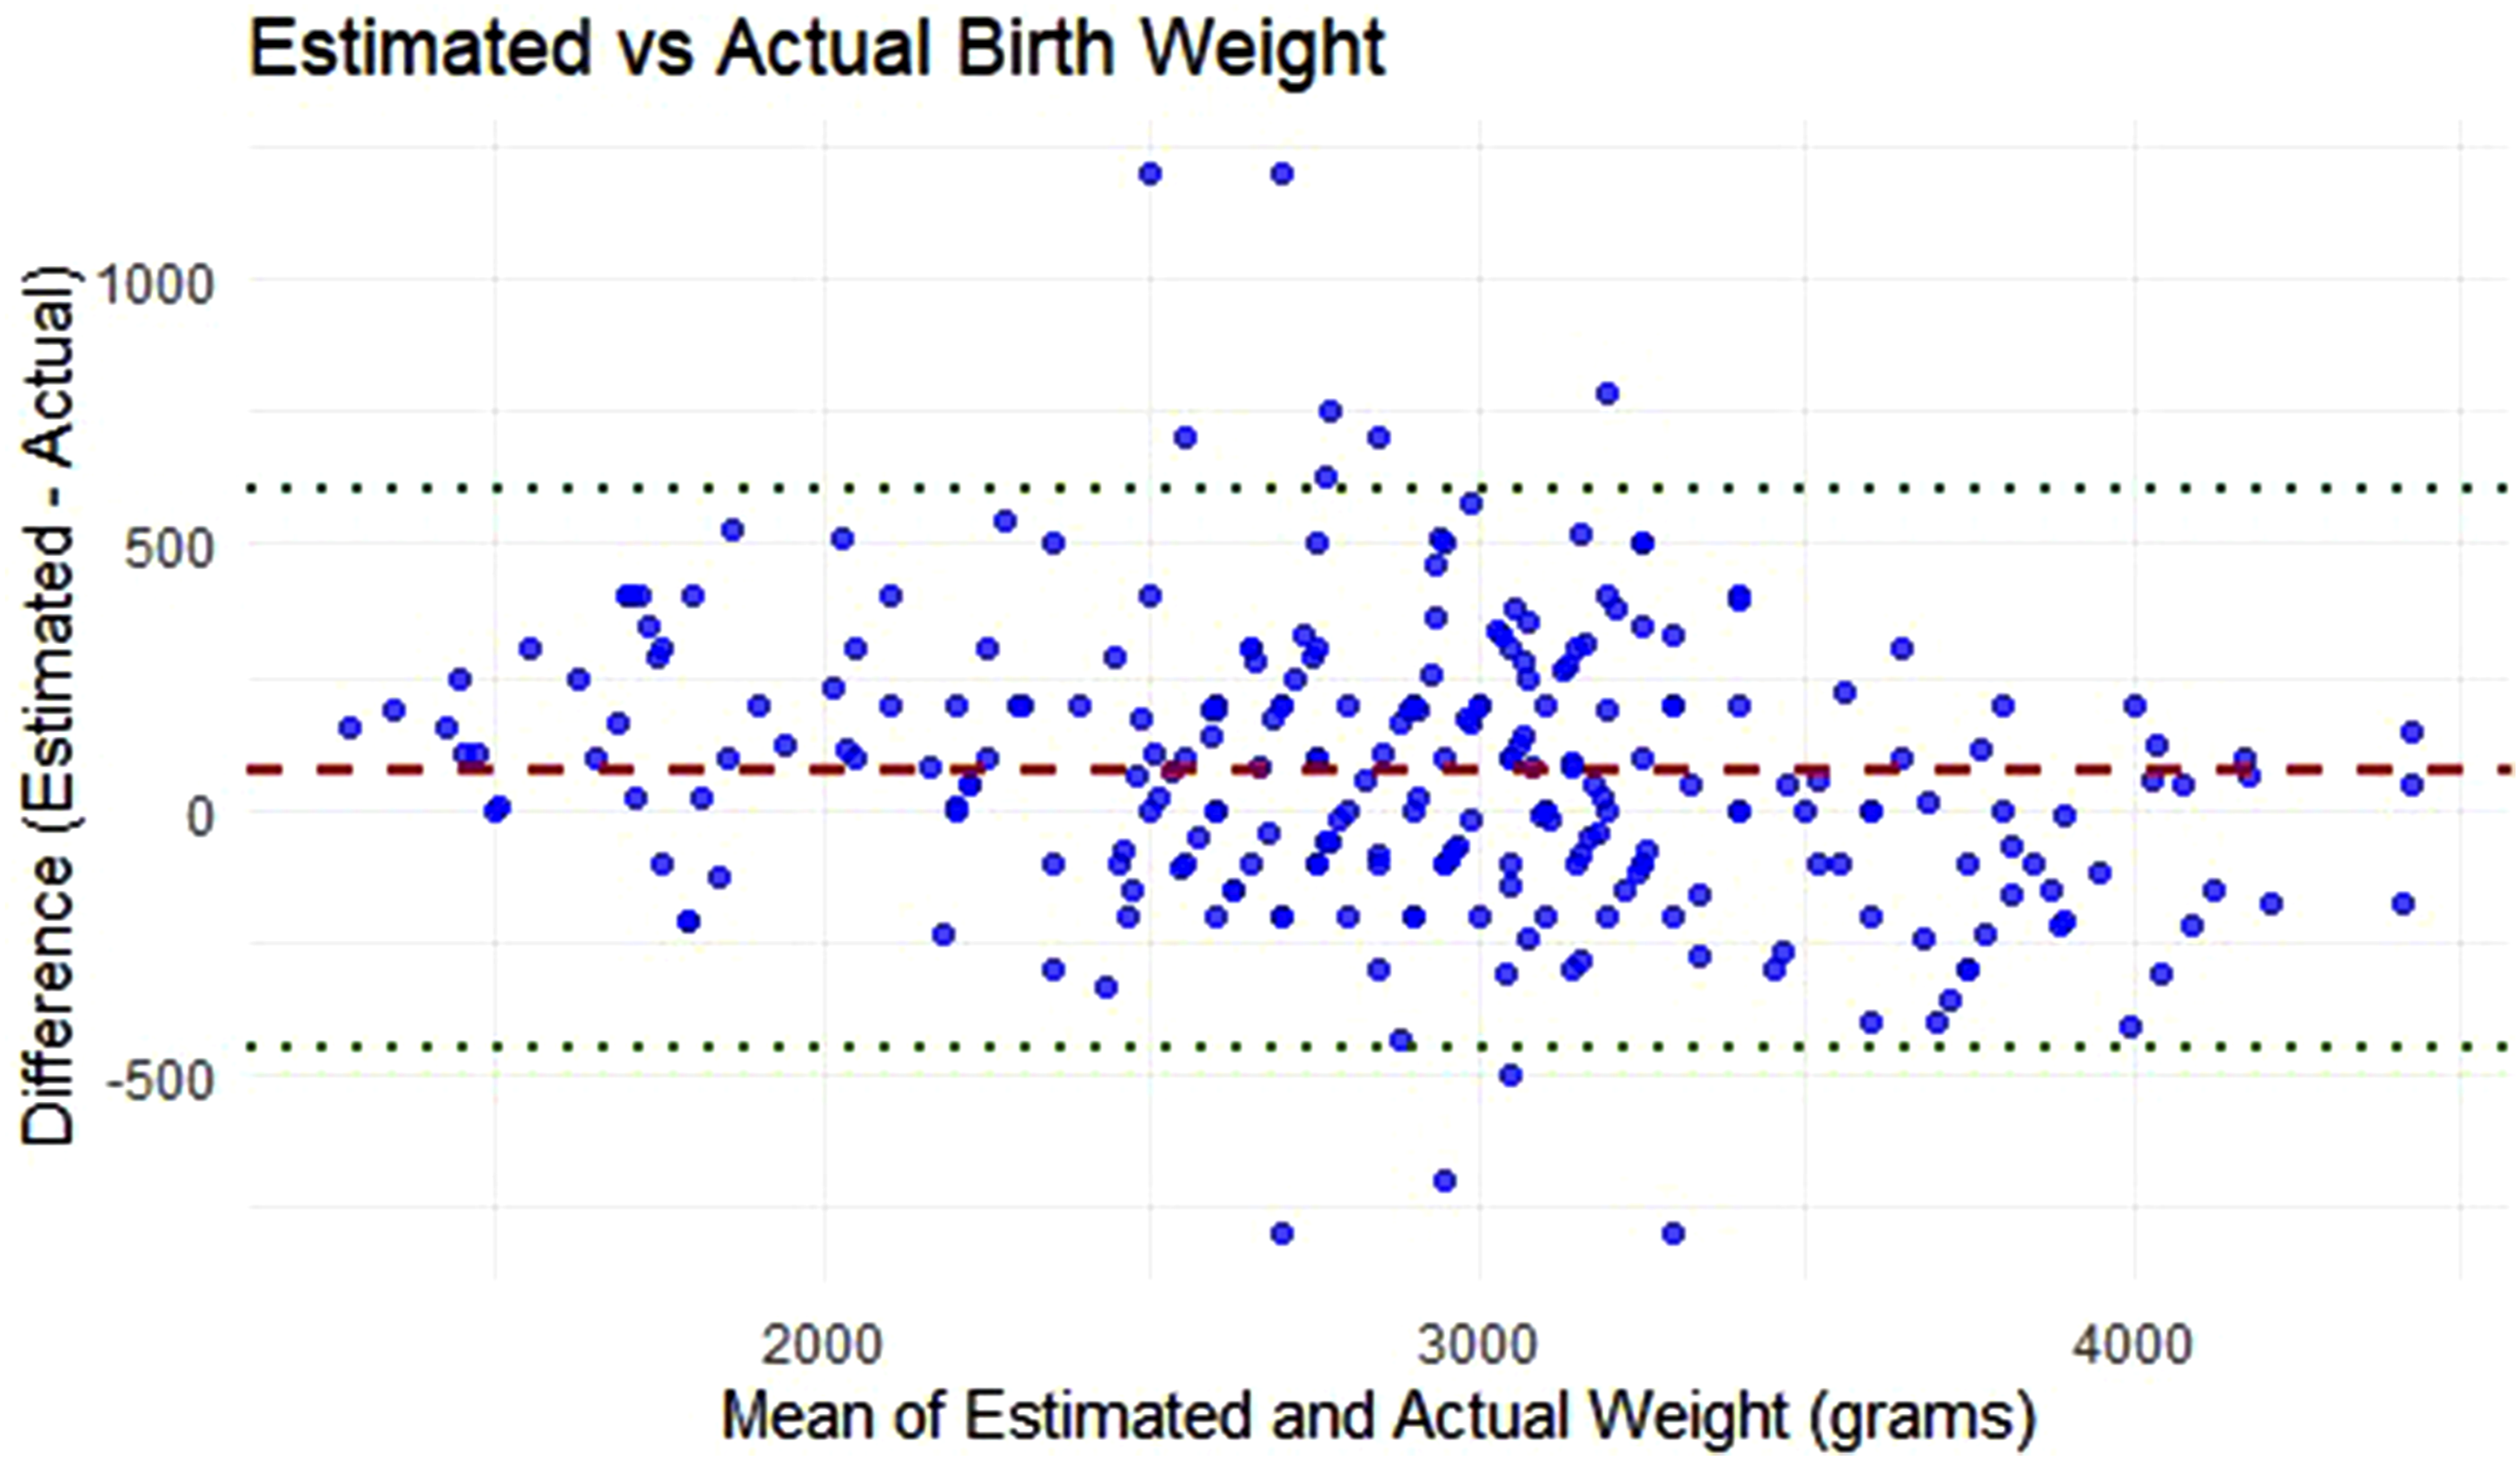
Bland Altman plot for the average differences and means of estimated fetal weight and actual birth weight.
Variable selection using LASSO regression for predictive modeling
Before performing multivariable logistic regression, we applied Least Absolute Shrinkage and Selection Operator (LASSO) regression to identify the most relevant predictors and reduce model over fitting. A total of 18 candidate predictors were included in the LASSO regression analysis. Among these, 8 predictors had non-zero coefficients and were retained for inclusion in the multivariable logistic regression model. The variables selected by LASSO regression for the final logistic regression model were: maternal age, gestational age at delivery, estimated fetal weight, time interval, time of estimation, placenta location, professional level, and education level. The optimal lambda value (λ) that minimized the cross-validated error and was used to select these predictors was 0.0111, at standard error of 0.0404.
Multivariable logistic regressions for the prediction of low birth weight.
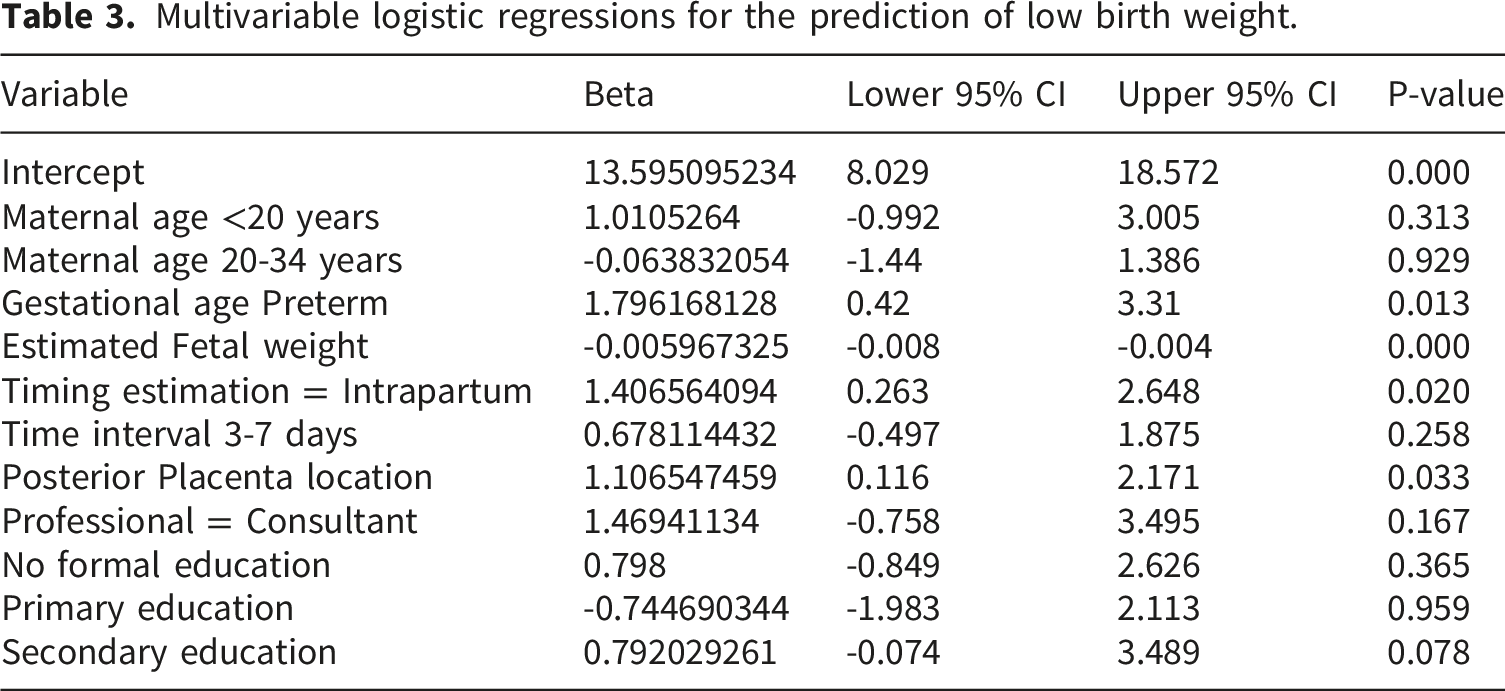
This study used lrm in rms package regression based on datadist () to penalize our original model. The model demonstrated strong discriminative performance, which was further evaluated against alternative approaches (see below). The area under the ROC curve (AUC) was 95.9%, 95%CI: (93.1 - 98.0%) (Figure 3), indicating outstanding discrimination ability between low birth weight and non-low birth weight outcomes. The model’s discrimination index (Dxy) was 0.917, supporting strong concordance between predicted and observed classifications. The model explained a substantial proportion of variability in the outcome, with a Nagelkerke R2 of 0.760. The Brier score was 0.064, suggesting high overall accuracy and good calibration of predicted probabilities. Additionally, the likelihood ratio chi-square test statistic was 202.4, with a p-value < 0.0001, indicating that the model provides a significantly better fit than a null model with no predictors. Receiver operating characteristics curve (ROC) for prediction of low birth weight original model.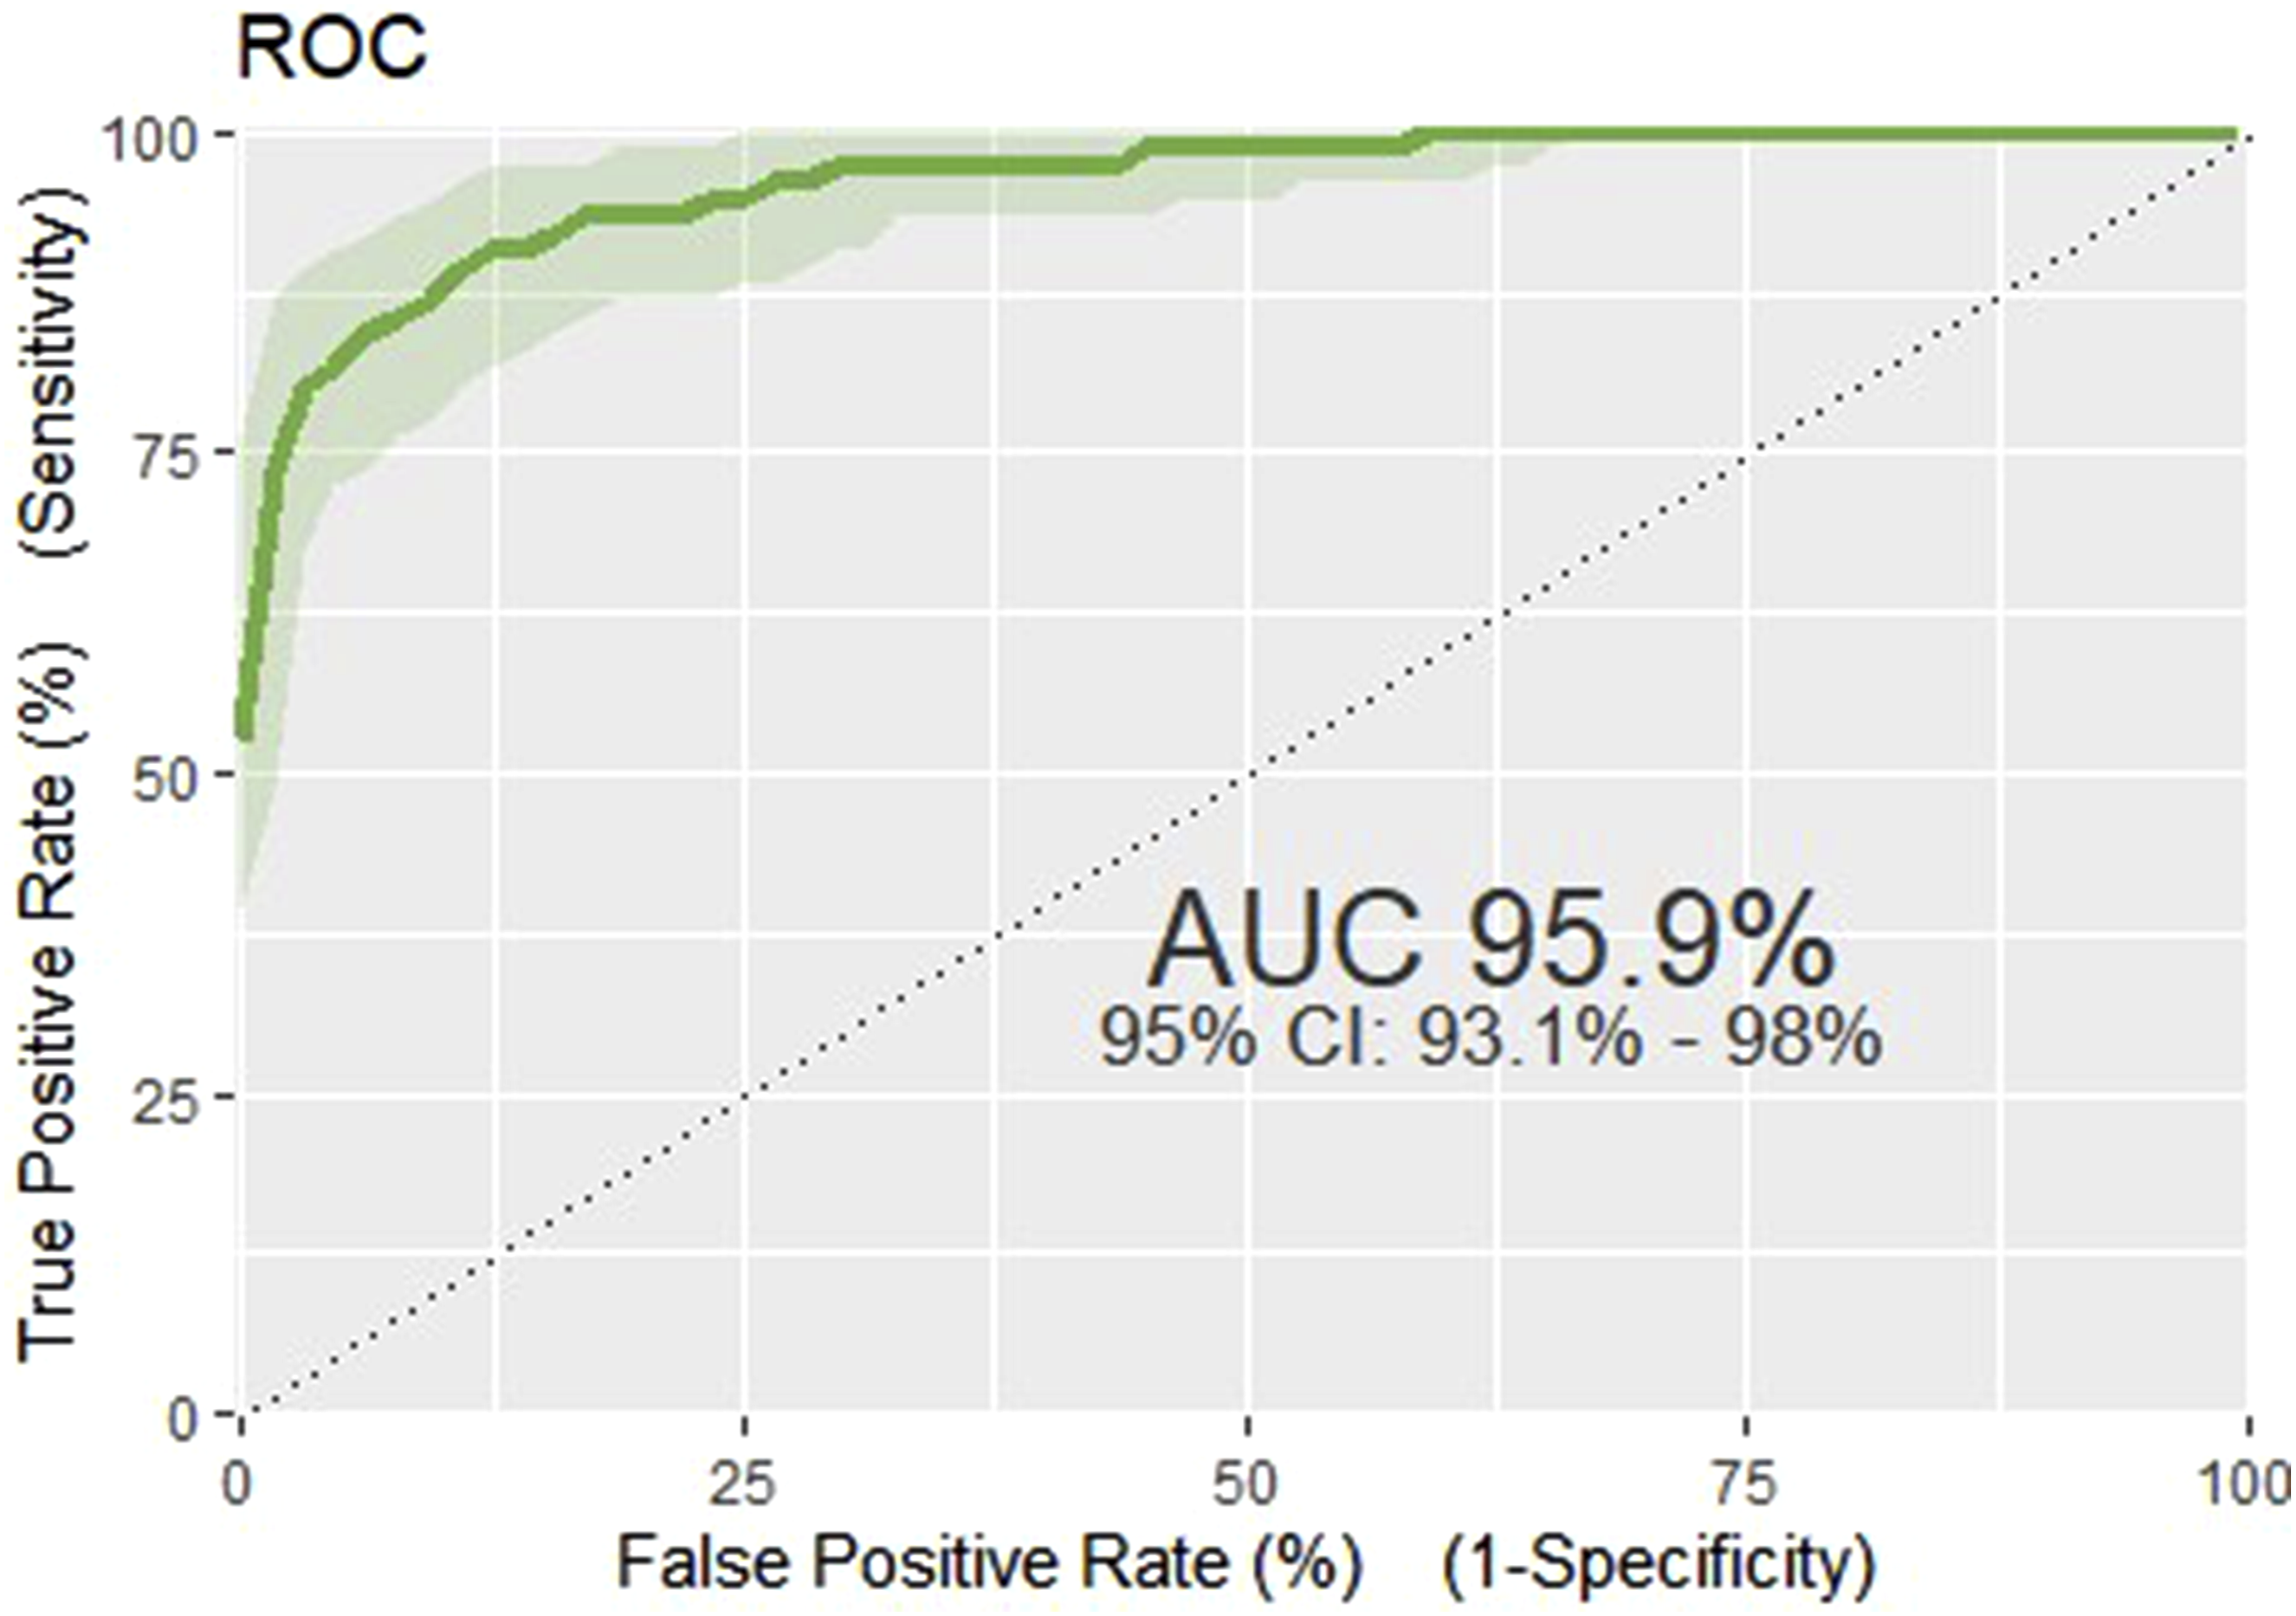
The calibration performance
The calibration of our original predictive model was assessed using the GIVITI calibration belt method in R. The calibration plot demonstrated a close agreement between the predicted probabilities and the observed probabilities. The graph closely follows the 45 degree reference line, indicating that the model is well-calibrated. The 95% confidence belt mostly included the diagonal line of perfect calibration, suggesting no significant evidence of miscalibration across the range of predicted risks. This result supports the reliability of the model in estimating the actual probability of low birth weight outcomes within the study population. In addition p-value on the curve was 0.371, showing there is no difference between predicted and observed probabilities (Figure 4). Calibration plot for the prediction of low birth weight for the original model.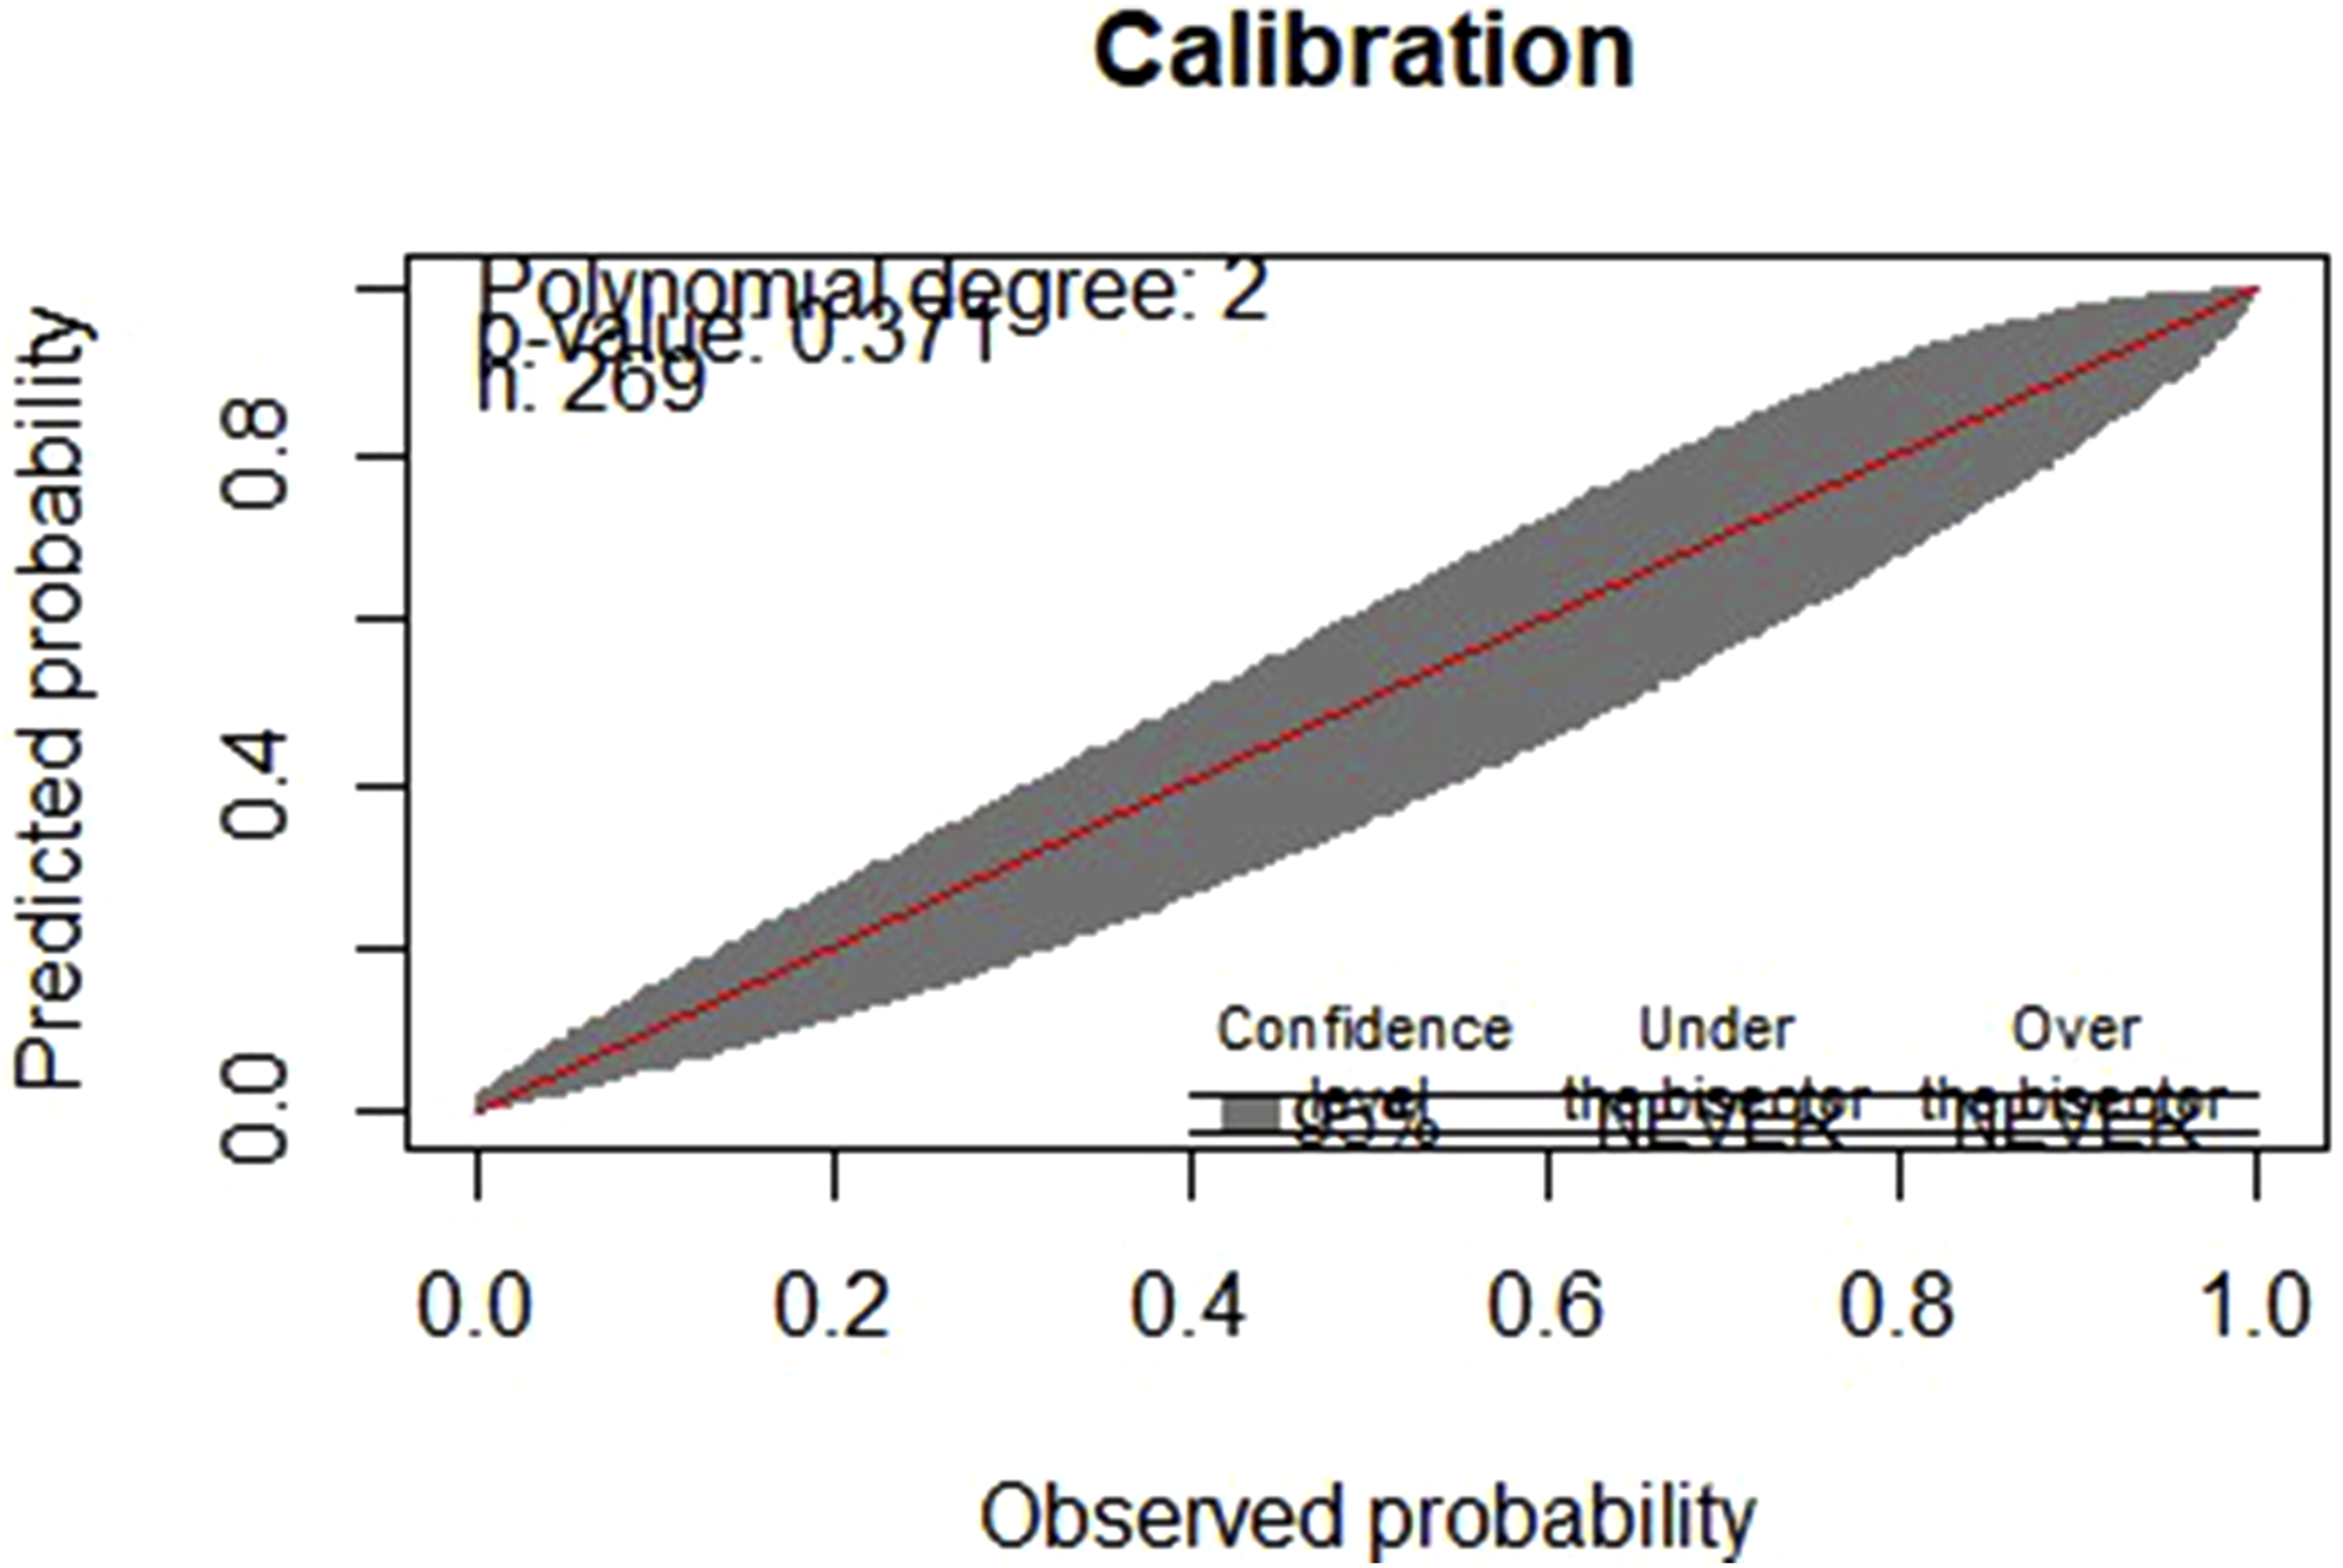
This graph illustrates the model’s effectiveness in distinguishing between pregnancies that developed low birth weight and those normal birth weights. The density plot reveals strong class separation between positive and negative cases. The model assigns high probabilities to positive cases (low birth weight), with the corresponding density curve peaking sharply near 0.00 and tapering off rapidly beyond 0.25. In contrast, negative cases (normal birth weight) show a peak around 0.87, with minimal density below 0.50. The limited overlap between the two curves indicates that the model effectively distinguishes between the two outcomes, suggesting good discriminative performance. These findings support the model’s utility in identifying individuals at risk for low birth weight based on predicted probability thresholds (Figure 5). Density plot for predicting low birth weight.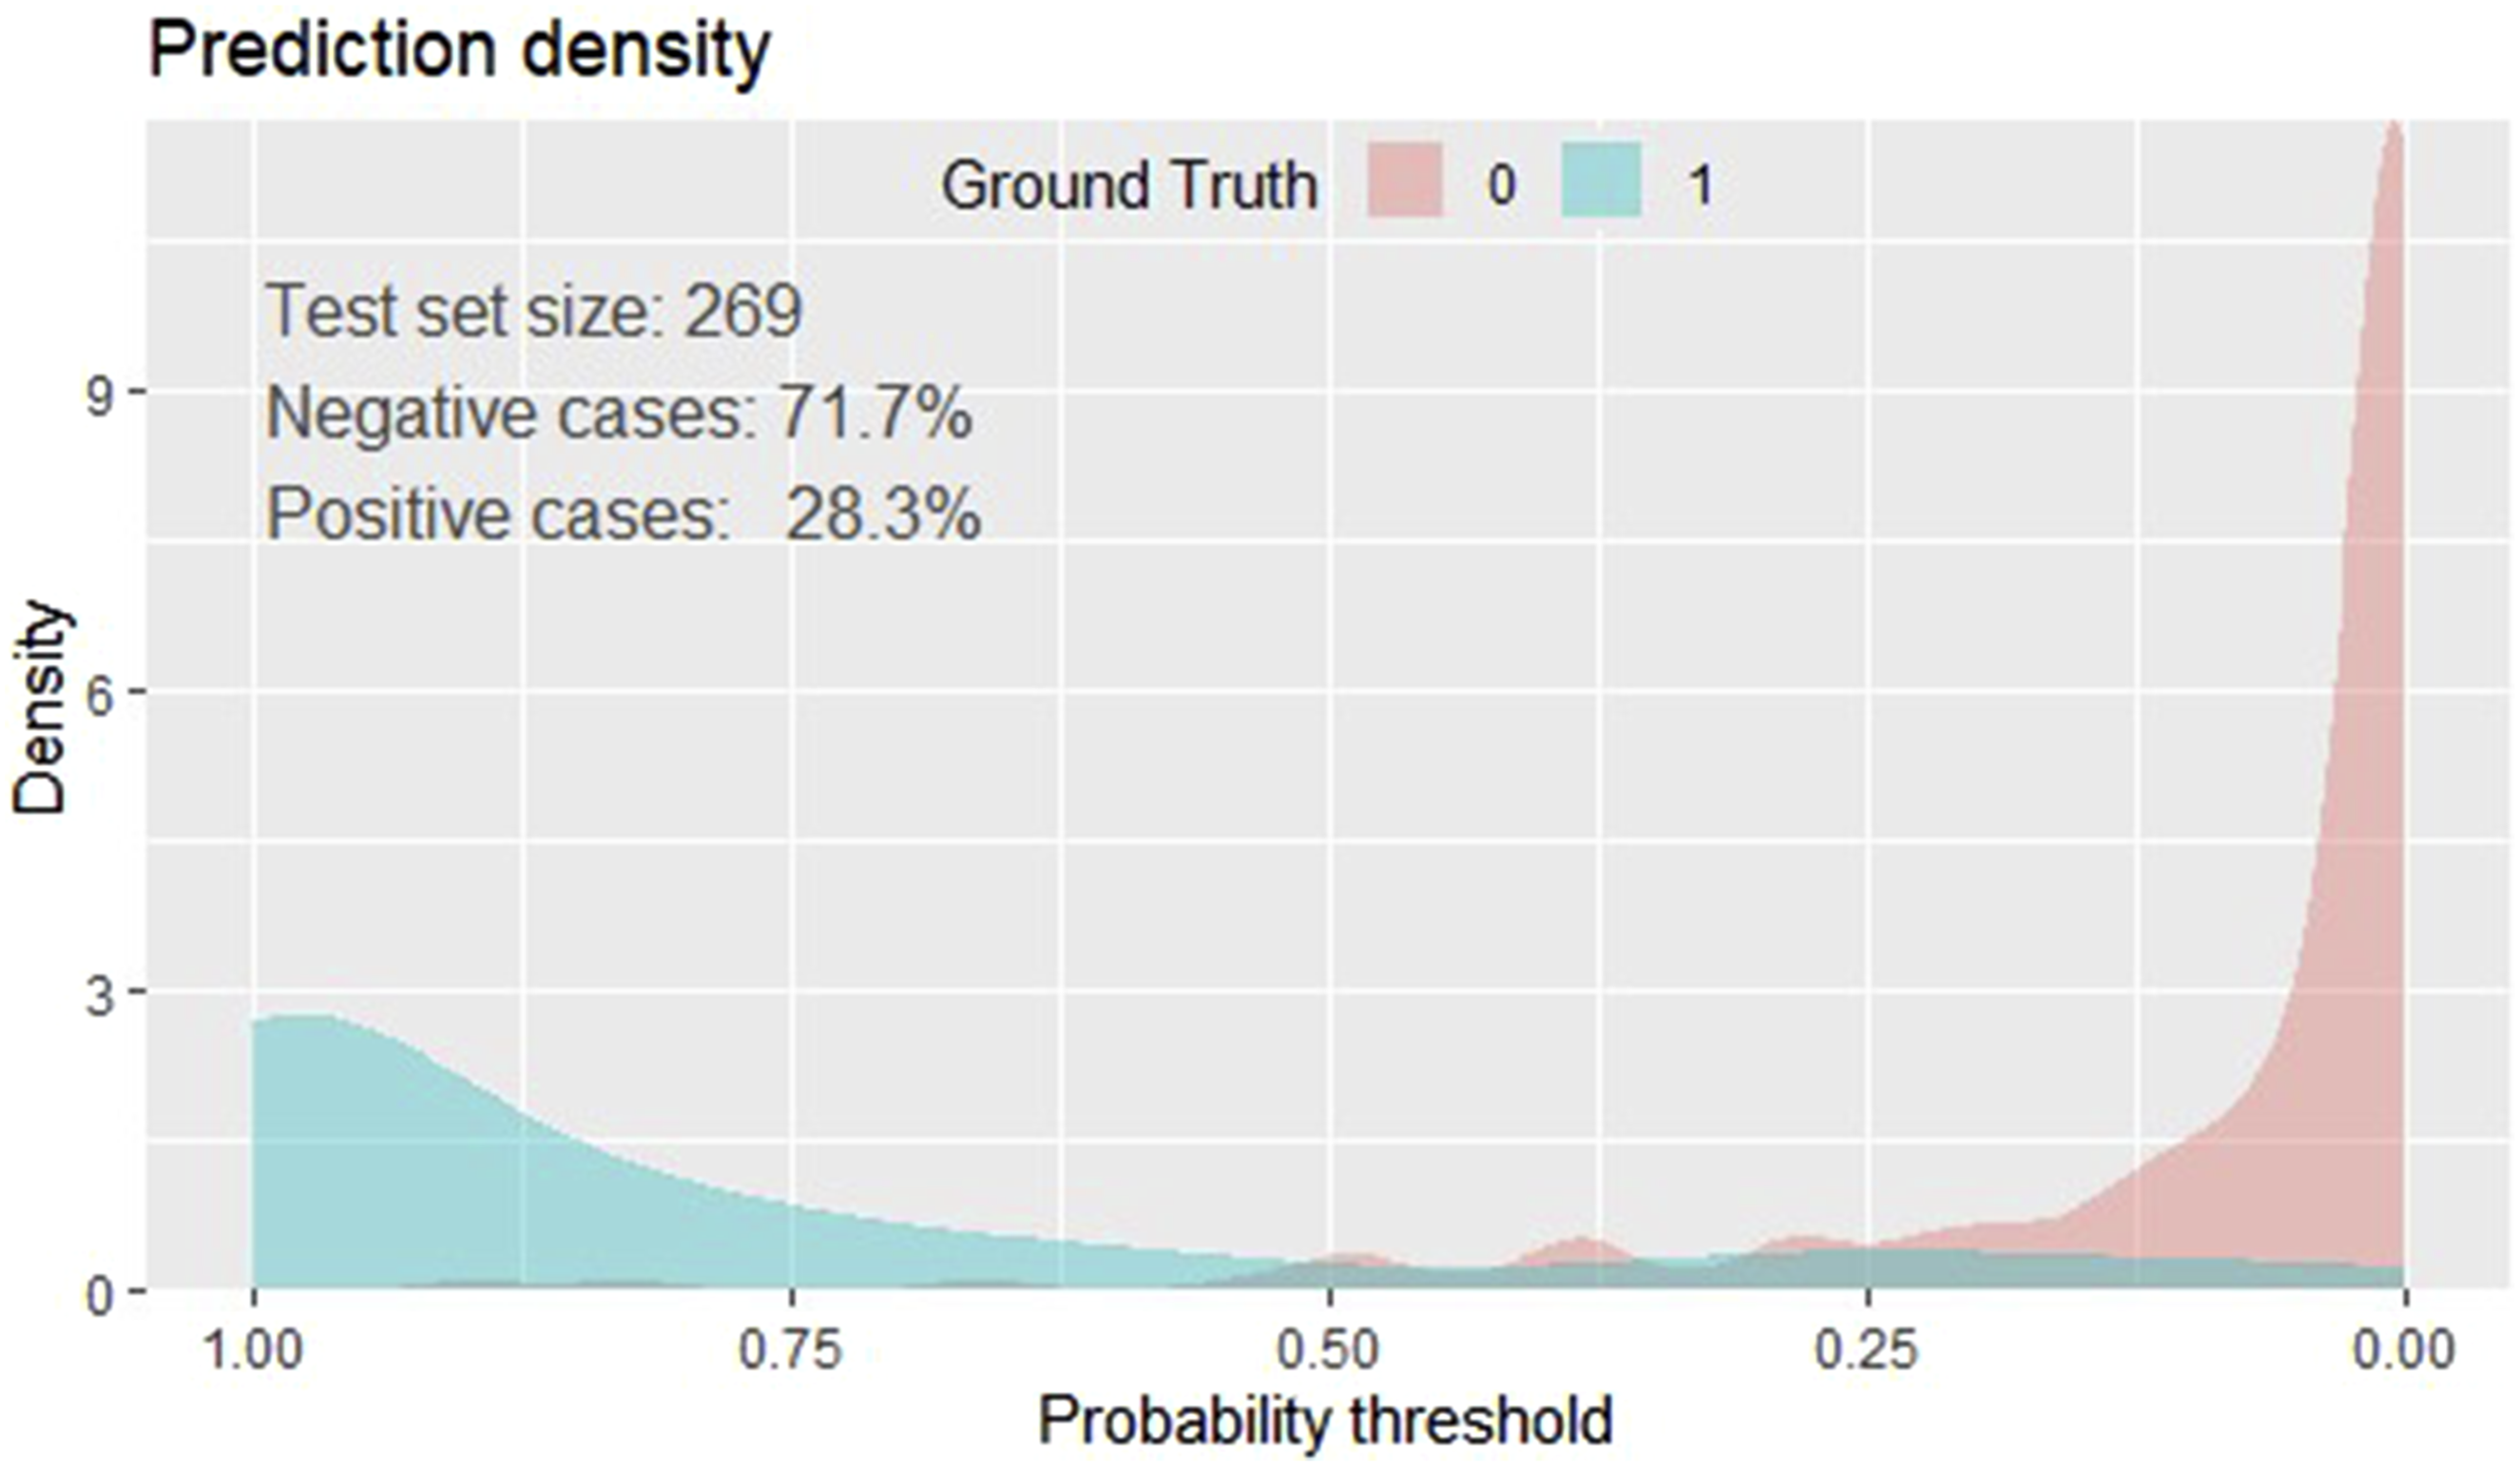
Incremental predictive value beyond estimated fetal weight
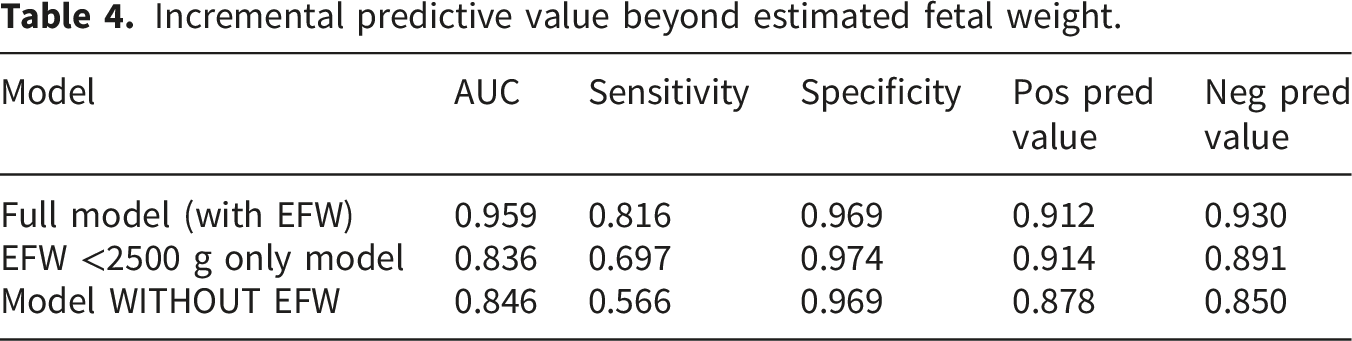
Because estimated fetal weight (EFW) is strongly correlated with actual birth weight, we conducted additional analyses to evaluate whether the multivariable model provides predictive value beyond a simple EFW-based classification.
First, we assessed the performance of EFW alone using a clinically relevant threshold of <2500g. This approach demonstrated good discrimination with an AUC of 83.6%, sensitivity of 69.7%, specificity of 97.4%, positive predictive value (PPV) of 91.4%, and negative predictive value (NPV) of 89.1%.
Second, we evaluated a model excluding EFW, which retained acceptable discrimination (AUC 85%), though with lower sensitivity (56.6%) and similarly high specificity (96.9%).
In comparison, the full multivariable model achieved substantially improved discrimination (AUC = 95.9%) and higher sensitivity (81.6%) while maintaining excellent specificity (96.9%).
Incremental predictive value beyond estimated fetal weight.
Bootstrap based internal validation for the prediction of low birth weight
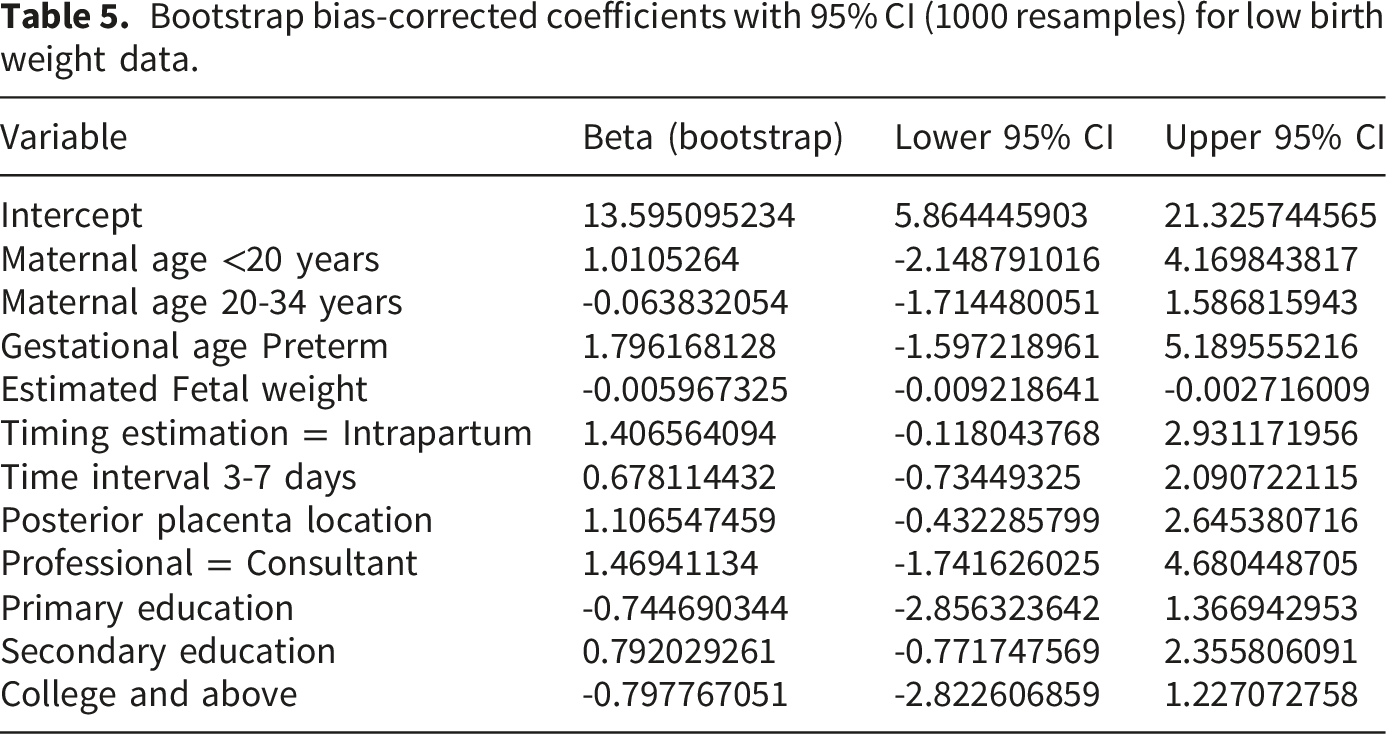
Internal validation was done using bootstrapping method, 1000 iterations were performed to avoid over optimistic results and to make our model applicable and capture the unseen data. The bootstrap resampling analysis result showed that original predictive performance of the model was optimistic and decreased after correction for over fitting. After bootstrap validation, the discrimination ability of the model was reduced. The bias-corrected discrimination index (Dxy) declined from its original value of 0.917 to 0.887, indicating some loss of concordance between predicted and observed outcomes due to over fitting. Correspondingly, the bias-corrected AUC decreased from 95.9% in the original model to approximately 94.3% after internal validation, still reflecting very good discrimination. The explained variance (Nagelkerke R2) was also reduced from 0.760 in the apparent model to 0.703 after bootstrap correction, suggesting that the model explains slightly less variability in the outcome when accounting for optimism. The Brier score also increased from 0.064 (original model) to 0.078 after internal validation, indicating slightly reduced overall accuracy of predicted probabilities but remaining within an acceptable range for clinical prediction models. The optimism-corrected calibration slope after bootstrap validation was 0.84, indicating moderate overfitting and some shrinkage of predictor effects after internal validation. Calibration-in-the-large was −0.11, suggesting minimal systematic overestimation of predicted probabilities. The calibration plot of the validated model (Figure 6) clearly indicates the results after bootstrap are in good range. Taken together, internal validation indicated that the model retained good discrimination and moderate calibration, though the bootstrap optimism-corrected performance metrics reflect meaningful over fitting in the apparent model (Table 5). Bootstrap plot bias corrected calibration curve for low birth weight for the internally validated model. Bootstrap bias-corrected coefficients with 95% CI (1000 resamples) for low birth weight data.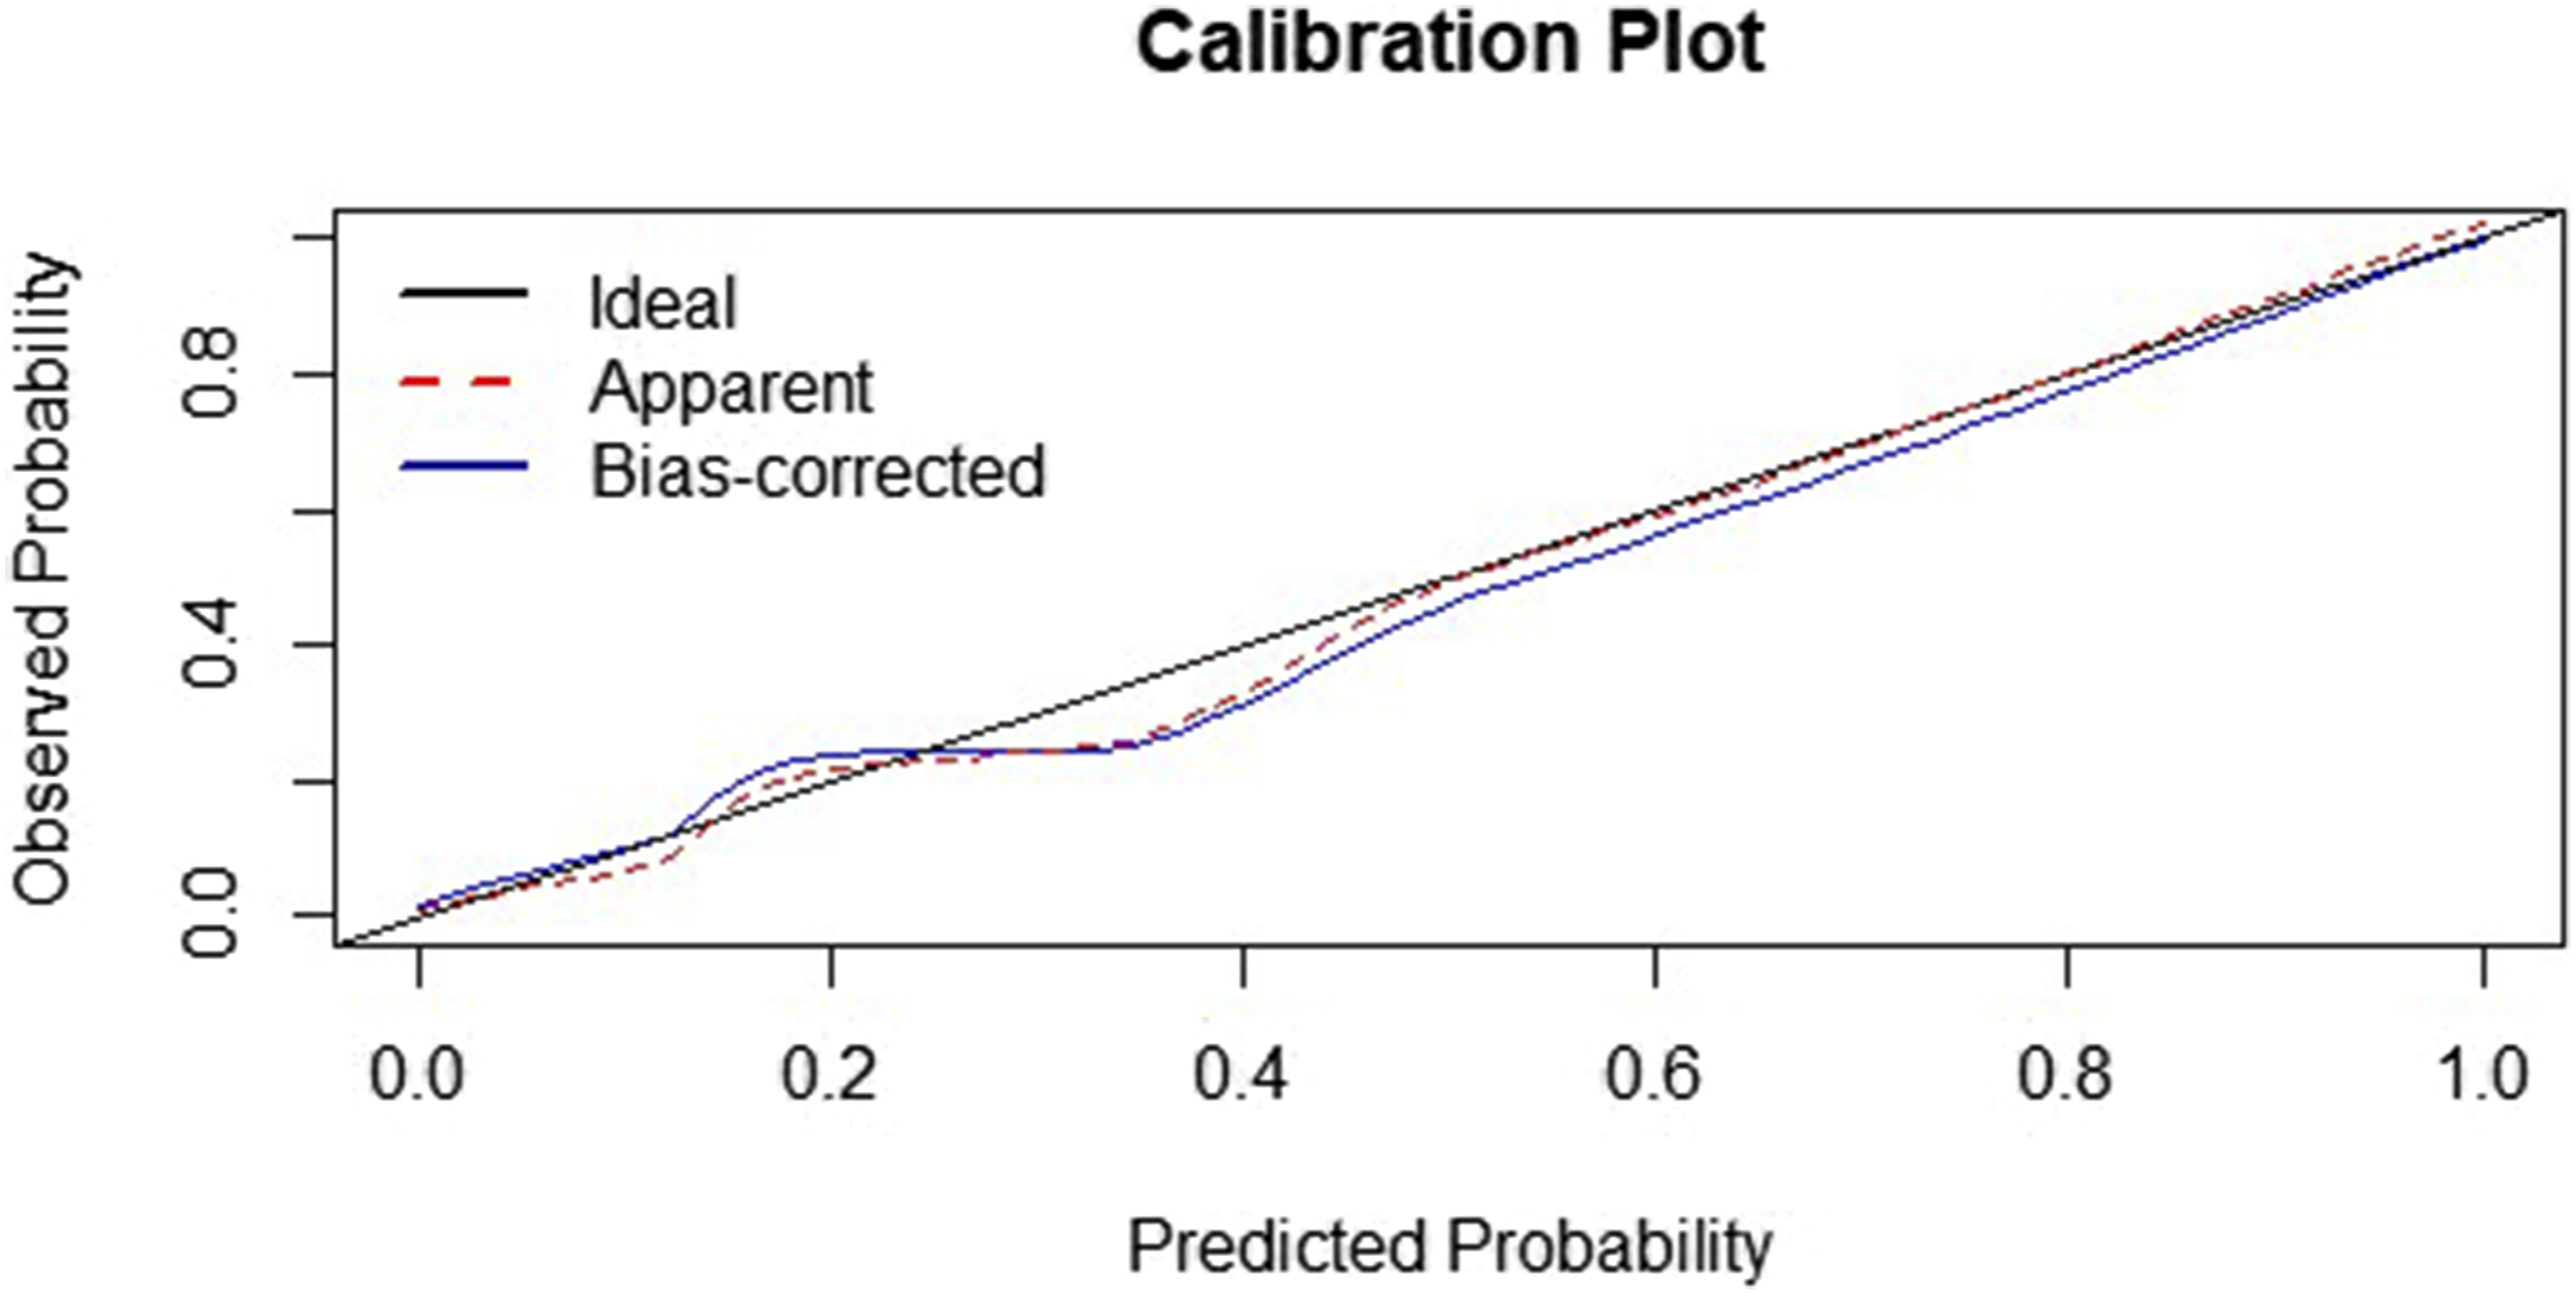
Decision curve analysis (DCA)
The Decision Curve Analysis (DCA) was evaluated for our model to show the clinical utility and net benefit of prediction model for low birth weight (LBW). The finding illustrated that clinically meaningful threshold probabilities ranged from 10% to 30%. The decision curve analysis demonstrated that the full model provided higher net benefits across a wide range of threshold probabilities compared to the “treat all” or “treat none” strategies. The graph illustrates that at threshold of 0.1 probabilities the net benefit for the full model was 0.895, compared to 0.718 for treating all and 0 for treating none. Moreover, at 0.3 probabilities the net benefit of the full model was about 0.78, whereas the net benefit of for treating all and for treating none was 0. This suggests that using the full model for decision-making improves clinical utility by reducing unnecessary interventions while identifying true low birth weight cases (Figure 7). A plot of decision curve analysis illustrating the standard net benefit of the model against threshold probability and corresponding cost-benefit ratio of low birth weight model.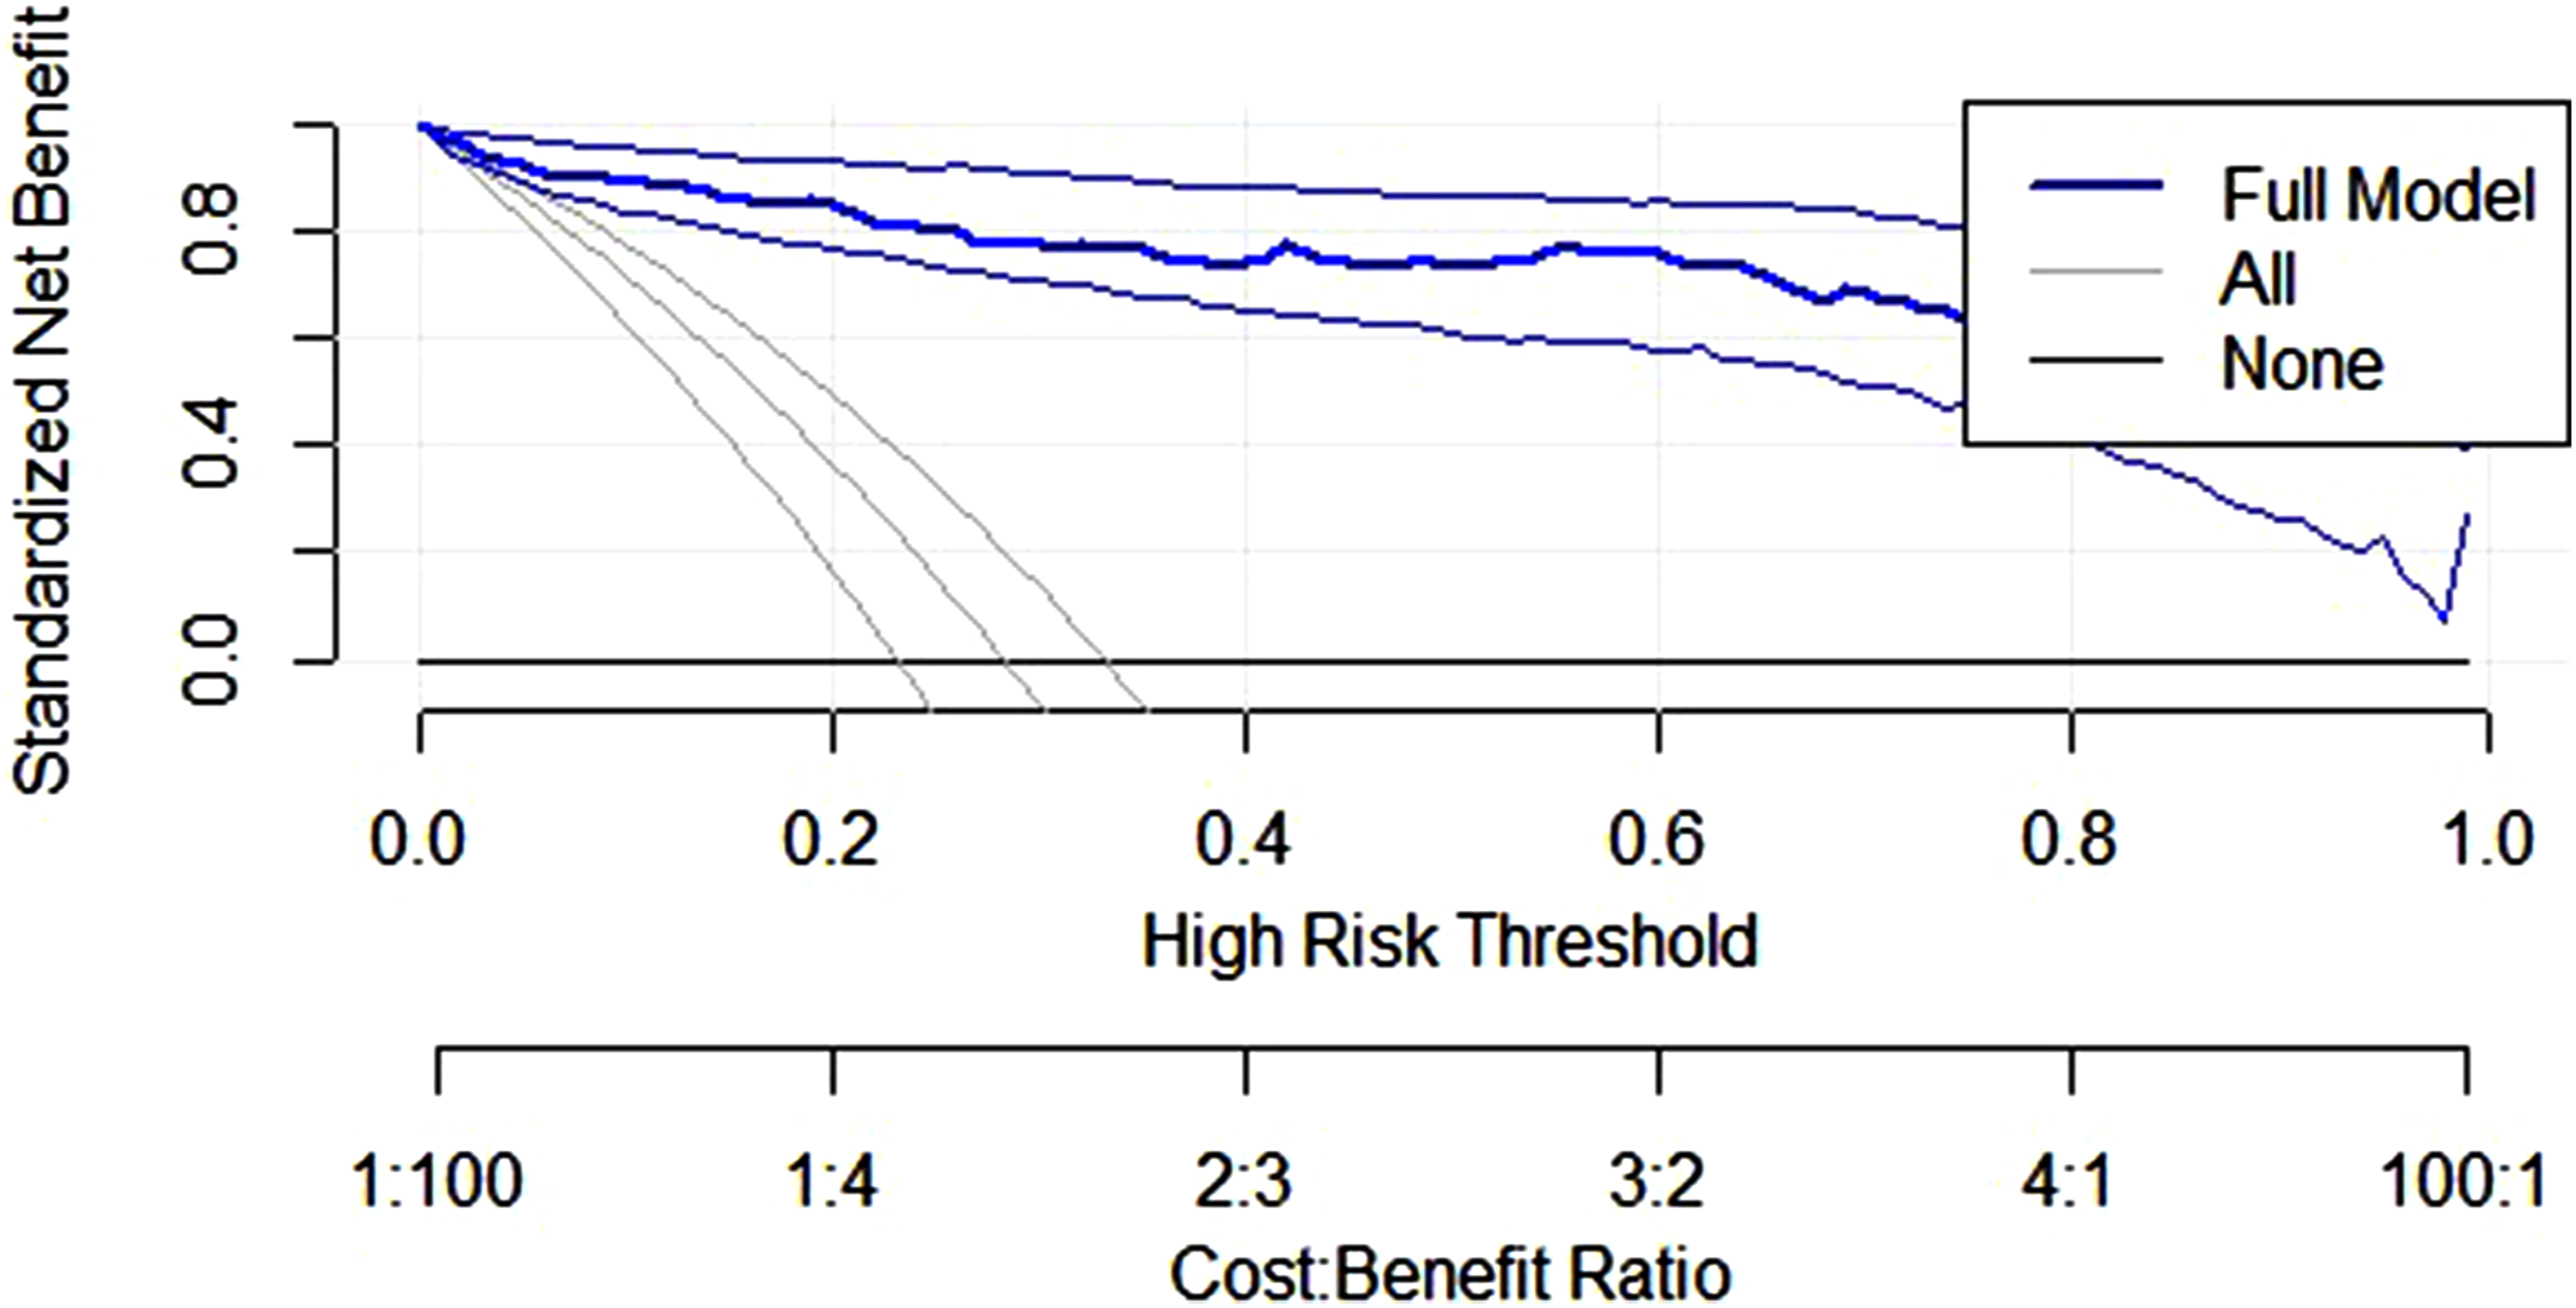
Risk score model to predict low birth weight
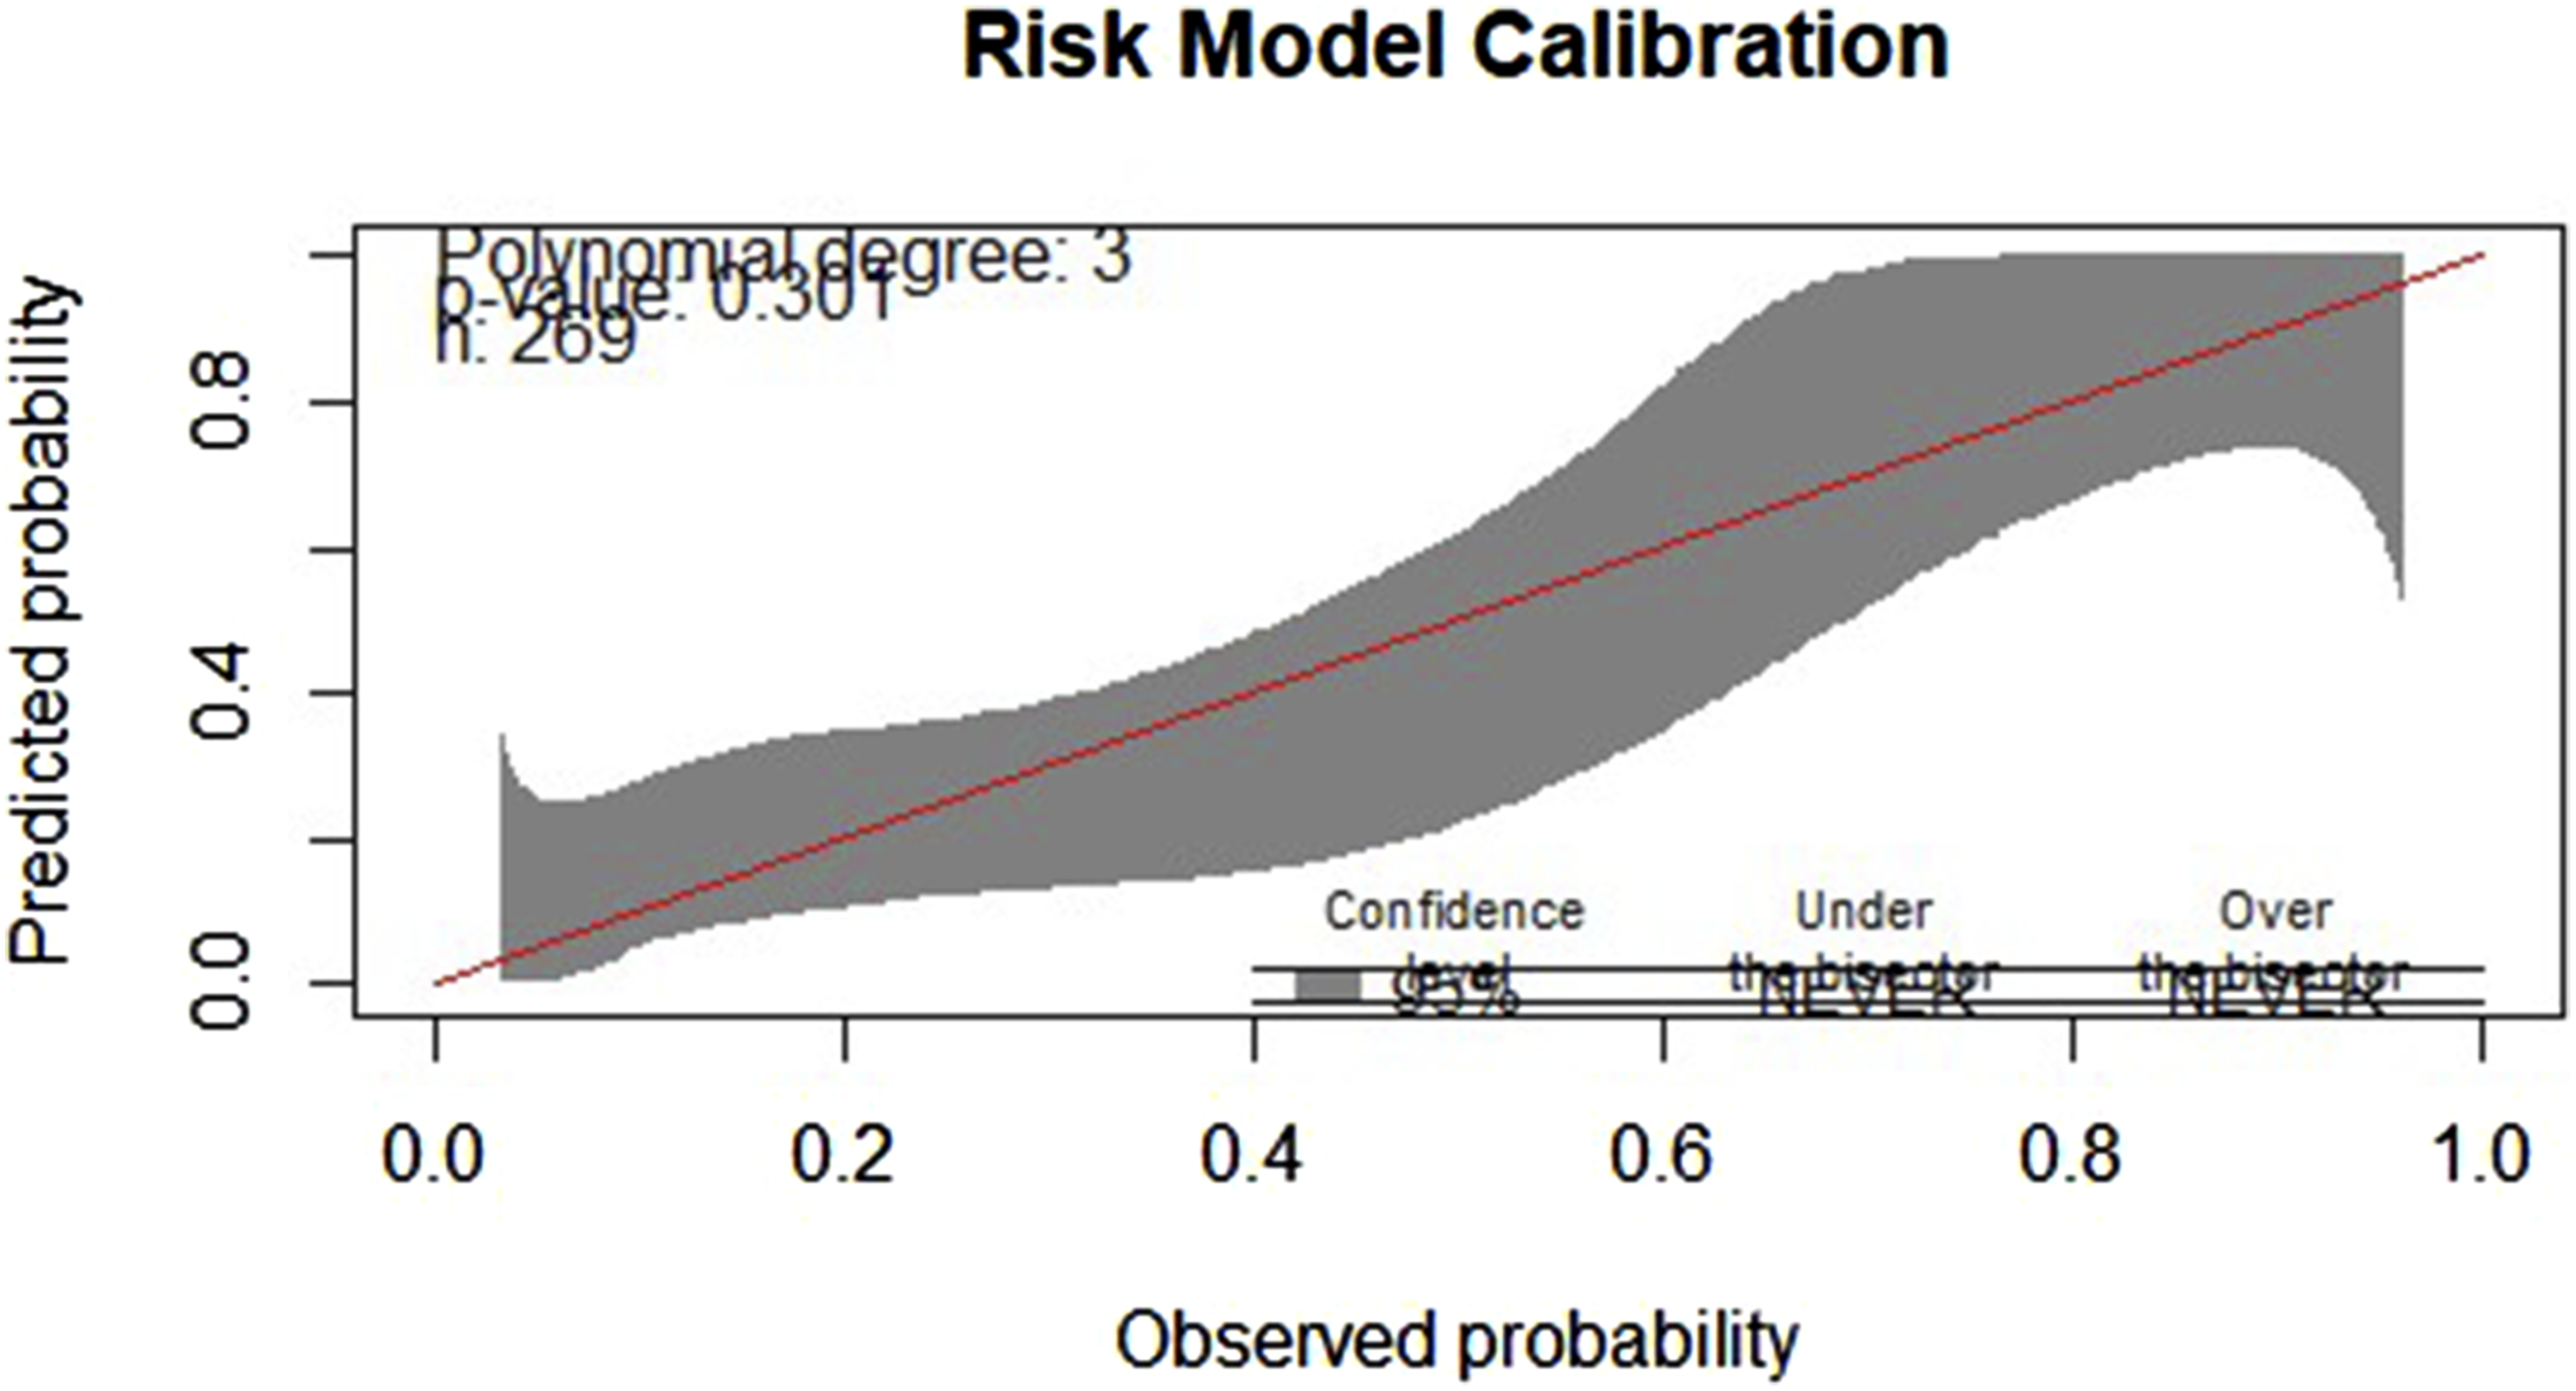
To construct a clinically usable risk score, the regression coefficients from the final multivariable model were rescaled. While the traditional approach divides all β coefficients by the smallest significant β, this produced excessively large point totals that were less practical for bedside use. Therefore, we applied a scaling factor of 0.2 to generate concise, interpretable integer point values while maintaining the relative weighting across predictors. Then after each predictor was assigned points based on its relative weight to predict low birth weight. Then for each individual, the risk score was computed as the sum of assigned points corresponding to their risk factors. Next, this total risk score treated as predictor, and risk regression model was developed. Then the accuracy of the model was evaluated using ROC with its AUC and calibration plot with its p-value. The risk score model has obtained an AUC of 76.8%, 95%CI: 70.2-83.0) showing an acceptable range of discrimination for decision making (Figure 8). The calibration plot demonstrated good agreement between predicted and observed probabilities, with no evidence of miscalibration (p = 0.301, GIVITI calibration belt) (Figure 9). Then risk categorization technique was done based on the optimal cut point of the predicted probability (threshold probability 0.22). These thresholds were derived from the predicted probability distribution observed within the development dataset and selected to enhance practical clinical interpretability and bedside applicability; therefore, they should be interpreted cautiously until externally validated. Less than 0.22 (low risk), from 0.22 to 0.75 (medium risk), and above 0.75 (high risk) a corresponding scores of risk points to these threshold probability of identified risk points table was developed. Based on the risk score classification, when a woman has less than 11 score, she can have 3.2% to 17.5% probability of lbw which is low chance a chance of developing low birth weight baby, implying that routine care may be sufficient. A woman having score from 11 to 21 corresponds to chance of low birth weight is 20.4% to 62% which is medium risk, should be monitored more closely, as their probability approaches 1 in 2. Moreover, woman with score of 22 to 36 points has a chance of 66.2% to 96.3% of lbw which is high risk, identifies pregnancies where more than two in three are predicted to result in LBW, warranting targeted interventions and intensive follow-up (Table 6). Receiver operating characteristics curve (ROC) for risk score model to predict low birth weight. Model calibration for the risk model for predicting low birth weight. Risk classification based on risk score and predicted probability for low birth weight.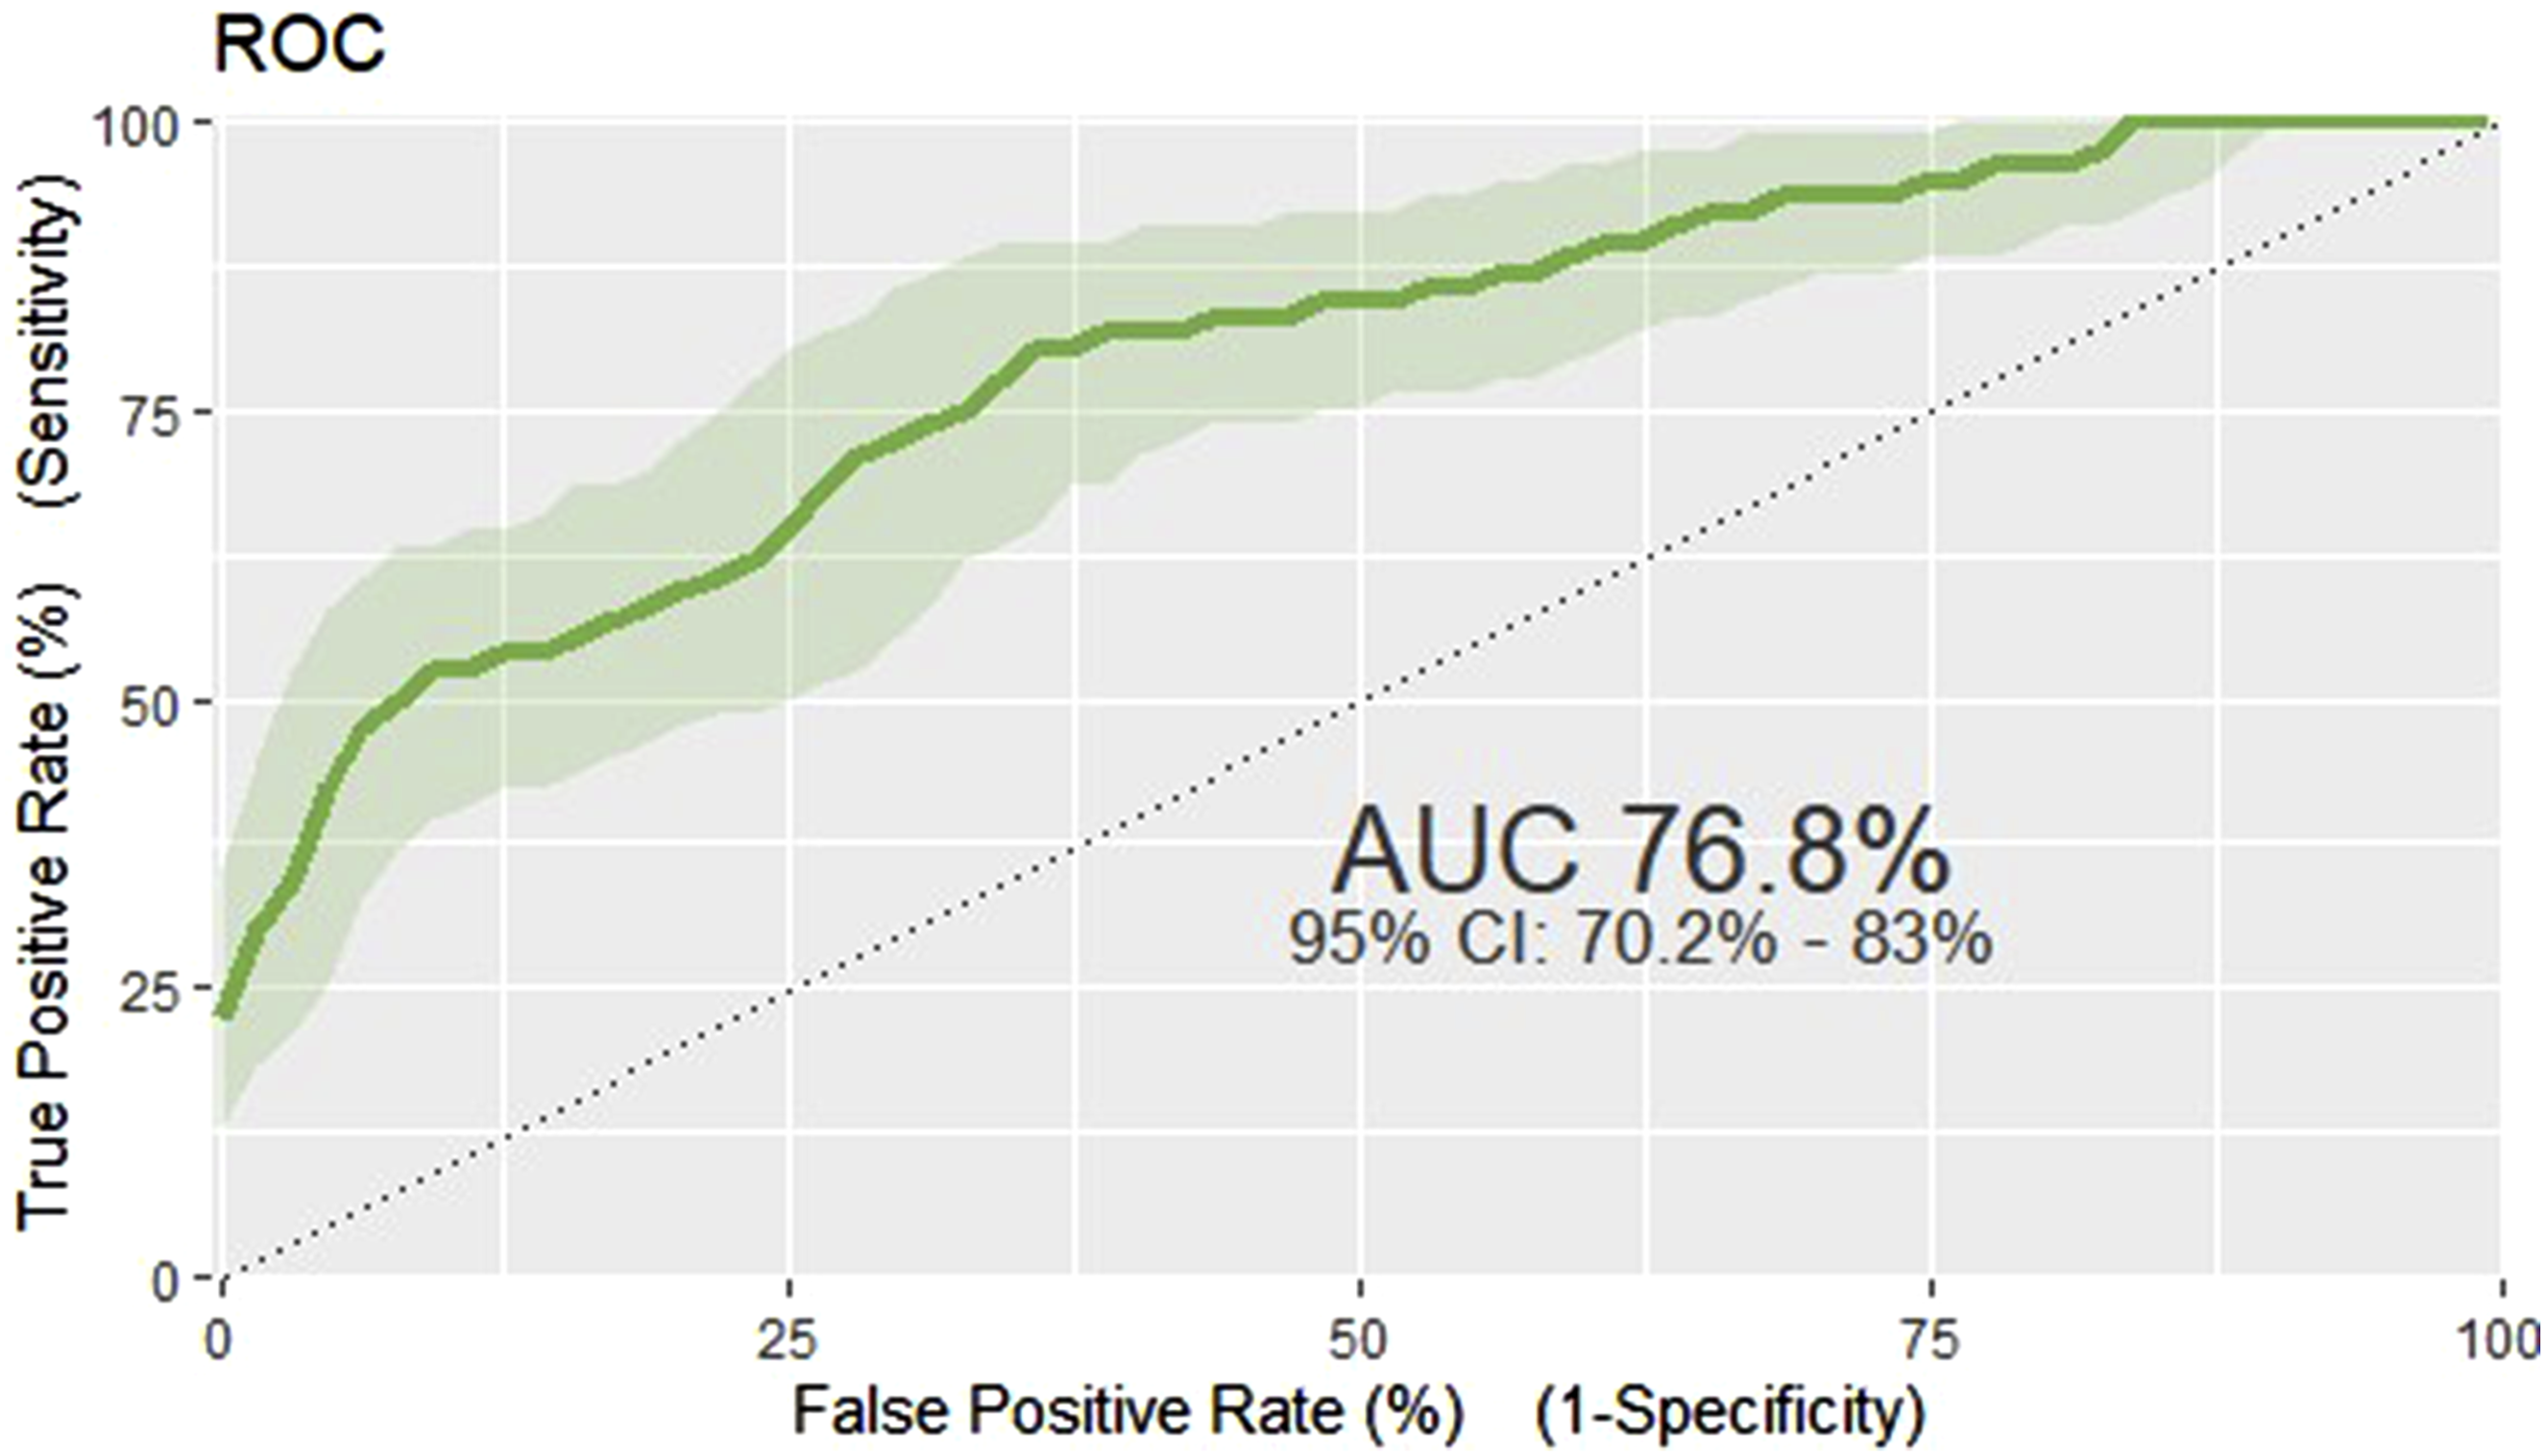
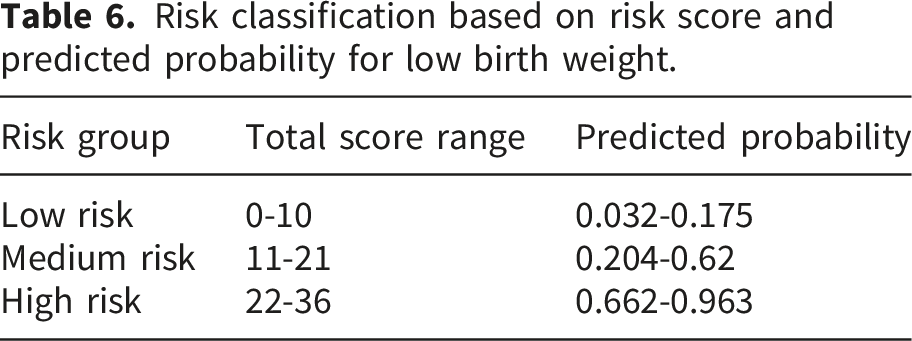
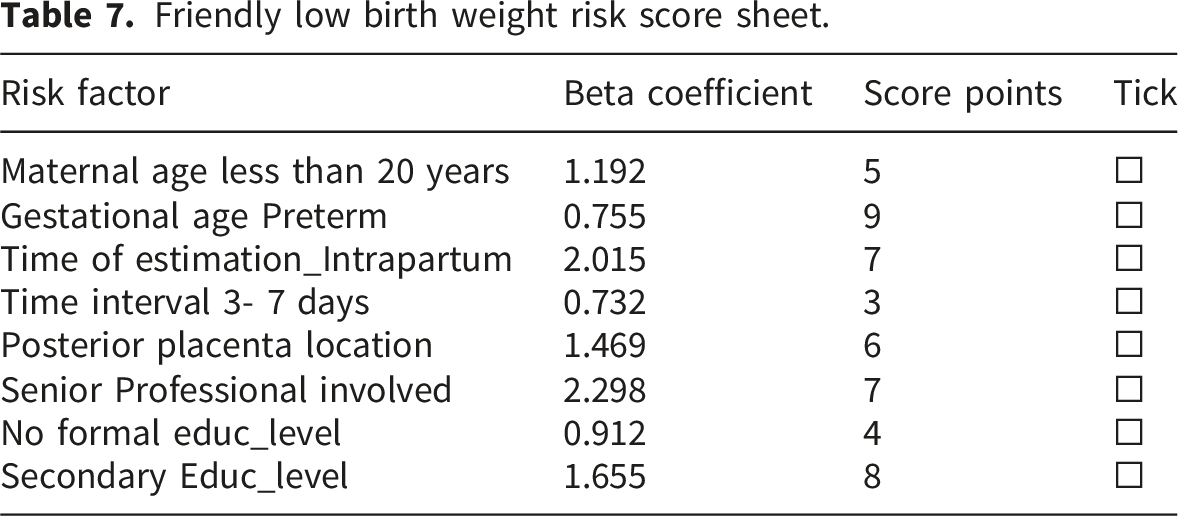
Friendly low birth weight risk score sheet.
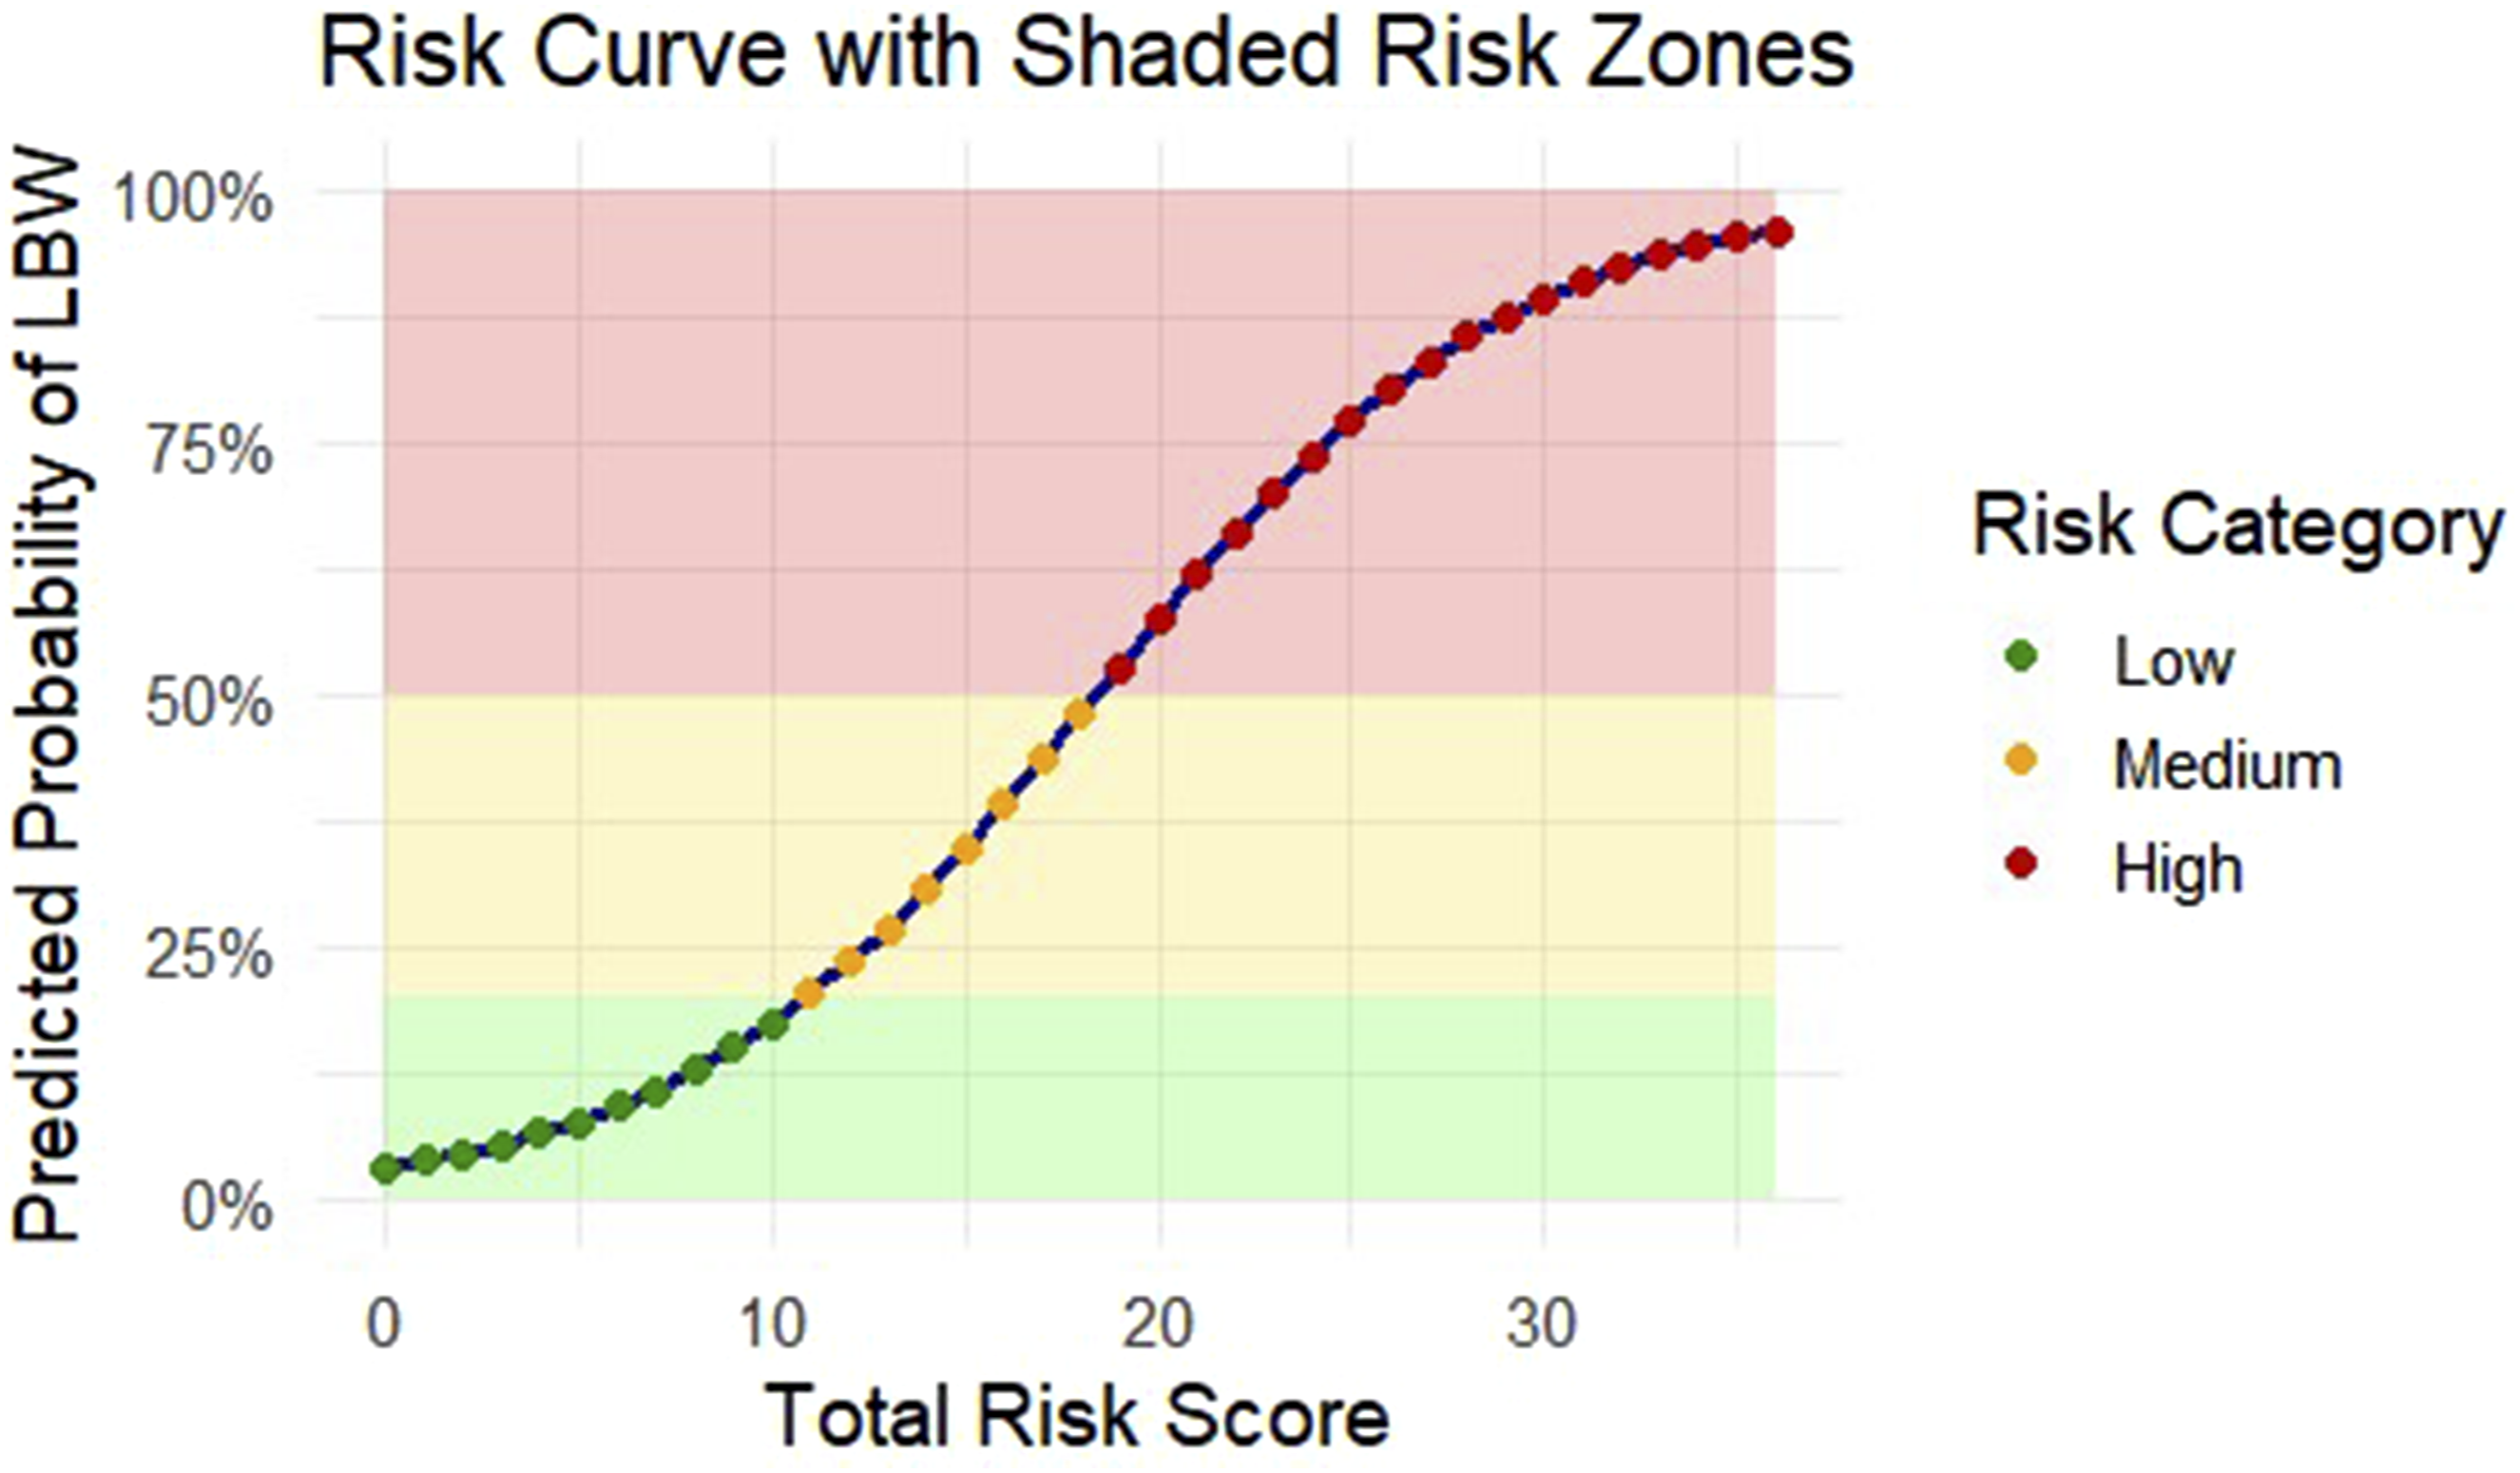
Risk curve with shaded risk zones for predicting low birth weight.
Examples how to use this risk score model; assume that a 19-year-old primigravida at 37 weeks gestation presented for assessment during early labor. An intrapartum ultrasound was performed while the cervix was 4 cm dilated. The placenta was posterior, the ultrasound occurred within 3–7 days of delivery, and the scan was performed by a senior clinician. She also had no formal education. Based on these characteristics, the patient accumulated 5 points for maternal age, 7 points for intrapartum scanning, 3 points for the short scan-to-delivery interval, 6 points for posterior placentation, 7 points for senior professional involvement, and 4 points due to absence of formal education resulting in a total score of 32. This score corresponds to a predicted probability of low birth weight between 20.4% and 62%, placing her in the medium-risk category. Women in this group require closer surveillance, timely decision-making, and preparation for possible neonatal complications.
Another example how to use the model is a 22-year-old primigravida who presented in active labor at 34 weeks of gestation. The placenta was posterior, the ultrasound was performed intrapartum, the scan-to-delivery interval was between 3 and 7 days, and the examination was conducted by a senior clinician. She had no formal education. In this scenario, the patient accumulated 9 points for preterm gestation, 7 points for intrapartum ultrasound, 3 points for the short scan-to-delivery interval, 6 points for posterior placenta location, 7 points for assessment by a senior professional, and 4 points for lack of formal education, giving a total score of 36. This score corresponded to a predicted probability of low birth weight between 66.2% and 96.3%, categorizing her as high-risk. Such patients require intensive monitoring, preparedness for neonatal resuscitation, and early involvement of specialized neonatal care.
Agreement between the original prediction model and the simplified risk score
To evaluate the consistency between the original prediction model and the simplified integer-based risk score, both categorical and continuous agreement were evaluated. Categorical agreement across the three risk groups (low, moderate, high) yielded a Cohen’s Kappa value of 0.353 (p < 0.0001). Cohen’s Kappa of 0.353 indicates only fair agreement between the original model and the simplified risk score, suggesting that substantial individual-level misclassification remained after model simplification despite preservation of acceptable overall discrimination. This reflects the expected loss of information resulting from coefficient scaling and conversion of a continuous prediction model into a simplified integer-based bedside scoring system.
A Bland–Altman plot between predicted probabilities of the original model and risk score model was drawn, the plot demonstrated a mean bias close to zero with acceptable limits of agreement, indicating that the score-derived predicted probabilities reasonably approximate those produced by the full original model (Figure 11). Bland Altman plot agreement between predicted probabilities of original model and risk score model.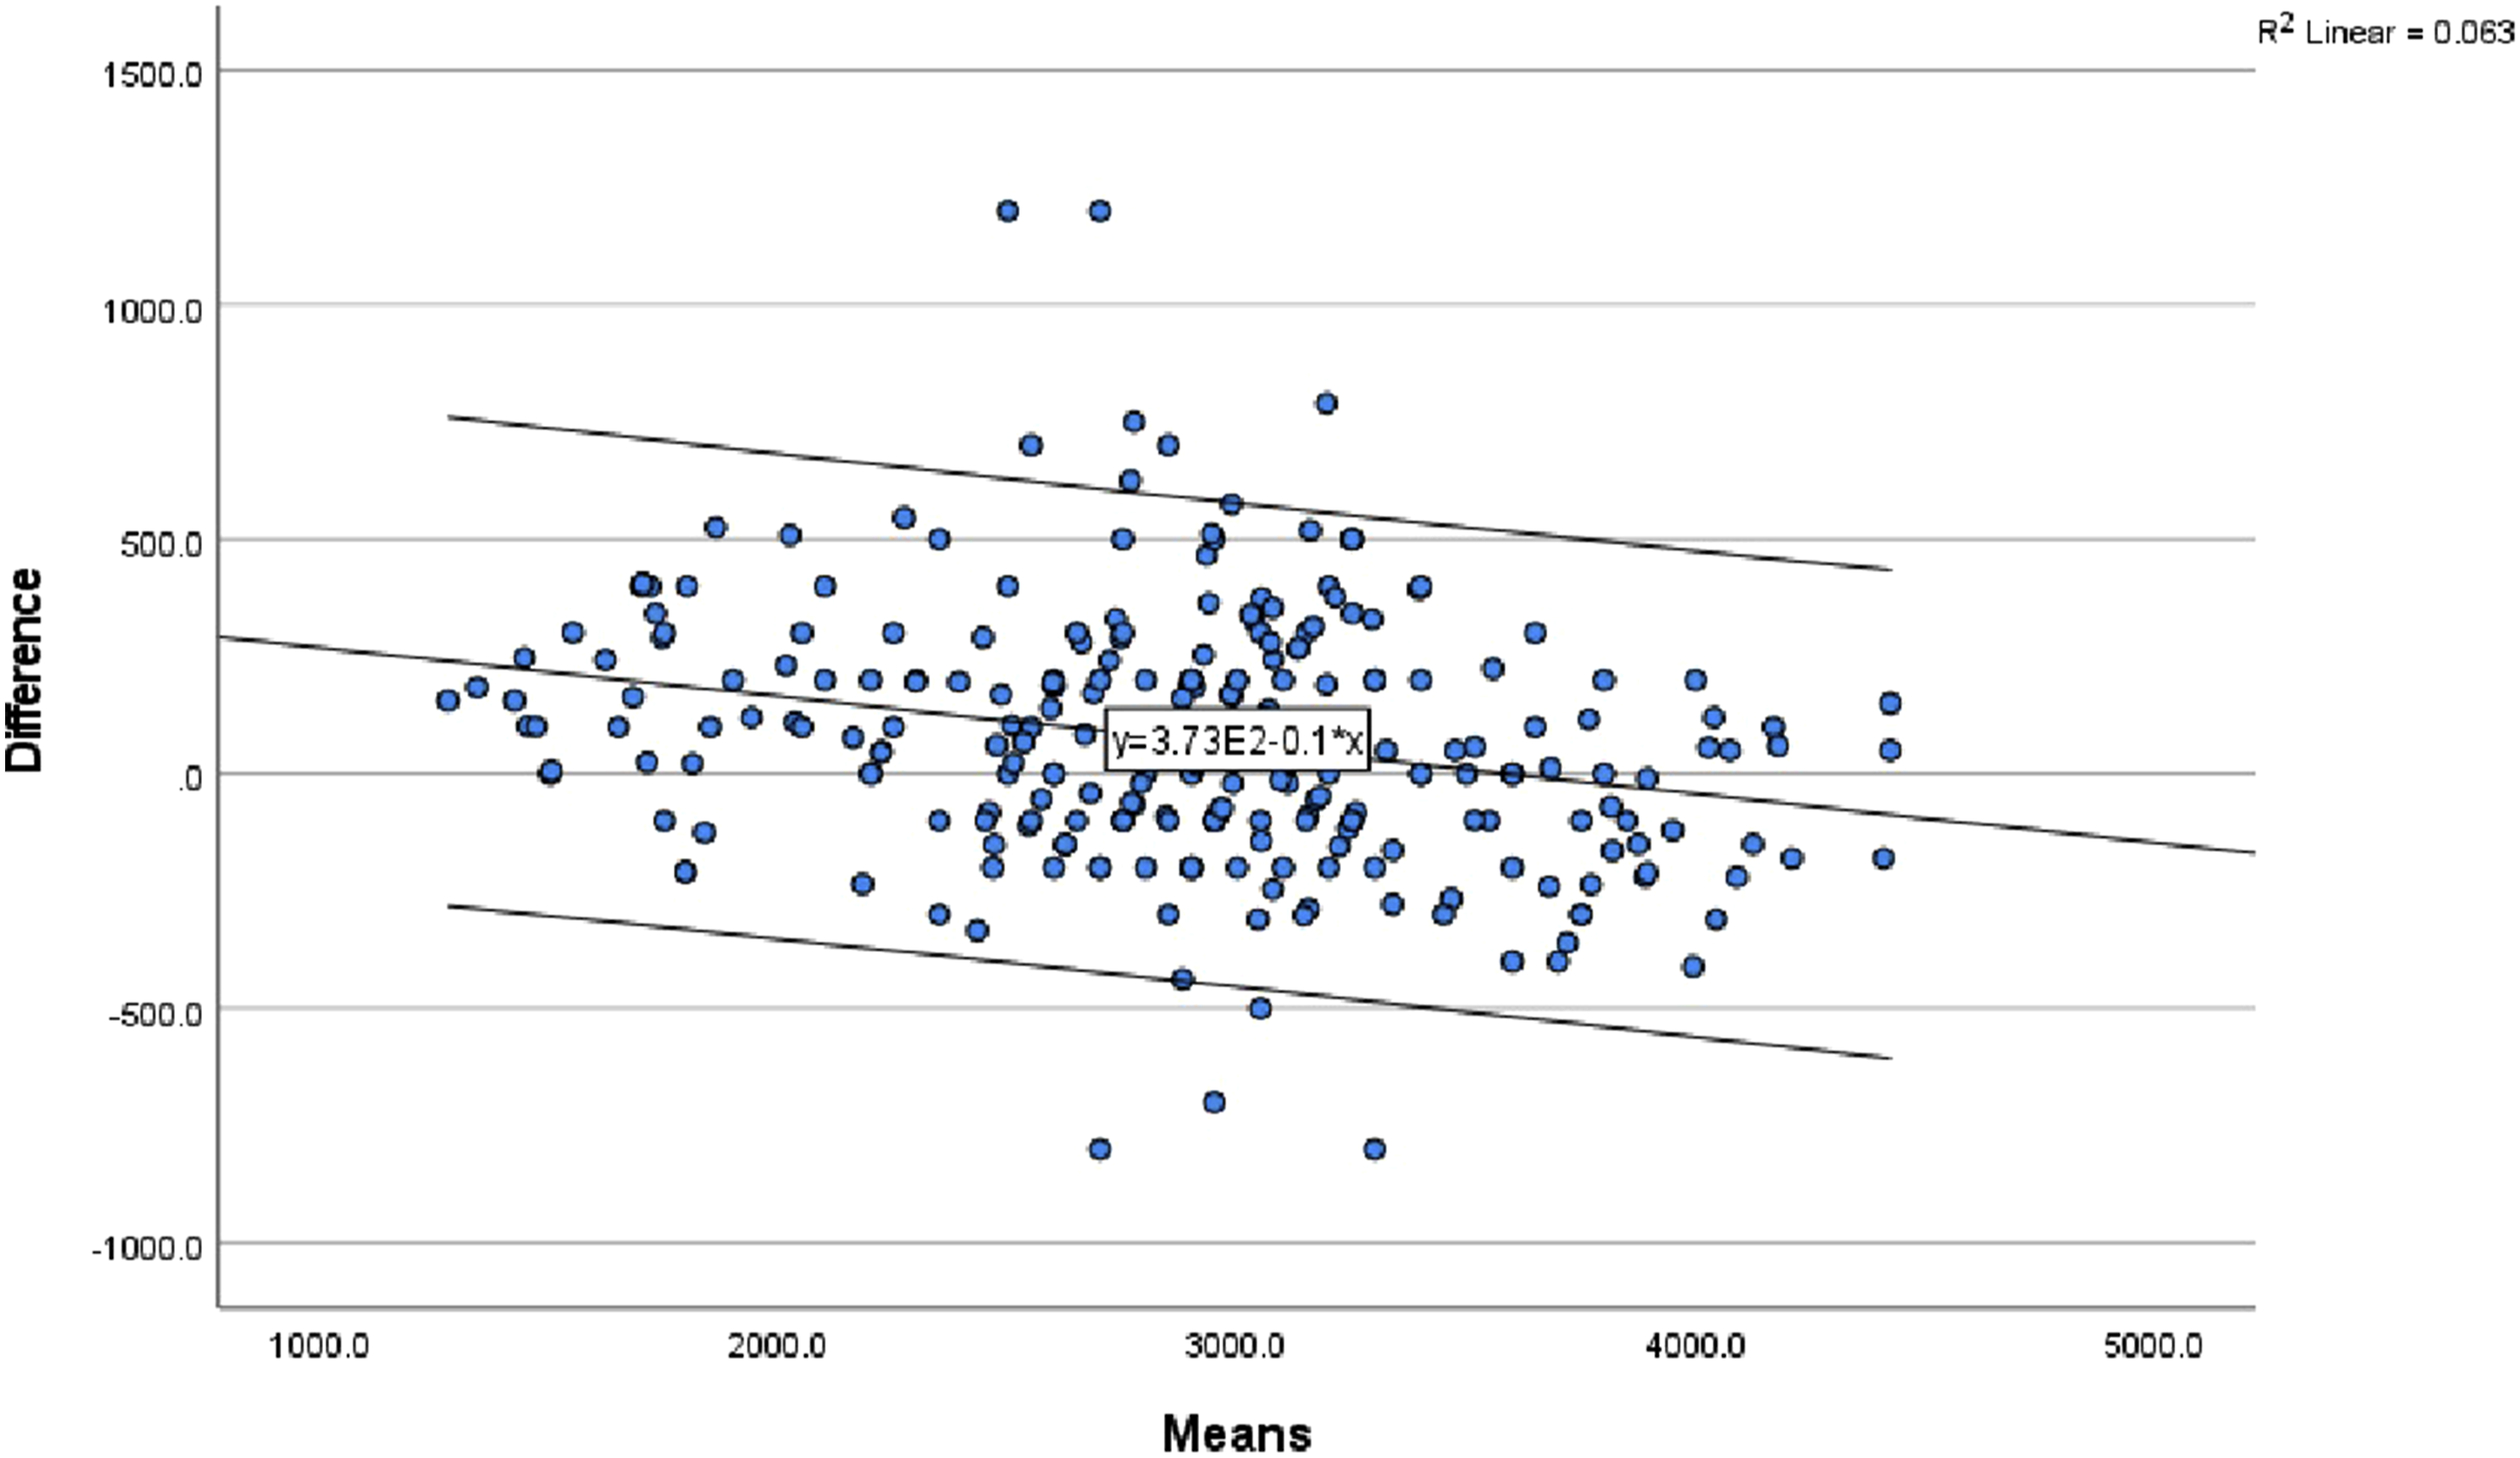
Discussion
Accurate estimation of fetal weight using prenatal ultrasound plays a vital role in optimizing antenatal care and guiding timely interventions, thereby improving the management of high-risk pregnancies and reducing perinatal complications. The use of prenatal ultrasound is expanding globally, including in low-income countries. 42 Early identification and stratification of high-risk pregnancies are essential for minimizing adverse outcomes and the development of predictive models and producing easy to use tools such as risk scores can support clinical decision-making. 43
This study aimed to assess the accuracy of ultrasound estimated fetal weight in relation to actual birth weight, and develop risk prediction models for low birth weight based on maternal, pregnancy, and fetal parameters at TGSH. Accordingly in this study, the accuracy of the ultrasound in estimating fetal weight using Hadlock III formula as compared to the actual birth weight was 72.9 %. This is in line with a study conducted in Nigeria and Portugal where the Hadlock formula demonstrated an accuracy of 82.3% and 78% respectively.44,45 However, as compared to studies done in Italy, Nigeria, Sudan and Pakistan there is a better accuracy in this study. Moreover, the accuracy in the current study is slightly lower than previous studies conducted in New Zealand, India and Turkey.11,15,24
The difference in accuracy is acceptable as there are differences in level of experience for sonographers, in our study 89% of estimated fatal weights were performed by resident doctors who are on training that might decrease the level of accuracy. In addition, type of instrument and the formula used for fetal weight calculation can contribute to the variations. 46 Moreover, lower accuracy of ultrasound-based fetal weight estimation in our study (72.9%) can be explained by the high burden of preterm birth in Amhara region, where our study was conducted. Multiple studies have showed that the prevalence of preterm birth in Amhara region is substantially higher than global averages, where studies from the region report preterm birth rates ranging from 11.4% to 15.1%.47,48
In our sample, 18.2% of births occurred before 37 weeks of gestation. Because ultrasound fetal weight estimation formulas such as Hadlock were calibrated primarily in term or near-term fetuses in high-income populations, accuracy tends to decrease among smaller fetuses and in populations with high rates of growth restriction or prematurity. This is consistent with evidence showing that fetal biometry becomes less precise as gestational age decreases, due to greater biological variability and difficulty in obtaining standard measurement planes in preterm fetuses.49,50
The weight estimation inaccuracies were positive mean percentage error (3.9%) and with bias of 73.5gms which implied that ultrasound fetal weight estimations were overestimated. The absolute percentage error and mean absolute error were 8.3% and 210.97gm respectively. The mean absolute error of this study is consistent with studies done in Tunisia in which the mean absolute error was found to be 200gm. The mean absolute percentage error was almost similar from the study in Pakistan and India where mean absolute percentage error was 8.2%. Similar study from Germany showed that the absolute mean error of 261.5gm which is almost similar to our study.24,51–53 In this study, the estimated fetal weight was highly correlated with actual birth weight with a high correlation coefficient which is incongruent with a study done in Germany and Nigeria.4,53
Although the Bland–Altman analysis demonstrated relatively small overall systematic bias between ultrasound-estimated fetal weight and actual birth weight, the relatively wide limits of agreement and the presence of several outlying observations indicate that clinically important individual-level discrepancies remain possible.
Greater variability was observed particularly among preterm pregnancies and among ultrasounds performed more than 3 days before delivery, suggesting that gestational maturity and timing between ultrasound assessment and delivery may influence estimation precision. Similar observations have been reported in previous studies. 49 Our finding that greater variability in ultrasound fetal weight estimation was observed among preterm pregnancies and among scans performed more than 3 days before delivery is therefore consistent with existing evidence.49,54 Several studies have reported that the accuracy of ultrasound-estimated fetal weight tends to decrease with increasing time interval between ultrasound examination and delivery because continued fetal growth after assessment may widen the discrepancy between estimated and actual birth weight. 54 Similarly, preterm pregnancies are often associated with altered fetal growth patterns, reduced soft tissue mass and technical challenges in biometric measurements, all of which may increase estimation variability. 55 A systematic review by Dudley reported that the precision of sonographic fetal weight estimation is influenced by gestational age and timing of assessment, with wider limits of agreement observed in some preterm pregnancies and when the interval between ultrasound examination and delivery increases. 49 Likewise, Colman et al. demonstrated that shorter scan-to-delivery intervals improve the accuracy of ultrasound fetal weight estimation, particularly near term40. These findings support our observation that gestational maturity and the timing of ultrasound assessment may substantially influence fetal weight estimation precision. 12
In the case of this study, clinically, these findings imply that while ultrasound-estimated fetal weight may perform reasonably well for population-level screening and risk stratification. Caution is required when making individualized clinical decisions near the low birth weight diagnostic threshold, where modest estimation errors may alter classification and subsequent management. 49
In our risk prediction model for low birth weight, we entered eight prognostic determinants that were retained from LASSO regression. The predictors were maternal age, gestational age at delivery, estimated fetal weight, timing estimation, time interval, location of placenta, professional involved in the estimation, and maternal educational level. This model achieved an AUC of 95.9%, and calibration plot of p-value 0.371; this model can effectively distinguishes between LBW and normal birth weight cases, and the calibration plot suggests a good agreement between observed and predicted probabilities. This level of accuracy and calibration is crucial for early intervention and management of potential LBW cases, which are associated with increased neonatal morbidity and mortality. Similar studies have reported comparable levels of model accuracy; including a study utilized a super learner ensemble approach incorporating maternal nutritional consumption produced an AUC of 96%. 56 And another study data-mining model using decision trees and SMOTE for handling imbalanced datasets have demonstrated high AUC values achieving an AUC of 90.3%. 57
An important methodological consideration in this study is the role of estimated fetal weight (EFW) within the prediction model, given its strong biological and statistical relationship with actual birth weight. To address this, we conducted additional analyses comparing the full model with both an EFW-only approach and a model excluding EFW.
The EFW-only model demonstrated good discrimination (AUC = 84%), but with lower sensitivity (69.7%), indicating that a substantial proportion of low birth weight cases would be missed when relying solely on a fixed EFW threshold. In contrast, the multivariable model substantially improved discrimination (AUC = 95.9%) and increased sensitivity to 81.6%, suggesting enhanced ability to identify at-risk pregnancies. Furthermore, a model excluding EFW retained acceptable discrimination (AUC ≈ 85%), highlighting the independent predictive contribution of maternal, obstetric, and contextual variables. Together, these findings indicate that the proposed model is not merely a restatement of fetal weight estimation, but rather integrates complementary sources of information to achieve superior predictive performance, particularly in identifying borderline or clinically ambiguous cases.
To assess model stability and mitigate optimism bias, we performed 1000 bootstrap iterations; a gold-standard approach for internal validation in predictive modeling. 58 Although the overall predictive performance remained strong after bootstrap validation, several bootstrap-corrected 95% confidence intervals for individual predictors crossed zero, suggesting sensitivity of some coefficient estimates to sampling variability. In contrast, estimated fetal weight remained consistently associated with low birth weight after optimism correction, indicating greater stability of this predictor. These findings suggest that while several predictors contribute collectively to model performance, some individual effects should be interpreted with caution given the relatively limited number of events available for model development. Moreover, the validated model retained a high AUC of 94.3%, only slightly reduced from the original 95.9%, confirming excellent discriminative ability after optimism correction.
We performed decision curve analysis for our model; it provided greater net benefit than the “treat all” or “treat none” strategies across a wide range of threshold probabilities, demonstrating its clinical utility in improving identification of low birth weight cases while minimizing unnecessary interventions. Furthermore, we developed a simplified risk score for predicting low birth weight (LBW) by converting regression coefficients into integer points after scaling and rounding. The total score for each woman, obtained by summing assigned points for her risk factors, was used as a predictor in a risk regression model. The risk score model demonstrated acceptable discrimination (AUC = 76.8%, 95% CI: 70.2–83.0). The drop in the discrimination performance AUC 95.9% in the original model vs. AUC 76.8% in risk score model occurred because of the computational process in changing regression coefficients into score points, and then employing a regression model for the point score resulted in the loss of accuracy. This trade-off is well-recognized in clinical prediction modeling, where simplified tools aim to improve usability at the expense of some predictive precision. 39 In addition, the risk score model got very good calibration (p = 0.301), indicating agreement between predicted and observed outcomes. Based on an optimal probability threshold of 0.22, the study subjects were stratified into low (<11 points), medium (11–21 points), and high (22–36 points) risk groups, corresponding to increasing probabilities of LBW from 3.2% up to 96.3%. A user-friendly points table, classification chart, and risk curve were developed to facilitate clinical application and enable rapid identification of women at higher risk who may benefit from closer monitoring or targeted interventions. Although the simplified risk score maintained acceptable discrimination, the relatively low Cohen’s Kappa value indicates that agreement with the original model was only fair, implying that some patients may be classified differently at the individual level after score simplification. Therefore, the simplified score should primarily be considered a pragmatic bedside risk stratification tool rather than a direct substitute for the full multivariable prediction model.
Compared with traditional international low-birth-weight prediction models that rely primarily on maternal Sociodemographic characteristics and gestational age, the present model incorporates a richer set of clinically relevant predictors selected through LASSO regression.59,60 Our model integrates both maternal and fetal domains; including ultrasound estimated fetal weight, placental location, timing of assessment, scan-to-delivery interval, and operator level. These variables reflect real-time fetal growth, placental function, and measurement context, enabling a more precise estimation of LBW risk. The strong performance of our model AUC of 94.3% after bootstrap correction and good calibration demonstrates its clear incremental value over simpler models that lack fetal biometric inputs.
Furthermore, unlike earlier LBW prediction tools derived solely from antenatal characteristics, our model benefits from the predictive power of ultrasound-based fetal weight estimation and incorporates methodological rigor through penalization and bootstrap validation. The inclusion of EFW and placental characteristics allows the model to account for population specific fetal growth patterns, which are particularly important in Ethiopian settings where the prevalence of preterm birth, fetal growth restriction, and placental abnormalities is higher than in many high-income regions.48,61
The use of LASSO regression ensures that only the most predictive and non-redundant variables were retained, minimizing overfitting and improving generalizability. 62 This contrasts with traditional models that often lack formal variable selection procedures and rely on subjective inclusion of predictors. Additionally, the development of a simplified integer-based risk-score tool extends the model’s practical utility by enabling frontline clinicians to estimate LBW risk quickly without computational support. Overall, the combination of rigorous statistical modeling, inclusion of fetal and intrapartum factors, and translation into a practical bedside tool distinguishes our model from prior LBW prediction models and provides meaningful clinical advantage in resource-limited settings.
Despite several strengths, this study has some limitations. First, because secondary data were used, some potentially important predictors were unavailable for analysis. Second, the study was conducted at a single tertiary care center, which may limit the generalizability of the findings to other regions of Ethiopia and to other low-income settings with different patient characteristics, clinical practices, and healthcare resources. Future studies should therefore include multicenter and more heterogeneous populations to externally validate the model across different settings.
The use of secondary data also limited the availability of detailed operator-level information, such as years of experience, number of ultrasound examinations performed, and certification status, all of which may influence the accuracy of fetal weight estimation. In addition, although estimated fetal weight (EFW) was an important predictor, its inclusion in the model may introduce partial dependency with the outcome. However, comparative analyses demonstrated that the model provides meaningful predictive improvement beyond EFW alone.
Another limitation relates to the relatively low events-per-variable (EPV) ratio during model development. Although penalized regression using LASSO and bootstrap internal validation were applied to reduce overfitting, the limited EPV may still affect model stability and contribute to optimism in predictive performance estimates. Recent methodological guidance has highlighted that low EPV may increase instability and optimism in prediction models, particularly when predictor-selection procedures are used, reinforcing the need for external validation in independent populations.36,37 Consistent with this concern, several bootstrap-corrected confidence intervals crossed zero, suggesting that some individual predictor effects were sensitive to sampling variability despite the model maintaining strong overall predictive performance.
A further limitation relates to the internal validation strategy. Predictor selection using LASSO regression was performed before bootstrap validation rather than being repeated within each bootstrap replicate. Consequently, variable-selection uncertainty was not fully propagated during optimism estimation, and the predictive performance estimates may therefore remain somewhat optimistic. Similarly, because the simplified risk-score thresholds were derived and evaluated within the development dataset, their performance characteristics may differ when applied in independent populations. Therefore, external validation in larger, independent, and multicenter populations is required before widespread clinical implementation of either the full prediction model or the simplified risk-score tool.
Conclusion
The emphasis of this study was the clinical importance of birth weight estimation using prenatal ultrasound in resource limited settings to facilitate timely identification of risk pregnancies for low birth weight to improve perinatal outcomes. The Hadlock III formula revealed acceptable accuracy in estimating fetal weight, with performance metrics comparable to international benchmarks. In this study, we developed and internally validated a multivariable prediction model for low birth weight (LBW) using routinely collected clinical and ultrasound data. We identified eight predictors using LASSO based data-driven variable selection and penalized logistic regression. Our model demonstrated excellent apparent discrimination (AUC 95.9%) and good calibration (p-value = 0.371), and retained very good performance after bootstrap correction (AUC 0.94, calibration slope 0.79) affirming its utility in stratifying the risk of low birth weight.
We translated the model into an integer-based risk score that provides rapid bedside estimation of LBW risk to enhance clinical use. Based on the risk score for practical use we stratified pregnant women into low, medium, and high-risk groups, thereby facilitating timely decision making activities by healthcare providers. The developed model demonstrated promising predictive performance and may support risk stratification of low birth weight in similar resource-limited settings. However, given the single-center nature of the study, the reliance on secondary data and the absence of external validation, multicenter external validation is required before broader clinical implementation.
Supplemental material
Supplemental material - Diagnostic accuracy of ultrasound-based fetal weight estimation and prediction modeling for low birth weight: A retrospective cohort study in Northwest Ethiopia
Supplemental material for Diagnostic accuracy of ultrasound-based fetal weight estimation and prediction modeling for low birth weight: A retrospective cohort study in Northwest Ethiopia by Amsalu Worku Mekonin, Sintayehu Debas, Haile Mekonnen Fenta, Yihun Miskir Wubie, Asres Zegeye, Zelalem Alamrew Anteneh in Science Progress
Supplemental material
Supplemental material - Diagnostic accuracy of ultrasound-based fetal weight estimation and prediction modeling for low birth weight: A retrospective cohort study in Northwest Ethiopia
Supplemental material for Diagnostic accuracy of ultrasound-based fetal weight estimation and prediction modeling for low birth weight: A retrospective cohort study in Northwest Ethiopia by Amsalu Worku Mekonin, Sintayehu Debas, Haile Mekonnen Fenta, Yihun Miskir Wubie, Asres Zegeye, Zelalem Alamrew Anteneh in Science Progress
Footnotes
Acknowledgment
We extend our sincere gratitude to Bahir Dar University for granting ethical clearance to conduct this study. We are also deeply thankful to the administration office of Tibebe Ghion Specialized Hospital for providing the official permission letter. Our appreciation further goes to the data collectors and Card Room staff members for their invaluable cooperation and support throughout the data collection process. We acknowledge the use of Microsoft Copilot to improve the clarity, grammar, and readability of the manuscript and to identify typographical errors. This tool was not used for data analysis, statistical modeling, interpretation of findings, or any aspect of study design.

Author contributions
AWM- conceptualized the study, designed the study, supervised the data collection, performed data analysis, interpreted the findings, drafted the manuscript, and approved the manuscript.
SD- involved designing the study, validated data analysis, interpreted the findings, edited and reviewed the manuscript.
HMF- involved data analysis, interpreted the findings, and reviewed the manuscript.
YMW- involved in the data analysis, interpreted the findings, and drafted the manuscript.
AZ- validation of data analysis, interpreted the findings, and reviewed the manuscript.
ZAA- conceptualized the study, designed the study, supervised the data collection, performed data analysis, interpreted the findings, drafted the manuscript, and approved the manuscript.
All authors had thoroughly read and approved the manuscript.
Funding
The authors received no financial support for the research, authorship, and/or publication of this article.
Declaration of conflicting interests
The authors declared no potential conflicts of interest with respect to the research, authorship, and/or publication of this article.
Data Availability Statement
Anonymized full dataset underlying the study is available within the paper and its Supporting information files.
Supplemental material
Supplemental material for this article is available online.
References
Supplementary Material
Please find the following supplemental material available below.
For Open Access articles published under a Creative Commons License, all supplemental material carries the same license as the article it is associated with.
For non-Open Access articles published, all supplemental material carries a non-exclusive license, and permission requests for re-use of supplemental material or any part of supplemental material shall be sent directly to the copyright owner as specified in the copyright notice associated with the article.
