
Abstract
Background
This study employs machine learning strategy algorithms to screen the optimal gene signature of pulmonary arterial hypertension (PAH) under big data in the medical field.
Methods
The public database Gene Expression Omnibus (GEO) was used to analyze datasets of 32 normal controls and 37 PAH disease samples. The enrichment analysis was performed after selecting the differentially expressed genes. Two machine learning methods, the least absolute shrinkage and selection operator (LASSO) and support vector machine (SVM), were used to identify the candidate genes. The external validation data set further tests the expression level and diagnostic value of candidate diagnostic genes. The diagnostic effectiveness was evaluated by obtaining the receiver operating characteristic curve (ROC). The convolution tool CIBERSORT was used to estimate the composition pattern of the immune cell subtypes and to perform correlation analysis based on the combined training dataset.
Results
A total of 564 differentially expressed genes (DEGs) were screened in normal control and pulmonary hypertension samples. The enrichment analysis results were found to be closely related to cardiovascular diseases, inflammatory diseases, and immune-related pathways. The LASSO and SVM algorithms in machine learning used 5 × cross-validation to identify 9 and 7 characteristic genes. The two machine learning algorithms shared Caldesmon 1 (CALD1) and Solute Carrier Family 7 Member 11 (SLC7A11) as genetic signals highly correlated with PAH. The results showed that the area under ROC (AUC) of the specific characteristic diagnostic genes were CALD1 (AUC = 0.924) and SLC7A11 (AUC = 0.962), indicating that the two diagnostic genes have high diagnostic value.
Conclusion
CALD1 and SLC7A11 can be used as diagnostic markers of PAH to obtain new insights for the further study of the immune mechanism involved in PAH.
Keywords
Introduction
Right heart catheterization (RHC) has shown that a mean pulmonary artery pressure (mPAP) of >25 mmHg and a normal pulmonary artery wedge pressure (PCWP) of <15 mmHg are generally observed in pulmonary arterial hypertension (PAH). 1 PAH is a chronic condition in which the arteries of the lung have high pressure, and as a result, the heart has to work harder to pump blood through. Therefore, both the heart and the lung are affected by PAH. Patients with PAH often show symptoms of dyspnea during progressive exercise. If not treated in time, such patients may die because of the various cardiopulmonary factors involved. PAH has become a major global health problem. The prevalence of PAH has been estimated to increase by up to 10% among people over 65 years of age. 2 However, it has also been reported that systematic diagnosis and treatment can help achieve a 3-year survival rate of 90% in patients with PAH. 3 The RHC is an accurate and feasible method to confirm PAH. Echocardiography can also be used to confirm PAH. 4
Some recent studies have shown that genetic factors are also indispensable in the pathogenesis of PAH. Therefore, genetic factors are increasingly being investigated for the diagnosis and prognosis of PAH. A comprehensive analysis involving bioinformatics and clinical practice can be used to screen potential genes involved in the pathogenesis of various diseases, which is helpful for the diagnosis and treatment of various diseases. Studies have shown that mutations in the Bone Morphogenetic Protein Receptor Type 2 (BMPR2) gene significantly increases the risk of PAH.5–7 Disintegrin and Metalloproteinase with Thrombospondin Motif 8 (ADAMTS8) can be used as a new therapeutic target in the treatment of PAH. 8 It has been recently shown that potential immune cell infiltration considerably affects the pathogenesis of PAH. Li et al. showed that CD8 + cytotoxic T cells and Th2 helper cells may be responsible for the apoptosis–anti-apoptotic signal transduction and the damage caused by small pulmonary artery muscularization. 9 Therefore, we herein use the bulk RNA deconvolution tool CIBERSORT to explore differences in immune cells and their role in the pathogenesis of PAH.
We first merge the PAH microarray collections from the public database Gene Expression Omnibus (GEO) to eliminate inter-batch differences. The differential expression between the diseased and normal groups is screened by the machine learning algorithm. The selected potential diagnostic genes are further studied. The verification dataset is designated as another PAH microarray set and is used to verify the selected potential gene signals. The purpose of this study was to explore potential genetic signals to further understand the pathogenesis of PAH.
Materials and methods
Microarray data processing and differential gene screening
The “GEOquery” program package is a commonly used software package for obtaining GEO microarrays in R software. 10 PAH expression datasets GSE131793, 11 GSE113439, 12 and GSE53408 13 include 32 normal controls and 37 PAH samples from the GPL6244 platform. GSE131793 contains 10 PAH samples and 10 normal control samples. GSE113439 contains 15 PAH samples and 11 normal control samples. GSE53408 contains 12 PAH samples and 11 normal control samples. All patients were diagnosed with pulmonary hypertension by ultrasound. The robust multiarray average (RMA) algorithm was used for background correction and data normalization. For multiple probes, the maximum value was taken as the gene expression. The two micro-array data, GSE131793 and GSE113439, were integrated as the training datasets after eliminating inter-batch differences using the surrogate variable analysis (SVA) package. The difference between the batches before and after the application of the SVA package is displayed by two-dimensional principal component analysis (PCA). The validation dataset selected the GSE53408 microarray data expression matrix. The “limma” program package was used to screen the differentially expressed genes (DEGs) with the criteria of P < 0.05 and |log2 fold change (FC) |> 0.5, which are displayed using a volcano map and a heat map. The Benjamini & Hochberg method was used for multiple testing calibrations.
Enrichment analysis method
Enrichment analysis includes gene ontology (GO), disease ontology (DO), and gene set enrichment analysis (GSEA) methods. The “clusterProfiler” and “DOSE” packages were used to perform GO and DO enrichment analysis with P < 0.05 as the standard. The gene set file "c2.cp.kegg.v7.2.symbols.gmt" was downloaded from the MSigDB gene sets (https://www.gsea-msigdb.org/gsea/downloads.jsp) with P < 0.05 as the critical value. This file was used as the reference gene set for GSEA.
Machine learning to screen and verify gene signals
Various machine learning algorithms have been developed for a more accurate diagnosis and treatment predictions for different diseases. We herein used machine learning for gene expression data analysis in PAH. In a previous study, we efficiently and repeatedly optimized a disease model to determine a diagnostic biological target. 14 The least absolute shrinkage and selection operator (LASSO) estimates the regression coefficients by minimizing the residual sum of squares plus a penalty term. Regularization parameter lambda controls the trade-off between data fitting and sparsity. 15 The support vector machine (SVM) is a feature selection algorithm that can sort the features according to the recursive feature deletion sequence. 16 Herein, we comprehensively investigated the LASSO and SVM algorithms and analyzed the crossover genes (satisfying P < 0.05). In addition, we verified the expression differences in potential gene signals in the previous validation dataset GSE53408.
Diagnostic value of gene signals in diseases
We used the validation dataset to identify the potential predictive value of the difference between the gene expressions in patients with PAH and those in normal control. The area under the receiver operating characteristic curve (AUC) is a method to determine the diagnostic power of PAH and control samples. AUC > 0.7 indicates a relatively satisfactory diagnosis efficiency.
Analysis of immune cell components
CIBERSORT is a general calculation method used for deconvolution. 17 A tissue gene expression profile can be used to quantify the cellular components to calculate the degree of infiltration of immune cells. We chose to filter out the samples with P < 0.05 and exclude immune cell types with zero values to obtain the immune cell infiltration matrix. Next, we used the “ggplot2,” “corrplot,” and “vioplot” packages for PCA cluster analysis on the immune cell infiltration matrix data and to draw the bar chart and violin chart. It is helpful to visualize the correlation and difference in the immune cells of the patients with PAH and the normal control.
Statistical analysis
R software (version 3.6.3) was used to process the data and perform statistical analysis. We used Student's t test for normally distributed variables and the Mann-Whitney U test for abnormally distributed variables.
Results
DEG-recognition results
A two-dimensional PCA cluster chart was obtained to show the differences among the batches before and after the application of GSE131793 and GSE113439 (Figure 1(a), Figure 1(b)). The results showed that the clustering of the 2 samples was obvious after the batch differences were eliminated. A total of 564 DEGs including 446 upregulated and 118 downregulated genes are displayed, as shown in the heat map (Figure 1(c)) and volcano map (Figure 1(d)), respectively. All DEGs can be found in the supplementary materials (Supplementary Table 1).
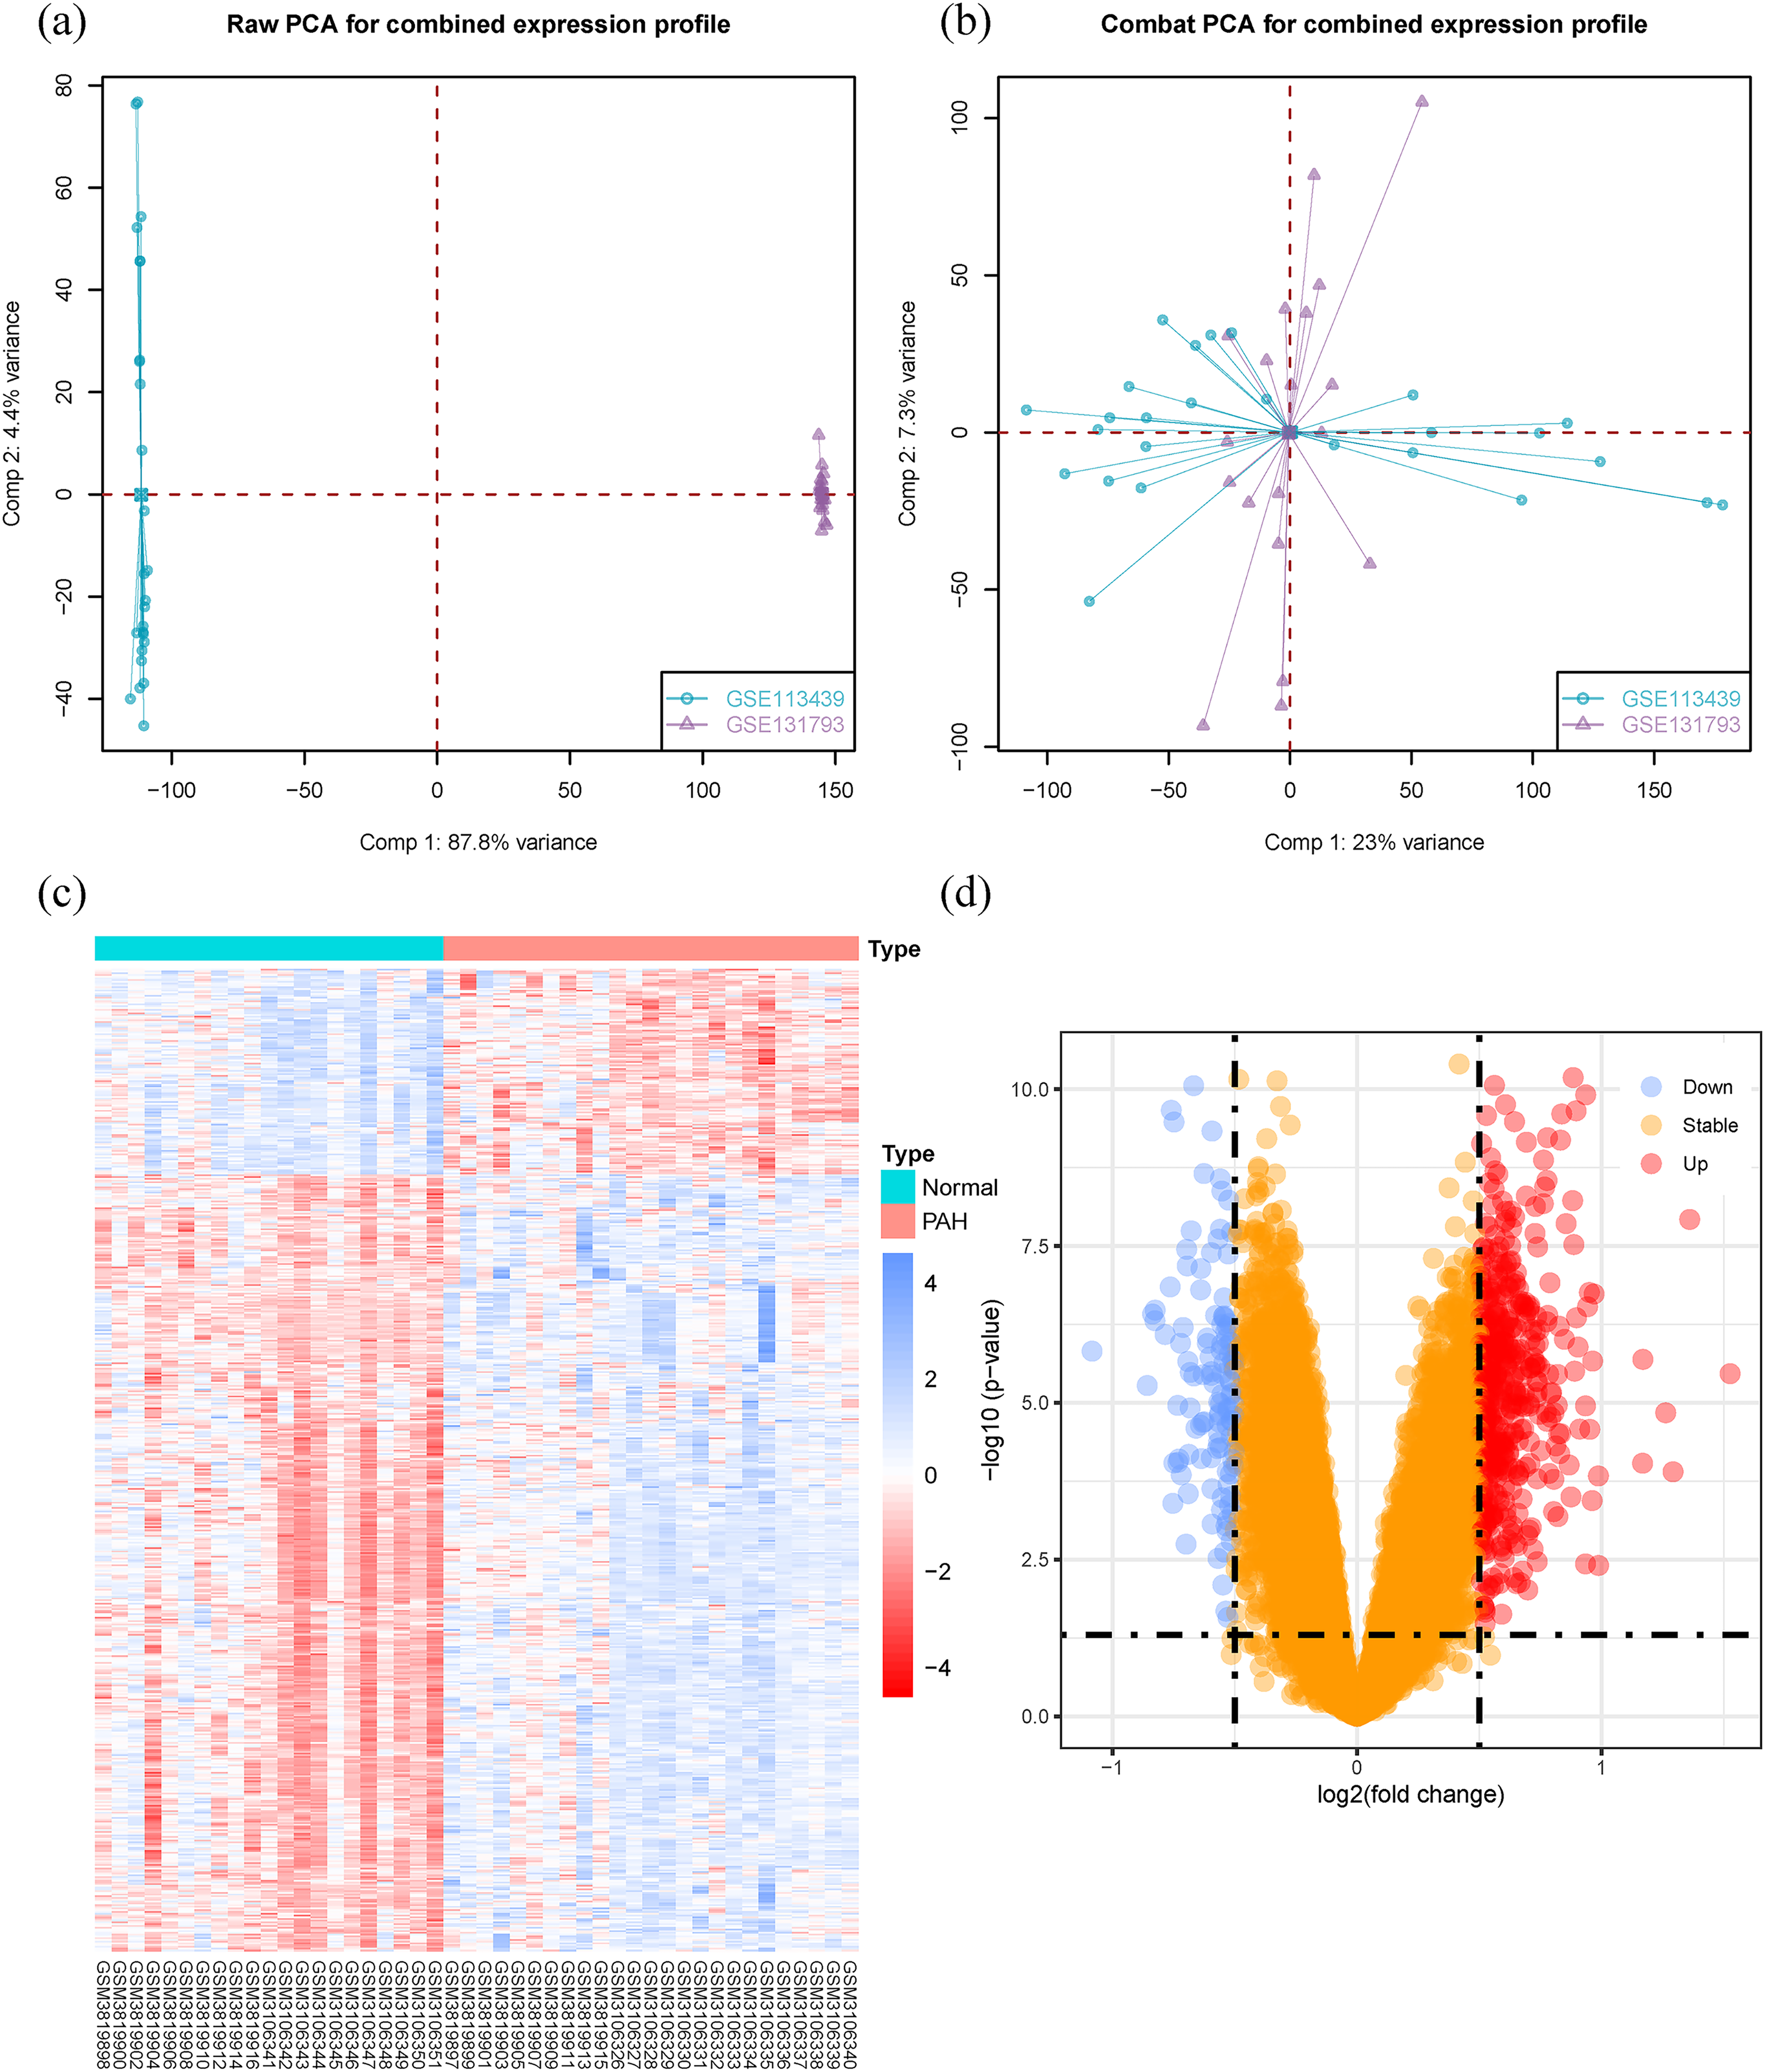
Differential genes and batch-to-batch differences. (a) PCA before correction. (b) PCA after correction. (c) Heat map showing the 564 most significant up- and downregulated genes. The two colors represent different trends; the darker the color, the more prominent the trend. (d) Volcano map showing the differential gene. Red and blue represent up- and downregulated genes, and orange represents no significant difference.
Functional enrichment analysis conclusion
We showed through the GO enrichment analysis that the genes show their differences mainly through enrichment of biological processes (BP) such as organelle fission, mitotic nuclear division, and neutrophil activation involved in immune response and neutrophil-mediated immunity. Enrichment of cell component (CC) can be seen through spindle, condensed chromosome, secretory granule lumen, cytoplasmic vesicle lumen, and vesicle lumen. In addition, cell adhesion molecule binding, ATPase activity, tubulin binding, protein serine/threonine kinase activity, and actin binding are the top five differential genes enriched in the molecular function (MF) section (Figure 2(a)). The enrichment analysis of DEGs for the disease group and the control showed that PAH may lead to disorders of the cardiovascular and respiratory systems. Diseases include various diseases such as hematopoietic system disease, arteriosclerotic cardiovascular disease, lung disease, atherosclerosis, arteriosclerosis, coronary artery disease, obstructive lung disease, hepatitis, lymphoblastic leukemia, and myocardial infarction (Figure 2(b)). The GSEA results showed that a NOD-like receptor signaling pathway and a Toll-like receptor signaling pathway are related to immunity and were significantly enriched in the gene set in the present study (Figure 2(c)). Interleukin 1 Beta (IL1B) and Toll-Like Receptor 4 (TLR4) are important genes for signal transduction in the pathway. The above findings obtained using GO, DO, and GSEA suggests a corresponding immune response mechanism in PAH.
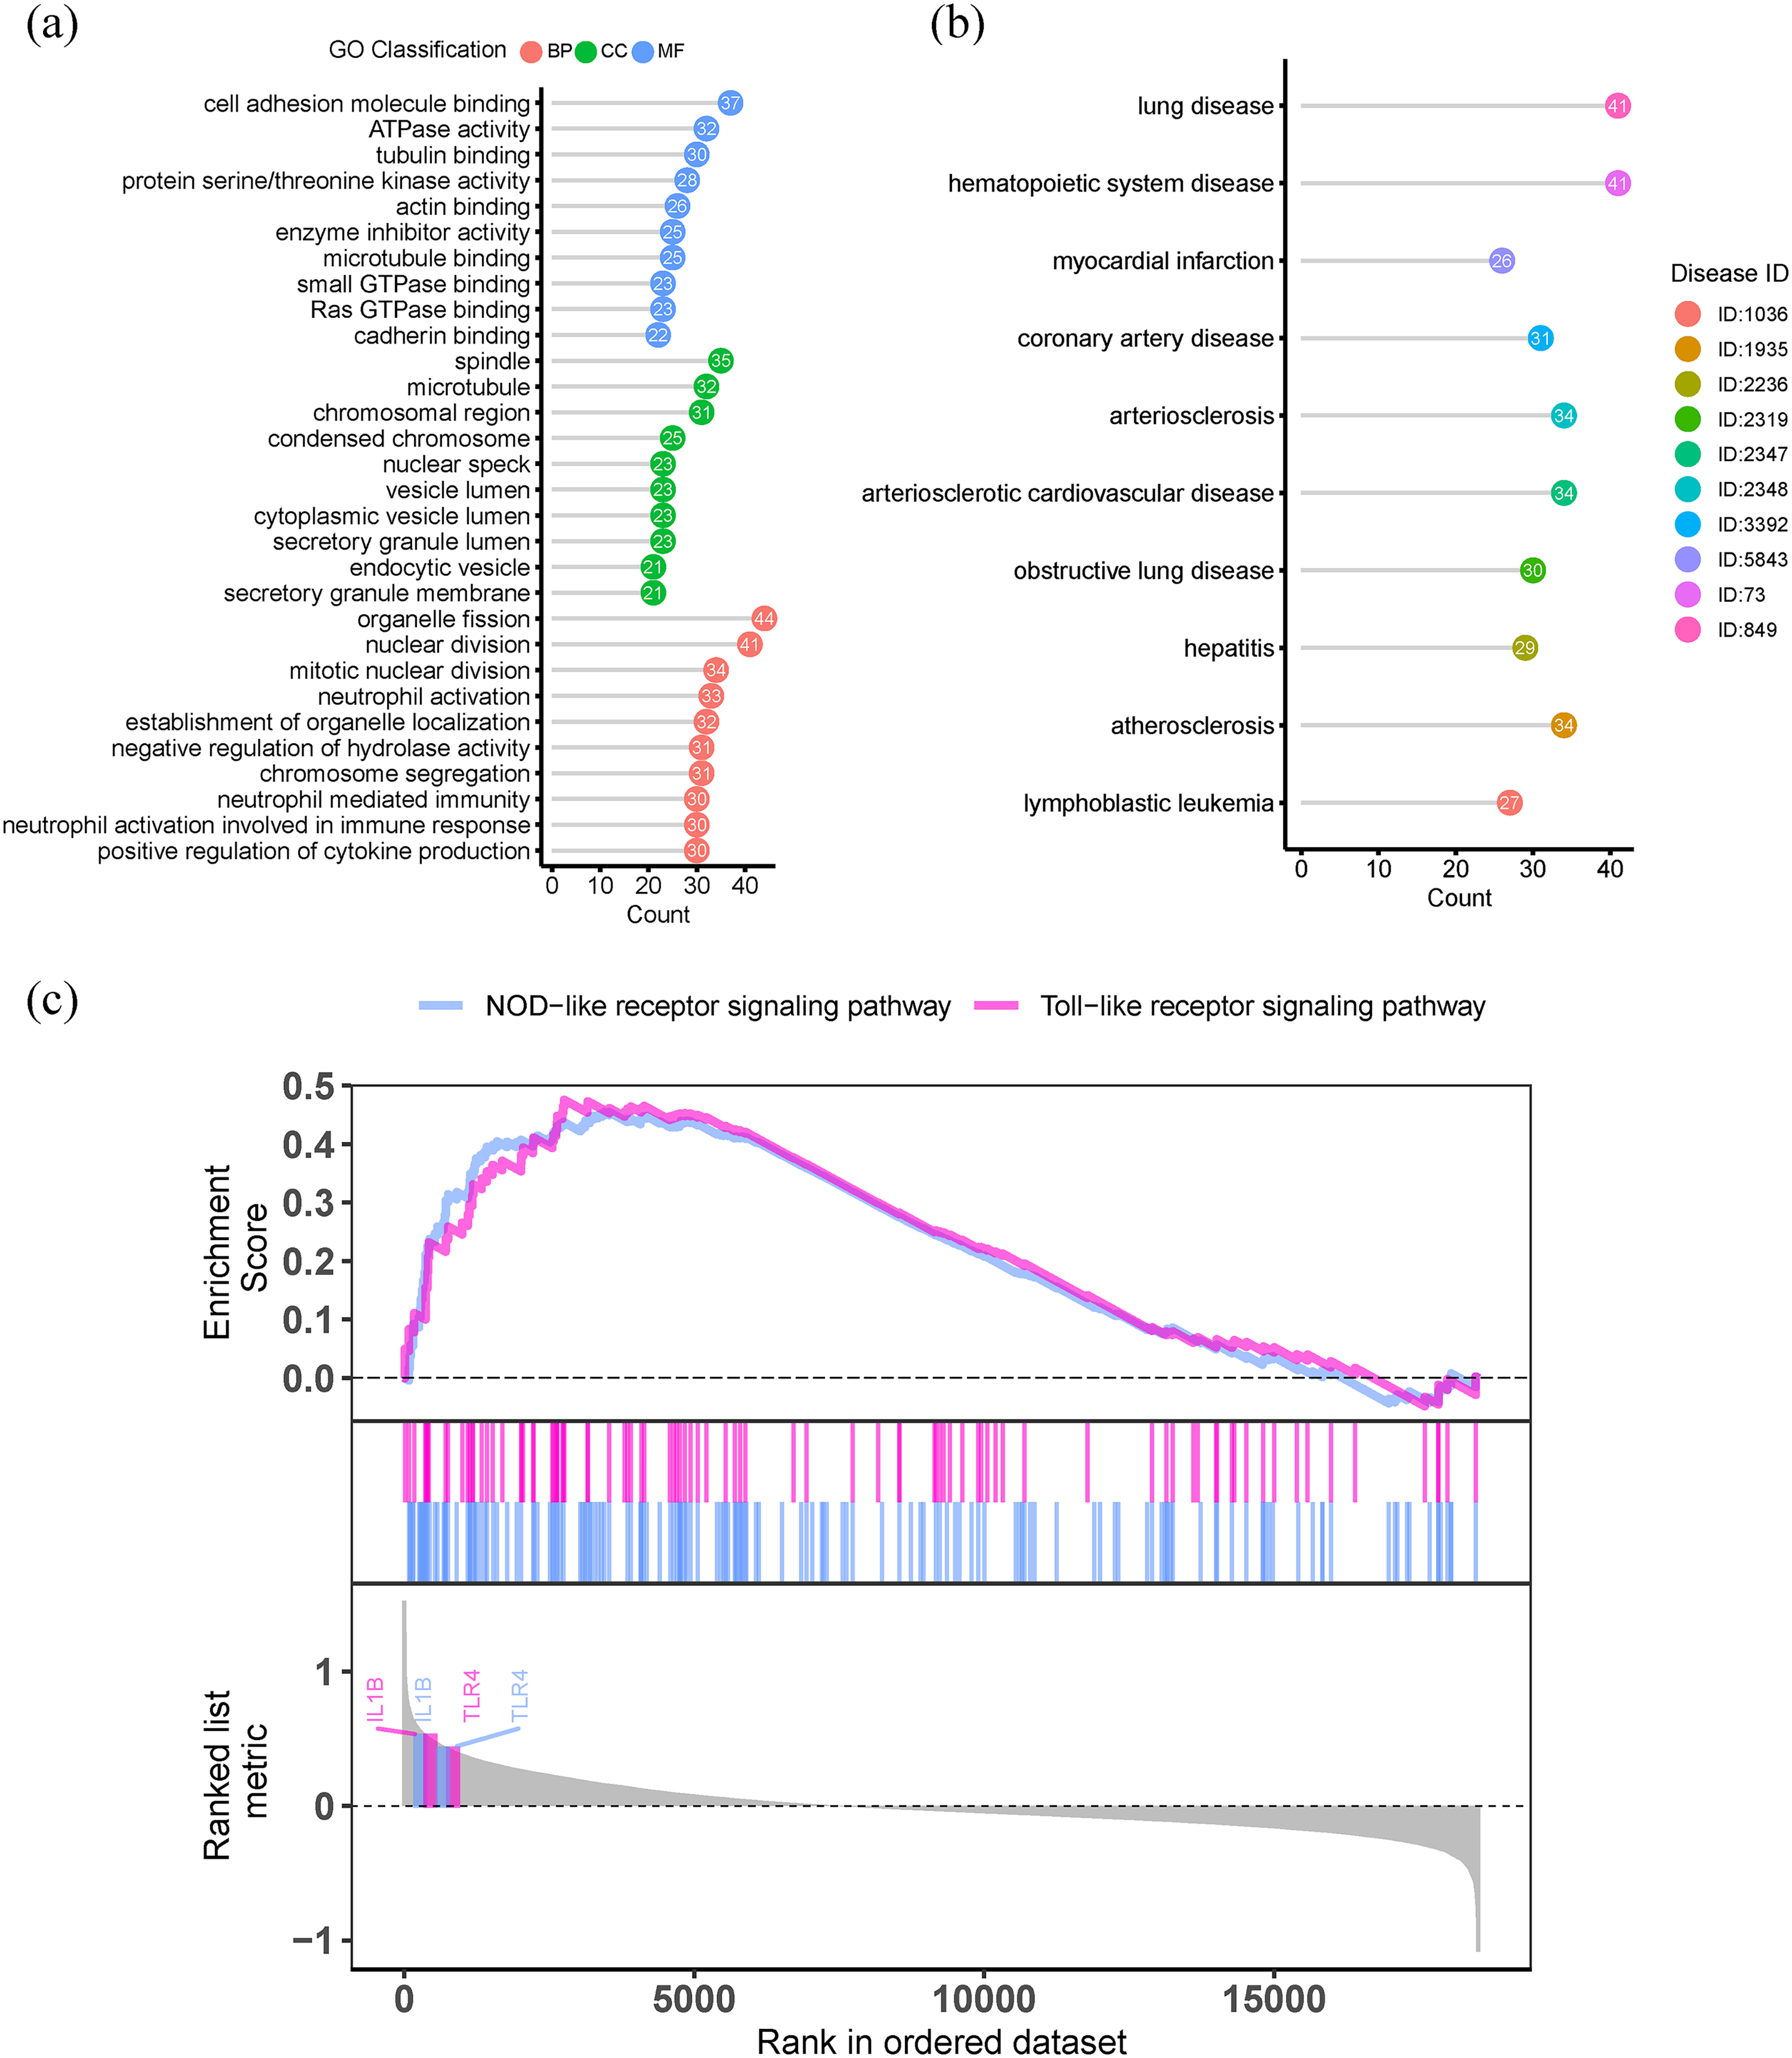
Results of enrichment analysis of differential genes. (a) Gene ontology (GO) enrichment analysis. (b) Disease ontology (DO) enrichment analysis. (c) Enrichment analysis results of GSEA (a NOD-like receptor signaling pathway and a Toll-like receptor signaling pathway).
Application of machine learning in the screening and verification of gene signs
The LASSO algorithm determines the variables by finding the lambda with the smallest classification error, and choosing the fewest variables helps to build a model with a high application value. Finally, the parameter selection was set to lambda.min to determine the optimal number of genes in the LASSO model, and 0.01421292 was determined to be the optimal lambda.min value. The gene AvgRank values determined by the SVM algorithm were 11.2, 12.8, 22.4, 26.6, 32.4, 33, and 34.8. Then, 5 × cross-validation randomly splits the data into 4 parts for model calculation, then uses the remaining 1 part for testing, and repeats for multiple rounds. It was found that LASSO and SVM algorithms in machine learning identified 9 and 7 characteristic genes from the 564 DEGs of patients with PAH and controls as the candidate gene signs of PAH (Figure 3(a), Figure 3(b)). A Venn diagram was drawn and to show that the crossover genes of the 2 were Caldesmon 1 (CALD1) and Solute Carrier Family 7 Member 11 (SLC7A11) (Figure 3(c)). Verifying the expression levels of these two characteristic genes through the verification dataset can further clarify the effectiveness of the verification. The violin chart shows that in GSE53408, the expression degrees of CALD1 and SLC7A11 in the PAH disease group were pointedly greater than those in the control group (P < 0.01) (Figure 3(d), Figure 3(e)).
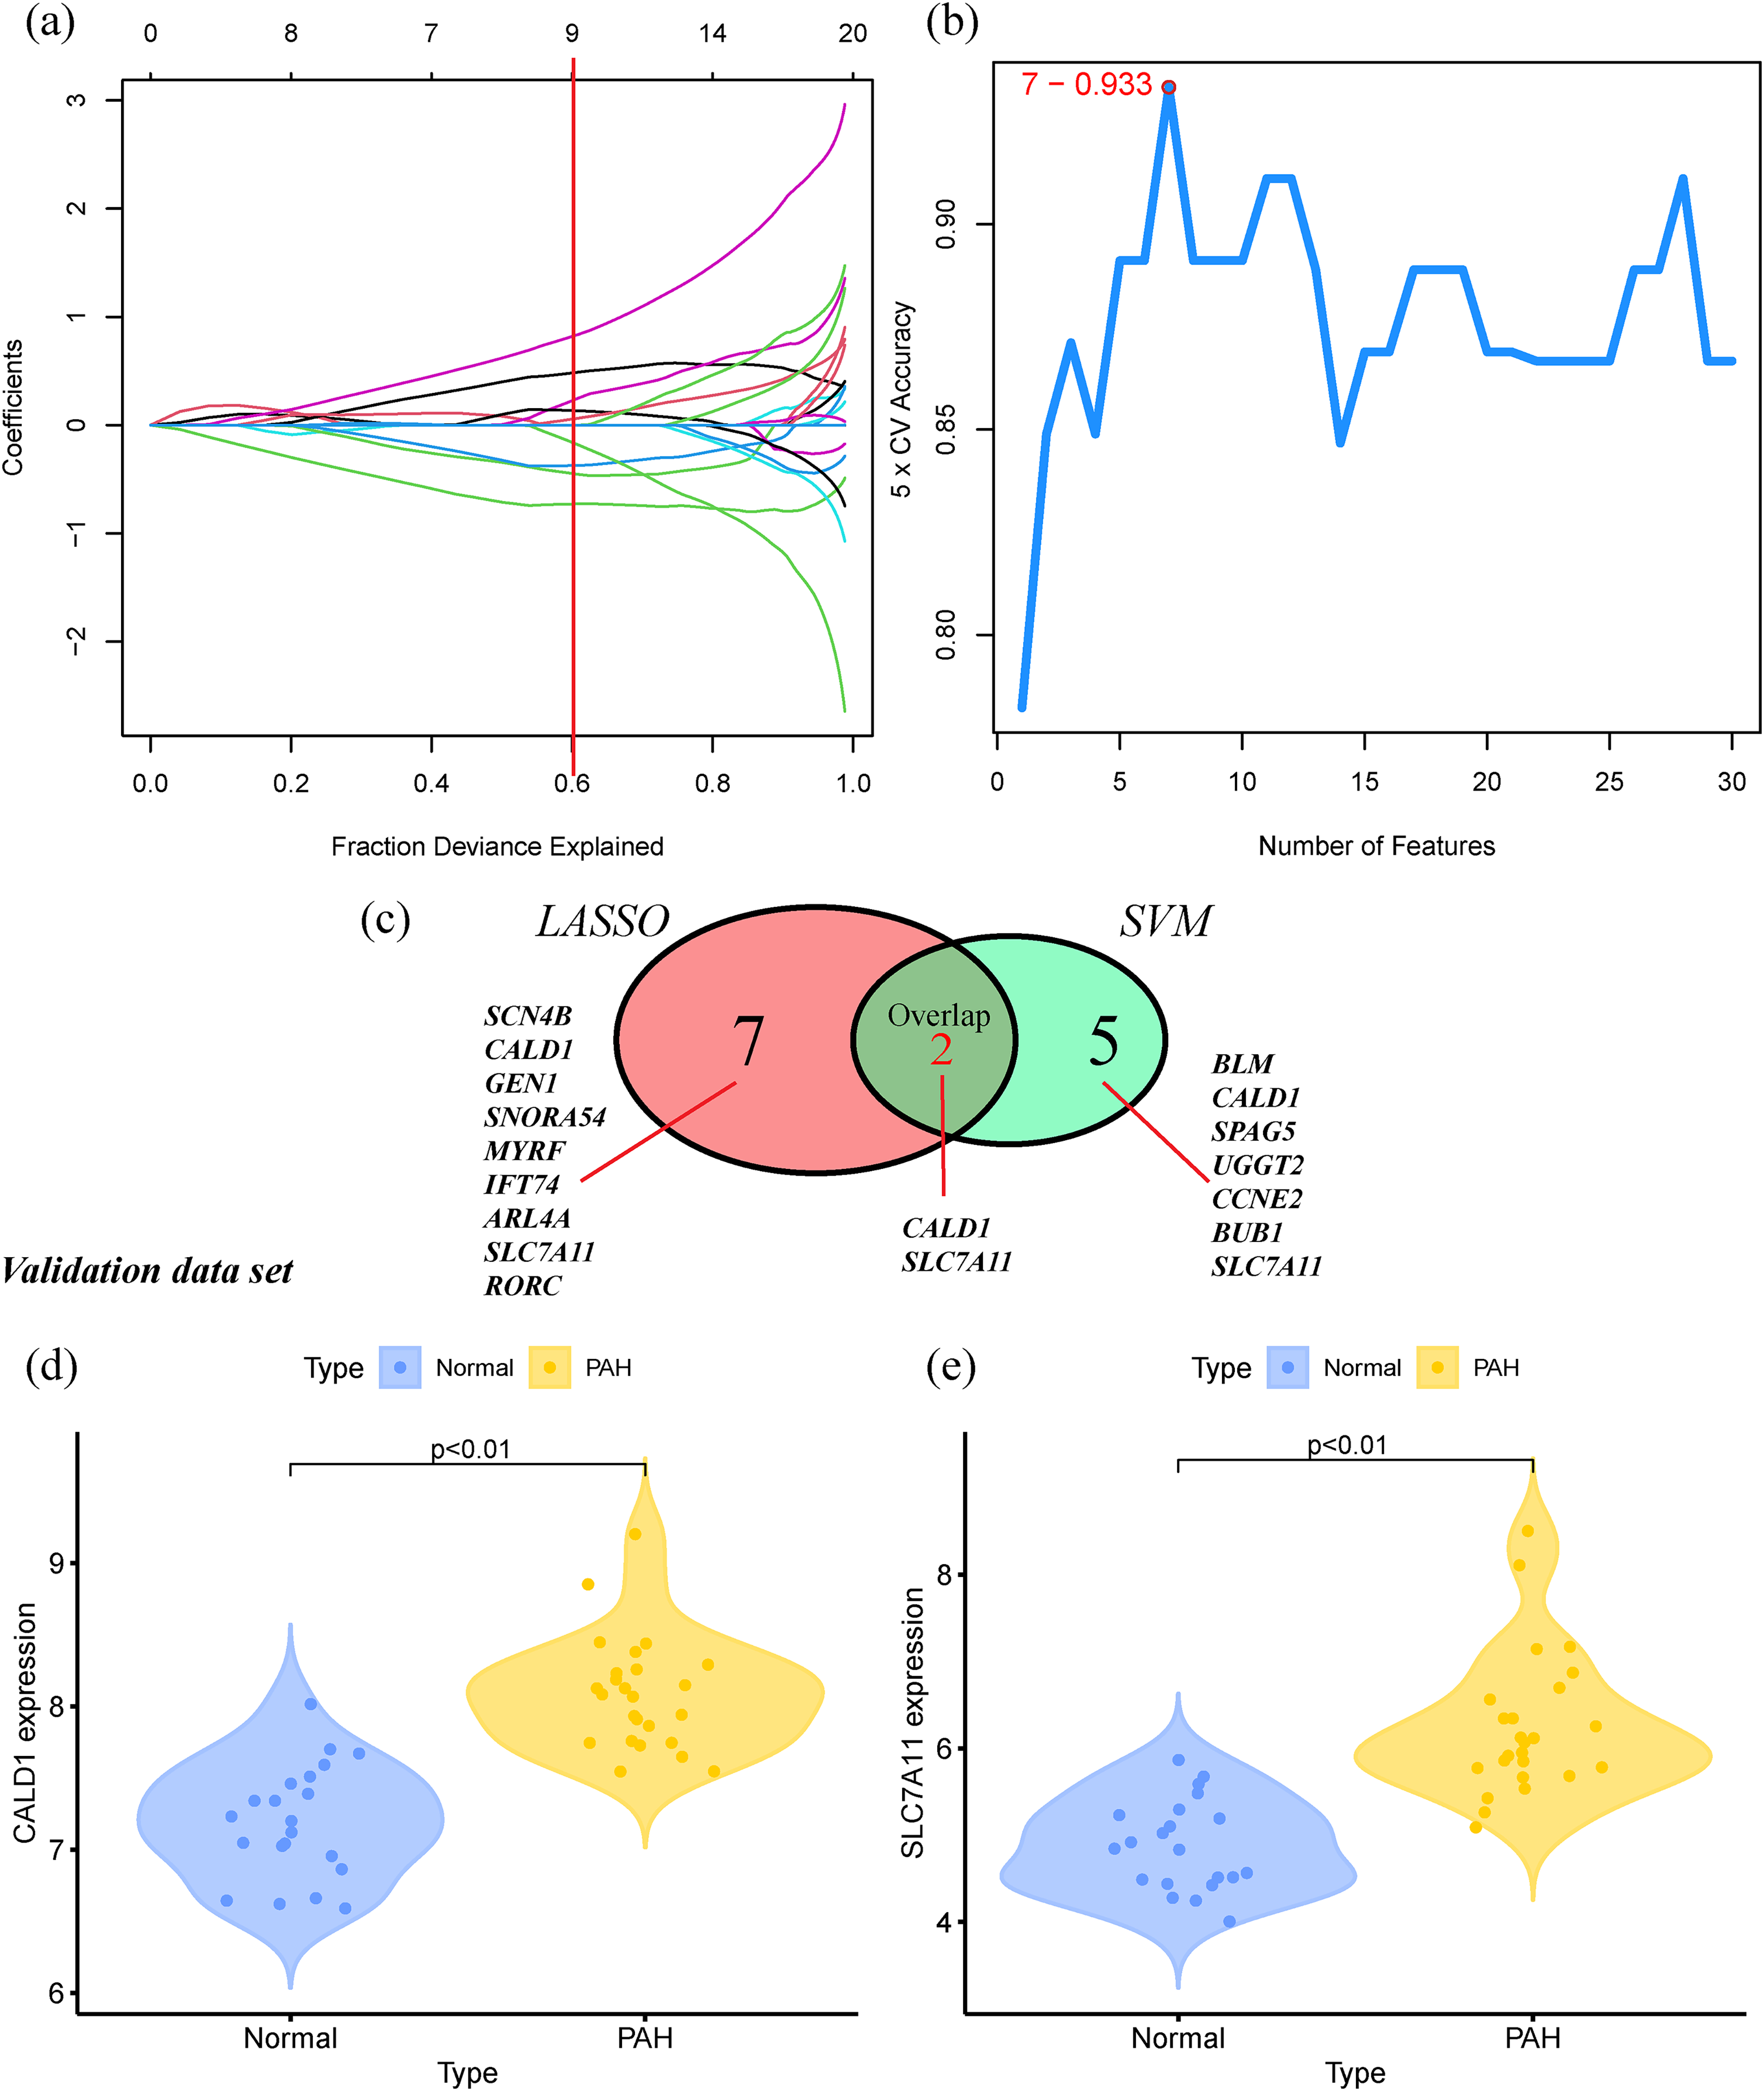
LASSO and SVM jointly screen and verify special diagnosis markers. (a) 9 characteristic genes are selected by the LASSO algorithm. (b) 7 characteristic genes are selected by the SVM algorithm. (c) Venn diagram showing crossover genes CALD1 and SLC7A11. (d) Expression levels of CALD1 in the verification dataset GSE53408. (e) Expression levels of SLC7A11 in the verification dataset GSE53408.
The receiver operating curve (ROC) to verify the diagnostic power
We used the ROC in the validation dataset to further verify the diagnostic efficacy of crossover genes CALD1 and SLC7A11. The specific AUC and 95% CI of the characteristic diagnostic genes CALD1 (AUC = 0.924) and SLC7A11 (AUC = 0.962) are shown in Figures (Figure 4). CALD1 and SLC7A11 achieved satisfactory results in the validation dataset. It shows that CALD1 and SLC7A11 have high potential application values.
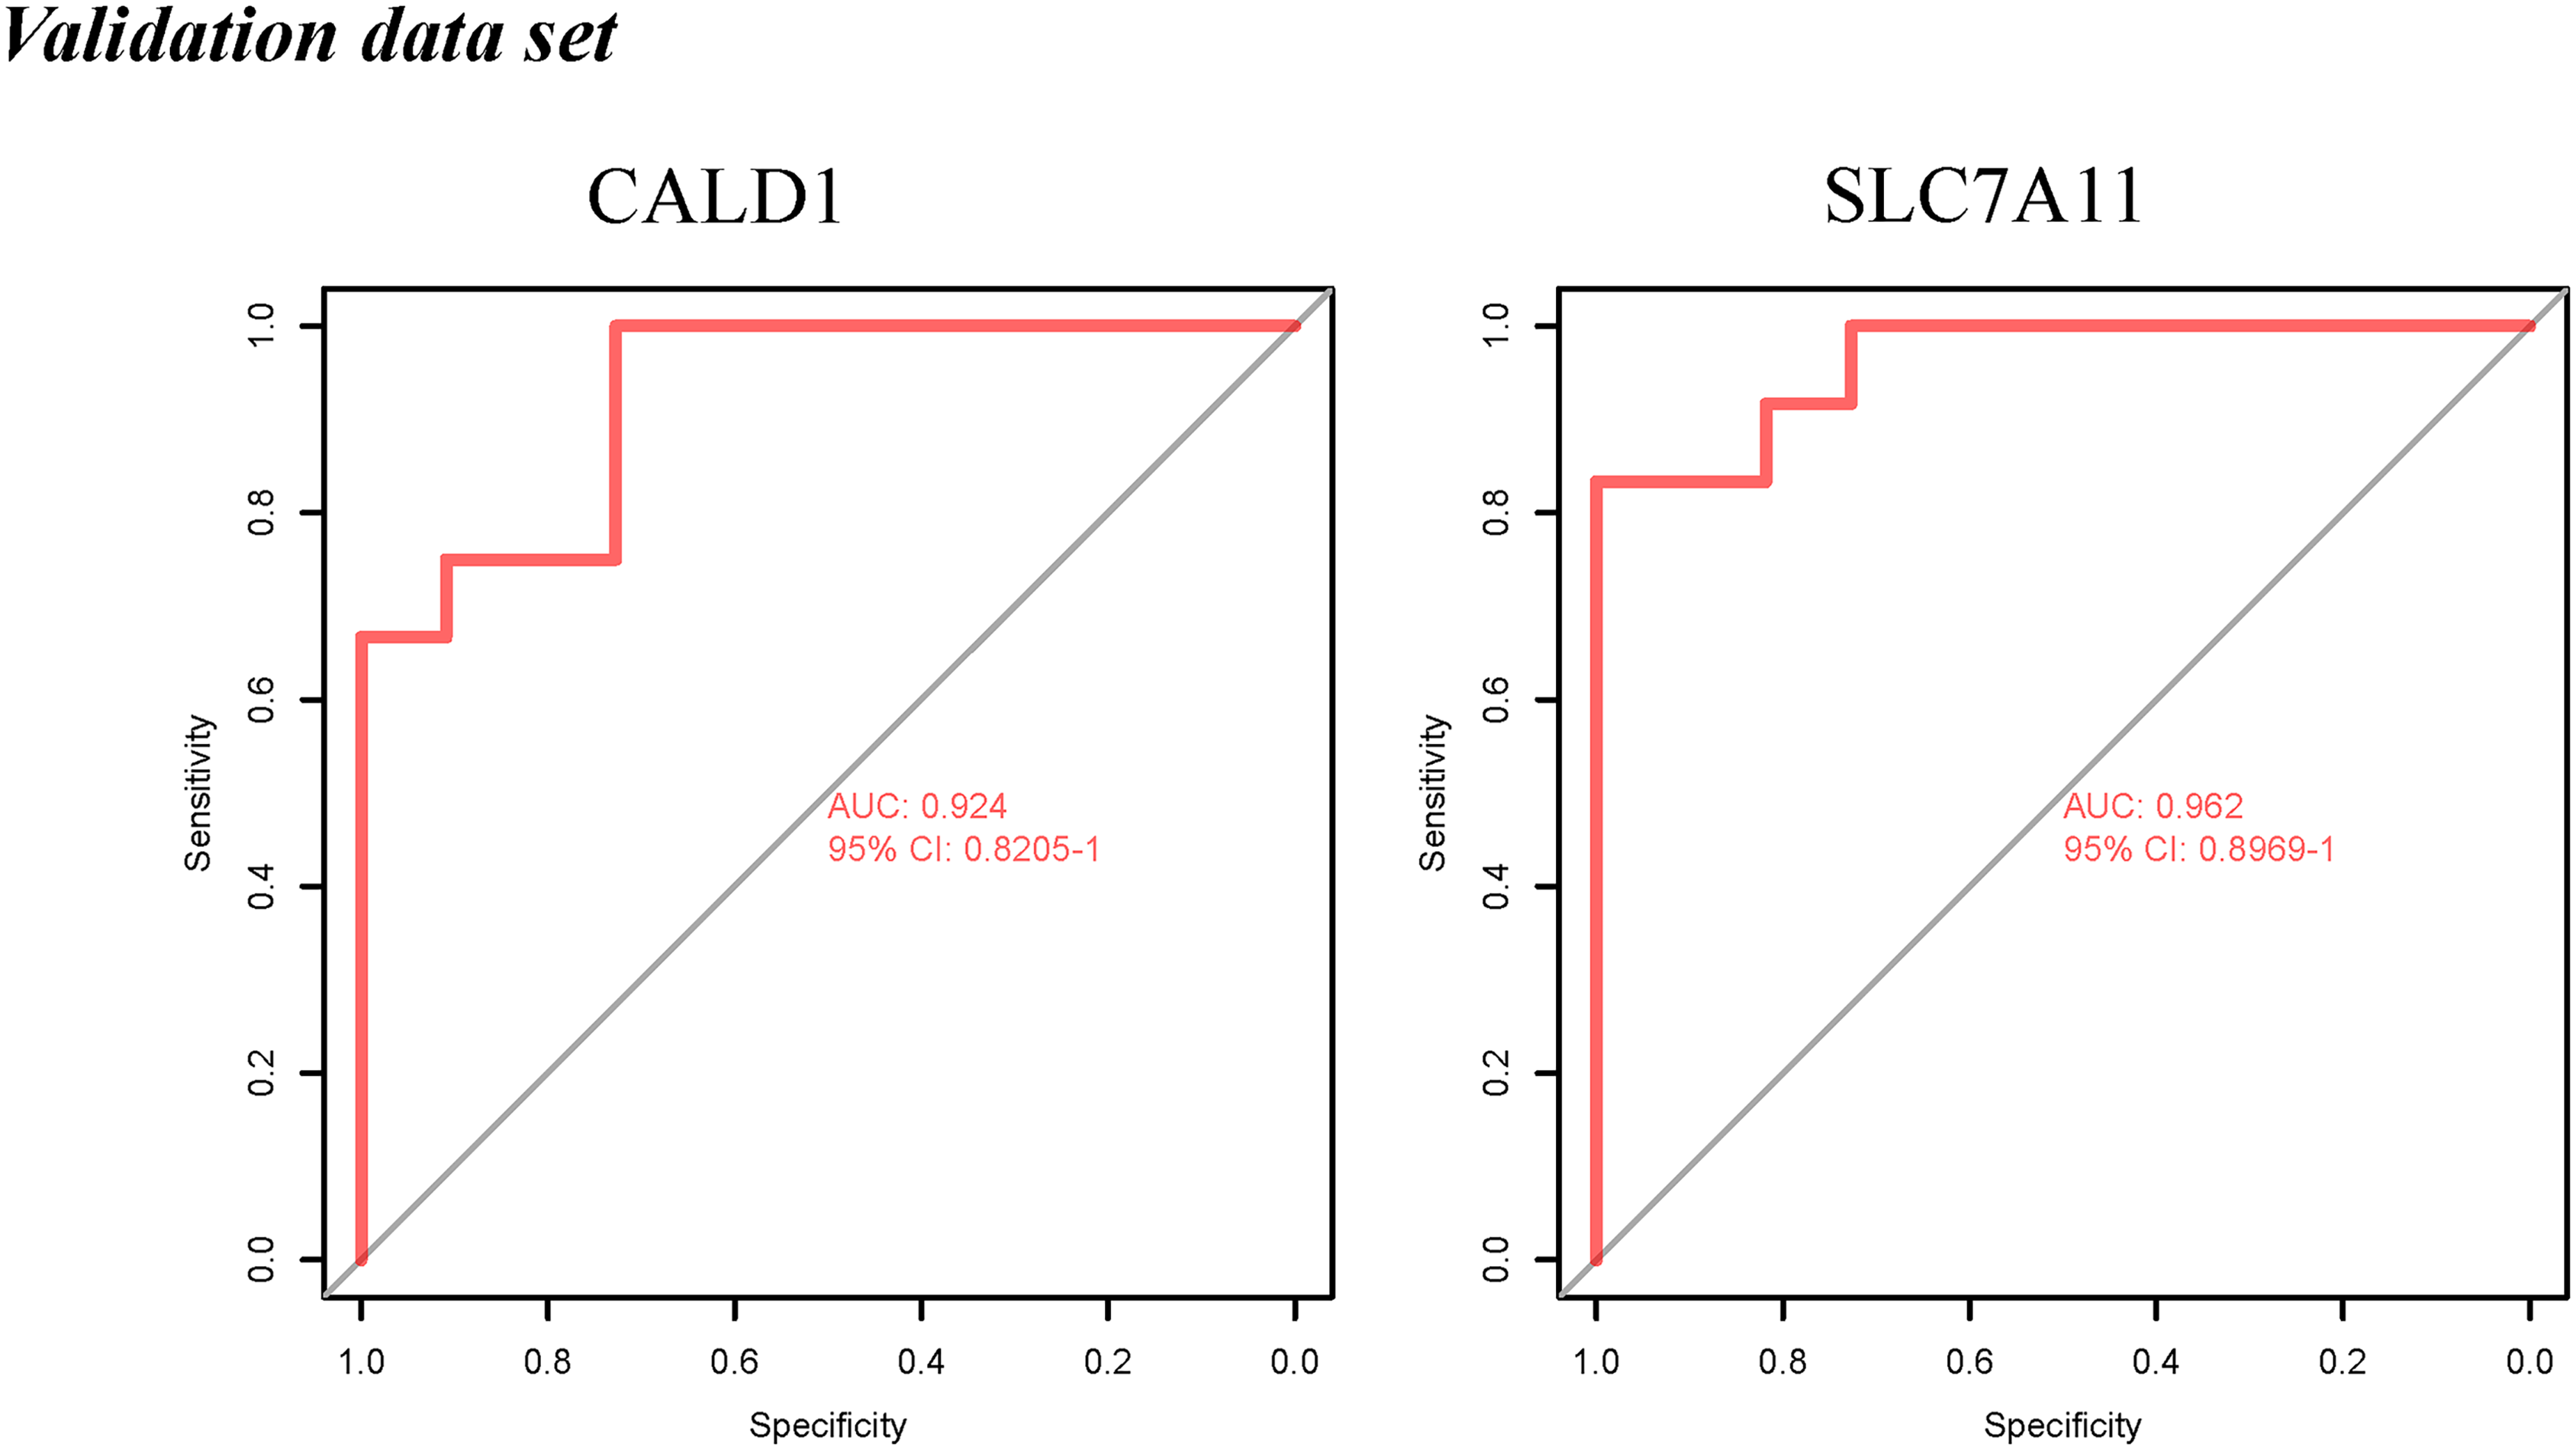
ROC curve and AUC, 95% CI value results of CALD1 and SLC7A11.
Immune cell subtype infiltration result
The two-dimensional PCA results on immune cell infiltration showed that the degree of immune cell infiltration differed between the PAH disease group and the control, and the two groups could be distinguished (Figure 5(a)). The bar graph showed the composition of immune cells in multiple samples (Figure 5(b)). After filtering out samples with P < 0.05 and excluding immune cell types with zero values, 19 immune cells were obtained to complete the comparison of PAH and normal controls. The difference between the same immune cells of the disease and control groups can also be shown in the violin chart. The expression of T CD8 cells was low in the PAH group (P < 0.01). Compared with the control, the PAH group shows high expression of monocytes, macrophages M0, and dendritic activated cells (P = 0.039, P = 0.049, P = 0.003). In contrast, T CD4 memory-activated cells showed less difference between the disease and control groups (P = 0.044) (Figure 5(c)).
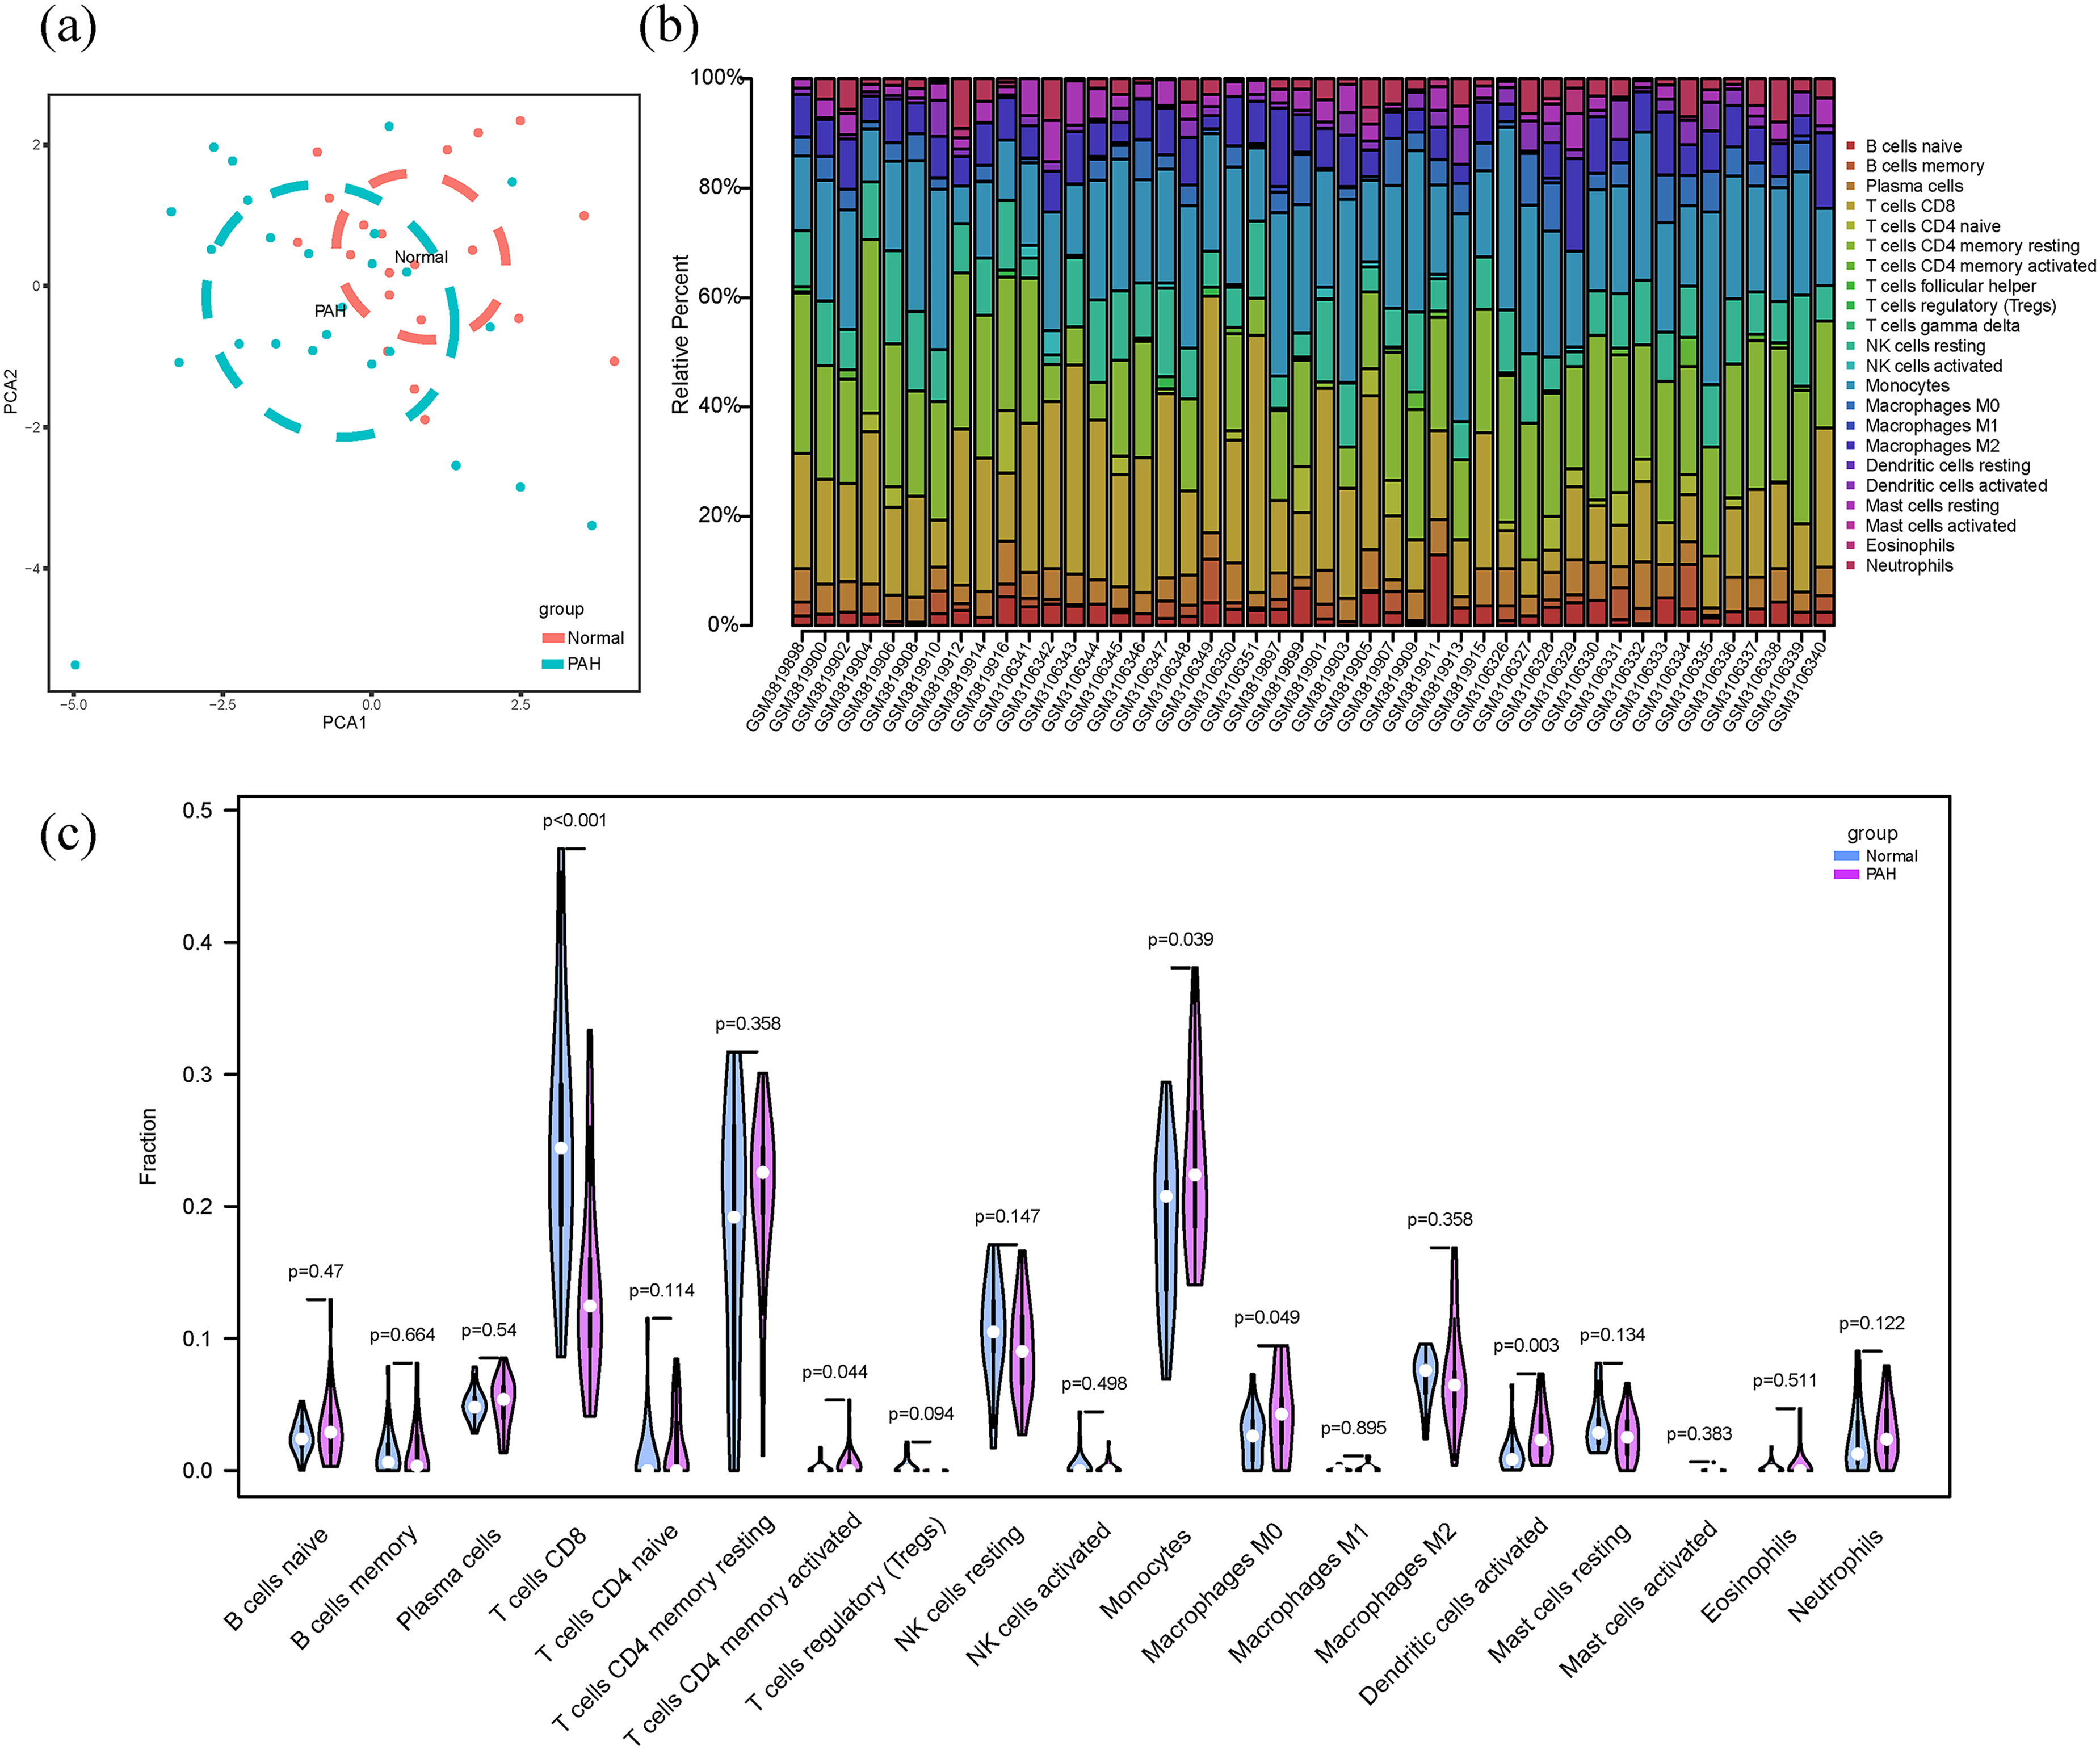
Graphical visualization of immune cell subtypes. (a) Two-dimensional PCA image of the degree of immune cell infiltration. Light blue (dots, circles) and pink (dots, circles) represent PAH and control samples, respectively. (b) Distribution of immune cells in the samples. (c) Violin chart of differences in immune cell subtypes between the groups after filtering. Blue and purple legends represent normal controls and disease samples, respectively.
Correlation analysis between gene signs and immune cell subtypes
Correlation analysis of the immune cell subtypes showed that CALD1 (r = 0.34, P = 0.02) and SLC7A11 (r = 0.39, P < 0.01) were positively correlated with T CD4 memory-resting cells. CALD1 (r = −0.52, P < 0.01) and SLC7A11 (r = −0.56, P < 0.01) were negatively correlated with T CD8 cells. A negative correlation exists between CALD1 and T regulatory cells (Tregs) (r = −0.31, P = 0.04) and between SLC7A11 and mast resting cells (r = −0.33, P = 0.03) (Figure 6(a), Figure 6(b)). In contrast, a positive correlation was observed between SLC7A11 and neutrophils (r = 0.40, P < 0.01) and between SLC7A11 dendritic activated cells (r = 0.40, P < 0.01).
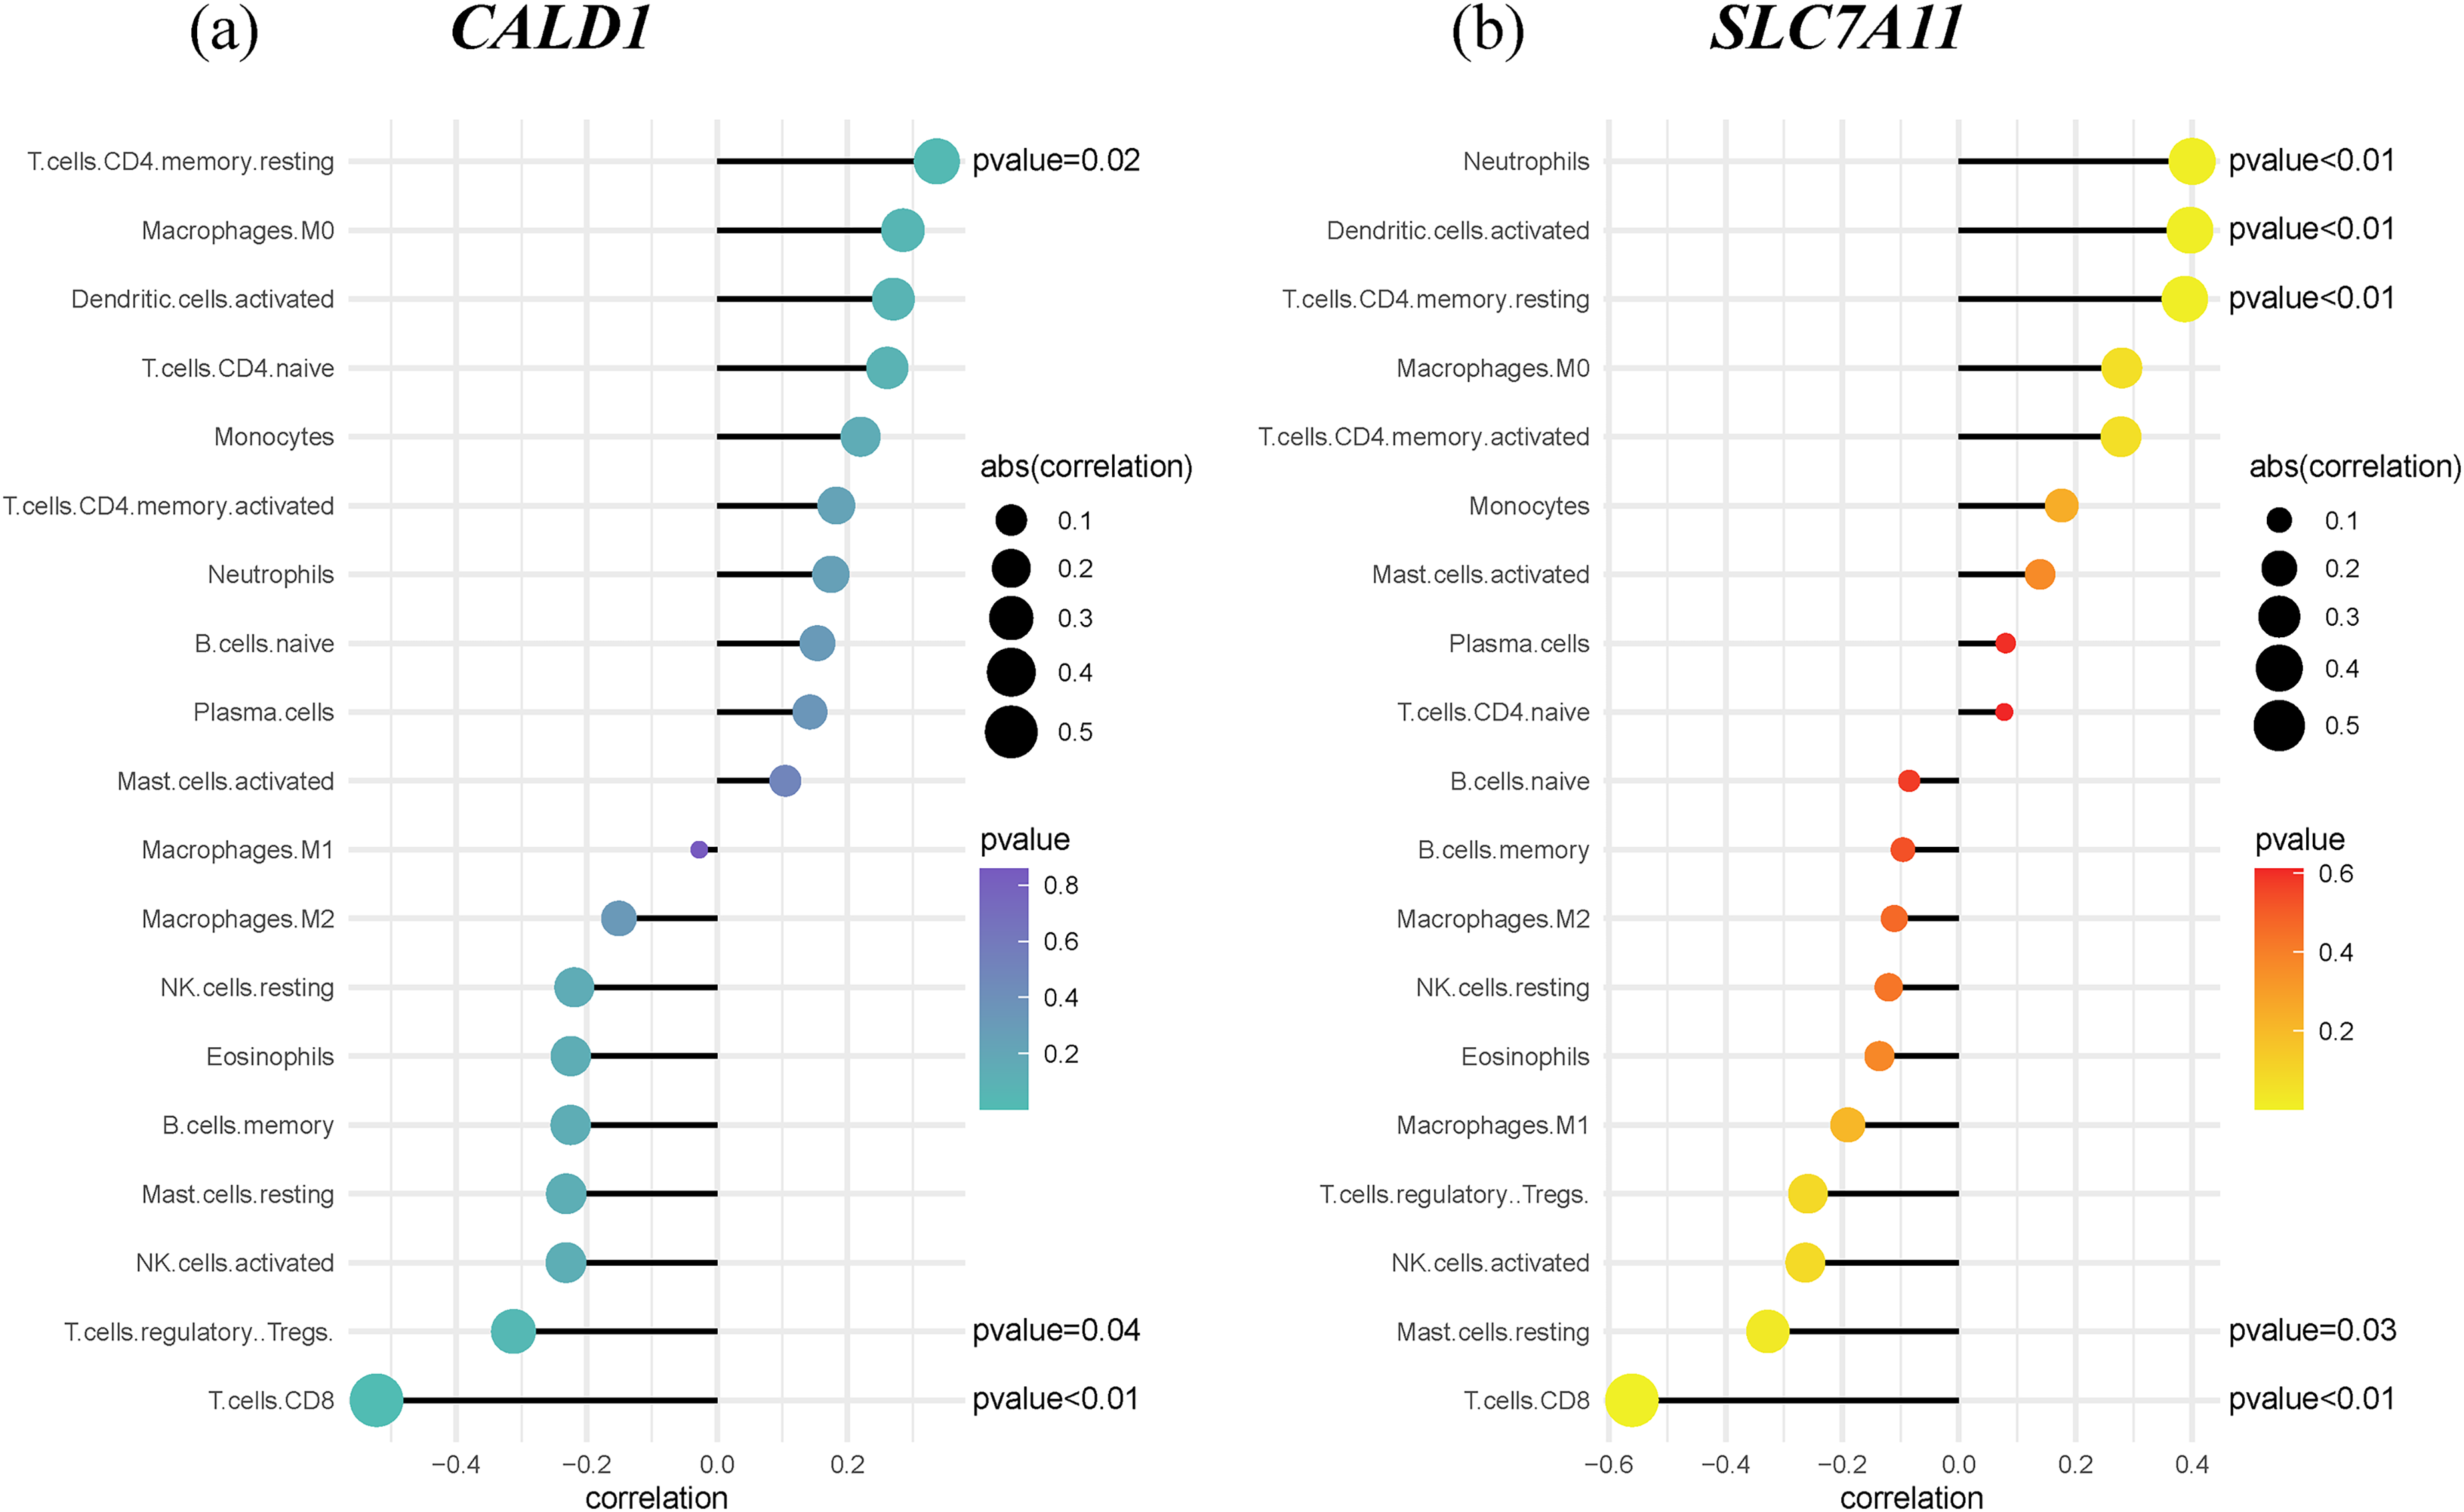
Infiltrating immune cell subtypes correlations. (a) CALD1 (b) SLC7A11.
Discussion
Cardiovascular diseases often begin to develop in the early stages of PAH, with serious consequences for the right side of the heart in its later stage. 18 PAH causes hemodynamic complications in a variety of cardiovascular diseases such as myocardial infarction. Therefore, PAH has been attracting increasing interest in recent years, because PAH has a poor prognosis. The electrocardiogram (ECG) can be used as a screening tool in patients with early stages of PAH. However, a normal ECG does not rule out the possibility of PAH. 19 Rapid development of bioinformatics in recent years has provided efficient solutions for the discovery and screening of potential diagnostic markers. We extensively use machine learning strategies to construct diagnostic evaluation models and screen novel gene signature signals worthy of study. Lasso algorithm and support vector machine strategy are the machine learning algorithms used in this study. In addition, studies of the immune cell composition of disease facilitate the analysis of potential immunotherapeutic avenues. Previous studies have shown that PAH is related to various types of immune cells.20,21 The tool-like CIBERSORT program has also greatly facilitated the analysis of immune cell infiltration patterns in various diseases. 22 The goal of the present study is to find PAH-specific early immune gene signals and PAH immune cell infiltration patterns that can improve the prognosis of patients, and provide new ideas for immune-related therapeutic approaches to the disease.
From the PAH expression profile obtained from the public database GEO, 564 DEGs were identified after differential analysis. GO enrichment analysis has shown the occurrence of an immune response, neutrophil-mediated immunity, a secretory granule lumen, a cytoplasmic vesicle lumen, a vesicle lumen, cell adhesion molecule binding, and other such factors. DO enrichment analysis more clearly shows the occurrence of cardiovascular diseases and inflammation-related diseases, including atherosclerosis, arteriosclerotic cardiovascular disease, coronary artery disease, arteriosclerosis, obstructive lung disease, hepatitis, and myocardial infarction. It further shows that PAH is related to the immune response mechanism. GSEA mainly involves immune-related pathways such as NOD-like and Toll-like receptor signaling pathways. Xiao, Daniela, and Wang have shown that inflammation and immune pathways such as NOD-like and Toll-like receptor signaling pathways play a causal role in the pathogenesis of pulmonary vascular remodeling and PAH.23–25 Hence, the data we analyzed has potential significance. The LASSO is a regression-based machine learning method that actively selects from a large number of potential multicollinear variables. We used it to find the smallest error by classifying the gene and the variable by looking for parameter lambda.26,27 SVM is another machine learning algorithm with inherent characteristics and is mostly used for classification and other learning activities.28,29 Diagnostic gene signs CALD1 and SLC7A11 were identified and selected by two algorithm features. Application of additional verification datasets showed that two algorithms afford excellent diagnostic efficiency. The CALD1 gene encodes an actin-binding protein, which acts on pathways such as those related to cardiac conduction, muscle relaxation, and contraction. The contents of α-actin and γ-actin increase in neonatal persistent pulmonary hypertension. 30 The middle vascular remodeling process in PAH also involves the accumulation of smooth muscle actin (SMA). 31 The information obtained from the integration of existing bioinformatics algorithms suggests that cytoskeletal proteins (such as CALD1) may play a key role in vascular remodeling and proliferation induced by PAH. 32 Jamie et al. found that the activity of CALD1 is closely related to the regulation of smooth muscle cell contraction in the pathogenesis of PAH. 33 Therefore, it is reasonable to consider that CALD1-encoded actin participates in the pathophysiological process of PAH. The SLC7A11 gene is a member of the solute carrier group, which encodes a heteromer of cysteine and glutamic acid. Clinical studies have shown that the level of cysteine-rich 61 (Cyr61) in the plasma of patients with PAH is considerably higher than that in the control group. 34 Legumain is a cysteine protease. Clinically, the level of serum legumain is closely related to the severity of idiopathic PAH. In experiments using mice, it has been confirmed that legumain-specific inhibitors can greatly improve the condition of patients with PAH. 35 Glutamine is synthesized from the enzyme glutamine synthetase from glutamate and ammonia, and excessive shunting of glutamine can lead to PAH. 36 Other studies have shown that the activation of glutamate receptors can promote PAH and vascular remodeling. 37 Therefore, on the basis of the close relationship between SLC7A11 and cysteine and glutamate, we proposed that SLC7A11 is involved in the development of PAH. CALD1 and SLC7A11 are indirectly associated with PAH; however, a large number of clinical studies are still needed to prove the reliability of the diagnostic value of CALD1 and SLC7A11. The application of the convolution tool CIBERSORT showed that PAH is closely related to CD8 + cytotoxic T cells, monocytes, macrophages M0, dendritic activated cells, and T CD4 memory-activated cells. We found that the expression of abnormal inflammation-related CD8 cells is upregulated in patients with PAH, 38 and perivascular macrophages related to lung inflammation are the key pathogenic driver of PAH. 39 At the same time, we also noted that the number of nonclassical monocytes in both human and murine PAH samples greatly increased. 40 Dendritic cells occur around the tertiary lymphatic organs (TLO) near the pulmonary blood vessels in idiopathic PAH, and hence, they play a role in idiopathic PAH.41,42 In the correlation between genes and immune cells, we believe that CALD1 will increase the number of T CD4 memory-resting cells and decrease that of T CD8 cells and T regulatory cells (Tregs). In contrast, SLC7A11 decreases the expression of CD8 + T cells and mast resting cells and increases that of neutrophils, dendritic activated cells, and T CD4 memory-resting cells. The process of vascular remodeling in the pathophysiological mechanism of PAH includes a large number of inflammatory cell changes and immune dysregulation. CALD1 is associated with T cells, while SLC7A11 is associated with inflammatory cells such as T cells, neutrophils, and mast cells. In the future, CALD1 and SLC7A11 may participate in the pathophysiological process of PAH through the action of these inflammation and immune cells, and become possible new targets for immune-related therapy.
However, our research has certain limitations as well. Our work is not based on a multicenter large sample. The data obtained may deviate from that obtained for the abnormal interaction of the cells. In addition, although our analysis results are consistent with those of previous studies, in vivo and in vitro experimental verification is still needed.
Conclusions
The Lasso algorithm and the support vector machine strategy considered CALD1 and SLC7A11 to be the genetic markers of PAH. These gene signs may play a decisive role in the pathological mechanism of PAH and may have effects on immune-related therapies in the future.
Supplemental Material
sj-docx-1-scm-10.1177_00369330221132158 - Supplemental material for Lasso algorithm and support vector machine strategy to screen pulmonary arterial hypertension gene diagnostic markers
Supplemental material, sj-docx-1-scm-10.1177_00369330221132158 for Lasso algorithm and support vector machine strategy to screen pulmonary arterial hypertension gene diagnostic markers by Chenyang Jiang and Weidong Jiang in Scottish Medical Journal
Supplemental Material
sj-docx-2-scm-10.1177_00369330221132158 - Supplemental material for Lasso algorithm and support vector machine strategy to screen pulmonary arterial hypertension gene diagnostic markers
Supplemental material, sj-docx-2-scm-10.1177_00369330221132158 for Lasso algorithm and support vector machine strategy to screen pulmonary arterial hypertension gene diagnostic markers by Chenyang Jiang and Weidong Jiang in Scottish Medical Journal
Footnotes
Acknowledgements
We acknowledge GEO database for providing their platforms and contributors for uploading their meaningful datasets.
Data availability
Declaration of Conflicting Interests
The author(s) declared no potential conflicts of interest with respect to the research, authorship, and/or publication of this article.
Funding
The author(s) received no financial support for the research, authorship, and/or publication of this article.
Supplemental Material
References
Supplementary Material
Please find the following supplemental material available below.
For Open Access articles published under a Creative Commons License, all supplemental material carries the same license as the article it is associated with.
For non-Open Access articles published, all supplemental material carries a non-exclusive license, and permission requests for re-use of supplemental material or any part of supplemental material shall be sent directly to the copyright owner as specified in the copyright notice associated with the article.