






Abstract
In this study, we develop a methodology to estimate the effectiveness of ramp metering in reducing CO2 emissions. Ramp metering is one of several Intelligent Transportation Systems (ITS) applications to control traffic flow. In this paper in order to estimate the reduced emissions, we followed the procedure supported by the United Nations Framework Convention on Climate Change (UN-FCCC). And ramp metering causes some drivers to change their routes and affects CO2 emissions on the ramp and on the main lane. With these issues in mind, we performed Stated Preference analysis to determine the degree of driver preference for individual traffic situations.The Traffic Software Integrated System (TSIS) simulation program was used to verify the CO2 measurement model. The TSIS simulation showed that the reduction in CO2 emissions was 818.4 kg/h and that the decrease in the effectiveness was 7.3%. It also revealed that ramp metering reduced the CO2. emissions to 3,273.6kg emissions per day and 1,194.9 ton per year. In conclusion we found that ramp metering is effective in reducing CO2 emissions.
Keywords
1. Introduction
Transportation is a major source of greenhouse gas (GHG) emissions related to potential global climate change. 1 To prevent global warming, the Clean Development Mechanism (CDM) was established under the Kyoto Protocol. The CDM is a funding arrangement between countries that allows a developed country (Annex I country in the Kyoto Protocol) to obtain Certified Emission Reduction credits for GHG reductions by implementing projects to help ameliorate global warming in developing countries. 2 Worldwide, the transportation sector is responsible for about 20% of total GHG emissions. Road transport (vehicle emissions) accounts for 80% of the emissions. Although GHG reduction efforts are clearly needed in the transportation sector, there have been very few applications of the CDM (2% of United Nations (UN) projects) in the sector. 3 The lack of application of the CDM to transportation can be attributed to fact that the GHG emissions are the result of human activity and that changing usage patterns is difficult when people depend heavily on road transport. It is difficult to devise CDM methodology. Ramp metering—defined as a method by which traffic seeking to gain access to a busy highway is controlled at the access point via traffic signals—is one of several Intelligent Transportation System (ITS) technologies designed to manage traffic flow. Other ITS technologies include state-of-the-art wireless, electronic, and automated technologies. When an ITS is applied to highway and transit system management and vehicle design, it can reduce fuel consumption and emissions. In ramp metering, a ramp metering rate is computed at each ramp, based on traffic conditions on the adjacent highway section. The goal of ramp metering is to safely space vehicles merging onto the highway, while minimizing speed disruptions to the existing flows of traffic. In this study, we develop a methodology to estimate the effectiveness of ramp metering in reducing CO2 emissions.
2. Literature review
2.1. Baseline methodology
The United Nations Framework Convention on Climate Change (UNFCCC) provides baseline methodology for Bus Rapid Transit (BRT) projects. The BRT system has an effect on reduction of GHG emissions because of improved fuel-use efficiency through new and larger buses, load increase, and mode switching due to the availability of a more efficient and attractive public transport system. Baseline emissions determine emissions per passenger transported per vehicle category. The baseline emission factor (EF) focuses on potential changes in trip distance and type of fuel used by passenger. Leakage emission addresses upstream emissions due to construction, reduced life-span, and life-cycle effect of reduced fuel usage, change of load factor of the baseline transport system, reduced congestion in remaining road, and rebound effect. 3
UNFCCC (2009) provides baseline methodology for Mass Rapid Transit (MRT) projects. Baseline emissions include the emissions that happen due to the transportation of the passengers. Baseline emissions are calculated per passenger surveyed. Leakage emissions addresses emissions due to changes of the load factor of taxis and buses of the baseline transport system, reduced congestion on affected roads, and a rebound effect. 3
2.2. Emission factor
Shaheen and Lipman 4 suggested that automotive and fuel technologies, ITS, and mobility management strategies have the potential to reduce energy use and CO2 emissions. ITS technologies include traffic signal control, ramp metering, automated speed enforcement, electronic toll collection, traveler information, BRT, weigh-in motion technologies, and vehicle control technologies. Simulations of automated highways indicate reduction in fuel consumption.
Gonçalves and Farias 5 present the methodology, experimental equipment adopted, and the main results obtained of on-road measurements of small light-duty gasoline fuel cars. The low repeatability was addressed by conducting sets of standard tests representative of typical driving situations, namely stop and go (with two different distances), acceleration (0–70 and 0–120 km/h), cruise (70 and 120 km/h), deceleration (70–0 and 120–0 km/h), and speed changes (70–35–70 km/h and 120–60–120 km/h). The tests were repeated several times in order to obtain statistical validity. The results are presented in grams/second for continuous situations (e.g. cruise) for pollutant mission and fuel consumption and in grams/event for all other situations.
2.3. Stated-preference model
Stated-preference (SP) choice experiments are used extensively in economics and public policy. 6 In the transportation sector, SP was used in mode choice and route choice models. Wardman et al. 7 use a SP approach to undertake a detailed assessment of the effect on drivers’ route choice of information provided by variable message signs (VMSs). Shinghala and Fowkes 8 presented empirical results of determinants of mode choice for freight services in India. Mahmassani et al. 9 examined behavioral responses of non-commuters under real-time information during shopping trips, utilizing results from an interactive SP internet-based survey.
In this study, we performed SP analysis to determine the degree of driver preference for individual traffic situations when ramp metering was in operation.
3. Methodology to estimate the reduced emissions
To estimate the reduced emissions, we followed the procedure supported by the UNFCCC. The methodology comprises three components: baseline emissions, project emissions, and leakage emissions.
It assumes the following:
the traffic congestion area during peak hours is used as the baseline of the research area;
a detour route exists at the red light, and the detour route is not congested (smooth traffic flow);
by operating ramp metering, some drivers will use the detour route.
The CO2 emissions of each vehicle were based on vehicle category and fuel type, a protocol supported by the National Institute of Environmental Research (NIER) in Korea. 10 The ramp metering responds to the velocity of the traffic and traffic change in the research area. The EF was then applied, and the final CO2 amount was estimated. Table 1 presents the proposed model for the EF.
Equation for CO2 emission factor.

3.1. Baseline emissions
Baseline emissions include CO2 emissions that would have occurred if all the vehicles had used the project highway (i.e. if ramp metering had not been implemented). The baseline is dependent on traffic flow and the vehicles’ EF, which is based on the vehicle velocity, category, and fuel type. Therefore, the total amount of CO2 emissions is in inverse proportion to traffic flow and velocity.
Total CO2 emissions in the baseline in the research area were calculated by estimating the CO2 emissions for the total links and the CO2 emissions for on-ramp and off-ramp vehicles. The CO2 emissions of each link were based on the rate of each vehicle category, fuel type, and year of model. The traffic at each link was calculated by taking into account the traffic by past links, on-ramp and off-ramp.
3.1.1. Estimation of research area emissions
The emissions in the research area were expressed as the sum of the emissions of the main line highway (i.e. the stretch of highway minus the ramp) and the emissions of traffic on the ramp (Equation (1)). Figure 1 presents the definitions of links and traffic volume:

Definitions of link and traffic volume.

where
3.1.2. Estimation of main line section emissions
The baseline emissions were expressed as the sum of CO2 emissions generated in each link. The emissions generated per km of each link were calculated by multiplying the EF, which is defined in Equation (2) as the velocity of each link after calculation of each link volume:

where
3.1.3. Estimation of ramp section emissions
The ramp section emissions were based on on-ramp and off-ramp traffic, EF, and ramp length. The CO2 emissions generated by on-ramp and off-ramp traffic were calculated, and the emissions of the total ramps were computed:

Where where
3.2. Project emissions
Project emissions are the total amount of CO2 emissions from all of the vehicles on the highway that used the ramp metering system. Ramp metering causes the vehicles on the ramp to stop and go and results in the emission of more CO2 than free-flow traffic. Ramp metering also results in smoother vehicle flow on highways because the vehicles enter in a staggered, controlled manner, thereby reducing bottlenecks that would impede traffic. This results in reduced CO2 emissions. In our study, ramp metering increased stop-and-go traffic on on-ramps and decreased traffic flow disruption on the highway (Figure 2). The decreased emissions by improving volumes at main line highway are calculated as equal to the existing estimate of baseline emissions. In addition, we calculated the emissions generated by on-ramp traffic.

Calculation of CO2 emissions on the ramp.
We used the method of Gonçalves and Farias 5 to estimate additional emissions generated by repetition of stop-and-go situations. They proposed that 17.8 g of CO2 are generated each time in extended (over 14 m) stop-and-go situations and that 12.4 g of CO2 are generated during short (under 14 m) stop-and-go situations. They also suggested that 0.57 g of CO2 is generated per second when vehicle engines are idle. Thus, the emissions generated at ramps are divided into on-ramp and off-ramp. In this study, the off-ramp emissions were calculated using the suggested method at project emissions. The on-ramp emissions were calculated as follows:

where
3.2.1. Estimation of queue length
Queuing theory can be used to calculate the number of waiting vehicles prevented from entering the highway by the ramp metering system. In the case of single-service organization, the approximate mean of arrival rate, service rate, and traffic intensity

where,
3.2.2. Moving to the end of a queue
When ramp metering is in operation, vehicles can move to the end of a queue after entering the ramp. Thus, CO2 emissions depend on the ramp entry velocity of vehicles. The distance prior to reach to the end of the queue is equal to the subtraction of the multiplication of the number of vehicles and the length of vehicles in the queue from the total ramp length. We used Equation (6):

where
3.2.3. Number of stop-and-go incidences and idle time
Assuming that the queue is divided by the number of passing vehicles per metering signal period, the average number of stop-and-go incidences was calculated using the Equations (7) and (8):


where
3.3. Leakage emissions
Leakage emissions refer to the increase in emissions outside the project boundary that occur as a result of the ramp metering system, in addition to a rebound effect. In this study, we considered that the vehicles that use arterial routes to avoid ramp metering increase emissions on these routes. We employed the method used to derive the project emissions to calculate the leakage emissions. The method takes into account the volume of the change in velocity by volume as in Equation (9):

where
4. Estimation of rates of vehicles bypassing the ramp
Since ramp metering incurs waiting times, a driver’s decision to enter the ramp is likely to be dependent on factors such as the difference between waiting times when using the ramp and when using the detour. Ramp metering causes some drivers to change their routes and affects CO2 emissions on the ramp and on the main lane. With these issues in mind, we performed SP analysis to determine the degree of driver preference for individual traffic situations.
In traffic, not only quantitative information but also qualitative information influence drivers’ decision making. We used questionnaires to assess the role of awareness of the detour, travel time, and trip length in drivers’ decisions. In designing the questionnaires, we took into account the orthogonality between the attributes in each hypothetical alternative. We also wished to avoid multicollinearity, which is a problem in actual behavior data. In determining the number of questions, we utilized a fractional factorial design and a table of orthogonal arrays.
Too many questions could lead to inconsistency in participants’ responses. To simplify the number of questions, we used a SP design in which the level of difference was based on the attribute variables. Nine questions were derived from the orthogonal arrays. Table 2 shows the value of each question.
Experimental design for Stated Preference.
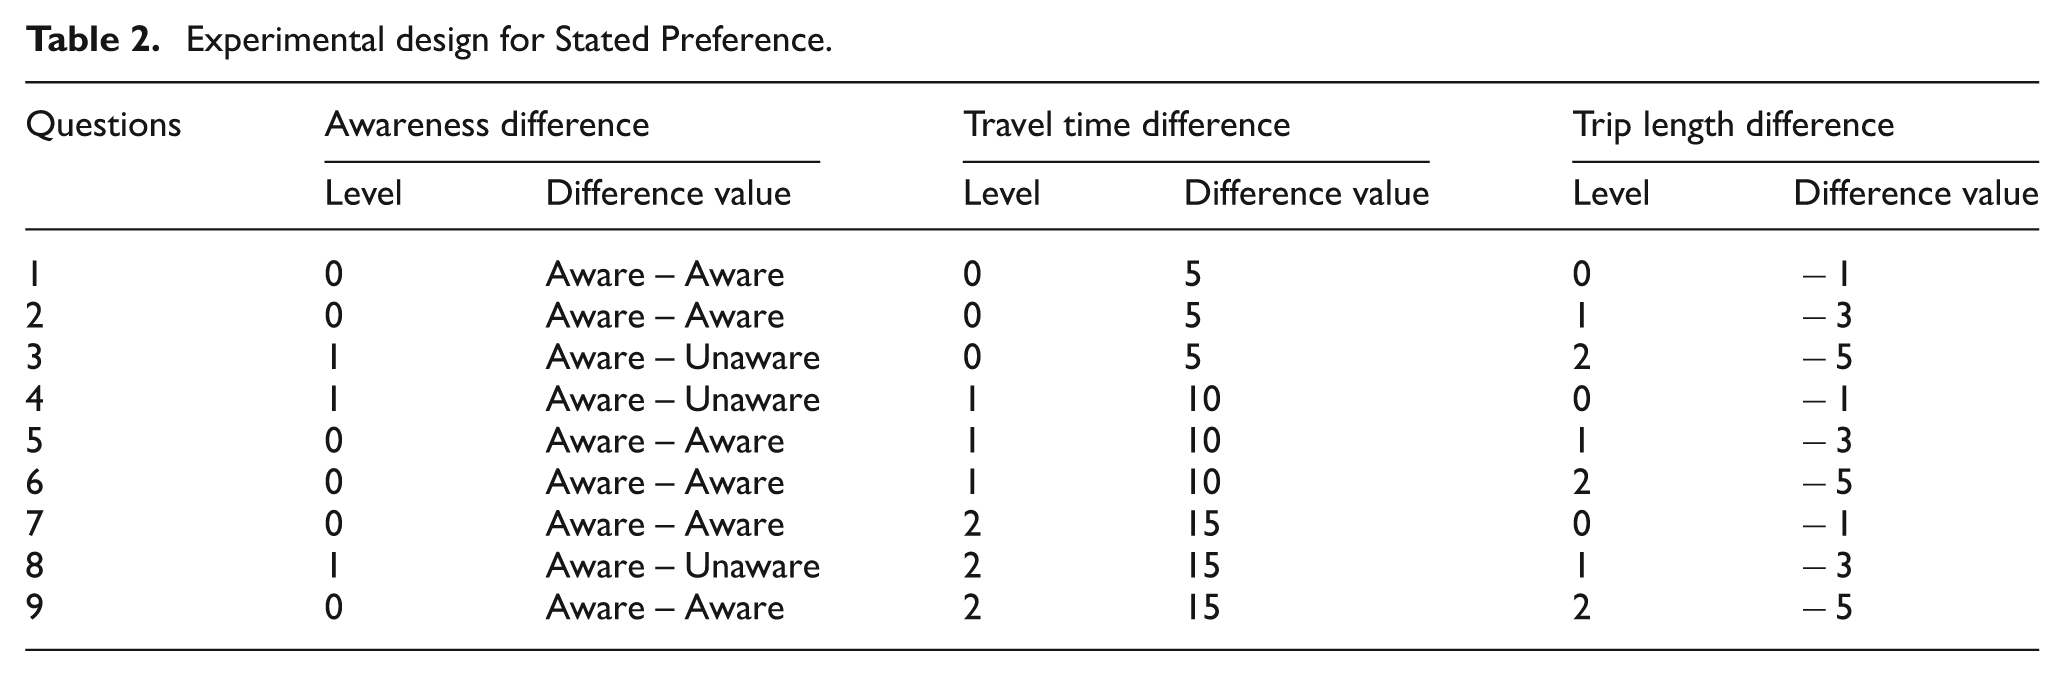
VMSs alerted drivers to two routes at the point where the detour was signposted. Based on the information, drivers were asked whether they wished to change their route. The detour would save the drivers 5–15 minutes traveling time but increase the length of the journey by 1 km to approximately 5 km. One hundred and twenty-eight questionnaires were collected, and 122 were selected for analysis. The Statistical Analysis system (SAS) was used to analyze the drivers’ decisions in each situation. A significance level of 5% was used in the SP model.
The P-values of the three variables—awareness, travel time, and travel distance—were less than 5%, suggesting that the effect was statistically significant.
In Table 3, the P-values for awareness, travel time, and travel distance were less than 0.05. Overall, a higher level of driver awareness of the detour was associated with a higher probability that the driver would use the detour. Travel time was also correlated with higher use of the detour: whenever the travel time was reduced by 5 minutes at 15-minute intervals, so the shorter travel time is, the higher the percentage of detours. Travel distance did not impact on drivers’ decisions when the distance was decreased by 2 km at 5 minute intervals. Therefore, when the travel time was shorter, the percentage of detours is higher.
Results of Stated Preference.
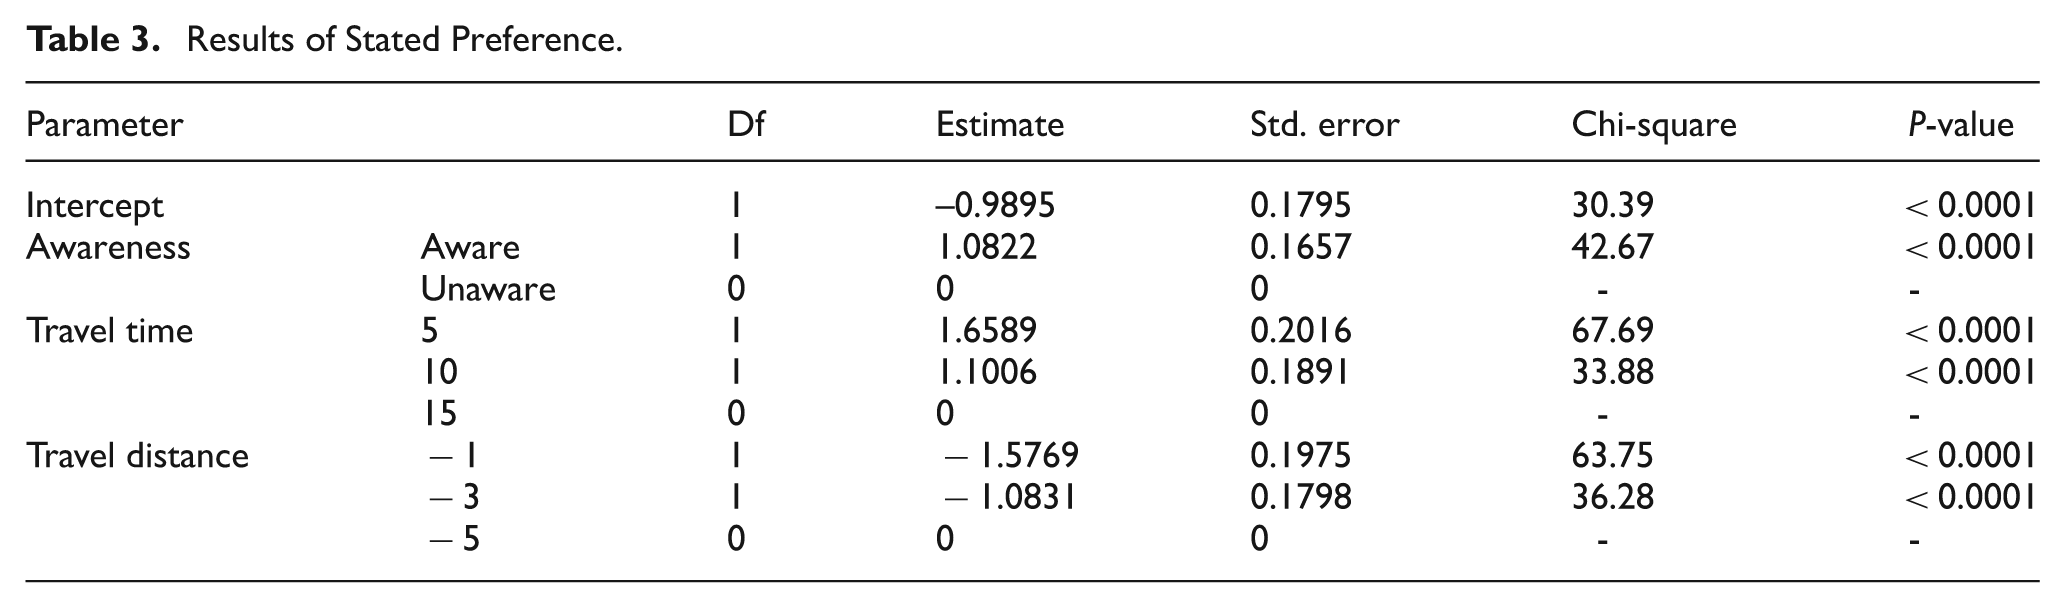
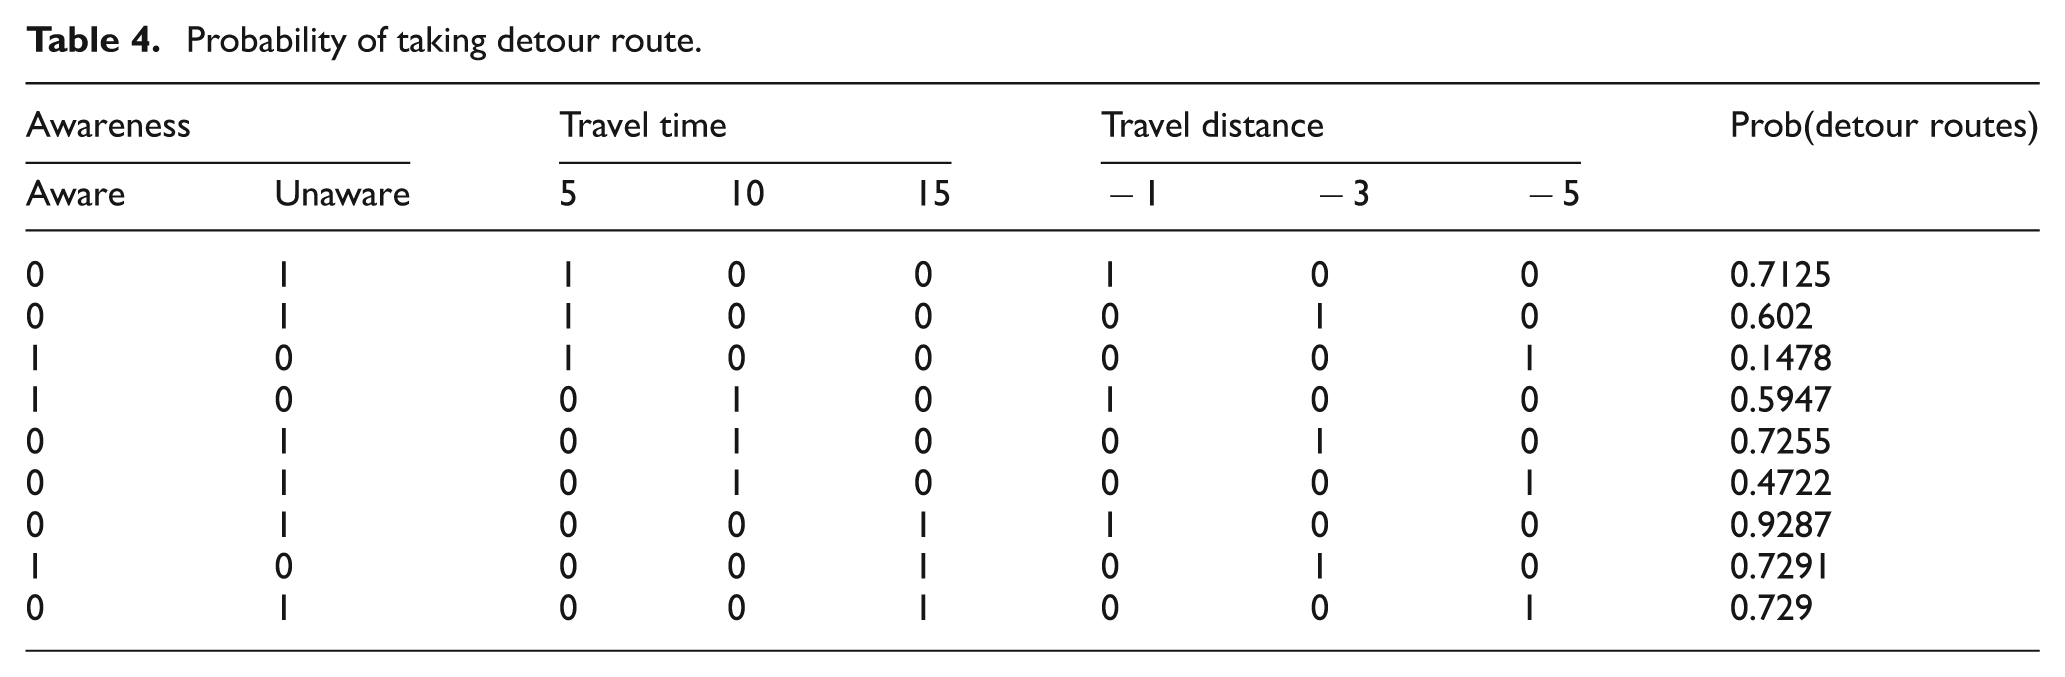
Table 4 shows the probability that a driver would select the detour route based on awareness, travel time, and travel distance. It shows that the detour rate was based on the travel time of a vehicle entering the ramp when ramp metering was in operation, the travel time on the detour, and the travel distance.
Probability of taking detour route.
5. Model verification
5.1. Simulation
The Traffic Software Integrated System (TSIS) simulation program was used to verify the CO2 measurement model. TSIS is widely recognized as one of the most successful analysis tools supported by the Federal Highway Administration (FHWA). Dong-seo overpass, a site with heavy traffic congestion and traffic jams during peak hours, was selected as the target area. Dong-seo overpass encompasses a 10.15 km two-lane urban highway section where the speed limit was 80 km/h. The simulation ran from the time the vehicles entered the section to when they exited downtown. The section includes three on-ramps (Gamjeon, Hakjang, and Jurye) (Figure 3). Traffic jams occurred in the downtown direction as a result of entering the on-ramp. A detour exists that avoids use of the overpass. The average volume of traffic was 2987 veh/h at morning peak time. There appeared to be heavy traffic during non-peak times (Figure 4).

Location of project area.

Average volume of traffic each time.
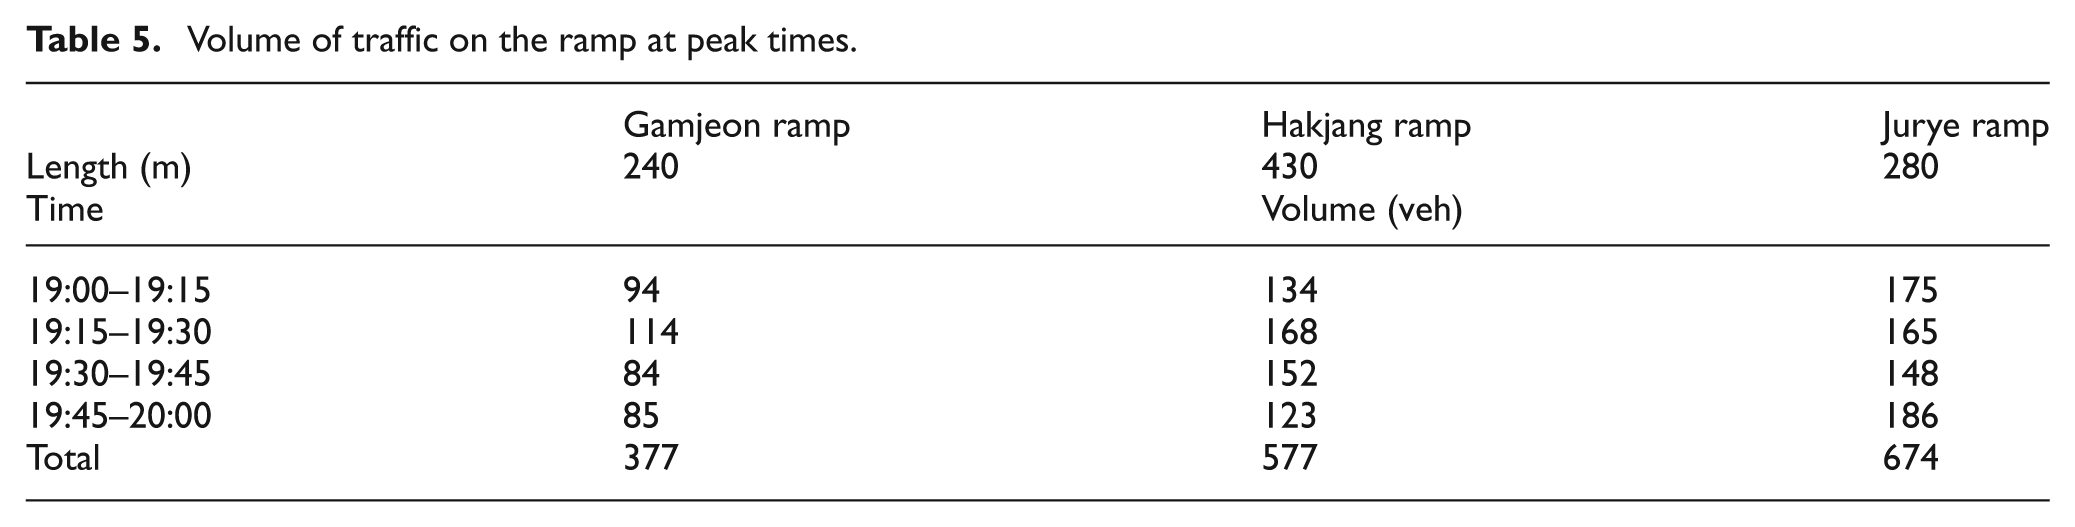
CO2 emissions were calculated from traffic volume and speed. The adapted ramp metering algorithms utilized local control, which is the earliest and simplest application of ramp control. To minimize interference from traffic in the main lane and to prevent delays, we defined local control as four vehicles passing every 30 seconds. The effectiveness of the ramp metering system was quantified as a decrease in CO2 emissions. Figure 5 shows the network of roads constructed using TSIS. The simulation was run for 1 hour using real data on traffic volumes between 7 pm and approximately 8 pm. The volume of traffic entering the ramp was calculated by actual measurement. Table 5 shows the volumes of traffic entering the ramp and the characteristics at peak time.

Network of road using of TSIS.
Volume of traffic on the ramp at peak times.
To determine the accuracy of the simulation data, the findings were compared with real data on the main lane before the on-ramp, the main lane after the on-ramp, and the ramp section itself. Figure 6 presents the range of analysis on research area, and Table 6 shows that traffic volumes and speeds for each section and ramp.

Characteristics of research area.
Comparison between real data and simulation data.
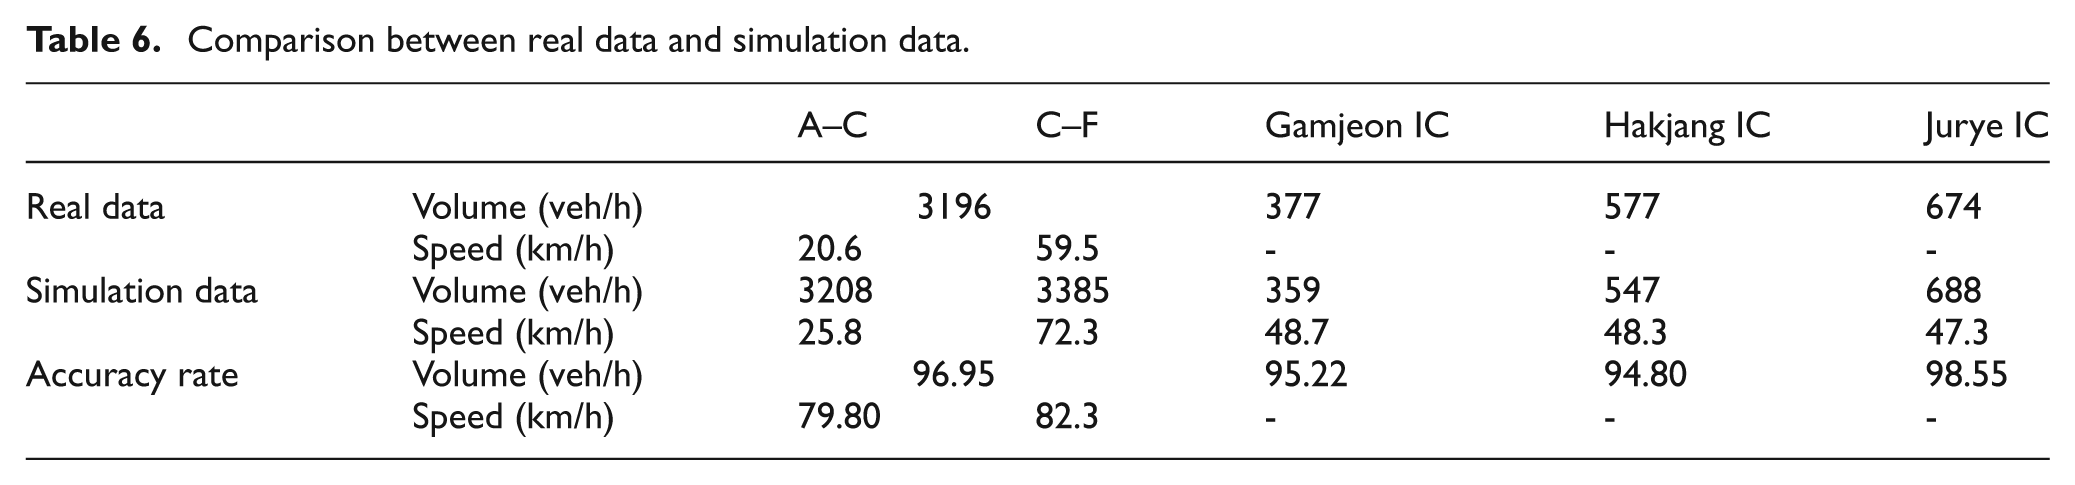
The simulation data and real data yielded similar findings in more than 90% of cases. The speed data showed 80% accuracy; this finding is attributed to an increase in traffic volume, which had a greater influence on each vehicle than shown in the simulation. However, the more than 80% accuracy of the simulation data compared with the real data is satisfactory.
5.2. Computation of baseline emissions
The simulation was used to determine the average traffic volume and average speed of traffic on the main lane, the on-ramp, and the off-ramp. The model was then used to calculate the CO2 emissions in each link. Table 7 shows the characteristics and CO2 emissions in each link.
Characteristics and CO2 emissions in each link.

Analysis of the simulation data showed that speed reduction caused traffic jams and increased CO2 emissions. The traffic jams were caused by the merging section on the main lane and the ramp. The average traffic volumes at all links were 2662 veh/h, and the average speed was 59.5 km/h. Based on the CO2 estimation model, the sum of CO2 emissions was 6903.3 kg/h. These results suggest that increased speeds would result in reduced CO2 emissions using ramp metering.
5.3. Computation of project emissions
Traffic volume, speeds, and CO2 emissions in each of the links were analyzed after ramp metering was applied. The travel times on the detour were assumed to be at 5 minutes less than the main lane, because of the waiting time incurred on the ramp. There was, however, little difference of length between the detour route and the main lane. The results suggested that 15% of vehicles entering the link used the detour. Table 8 shows the impact on traffic volume and speed using the adjusted data.
Simulation results of traffic volumes and speed.

Traffic volumes on each link increased at the A, B, and C sections. The increase in traffic volumes was associated with an increase in traffic speed. The after on-ramp area did not differ significantly as a result of the decrease in the volume of vehicles entering the ramp. Speeds were increased from 44.8 to 63.5% at the A, B, and C sections through ramp metering. Speeds did not differ in the other sections. In relation to the on-ramp area, speeds decreased by 94.2% following ramp metering. Nevertheless, ramp metering improved the traffic volume and speed overall.
CO2 emissions were calculated based on traffic characteristics. The estimated CO2 emissions on the main lane were equal to baseline levels. The emissions in the on-ramp area were greatest, with queue length having the greatest influence. The service rate (λ), which was one of the factors used to calculate the number of vehicles in the queue, was eight vehicles per minute due to two vehicles passing every 30 seconds. The entering rates (μ), which refers to the number of vehicles entering the on-ramp per minute, were 4, 7, and 8 veh/min on the Gamjeon, Hakjang, and Jurye ramps, respectively. Table 9 shows the primary variables and the calculations of the emissions.
Primary variables and results of emissions calculations.

There were no delays, because few vehicles passed the Gamjeon ramp. The CO2 emissions of the Gamjeon, Hakjang, and Jurye ramps were 11.0, 94.2, and 155.0 kg/h, respectively; the total CO2 emissions were 260.2 kg/h. The CO2 emissions within the research area using ramp metering and the rate of CO2 emissions are shown in Table 10. The results show that the total emissions decreased 1066.9 kg per hour, a proportion reduction of 18.3%.
CO2 emissions and decrease rate in research area.

5.4. Computation of the rebound effect
CO2 emissions were decreased through the installation of ramp metering in the research area. However, CO2 emissions would increase as a result of vehicles taking the detour at the ramp, the so-called rebound effect. Therefore, we estimated the rebound effect to better determine the effectiveness of ramp metering.
We calculated CO2 emissions based on traffic volumes and speeds on the detour, using a modification of the method used to determine the CO2 emissions in the main lane. Table 11 shows the CO2 emissions of before and after ramp metering. The results suggested that ramp metering increased CO2 emissions in the detour section to 248.5 kg per hour.
Results of rebound effect.

5.5. Results
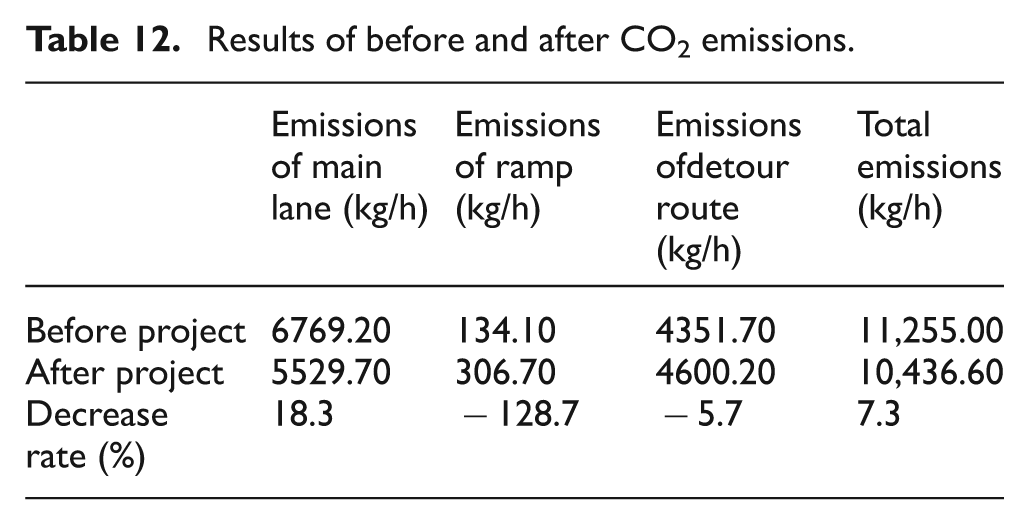
The analyses of CO2 emissions in the project area and the detour section showed that the emissions of the main lane in the project area largely decreased. However, emissions in the on-ramp project area and the detour section increased as a result of ramp metering. They also demonstrated that CO2 emissions were reduced by 818.4 kg/h and that the decrease in the effectiveness was 7.3%. If ramp metering was in operation during four peak hours, it would result in a reduction in CO2 emissions of 3273.6 kg/day and a decrease per year of 1194.9 ton. Table 12 shows the CO2 emissions before and after ramp metering.
Results of before and after CO2 emissions.
6. Conclusion
In this study, we adopted ramp metering, which is a type of Transportation Demand Management (TDM), to analyze changes in traffic flow and associated variations in levels of CO2 emissions. When ramp metering was in operation, traffic flow became smooth in the main lane and the vehicle speed increased. Thus, demand for traffic processing increased in the research area. CO2 emissions generated by baseline traffic also decreased. Our findings suggest that ramp metering can be used to decrease CO2 emissions; therefore, it serves as a useful CDM methodology.
As a result of SP analysis, it was shown that a higher level of driver awareness of the detour routes was associated with a higher probability that the driver would use the detour. Travel time was also correlated with higher use of the detour. Travel distance did not impact on drivers’ decisions when the distance was decreased by 2 km at 5 minute intervals. Therefore, when the travel time was shorter, the percentage of detours is higher.
The TSIS simulation showed that the reduction in CO2 emissions was 818.4 kg/h and that the decrease in the effectiveness was 7.3%. It also revealed that ramp metering reduced the CO2 emissions to 3273.6 kg emissions per day and 1194.9 ton per year. Therefore, ramp metering is effective in reducing CO2 emissions.
To implement ramp metering in the downtown area, it is necessary to install a traffic detection system. Pre-timed ramp controls, such as the demand–capacity control, would also be helpful. Ramp metering rates in demand–capacity control are based on real-time comparisons of upstream flow and downstream capacity. Thus, by calculating the arrival rate and service rate each hour, CO2 emissions can be measured on the ramp section. The use of demand–capacity control also enhances the smoothness of traffic flow and is much more effective in reducing CO2 emissions. Further studies are also needed that incorporate real decrement calculations in the CO2 emissions model developed in this study.
Footnotes
Acknowledgements
This work was researched by the supporting project to education GIS experts.
Funding
This research received no specific grant from any funding agency in the public, commercial, or not-for-profit sectors.