
Abstract
A small amount of literature has been produced on the study of panic spread in a large-scale emergency evacuation, especially that which involves rescue guidance. In a large-scale evacuation action, there are complicated interactions between people and the disaster environment, and it is very difficult to present such interactions in quantitative functions or specific values. In this paper, a qualitatively simulated approach to model and study the panic spread is proposed. First, the internal structure of the evacuation system is described and various internal and external phenomena related to the change of evacuees’ behaviors in the evacuation process are qualitatively interpreted. Based on the qualitative knowledge, a qualitative simulation model of a large-scale evacuation system is established. The calculation results of inverse group matrix verify the rationality and stability of our model. According to the implementation of a series of scenarios with different input, some uncertainty factors that can affect the panic spread in the evacuation process are analyzed, in which the spread of disaster, the rescue guidance, and the normal emotional evacuees are mainly considered. This model reproduces a well-known phenomenon in crowd evacuation, namely “fast is slow”, and confirms that the severity of disaster exponentially positively correlates with the panic spread, and the effectiveness of rescue guidance is influenced by the leading emotion in the crowds as a whole.
1. Introduction
In recent years, a string of unpredictable emergencies, such as the SARS outbreak, hurricanes, tsunamis, strong earthquakes, ice disasters, and so on, have drawn worldwide attention from governments and academia, and as a result, an increasingly in-depth study on such issues has been conducted. One of the effective measures to reduce the damage of most crisis events is evacuation, in which the behavioral response of evacuees is an important part in the crisis studying. To date, researchers on the evacuation behaviors of individuals and groups are mainly focusing on the escape and panic; for example, Helbing, Farkas, and Vicsek 1 assumed that the evacuation group is composed of individuals with ability and thought, based on which their simulation model was established to analyze the nonrational characteristics of the evacuees’ panic escaping under emergency circumstances. However, when facing unconventional emergencies, people’s panic can be more easily generated and spread, which causes a higher “infectivity” than that during conventional emergencies; thus, a series of nonadaptive crowd behavior will be caused.2,3 When the crowd consists of a large population, for example as shown in Figure 1, the dissemination of information can be constrained both in a temporal and spatial scale; thus the evacuees must make instant decisions even though they are lacking information, which can easily cause individual evacuees to act in the same behavior as those in surrounding crowds (i.e. so-called “herding behavior”).4,5 As a result, when the surrounding crowds show much panic emotion, the evacuee also tends to be infected. 6
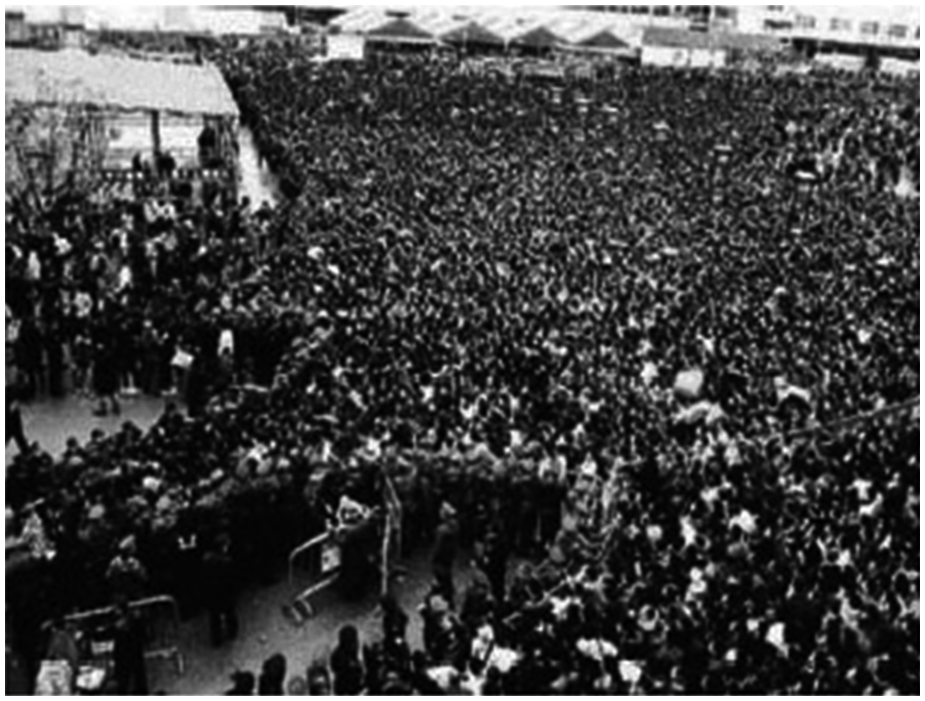
A large-scale crowd stranded by a paralyzed transport system. Reproduced with kind permission from the Association for Computing Machinery. 6
To date, much literature has reported on the simulation of evacuees’ movement characteristics in emergencies,7–12 and in regards to panic, there is also some research focusing on the distribution or mitigation of panic (and emotions in general) in crowd evacuation.13–16 However, little research focuses on the spread characteristics of panic, especially when rescue guidance is involved in the process of a large-scale evacuation. A very ;important problem in large-scale evacuation is that it also involves a complex management system 17 that usually is under the coordination and management of relevant government departments, which has been always overlooked in computer simulations. From the perspective of complex management systems, a large-scale evacuation consists of the following characteristics: (a) interfered with by external disturbances, such as the spread of disaster and rescue guidance at any time; (2) affected by anthropic factors, such as some panicked people, who may have a negative impact on others, or some calm people who may play the role of leader and orderly evacuate with others. In fact, people in the evacuation process are the largest uncertainties because their motives and actions are dynamic and thereby affect the whole group’s evacuation behavior. Therefore, to study the spread of panic behavior in a large-scale evacuation integrated with various uncertainty factors in unconventional emergencies is an urgent issue for crisis management.
In a large-scale evacuation, different individuals compose groups and complex interactions exist between individuals. These interactions show obvious nonlinear characteristics. 18 The characteristics of individual’s behavior makes the group’s behavior perform a variety of systematic phenomena, such as gathering, conflicts, and the balance and imbalance of energy, as well as the assimilation and exclusion of the individuals into the group’s behavior. These phenomena are called group dynamics. 19 In existing evacuation models, in fact, neither specific functions nor values can reflect the relationship between these phenomena of group dynamics; therefore, it is impossible to effectively predict the assimilation, balance, or imbalance of the group’s behavior using existing evacuation models. In this paper, an effective research tool is proposed and used to study the dynamic phenomena of large-scale evacuation, that is, the Qualitative Simulation method in system dynamics. 20 Compared with the traditional digital simulation, this method has special advantages to dealing with incomplete knowledge, deep knowledge, and decision-making, which often emerge in management issues. 21 These advantages make it possible to dig deep knowledge in the case of; lacking of information when facing unconventional emergencies. As has been stated, to study the panic spread in a large-scale evacuation is of great need for crisis management, but it is quite difficult to quantitatively interpret the interactions of people in a large-scale emergency evacuation; therefore, using the qualitative simulation method to describe these interactions is of great significance. This paper focuses on the evacuees’ panic behavior during a large-scale evacuation and tries to accomplish the following: making knowledgeable descriptions of various internal and external qualitative phenomena related to the change of evacuee’s behaviors in the evacuation process based on the internal structure of the evacuation system and establishing the qualitative simulation model and analyzing the interactions between different elements of the evacuation system and the uncertainty factors that can affect the spread of panic behavior in the evacuation process through the implementation of a series of different input scenarios to the model.
2. Establishment of the large-scale emergency evacuation model
2.1 The behavioral patterns of the evacuation crowds
According to the organizational behavioral science and the characteristics of the evacuation system,22,23 the behavioral patterns of the evacuation crowds in a large-scale emergency evacuation are defined on four levels: (a) the individual behavioral pattern, (b) the behavioral pattern of individual-individual interaction, (c) the group behavioral pattern, and (d) the behavioral pattern of the rescue guidance. The first three behavioral patterns focus on the crowds being evacuated, and this kind of division corresponds to the three levels of the psychological and social characteristics in the emergency evacuation, which has been internationally recognized, 24 while the behavioral pattern of the rescue guidance is related to the external management control of the evacuation crowds, which is specially defined in this paper. Usually, rescue guidance can act as the leader who knows the correct information and can help evacuees move in order. Helbing et al. 25 indicate that the transition between rational, normal behavior and apparently “irrational” panic behavior is controlled by “nervousness”, but there are measures to reduce such nervousness and accordingly ensure evacuation efficiency, such as with the suitable placement of columns, which is usually organized by rescue guidance. So based on these investigations, it is true that effective rescue guidance can decrease the panic emotion in the evacuation process and thus increase the effectiveness of evacuation, but to date, little theoretical verification or simulation has been proposed to verify the role of rescue guidance in large-scale evacuation.
2.2 The structure of the evacuation system
In this paper, there are three internal and external modules interacting with one another, namely the evacuation module, the guidance module, and the environment module, and they are considered for the large-scale evacuation system. The evacuation module contains the following parameters: the total population of evacuees (POP); the number of people who are in abnormal emotion, namely the panic emotion in this paper (ABN); and the number of people who are in normal emotion NOR; the correct rate on evacuation direction DIR, which is represented by setting the correct rate on evacuation direction of abnormal people and normal people, respectively; the speed of evacuation (SPD), namely the moving speed of evacuation crowds; the flow rate of evacuation crowds (FLO) (i.e., the number of people who are successfully evacuated through an exit with a certain width in a second); and the evacuation rate (RAT) (i.e., the ratio of people who are successfully evacuated to a safe place with the total population of evacuees), which can reflect the effectiveness of the evacuation. The guidance module represents the rescue guidance (GUI) that can affect the actions of the evacuation crowds and control the spread of the panic emotion. The environment module represents the disaster (DIS) that can cause the generation and spread of the panic emotion and affect the effectiveness of guidance. Indeed, normal people comply with most of the criterions in the evacuation process and obey the guidance, while the panicked people are more likely to choose the wrong direction and infect the panic emotion to a portion of the normal people.
Due to the difficulty of interpreting the interaction of group behaviors with specific values or functions, the qualitative method becomes quite significant, in which the interaction between various parameters can be simply described as (+, 0, -). Take the interaction between the evacuation crowds and the choice of direction, for example: the increase of NOR can make more people select the correct direction (i.e. the DIR will increase), so the NOR has a positive effect on the DIR, represented as “+”. Other interactions among the parameters of the large-scale evacuation system can be derived similarly. After defining the parameters of the evacuation system and the interactions between them, the cause-and-effect relationship diagram of the large-scale evacuation system can be obtained, as shown in Figure 2.
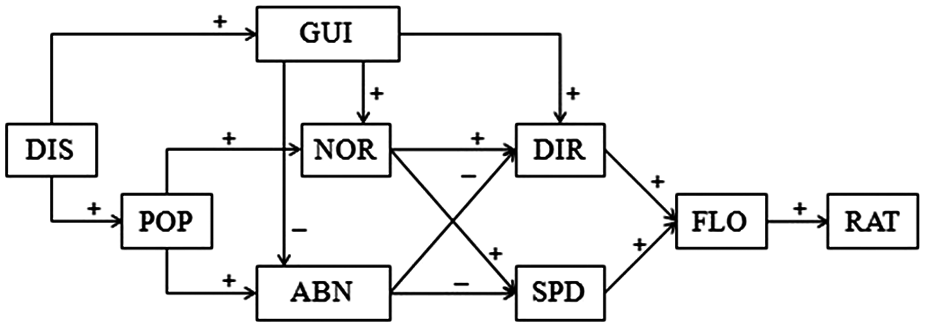
The structure of the large-scale evacuation system.
2.3 Analysis on the rationality of the system
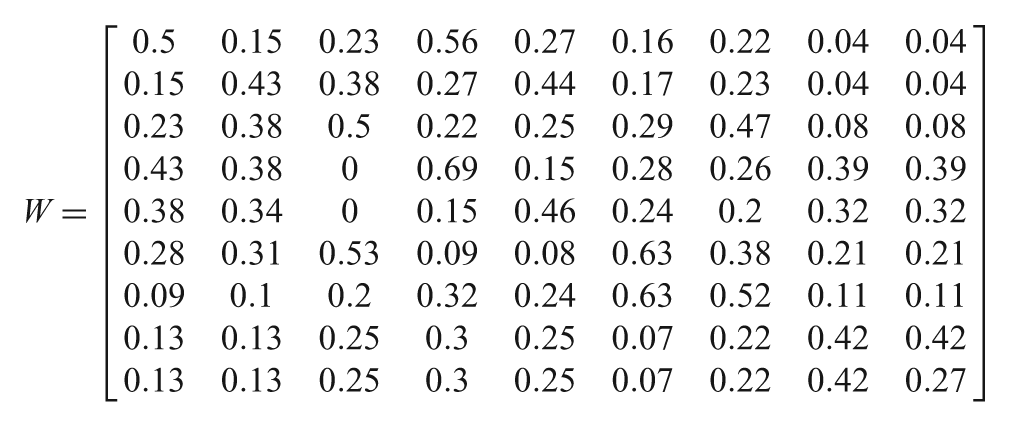
Due to the lack of empirical data of real-world large-scale evacuation, the validation of this model is mainly based on some mathematical approaches. The inverse group matrix proposed by Levins 26 is applied to analyze the rationality of the large-scale evacuation system. According to Figure 1, the DIS, POP, GUI, NOR, ABN, DIR, SPD, FLO, and RAT are listed in order from1 to 9, and the group matrix can be written as
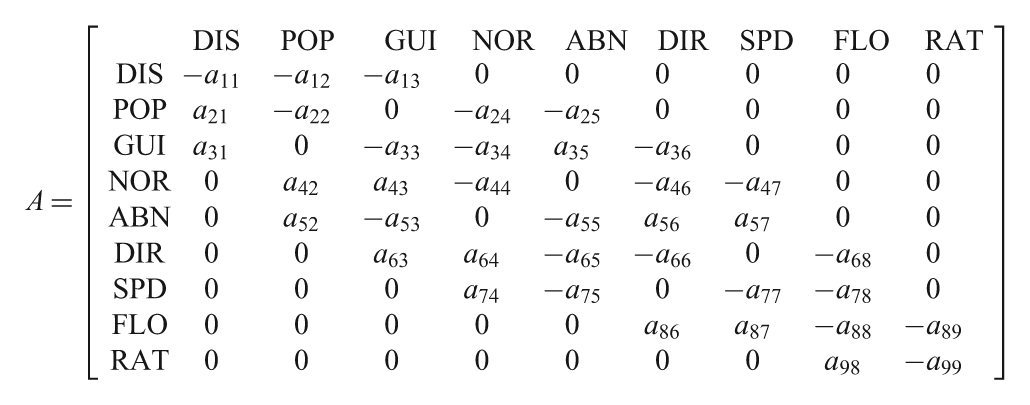
Here
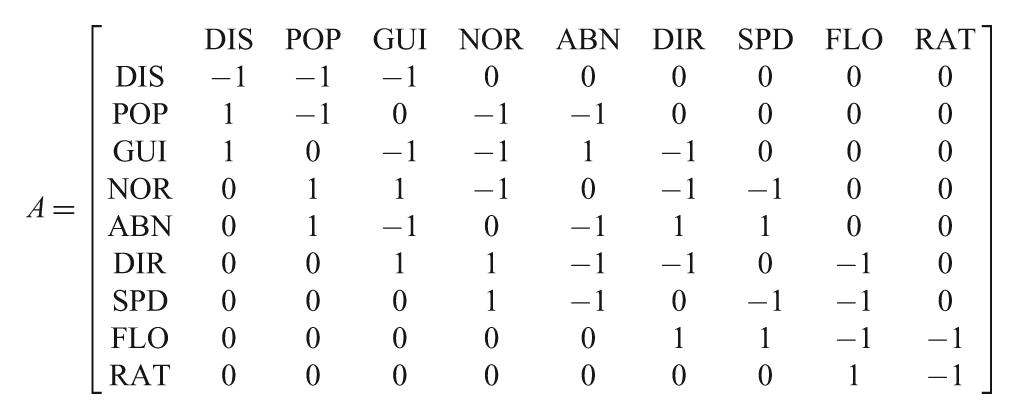
It can be seen from the structure of the large-scale evacuation system that the interactions between the disaster environment, the rescue guidance, and the evacuation crowds are in fact represented by a series of feedback rings. For example, the POP, DIS, GUI, and NOR consist of positive feedback, while the POP, NOR, DIR, and ABN consist of negative feedback, and so on. The interaction among these feedbacks is the internal power for the running of the evacuation system. According to the information of these feedbacks and based on the method of the inverse group matrix, the fuzzy response prediction of the system can be investigated from the group matrix obtained previously. The change of the network state caused by the change of the parameters in the system can be described by the negative adjoint group matrix as follows.
The negative adjoint group matrix:
where
Then the weight predicting matrix
Here the matrix T is calculated as
where
2.4 Analysis on the stability of the system
According to the modern control theory, the stability of a system contains three cases, namely the stability, asymptotic stability, and instability.27,28 The main method to judge the stability of a system is to calculate the consistency ratio of the qualitative and quantitative response of the system. If the consistency ratio equals 1, then the system is of unconditional stability (i.e., any interference would not affect the system). If the consistency ratio is between 0.5 and 1, then the system is of asymptotic stability (the system is self-adaptive to some extent and can return to the steady state under certain conditions). If the consistency ratio is less than 0.5, then the system is unstable (the system will oscillate or even collapse under interference from the outside world). Based on this method, the qualitative and quantitative prediction of the group evacuation system on the symbols and interactions are compared to calculate the consistency ratio of the qualitative and quantitative response of the system.
Firstly, the non-zero values in the qualitative group matrix are replaced by random values between 0 and 1. This new matrix is viewed as the quantitative group matrix
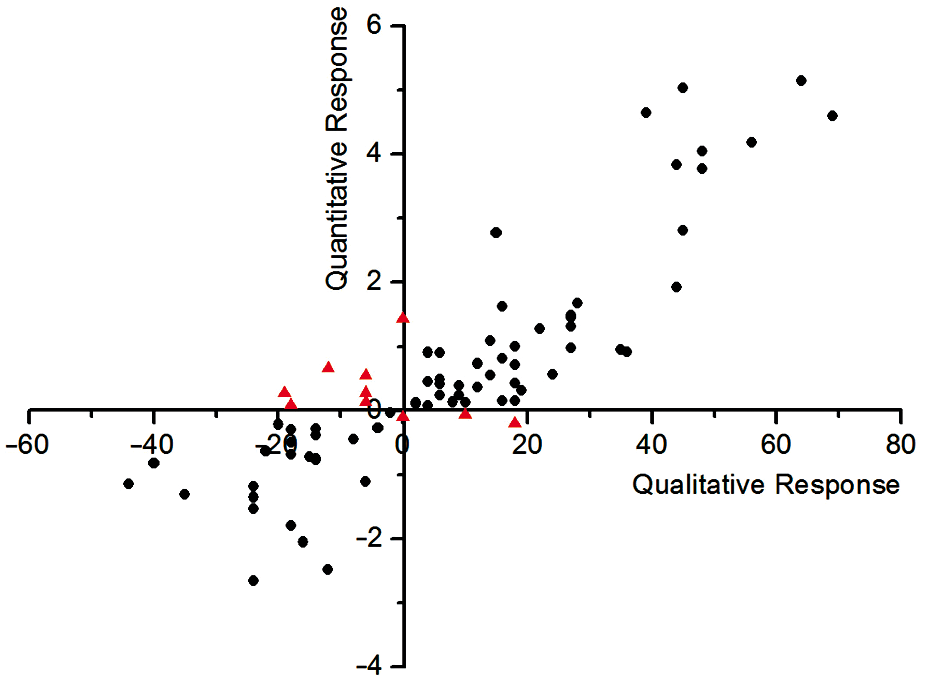
The comparison of the qualitative and quantitative response of the whole system.
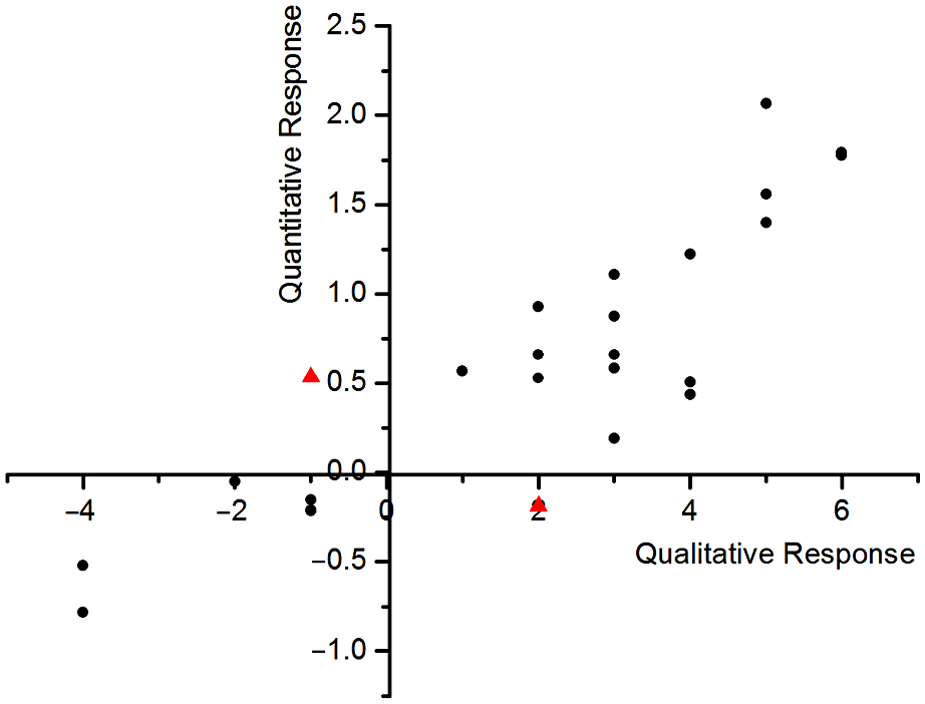
The comparison of the qualitative and quantitative response of a local system.
3. The qualitative simulation of the evacuation system
Based on the qualitative simulation model of the large-scale evacuation system, the interaction of different elements with one another, especially the effect of rescue guidance on the panicked behavior of crowds, were analyzed, and the uncertainty factors that can affect the spread of panic behavior in the evacuation process were investigated through the implementation of a series of scenarios with different input.
3.1 Setting of the variables and parameters
According to the cause-and-effect diagram of the system, the main variables and parameters of the model are set as follows:
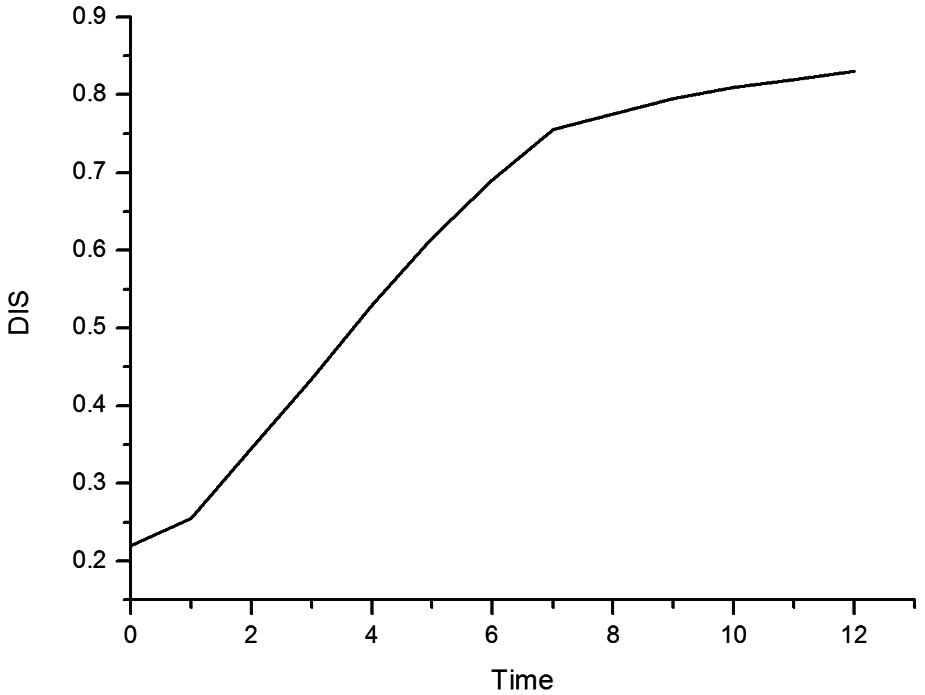
The DIS: A value between 0 and 1 is used to represent the degree of the disaster. The closer to 1 the DIS is, the more severe the disaster will be. Additionally, the DIS is gradually becoming larger with the time to represent the spread of the disaster. The qualitative description of DIS is shown in Figure 5.
The POP: With the spread of disaster, more districts will be in danger and the population of evacuees will increase, i.e., the value of POP is affected by the DIS. The initial value of POP is 1500 persons in this simulation.
The GUI: A value between 0 and 1 is used to represent the need of guidance. The larger the value of GUI is, the more rescue guidance is needed in the evacuation. The need of rescue guidance is affected by the disaster environment, i.e. the bigger the value of the DIS is, the bigger the value of the GUI will be. The qualitative description of GUI is shown in Figure 6.
The NOR: NOR represents the crowds whose behaviors have not been affected by the panic emotion. The initial value is 1000 persons in this work.
The number of people in panic emotion (ABN): ABN represents the crowds whose emotion is abnormal, and thus in a panic, their behaviors are affected by panic and they exhibit nonadaptive behaviors. The initial value is 500 persons here.
The DIR: DIR, or the correct evacuation direction as defined earlier, means that the crowds evacuate heading for the right exits or safe districts. The DIR is represented by setting the correct rate of evacuation direction for abnormal people and normal people, respectively. Assume that the NOR has the probability of P1 to evacuate in the correct direction, while the ABN has the probability of P2 to choose the correct direction, then
The (SPD): The SPD represents the moving speed of evacuating crowds. The initial value of SPD is 1m/s, which is the normal walking speed. When the crowd is affected by the panic emotion, the value of SPD will increase, which reflects that the crowd is more anxious to escape from the dangerous environment.
The FLO: The FLO represents the number of people who are successfully evacuated through an exit with a certain width in a second. In this model the width of the exit is 6m.
The RAT: The RAT represents the ratio of people who are successfully evacuated to a safe place with the total population of evacuees.
The values of DIS.
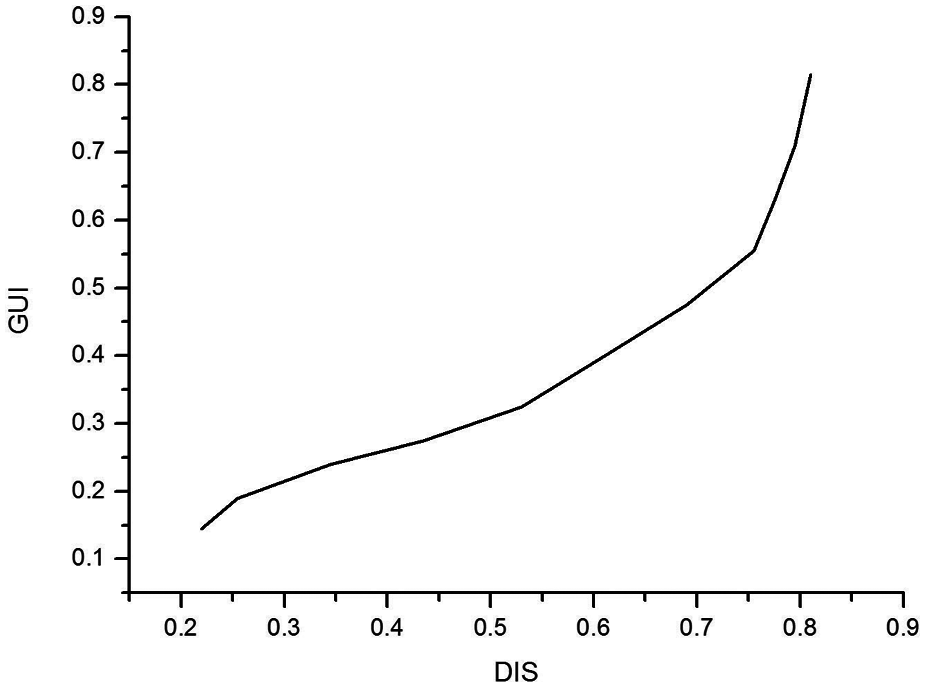
The values of GUI.
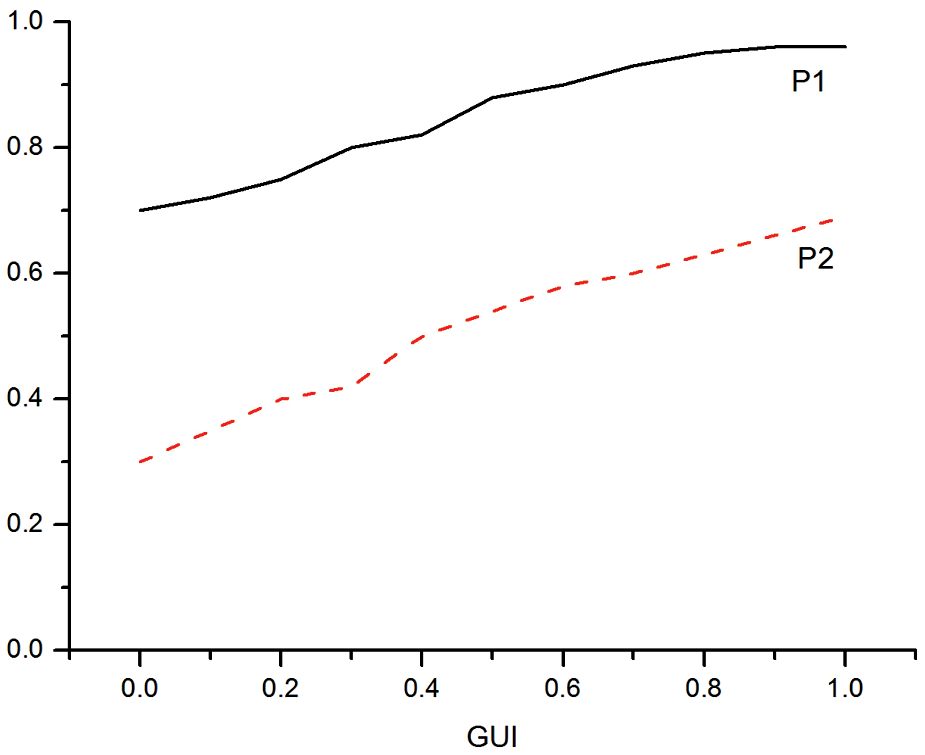
The qualitative description of P1 and P2 affected by GUI.
3.2 The flowchart of the evacuation system
According to the cause-and-effect diagram of the system, a flowchart can be created. Figure 8 shows the overall interaction within the three modules. In this paper, the state of the evacuation module under the effect of the other two modules was mainly considered, and thus the flowchart based on the evacuation module is given, as shown in Figure 9, which was obtained by using STELLA software.
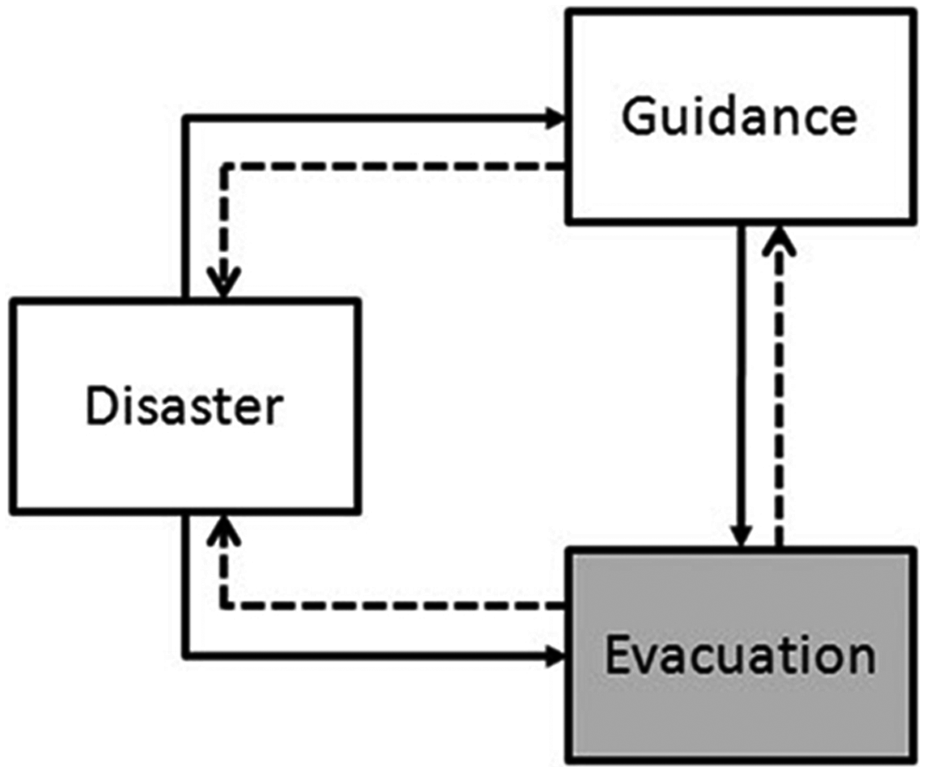
The three modules of the evacuation system.
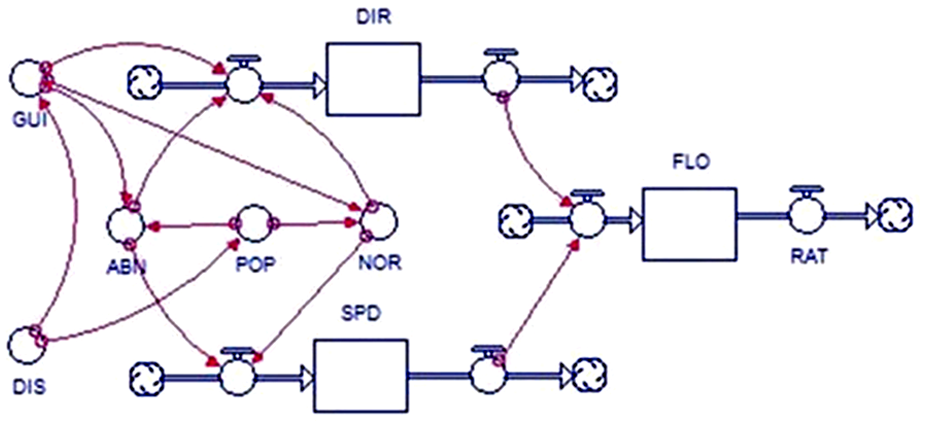
The flowchart of the evacuation system.
To make the simulation in this model, the specific computer program language in the field of System Dynamics, namely the DYNAMO 29 was applied. Based on the system structure (see Figure 2) in which we can only know the rough feedback mechanism between various factors through their causal relationships, the DYNAMO equation can describe this feedback in a more measurable way. Three main variable patterns exist in the DYNAMO equation, i.e. the level variable, the rate variable, and the assistant variable. The level variable can be used to describe the instantaneous status of an element in the system, and it is an accumulated variable codetermined by the input and output rate variables, which are used to describe the time history of the system status. The assistant variable can be used to do some additional algebraic operation or describe the nonlinear relationships of some variables.
In the flowchart, the DIR, SPD, FLO, and RAT are considered as the rate variables to describe the state change of the system with time, while the ABN, POP, and NOR are considered the level variables to describe the state of the system in every moment. The GUI and DIS, which can affect the state of the system, are also designed as level variables. Therefore, the DYNAMO equation can be written as
Level equations (L):
Rate equations (R):
Assistant equations (A):
In these equations, J represents the past moment in time, L represents the future moment in time, JK represents the time interval from the past to present, KL represents the time interval from the present to future, and DT is the time step of the simulation. Additionally, the expression of “parameter time moment” represents the parameter at this time moment. The NUM is used to represent the number of people who have been evacuated to safe places, and the WID is the width of exit (set as 6m).
3.3 Simulation results and discussion
3.3.1 The effects of rescue guidance on the panic emotion of crowds
Figure 10 shows the relationship between the DIS and the increase of ABN without rescue guidance. It indicates that when there is no guidance, the number of people in panic will at the beginning gradually increase from the initial value of 500 and then finally increase exponentially with the spread of disaster. This means an uncontrollable state of panic. In this figure, the abscissa represents the qualitative time development. When the rescue guidance exists, the inhibition effect of the guidance on the panic emotion is obviously observed, as shown in Figure 11. It can be seen that the number of people in panic gradually decreases to a lower, stable level. Due to the relationship between the GUI and DIS, i.e. the GUI will be enhanced with the increase of DIS, if the power of rescue guidance is enhanced, the evacuation behavior of crowds will undoubtedly be controlled better from common sense. Therefore such a result is also accordant with the actual situation. What’s more, the precondition of Figure 11 is that the panicked people are a minority of the whole crowd being evacuated, i.e. the value of the NOR is bigger than the ABN, and thus under the intervention of rescue guidance and the condition that the majority of people who are in a normal emotional state can bring along the panicked people to follow them, the number of people panicking will gradually decrease. This indicates an elimination process of the panic emotion. However, what if the panicked people are the majority of the whole crowds or nearly equal to the number of normal people? Will different results occur under the same rescue guidance? In the next section, these questions will be analyzed.
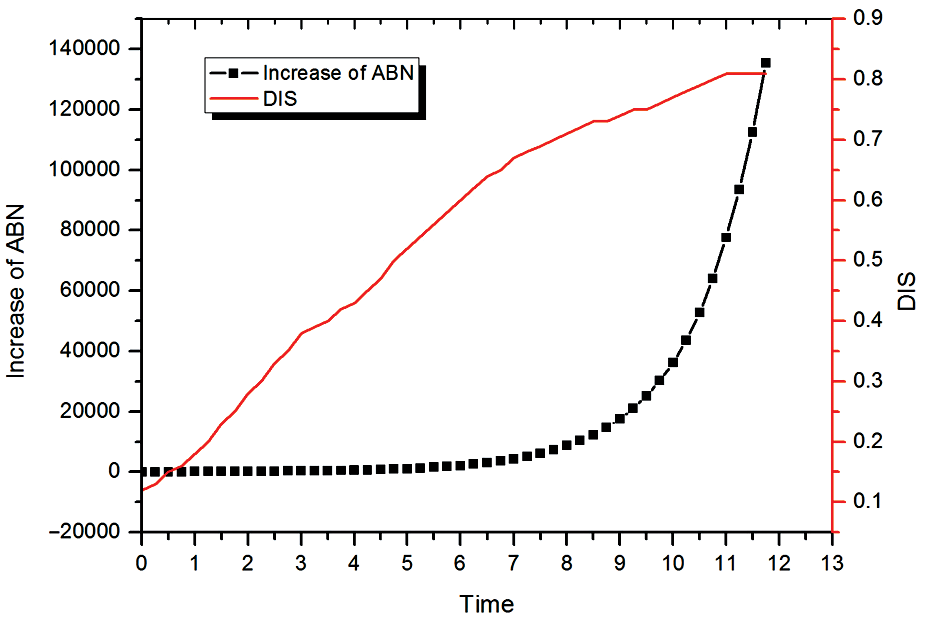
The relationship between the DIS and the increase of the ABN without rescue guidance.
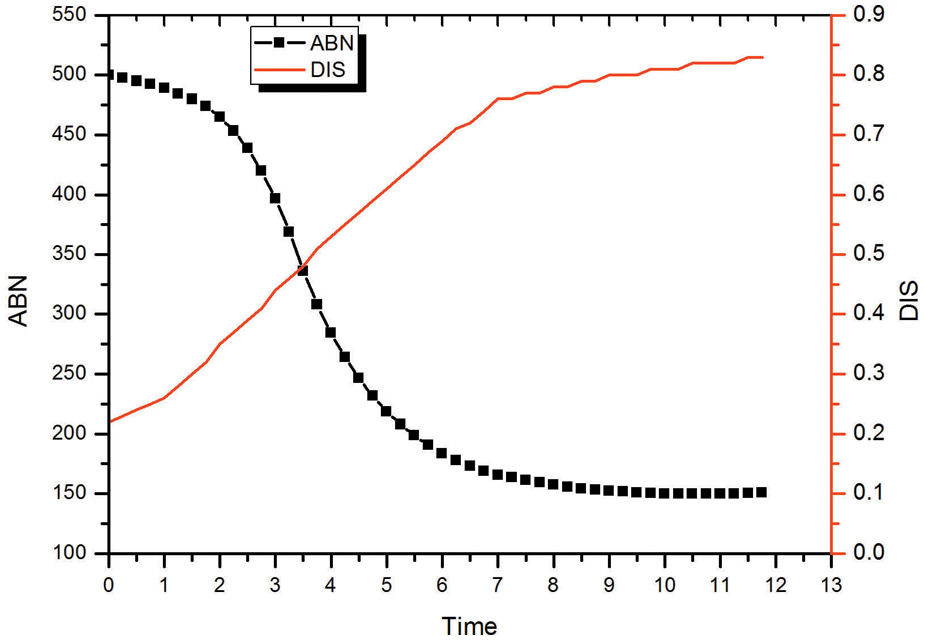
The relationship between the DIS and ABN with rescue guidance.
3.3.2 The interaction between the normal emotion and panic emotion
Figure 12 shows the change of the number of panicked people under a different initial value of the NOR. The curves 1 to 6 in Figure 12(a) correspond to the change of the ABN under the initial value of the NOR as 500, 600, 700, 800, and 900, respectively. The curves 1 to 3 in Figure 12(b) correspond to the change of the ABN under the initial value of the NOR as 300, 400, and 500, respectively. The bottommost curve in Figure 12(b) is just the topmost curve in Figure 12(a), and the difference in shape is just due to the different axis scale. It can be seen that when the initial value of the NOR is equal to that of the ABN, the number of panicked people will increase at the beginning and then tend to an equilibrium value with the spread of the disaster and the strengthening of rescue guidance, but the equilibrium value of the ABN is still larger than the initial value. When the initial value of the NOR is larger than that of the ABN but the disparity is small, the number of panicked people still appreciably increases at the beginning but further decreases until reaching an equilibrium value that is lower than the initial value. In this case the bigger the disparity of the initial value of the NOR and ABN, a lower equilibrium value the ABN tends to reach. Nevertheless, when the initial value of the NOR is smaller than that of the ABN (i.e. the panic emotion dominates the evacuation crowds at the beginning), although there is rescue guidance, the number of panicked people will still increase with the spread of disaster and finally increase exponentially, exhibiting an uncontrollable state of the evacuation.
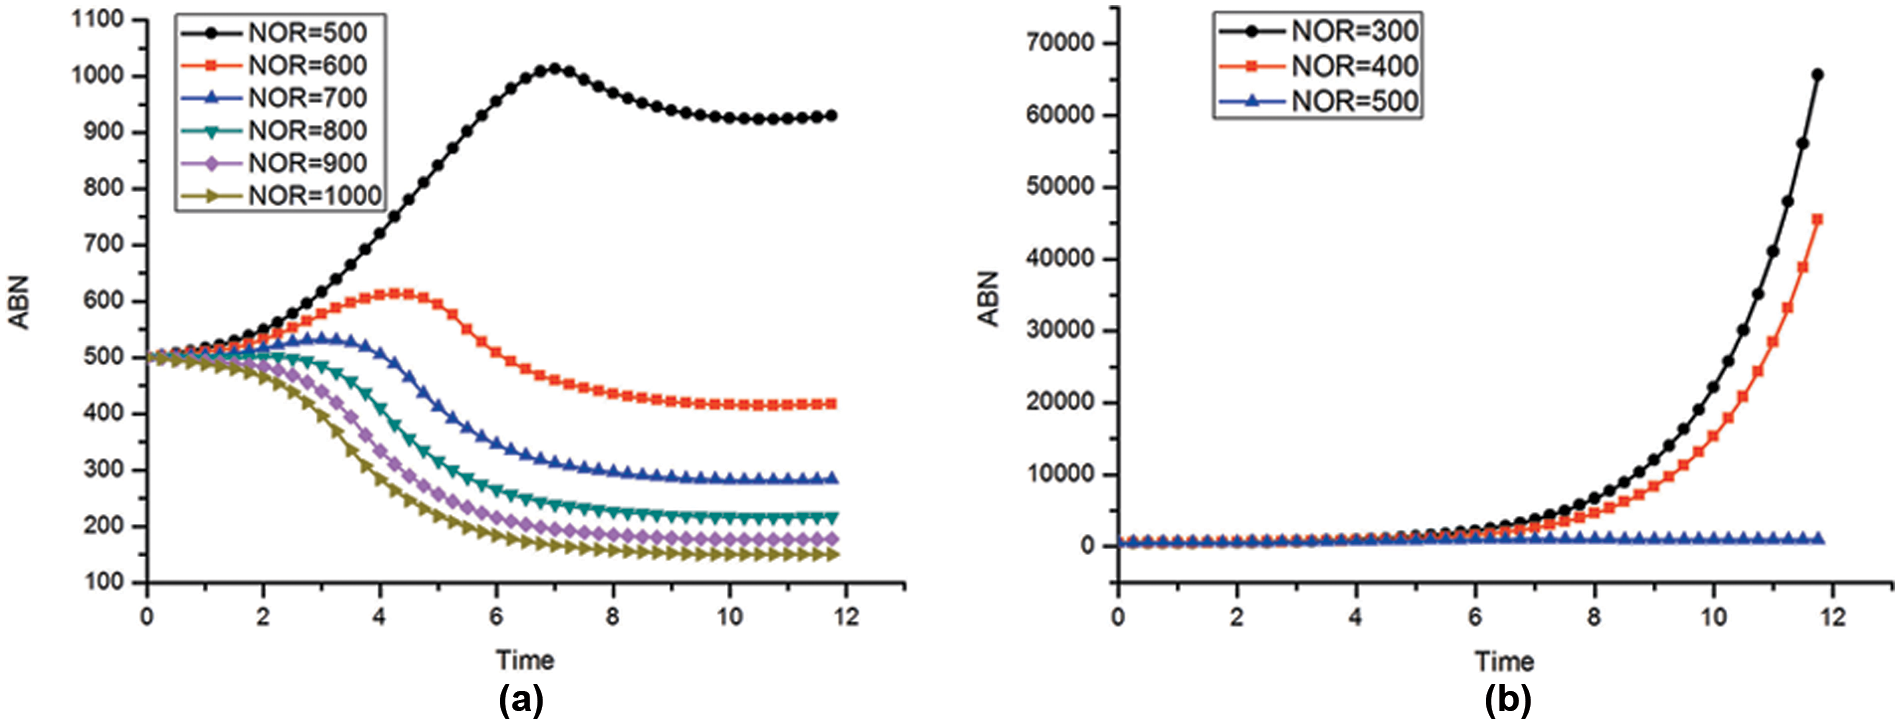
The change of the number of panicked people under different initial values of the NOR.
These results indicate that the panic spread in the evacuation is affected by the leading emotion that occupies the whole crowd. If the normal emotion is the majority, i.e. the initial value of the NOR is larger than that of the ABN, then the panic spread can be effectively controlled under the rescue guidance. If the panic emotion is the majority ( i.e. the initial value of the NOR is smaller than that of ABN), then it is still probable that the panic emotion will spread to an uncontrollable state and in such a case more effective measures of rescue guidance should be taken to control the panic emotion.
3.3.3 The effect of panic emotion on the effectiveness of the evacuation
The parameter FLO, namely the flow rate of evacuation crowds through an exit, can reflect the effectiveness of the evacuation to some extent. Actually, in a large-scale evacuation, there is not always one or some exits with certain widths. For example, when the large-scale evacuation occurs in an urban area, the safe exits are those roads leading to safe areas, which are different from the evacuation scenes occurring in a high-rise building or a stadium, where a high density of crowds exist. For the facilitation of the calculation in this paper, a specific exit with the width of 6m is assumed in the large-scale evacuation. When people are in panic or high emotional arousal, they will move more urgently at a faster walking speed toward the safe area. As a result, the SPD (i.e. the moving speed of the crowds in this model) can reflect the state of the panic emotion; in other words, the larger the value of SPD, the higher level is the panic emotion at. Figure 13 shows the relationship between the SPD and FLO. It can be seen that when the value of the SPD is around 1.5 to 1.7m/s, the value of the FLO is the highest. When the SPD continues to increase, the value of FLO will decrease. The initial value of SPD is 1m/s (i.e. the normal walking speed of a person), and it will be accelerated by his or her instinct at the beginning of the evacuation in a dangerous environment in order to arrive at the safe areas as soon as possible. In this case the FLO through the exit will increase, and when the SPD reaches around 1.5 to 1.7m/s, such acceleration of moving speed caused by the urgency of being safe can obtain the best results; the FLO becomes the highest, and the damage on the evacuation crowds is under control. However, when the SPD continues to increase, which means that the panic emotion continues to heat up, the conflicts in the crowds will sharply arise because people will accelerate their speed under panic emotion regardless of others, and thus the FLO will in contrast decrease and the effectiveness of the evacuation will be negatively influenced. Such phenomenon has also been discussed in previous literature 30 and referred to as “fast is slow” in evacuation. The qualitative simulation in this work well represents this phenomenon.
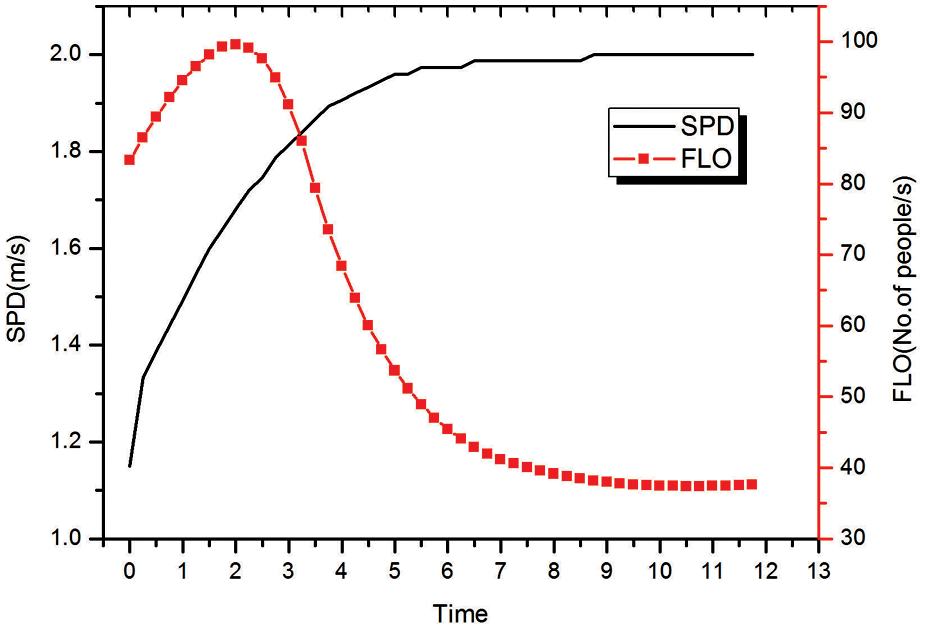
The relationship between the SPD and FLO.
4. Conclusions
To date, numerous studies have been conducted to simulate the evacuation process of crowds using different spatial scales, and also many of them have paid attention to the emotion and behavior of crowds in the evacuation process. However, little literature has been conducted to study the panic spread in large-scale emergency evacuations, especially when rescue guidance is involved. Complex interactions among different factors, namely the disaster environment, the evacuees, and other control measures, exist in large-scale evacuations, and the qualitative simulation is an effective method to deal with such interactions. In this paper, the disaster environment and rescue guidance are considered in large-scale evacuations. In the evacuation process, various internal and external phenomena related to the change of evacuees’ behaviors are qualitatively interpreted based on the theory of dynamic system. Based on qualitative knowledge, a qualitative simulation model of a large-scale evacuation system is established, and the calculation results of an inverse matrix group verify the rationality and stability of this model. According to the implementation of a series of scenarios with different input, it is found that the severity of disaster exponentially positively correlates with the panic spread if there is no rescue guidance. On the contrary, with rescue guidance, the panic spread can be effectively controlled and the effectiveness of rescue guidance is influenced by the leading emotion of the whole crowd.
Considering that our simulation results maybe meaningful in the qualitative interpretation but not precise enough in the quantitative meaning, a further verification of this model is conducted by the comparison with some well-known results from other research work, namely the “fast is slow” phenomenon in crowd evacuation. It is found that the qualitative simulation model proposed in this work well represents this phenomenon, and the practical meaning of this phenomenon can be concluded as being that from the view of controlling the moving speed and maintaining the best evacuation results, it is very important to control the panic spread in the evacuation crowds.
Footnotes
Funding
This research is supported by the National Natural Science Foundation of China (No.91024025), the General Research Grant of the Research Grant Council, HKSAR No. CityU 118708, and the Fundamental Research Funds for the Central Universities (No.WK2320000014). The authors deeply appreciate the supports.