
Abstract
In the era of web2.0, marketers are eager to benefit from viral advertising. In this paper we propose a computational network model of viral advertising to examine the maximization of influence within social networks. For our network model we combine both the independent cascade model and the threshold model. We use a spreading threshold to trigger the cascading process, to examine the ways in which advertisements spread across the social network. We also investigate the procedures for choosing an initial set of people to maximize the performance of advertisement spreading. Furthermore, we analyse the impact of network structures on the dynamics of diffusion, and a strategy for combining viral advertising with mass marketing in e-commerce. We also run simulations using a real dataset to check the diffusion of advertisements in an online social network. Ultimately we discovered that a combination of viral advertising and mass marketing is better to diffuse advertisements than either method wholly by itself. Using an optimal algorithm improves diffusion performance, but using ‘degree’ is also an alternative way of choosing initial nodes when the whole structure of network is unknown. Integrating simulations to build a real-time decision support platform will make the diffusion of advertisements more efficient.
1. Introduction
Today, in the world of web2.0, word-of-mouth communications among members of a value network play an important role in e-commerce, especially in a mobile environment in which communication takes place at any time and from any location. 1 Among many applications of e-commerce, viral advertising has generated considerable interest; 2 and for good reason: Hotmail, for instance, which spent only three percent of the money its direct competitors invested in the market, managed to attract 12 million users in only a year and a half. 3 Nevertheless, numerous attempts at viral advertising programs have failed. 4 Viral marketing has been most successful when it has mined the network value of its customers, leading to further sales. Three factors determine whether a customer has a high network value. 5 First, it is important that the customer like the product; second, a customer must be able to influence his or her acquaintances; and third, a customer must be able to influence not only his or her immediate acquaintances, but also those acquaintances who in turn influence other people, and so on recursively until potentially the entire network has been reached.
Through viral advertising, advertisements can be recommended by customers and shared with others. Social influence is a major force in the continual spread of advertisements, 6 and can function as a form of social contagion. 7 Unlike mass marketing, 8 viral advertising begins by targeting a select group of initial customers; that group then spreads the product information throughout a network, often through word-of-mouth. 4 Such a process of efficient diffusion among customers sometimes makes for a good marketing strategy, costing significantly less than traditional advertising. But tracking the influence and dispersion of viral advertising has proven difficult. In theory, content providers should possess a powerful tool for tracking relationships among customers. Likewise, marketers should have an efficient marketing strategy. A simulation-based decision support platform could help to fill such gaps.
One of the central issues in viral advertising is the ability to manage powerful customers who have the ability to influence their peers, the formation of public opinion and the mass diffusion of a given advertisement. 9 Moreover, in order for viral advertising to succeed, marketers need to build a suitable strategy to reduce budget costs, to maximize the performance of viral advertising in social networks, and to understand the interactions between social networks and the diffusion of advertisements. To be sure, these are complex research issues: the relationships are intricate, multiple participants interact over a period of time, and these interactions themselves are nonlinear. Classical inductive case methods and standard statistical techniques have often proven less valuable in the study of nonlinear phenomena. Moreover, these complex phenomena have grown more and more central as theoretical development has shifted from cross-sectional and equilibrium perspectives to dynamics ones. 10 Simulations are also particularly valuable in explaining longitudinal phenomena, such as the dynamics of viral advertising, because they do not require the same investment of time and data that empirical methods do. 11 In viral advertising, slight changes in action on the individual level can result in extensive changes in the spread of advertisements at the organizational level. In other words, macro-level phenomena are emergent from micro-level actions. Through sensitivity analysis, for instance, we can observe how subtle changes in simple rules can affect the final results. 12
To help account for the complexities of viral advertising, in this paper we propose an influence dissemination model in social networks. In our model, we combine the independent cascade model 13 and the threshold model. 14 We use a spreading threshold to trigger the cascading process, in which advertisements spread across the social network by cascading. We also assume that the impact of one person on another person is continuous, but that this impact will be stored inside the affected person and will exponentially decrease. In the digital world of e-commerce, we can ignore the usual time cost of spreading advertisements between two people. To maximize the performance of spreading advertisements, we use the greedy algorithm to maximize the objective function related to the performance. Based on the proposed computational model, we ran a series of virtual experiments to study the following questions we had about the dynamics of viral advertising.
First, how ought one to target an initial group of individuals to maximize the performance of viral advertising when one has a limited budget; and further, how does the initially selected group affect the dynamics of viral advertising? In the past, researchers have proposed several algorithms for studying such maximization problems in particular social networks whose structures are static.15–19 Recent efforts at empirical study have recommended the optimal strategy. 20 In our research, we used a computational model and simulations to study the dynamics of viral advertising in social networks and the maximization of diffusion performance when the parameters of networks change. Furthermore, we are also interested in a further question: What kind of heuristic measurement used to select initial individuals ought to be employed to obtain maximum performance? If we understand the structures of networks, we can then use algorithms to target initial persons; nevertheless, we may not want to spend more time and money on understanding network structures. Instead, we may turn to some heuristic measurements for selecting an initial subset of people when network structures are unknown. In this paper, we compare the heuristic measurement of networks, such as degree and betweenness, with the maximum algorithm.
We also had a second set of questions. How will the dynamics of viral advertising change if we were also to change the network’s structure? The social structure of networks plays an important role in the spread of advertisements; and the impact of different networks, whether they are small-world or scale-free, on the performance of viral marketing differs. 21 As a result, we need to better understand the impact that changes to critical parameters of network structure can have on the performance of viral marketing. We therefore examine the performance of spreading advertisements in networks with different structures using simulations, and look for some mathematical equations to describe the dynamic process of spreading advertisements over time. In addition, we also verify the existence of tipping points 22 in the spread of advertisements in social networks.
Our third question has important practical implications for marketing. What kinds of policies are suitable for combining mass marketing with viral advertising? Mass marketing can directly reduce the diffusion threshold of all the persons in a given network 8 – that is, mass marketing can actually increase the willingness of individuals to spread advertisements – while viral advertising indirectly affects all the persons through an initially selected group of people. Accordingly, in our virtual experiments we observed the phenomena produced by combining mass marketing and viral advertising under different conditions.
Using a series of computer simulations, Watts and Dodds 9 also investigated diffusion in social networks and found that cascades are not driven by the influentials at the top 10% degree of hubs in a social network. However, their experiments were based on unweighted random networks. In our experiment we use a weighted scale-free network that is more realistic. Moreover, besides selecting hubs as the initial adopters of diffusion, we also use other selection policies, such as optimization algorithms. Furthermore, we also consider the decay and sustain of the impact of adopters on non-adopters. In all of this, our practical goal is to understand the strategies through which to combine mass and viral marketing.
The paper is structured as follows. Section 2 reviews recent and relevant research. In Section 3, we propose a viral advertising model. In Section 4 we introduce an algorithm to maximize the performance of viral advertising. Section 5 designs virtual experiments and system settings. In Section 6, through a series of virtual experiments, we examine the dynamics of viral advertising and uncover important implications for practitioners. In Section 7, we run simulations in a real online social network. In Section 8 we conclude the paper.
2. Relatedwork
In the value network of e-commerce, 23 marketers publish various advertisements through web pages and short messages in order to spread information to customers. Unlike older forms of advertising, such as mass media, viral advertising is a new and relatively young research topic in the era of web2.0. In hoping to research the phenomenon of viral advertising we began by creating a model that would initially target a small subset of people, before the advertisement went viral, spreading from person to person across the network. Numerous diffusion models have described the spread of such phenomena as information, diseases, innovations and products. According to Rogers, 24 “Diffusion is the process by which an innovation is communicated through certain channels over time among the members of a social System.” Rogers further hypothesized that innovations would spread through society in an S curve: early adopters would select the technology first, followed by the majority, until a technology or innovation became common. Bass 25 used a computational model to describe this S-shaped curve: adoption is at first slow, before it takes off exponentially and flattens out at the end.
In the independent cascade model, Goldenberg et al. 13 simulated the diffusion of information through intra-network communication and via word-of-mouth, while also taking into account the strong ties among members of the same network and the weak ties among individuals belonging to different networks. Perhaps surprisingly, they discovered that weak ties are almost as effective as strong ties in diffusing information. In a separate model, 14 each node in the network has a threshold that is typically drawn from some probability distribution; it also assigns connection weights at the edges of the network. A node adopts a behavior if a sum of the connection weight of its neighbors, who have already adopted the behavior, is greater than the threshold.
Much of this earlier research into the diffusion of information has also focused on epidemiology and the spread of disease. Disease processes and response strategies have been traditionally understood using either a susceptible–infected–recovered (SIR) model or a susceptible–infected–(recovered)-susceptible (SIS) model. 26 These models begin with a disease host: a person is first susceptible to a disease; if he or she is exposed to an infectious contact, then he or she can become infected and thus infectious. After the disease ceases, the initial carrier is recovered or removed. In addition, SIR/SIS models can be used to aid decision-making. For example, BioWar 27 detects the disease, monitors its spread, and aids the decision-making process. It also shares much in common with both the SIR and SIS models. 28
Recently, information diffusion has also been used to understand the ways in which consumer adoption depends both on external marketing efforts and on the internal influence that each consumer perceives in his or her personal networks. 29 Cowan et al. 30 used small-world networks to study the diffusion of knowledge among different structures. Beyond such computational models, researchers studying viral marketing have also presented an analysis of a real person-to-person recommendation network. For instance, Leskovec et al. 31 studied the propagation of recommendations over time within a dynamic and growing recommendation network. Watts and Dodds 9 have likewise simulated the cascades driven by influentials within social networks.
In viral advertising, advertisers are most concerned with targeting those initial customers who will maximize the spread of information across their social networks. In a separate experiment, Leskovec 17 proposed a fast algorithm to find the optimal subset of nodes in a network to detect important information and to efficiently prevent water pollution. Domingos and Richardson 32 have likewise illustrated ways in which to find optimal viral-marketing plans, using Boolean and continuous valued marketing actions. Such a strategy, built around probabilistic models, would greatly reduce computational costs. The optimization problem of selecting the most influential nodes is non-deterministic polynomial-time (NP)-hard. Kempe et al. 19 provided the first provable approximation guarantees for efficient algorithms. Their framework offered a general approach for reasoning about the performance guarantees of algorithms for these types of influence problems in social networks.
Furthermore, real populations are inherently dynamic. Habiba and Berger-Wolf 33 therefore extended the approach proposed by Kempe et al. 19 to explicitly dynamic networks, comparing dynamic and aggregate network representations both in terms of the extent of spread and the actual set of initiating individuals who maximize it. Chickering and Heckerman 15 likewise considered two decision-tree learning algorithms in order to partition potential customers into groups. In turn, they were able to show how to perform a simple cost-benefit analysis to decide which, if any, of the groups should be targeted. The probabilistic-voter model also uncovered an efficient way to solve the problem of maximum efficiency. There it was demonstrated that the most natural heuristic solution, which picks the nodes in the network with the highest degree, is indeed the most optimal. 34 Finally, the diffusion of information has also been studied through social games in which multiple innovations produced by multiple companies compete. 35 Such social-game models have also taken into account the impact of viral advertising. 35
3. Theviral-advertisingmodel
In our viral-advertising model we combine and extend the independent cascade model 13 and the threshold model. 14 In practice, of course, the spread of advertisements via word-of-mouth involves many different means, including mobile channels, email, web-based channels, face-to-face communication, etc. As shown in Figure 1, the social network in which viral advertising happens is a directed graph; the communication is mutual, individuals interact with each other, and each actor is equally likely to affect another individual.
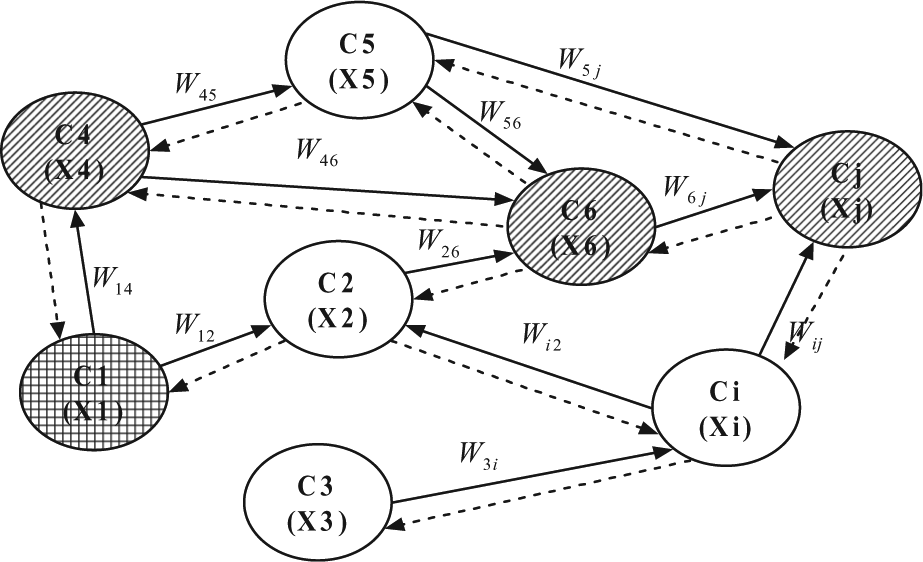
Advertising (e.g. recommendation and purchasing) through a social network. C1 is the initial selected person, C4, C6, Cj are those final persons informed by C1; other persons never become informed.
The probability of the individual i becoming informed at time t is given by:
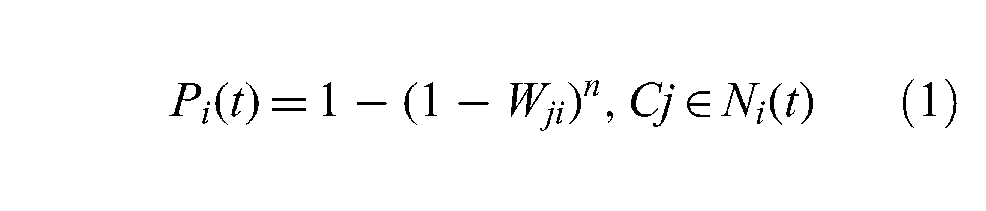
Therein, Wji is the spreading probability that the individual j will affect the individual i to become informed (purchasing intent); Ni(t) denotes the informed individuals directly linking to the individual i; n is the total number of Ni(t); Cj denotes an individual that belongs to Ni(t).
A direct graph also represents a cascade in which advertising information spreads virally throughout a network. The individuals in the social network become informed if they have accepted advertisements and would like to buy products described in such advertisements; the individuals can switch from uninformed to informed, but cannot switch from being informed to being uninformed. When the parent individuals become informed at time t, they have a chance to affect the child individual i according to the probability Pi(t). If Pi(t) is the greater than the predefined spreading threshold Ui, the individual i will become informed, otherwise, it keeps uninformed.
The rationale of this formalization is based on the classical threshold mechanism of collective action: a consumer does not feel social pressure if only a few people around him or her behave in a particular way. But once these people reach a certain number, then he or she suddenly decides to change his or her mind and behaves differently.
14
The spreading threshold is a random number drawn from a uniform distribution:
After the parent individuals first have an impact on the individual i, and the individual i remains uninformed, the impact will still be stored inside the individual i in the following period, but the probability of the parent individuals affecting the child individual will exponentially decrease from time tz. This has been testified in the real recommendation network. There it was found that the probability of infection decreases with repeated interaction. 31 Also, the probability of purchasing a product increases with the number of recommendations received, but quickly saturates to a constant and relatively low probability. The spreading probability of each person in the social network is a constant that is independent in the entire period in which the advertisements circulate. Therefore, Pi(t) can be substituted by:
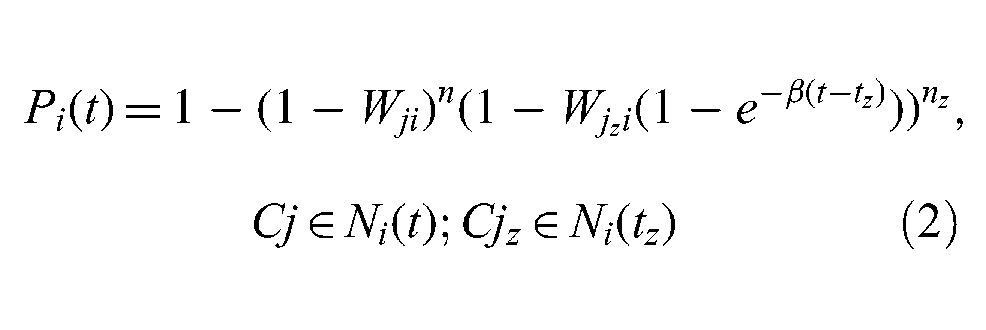
where Cjz denotes an individual who is informed at time tz and belongs to Ni(tz) that is the set of individuals informed at time tz;
4. Maximizing the performance of diffusion
Unlike mass advertising, viral advertising spreads advertisements through social networks. As a result, it is important that initial advertising targets be carefully selected: How ought one to select the most suitable initial advertising targets to maximize the performance of viral advertising within a social network? This question can also be described as how best to select a subset S of nodes in a graph
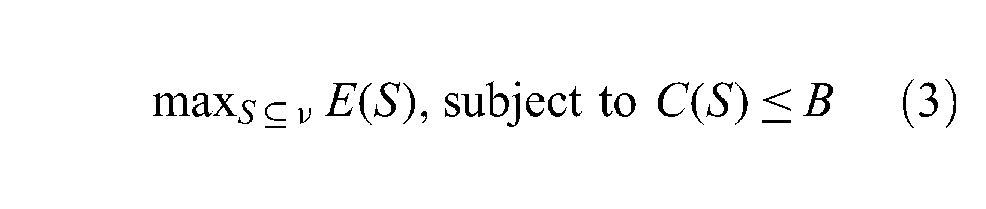
where
In viral advertising, the advertising performance score E refers in particular to the final number of individuals that have been informed. We ignore the advertisement spread cost between two people 17 because people easily and cheaply spread information anytime and anywhere via the internet.
Our model is NP-hard in order to determine optimal performance-function maximization. The optimal solution for performance maximization can be efficiently approximated to within a factor of
Start with
For
Choose a node
Set
End
The algorithm stops once it has selected
5. Simulation design and methods
In our social networks, each node is an individual person and each edge is an interaction with each other to spread advertisements. 37 The model is simulated using Monte Carlo simulation procedures, 38 an interactive process in the internal procedure; for a new run, all of the parameters and statuses must be initialized again. The simulation platform is built using Python and other open-source software packages.
In order to uncover the dynamics and evolution of viral advertising in social networks, we ran our model through a series of virtual experiments 38 The simulation model can be regarded as a test-bed in which we can change parameters according to our requirements, before observing the changes that occur as a result of those shifting parameters. Thanks to these virtual experiments, we can also obtain some potentially useful implications for practitioners. As shown in Table 1, we designed three input parameters to control the run of the simulation model. In the simulation, we generated different network topological types using a network. 39 We used two types of networks in our experiment: the scale-free network, whose degree distribution follows a power law, 40 and the Erdős–Rényi random network, which is obtained by starting with a set of n entities and adding edges between them at random. 41 We examine the performance of diffusion using the ratio of the final informed number of nodes and the cascading time that indicates the steps to diffuse all of the nodes in the networks.
Input parameters of the computational model.
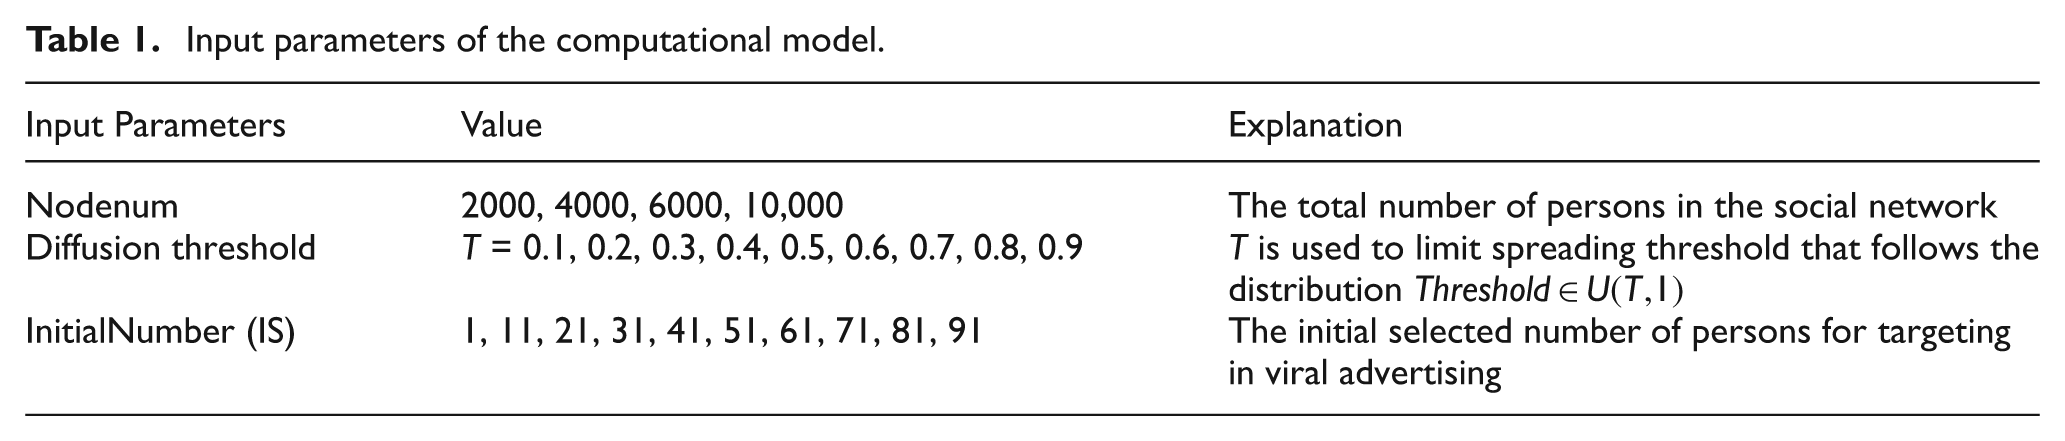
In the real world, many empirically observed networks – such as the worldwide web, the internet, citation networks and some social networks – appear to be scale-free. 40 To compensate for this, we first analysed the results in scale-free networks, before comparing those results to different network topological types. We chose nodenum, the initial number of selected people and the diffusion threshold, as the initial parameters and randomly ran each virtual experiment under a certain condition independently for 100 repetitions. All the results of 100 repetitions in Monte Carlo simulations related to the given conditions were averaged. The final results dataset is huge, and is stored in a MySQL database in which the results data can be conveniently queried and statistically analysed.
6. Results of virtual experiments
By analysing the results of these virtual experiments, we have been able to study the dynamics of viral advertising while also mapping a series of practical implications that might help policy-makers. In the following experiments, we use the preferential attachment model to generate scale-free networks, 40 where the number of nodes and the number of edges added to each time step are used to set the parameters. Figure 2 shows an example of a scale-free network with 2000 nodes. To display the unique diffusion route between two nodes, the generated multiple edges have been removed.
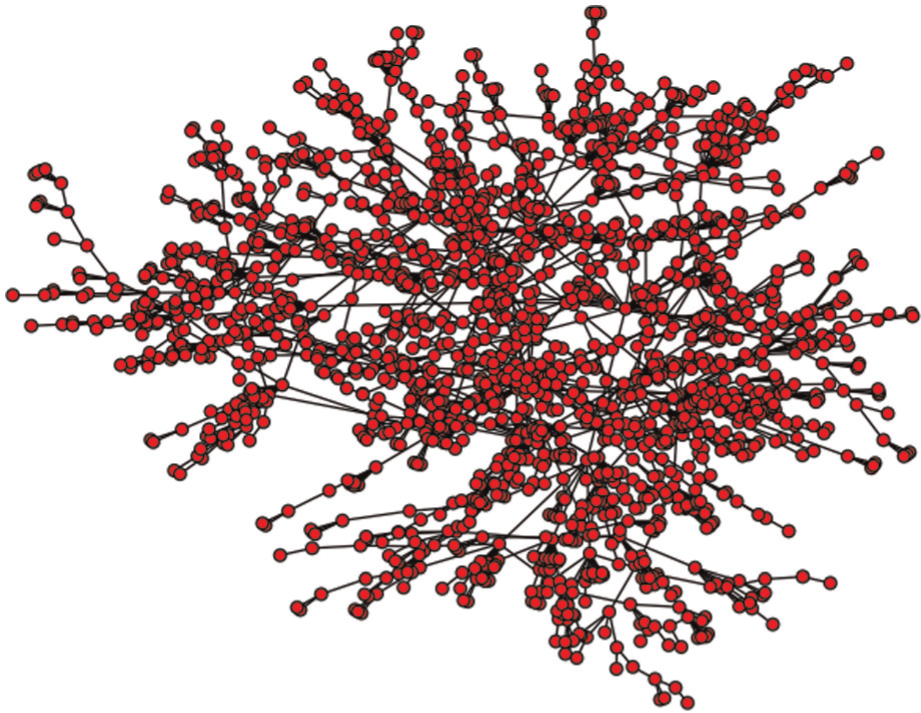
An example of a scale-free network with 2000 nodes.
6.1. Dynamics affected by node size and density
Figure 3 shows the landscapes of viral advertising in a social network with a different node size. We initially selected 1 to 100 persons as the targets for maximizing the performance of viral advertising, and observed the dynamics of diffusion when the diffusion threshold ranged between 0.1 and 0.9. The ratio of diffusion is increased with an increase of the initially selected number of nodes and a decrease of the diffusion threshold. Interestingly, if two social networks have the same density, advertisements will spread faster in the network with a smaller size but a larger diffusion threshold. However, if we initially select a larger number of nodes and a smaller diffusion threshold, the advertisements nonetheless spread to almost all of the nodes in the social networks with a differing number of nodes. This suggests that the final ratio of diffusion does not depend on the node size.
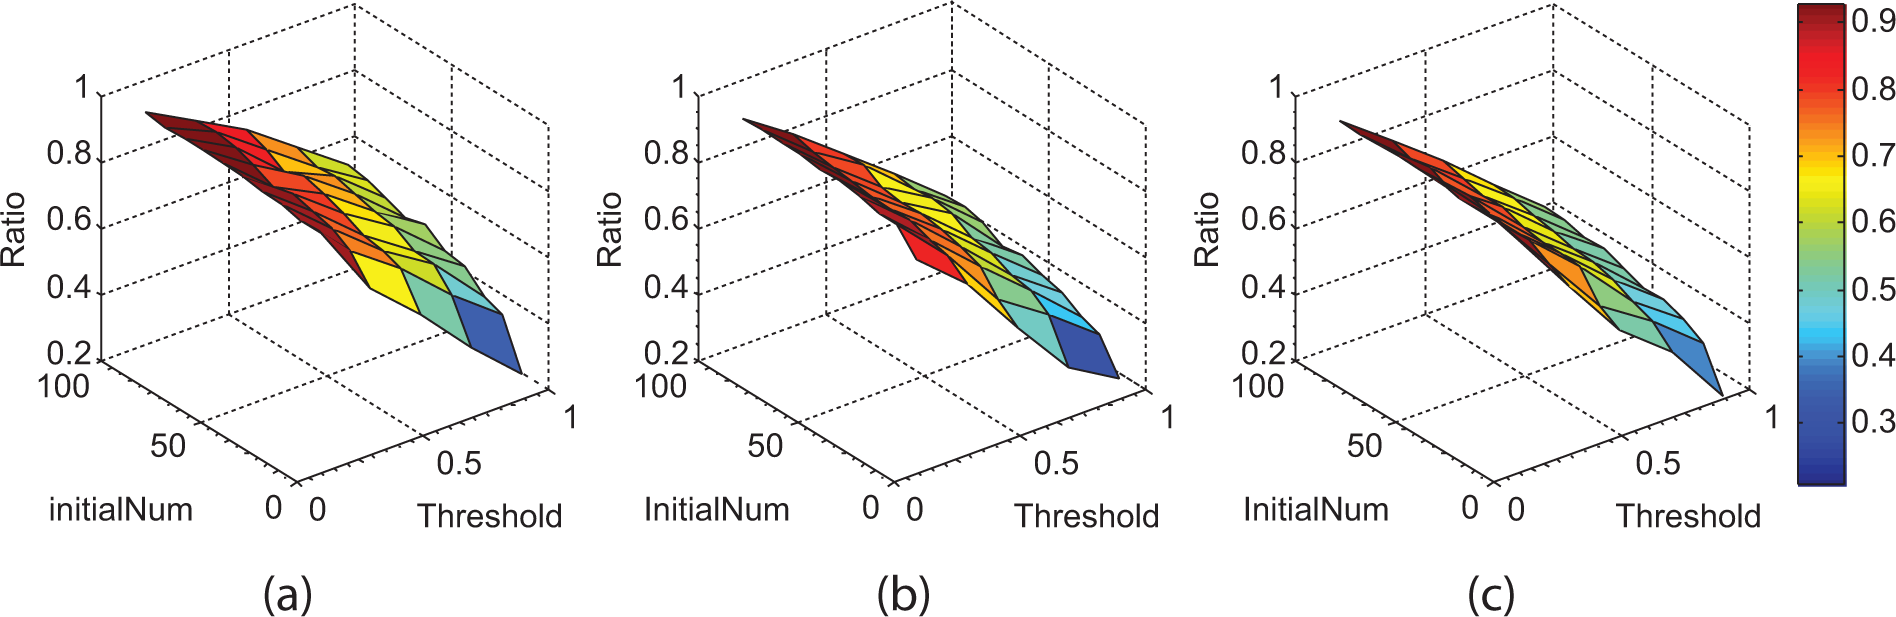
The landscape of diffusion in terms of diffusion threshold and the number of initial selected nodes. (a) Nodenum = 2000; (b) nodenum = 6000; (c) nodenum = 10,000.
These three networks have a similar density but different links that are proportional to the node size. More links in a social network mean that there are more ways to spread advertisements. The network with the largest number of nodes would generate more links between these nodes in order to keep a density similar to other networks, and it is more likely to spread advertisements to a larger number of nodes in a given social network. In highly connected networks, the advertisements spread easily: when a node is informed, one or more of its neighbors, in all likelihood, will also be informed or will adopt the advertisement; from there, the diffusion continues. Dodds et al. 42 observed the same phenomenon in the spread of disease by investigating a real dataset. It is worth observing that, in reality, the spreading behavior of advertisements is very similar to the spreading behavior of diseases (or viruses); research into viral advertising could thus benefit from early epidemiological research 26 in both theory and practice.
6.2. Dynamics affected by diffusion threshold
Figure 4 shows that the final ratio of informed numbers decreases with an increase in the diffusion thresholds of social networks with differing numbers of nodes (nodenum). By increasing the initial number of selected nodes, the curve tends to become a line. In a network with a larger node size, the line is straighter, when initially selecting more than 41 nodes. The slope of this line approximates to 0.6 in a network with 10,000 nodes, and the lines corresponding to an initial selection of more than 41 nodes seem to collapse onto each other. That is, using the smaller diffusion threshold, the initially selected number of nodes becomes less and less important. When the threshold equals to 0.1, no matter how many of the nodes are initially selected, almost all of the nodes will eventually be informed. Furthermore, the linear relationship between diffusion threshold and the ratio of eventually informed nodes, according to this line, makes it easier in viral marketing to select the diffusion threshold in terms of the final attainment of diffusion.
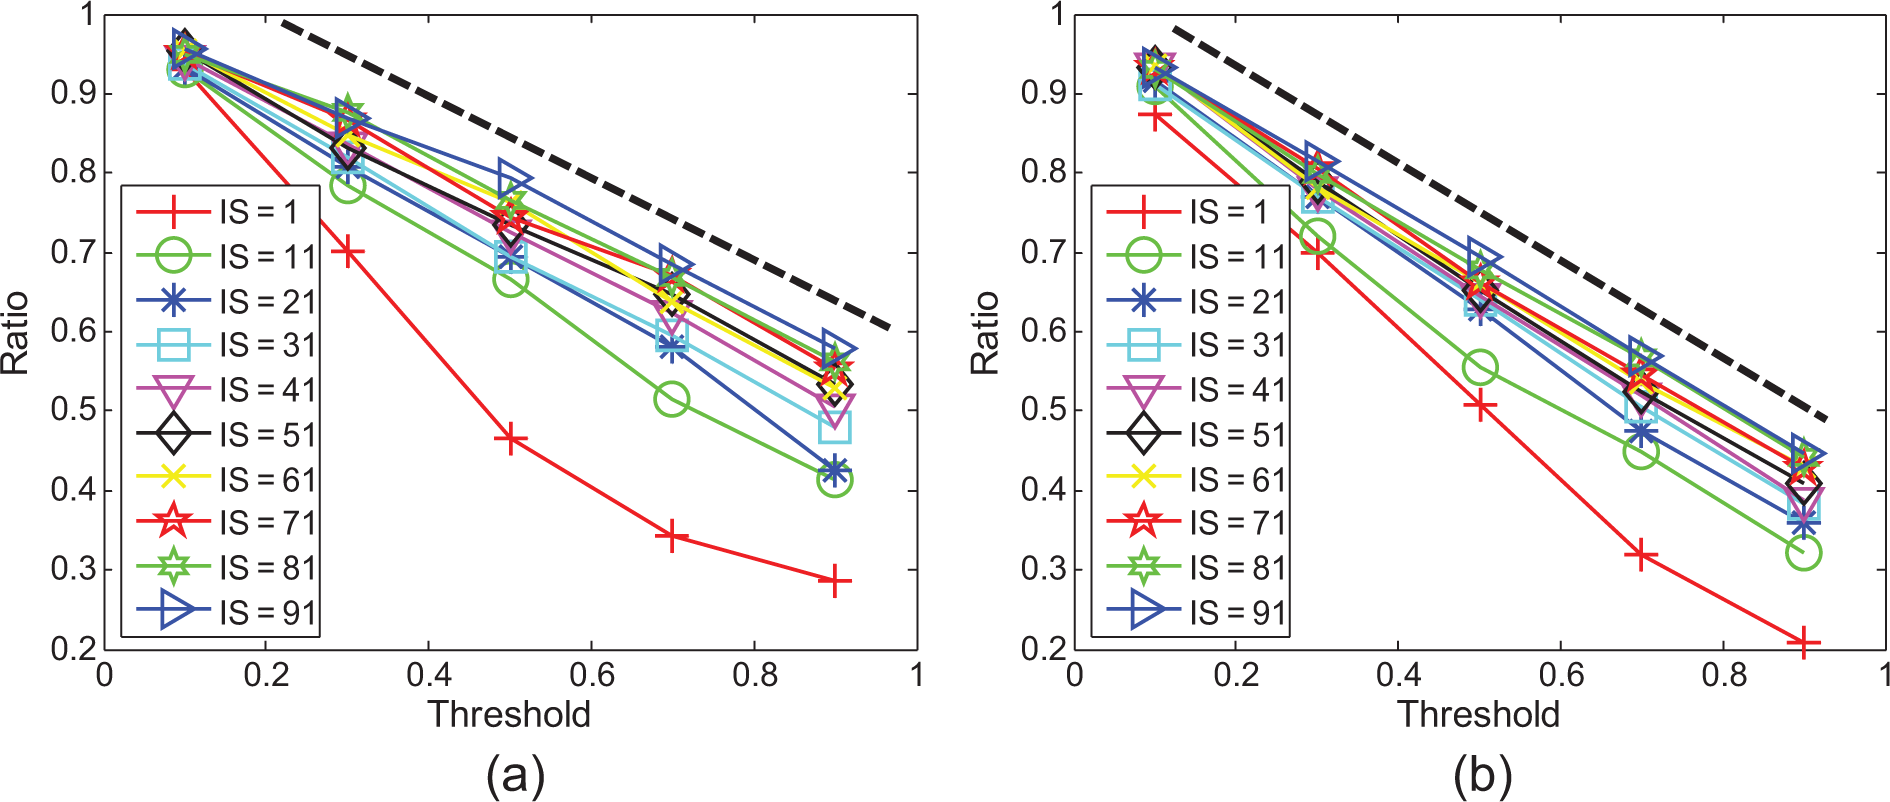
The ratio of final informed number of nodes as the function of the diffusion threshold. (a) Nodenum = 2000; (b) nodenum = 10,000.
The above observation forces us to ask another question: How ought an advertiser to select the suitable diffusion threshold by mass marketing in order to control spreading tolerance in viral advertising? As shown in Figure 5, we used a network of 2000 nodes with greater density by increasing and the number of edges to add in each time step in the BA network generation model. 40 Interestingly, the majority of curves increases significantly when the thresholds decrease from 0.9 to 0.8, and increase only slightly when the threshold is smaller than 0.8. This happens dramatically at the point A of threshold = 0.8 for the curve of selected-number = 1, and shows that after a certain point A the advertisement will spread to a very large number of persons and even to all the persons in the social network. Gladwell 22 called this point A the ‘tipping point’ at which little things can make a big difference, defining it as a sociological term: “the moment of critical mass, the threshold, the boiling point.” Therefore, in practice it is necessary to combine mass marketing with viral advertising whenever the initial number of selected nodes is varied under a limited budget; discovering the tipping point is also therefore helpful in uncovering the optimal point of mass marketing that can indeed promote viral advertising.

The tipping point in the process of diffusion.
Figure 6 shows that the final ratio of informed nodes increases with an increase in the number of initially selected nodes in social networks of differing node sizes. In the beginning, initially selecting more nodes can help an advertisement spread to a larger number of nodes. However, the strategy of continually increasing the initially selected nodes plays less of a role in diffusing an advertisement than might be expected. After initially selecting a certain number of nodes at the beginning of a viral advertising campaign, we are unlikely to improve the performance of diffusion by increasing the number of initially selected nodes. This phenomenon is more dramatic when using a smaller threshold. Especially when using a threshold of 0.1, it seems that selecting one node is already enough, because it is not very useful to increase the initially selected nodes for diffusion. In these curves, we can find a value of In (i.e. initially selected nodes) across different thresholds, as denoted by a dotted line in Figure 6. In the network with Nodenum = 2000 and 10,000, this value approximates to 11 and 21, respectively. Selecting nodes less than this value seems more effective in triggering diffusion. For example, if we set the threshold to 0.9 in a network with 2000 nodes, and initially choose 11 nodes, advertisements will spread to about 40% of the nodes. However, if we initially select more nodes, increasing the number from 21 to 91, only 10% more nodes are eventually informed.
The ratio of final informed number of nodes as the function of the initial selected number of nodes. (a) Nodenum = 2000; (b) nodenum = 10,000.
Obviously, by decreasing the diffusion threshold we can improve the final ratio of informed persons (i.e. the performance of viral advertising will be improved). Importantly, diffusion threshold represents the spreading tolerance between a pair of persons. According to this model, if the attractions of an advertisement from his or her friends are beyond his or her tolerance, he or she would be informed and would likely adopt and spread the advertisement too. The effect of mass marketing is to reduce the spreading tolerance of all of the persons in the social network. In fact, combined with mass marketing, viral advertising can utilize the least initial selected numbers to attain the most advertising performance, thus attaining the optimal performance and saving money at the same time. As a result, we can conclude that it is most effective to use mass marketing first, before deploying viral marketing techniques.
Our simulation model thus, on the one hand, can help to obtain the optimal point of the combination of mass marketing and viral advertising; on the other hand, it can help to obtain the most suitable number of initially targeted persons for viral advertising, which can save money and maximize performance.
6.3. Dynamics based on cascading time
During the dynamic process of spreading advertisements, the spreading might stop at certain cascading steps (final cascading time) because other persons cannot be activated to be informed any more or all of the persons have been informed. Figure 7 shows the relationship between cascading time and diffusion threshold, with the initially selected number. Obviously, the cascading time decreases with an increasing in the diffusion threshold. As noted in the previous sections, mass marketing can help to decrease the diffusion threshold. Thus mass marketing helps to promote the spread of viral advertisements over a longer period of time; as shown in Figure 5, if mass marketing allows the diffusion threshold to reach the tipping point, then the spread will continue longer and possibly only stop when all of the persons have been informed. As we can see in Figure 7, with an increase in the number of initially selected, the tendency of cascading time rises up but gradually drops down when the advertisements have finally spread to all of the persons. Therefore, in order to keep advertisements spreading continuously, it is necessary to increase the initially selected number if the spreading tolerance is too high (i.e. if the diffusion threshold is too high), but it becomes less necessary with the decrease of spreading tolerance by mass marketing. In effect, there should be a tradeoff between mass marketing and viral advertising.
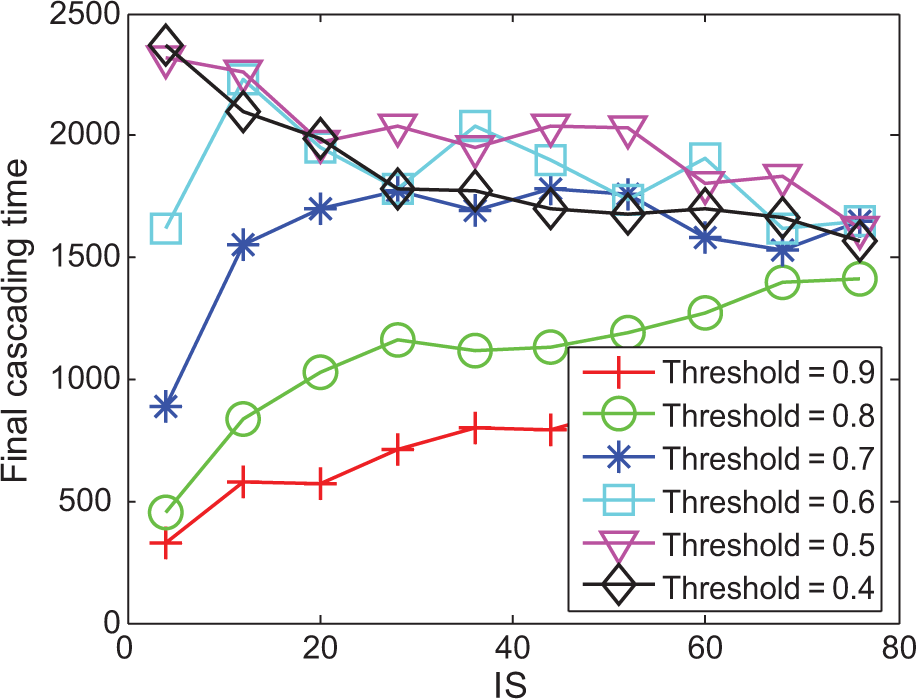
Final cascading time as the function of initially selected nodes (IS) in viral advertising for using different diffusion thresholds in mass marketing.
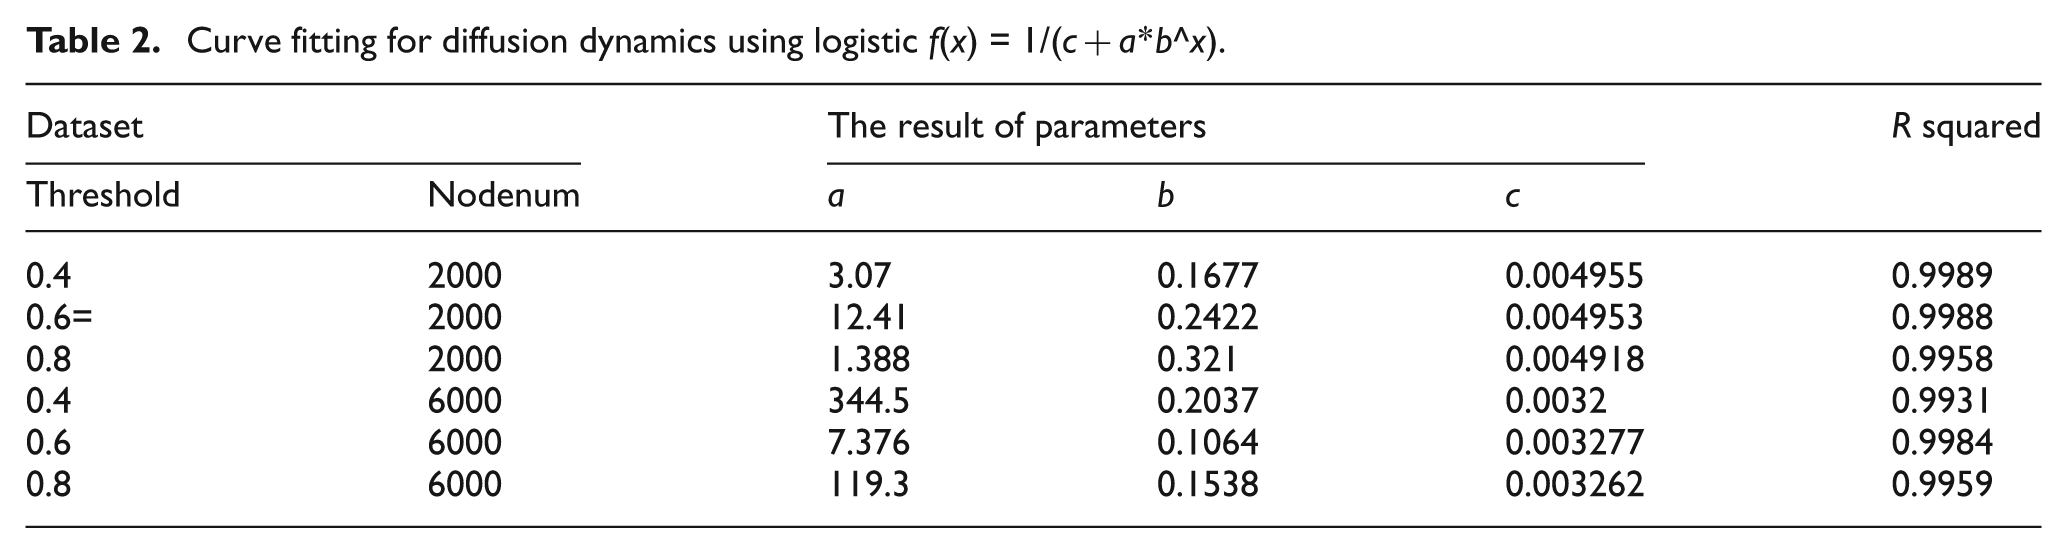
The next question is, what kind of shapes the dynamic process of spreading advertisements look like. As shown in Figure 8, the ratio of cumulatively informed numbers follows an S-shape 24 over the cascading time. At first, the informed rate is very low, and only a few members of the social network are informed. After a period of time, the rate of being informed will increase sharply until the peak of the bell-shaped curve has been reached. After that point, the informed number decreases. The cumulative informed number then spreads asymptotically to a saturation level, at which the maximum informed number is reached. At this point, the diffusion is complete. A large variety of diffusion models have been developed by researchers, reflective of different forms of the S-curve for diffusion process. These include a logistic or Gompertz equation as the classical description of the S curve, 43 but an nth degree polynomial equation 44 can also fit well with the spreading process. We used curve fitting to observe whether the dynamic process of spreading advertisements can fit the S-curve function and which mathematical equation fitted the process best. As shown in Table 2 and Figure 8, the dynamic process of spreading advertisements fit the logistic S-curve equation (f(x) = 1/(c+a*b^x)) very well We can therefore can use a logistic S-curve equation to describe and model the dynamic process of spreading advertisements in practice.
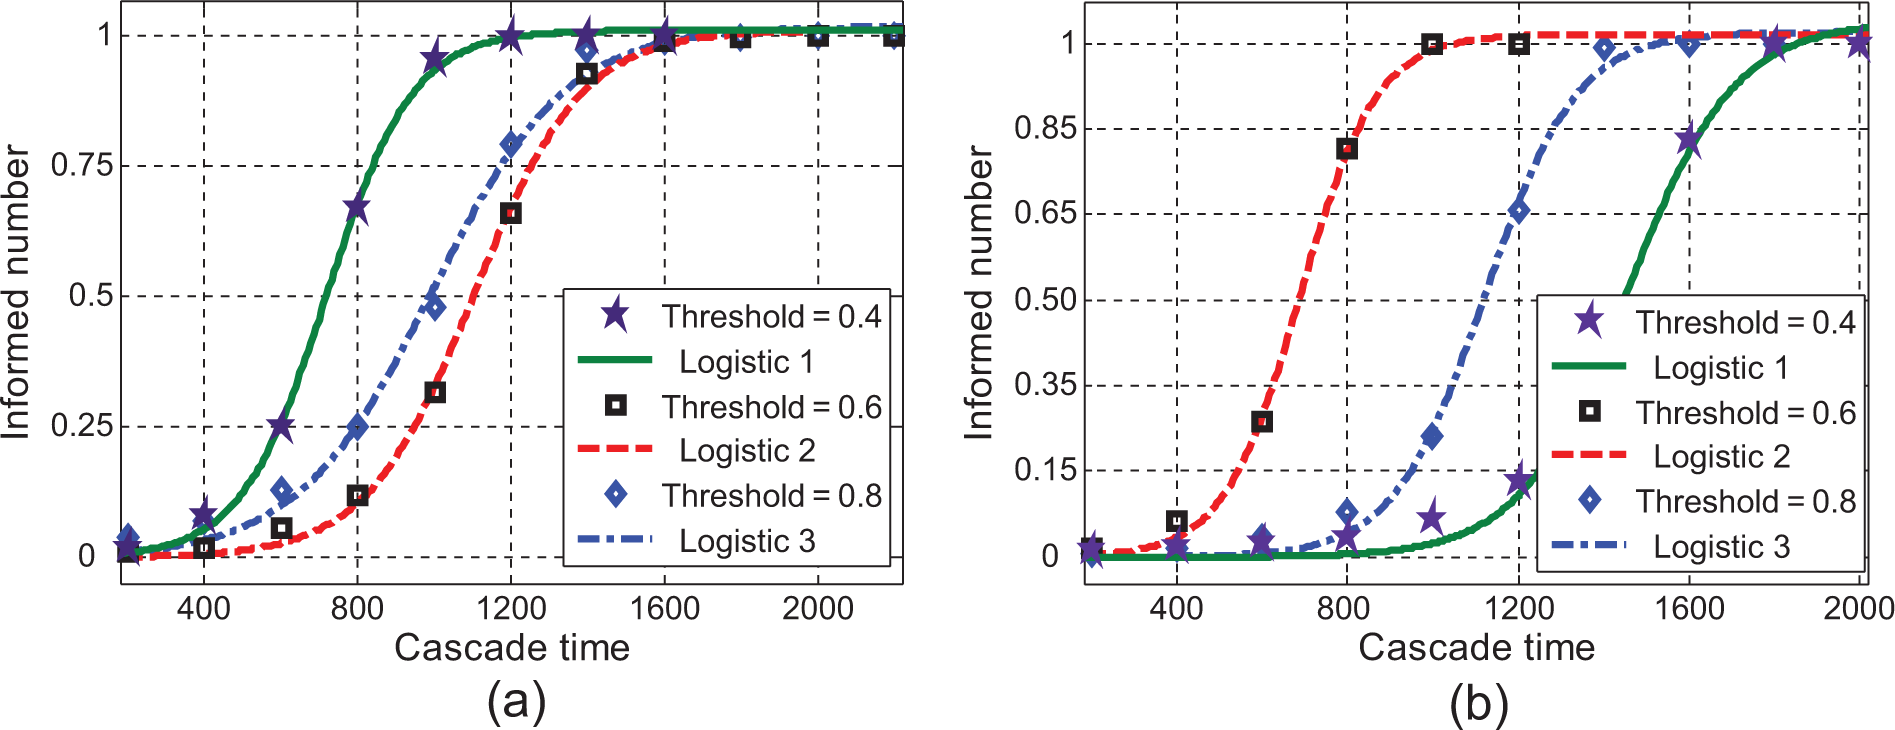
The dynamics of spreading advertisements. (a) Nodenum = 2000; (b) nodenum = 6000.
Curve fitting for diffusion dynamics using logistic f(x) = 1/(c+a*b^x).
6.4. Different policies of initially selected persons
In this paper, we used a natural greedy algorithm (see Section 4) to select initial targets for maximizing the performance and spread of viral advertisements. If we use heuristic measurements, such as the degree of centrality, to select initial targets, what then are the differences compared with the natural greedy algorithm? This section observes and compares different selection policies. Betweenness 45 is a centrality measure of a vertex within a graph. Vertices that occur frequently on the shortest paths between other vertices have higher betweenness than those that do not. Degree centrality 45 is defined as the number of links incident upon a node (i.e. the number of ties that a node has). Degree is often interpreted in terms of the immediate risk for the node of catching whatever is flowing through the network. We also compare the random selection method with others. We first calculate the degree and betweenness for all the nodes (persons) in the social network, and rank them to select the first ten top persons as targets By running virtual experiments to simulate the spreading of advertisements at the different diffusion thresholds from 0.9 to 0.1, we draw the statistical box plot graphs shown in Figure 9. Obviously, the natural greedy algorithm has the best performance in all the networks with different densities. Interestingly, the centrality degree obtained the second-best performance on average.
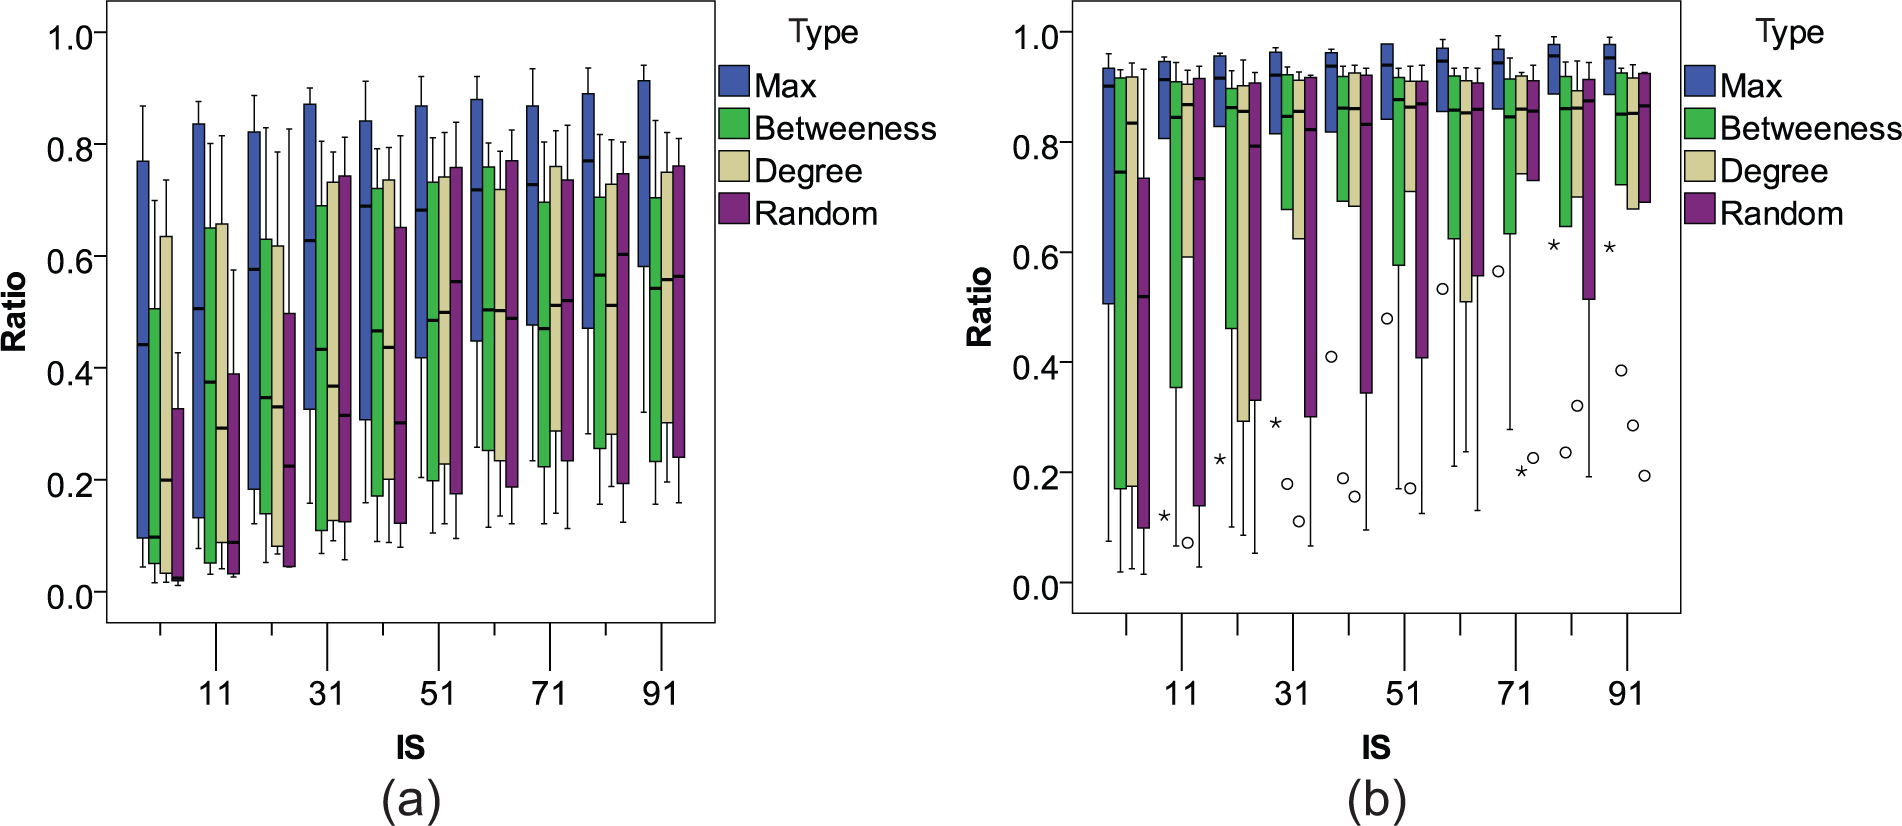
Box plot graph for viral advertising by different selection policies. IS: initially selected nodes. (a) Nodenum = 2000; (b) nodenum = 6000.
In practice, using heuristics measurements such as centrality degree to target the initial persons for advertising is faster than maximization algorithms, such as the natural greedy algorithm, because maximization is an NP problem and maximization algorithms can only be used to find approximate optimal solutions. Sometimes, the practitioners are not very strict about optimal selections, and they want faster and cheaper targeting methods that can be applied to an unknown social network structure. At this time, heuristic measurements are helpful for targeting initial persons in viral advertising, and can achieve a similar performance to those who use optimal algorithms. Moreover, in practice, it is very difficult for an advertiser (or an attacker in the context of network disruptions) to get the topology of a social network, 46 therefore such heuristic measurements allow marketers to locate more suitable initial customers both more easily and more cheaply. Furthermore, under some conditions, the most optimal solution is the most natural heuristic solution that picks the nodes in the social network with the highest degree. 34 This has, in fact, also been proven through an analysis of real data. 20
6.5. Dynamics in networks with different topologies
In this section, we ran simulations in different networks that have different topological structures, before comparing them with scale-free networks. We generated different network topological types using NetworkX 39 and input them into our simulation platform. As can be seen in Figure 10, the relationships between the ratio of the final informed number and initially selected number are investigated. At the same level of diffusion threshold, node size and density, scale-free networks perform best at spreading advertisements while small-world networks perform worse. Although these three networks have the same density and node size, meaning the same links in the networks, their network topologies are different: in the scale-free network, persons share the links more evenly; in the small-world network, persons have stronger connections with their neighbors than with other persons, and there exists more cliques than in the other two networks. 45 The spreading of advertisements between cliques is difficult, due to the lack of ways to spread the advertisement, so that in small-world networks it is harder to spread advertisements to all the persons other than to those in the other two networks.
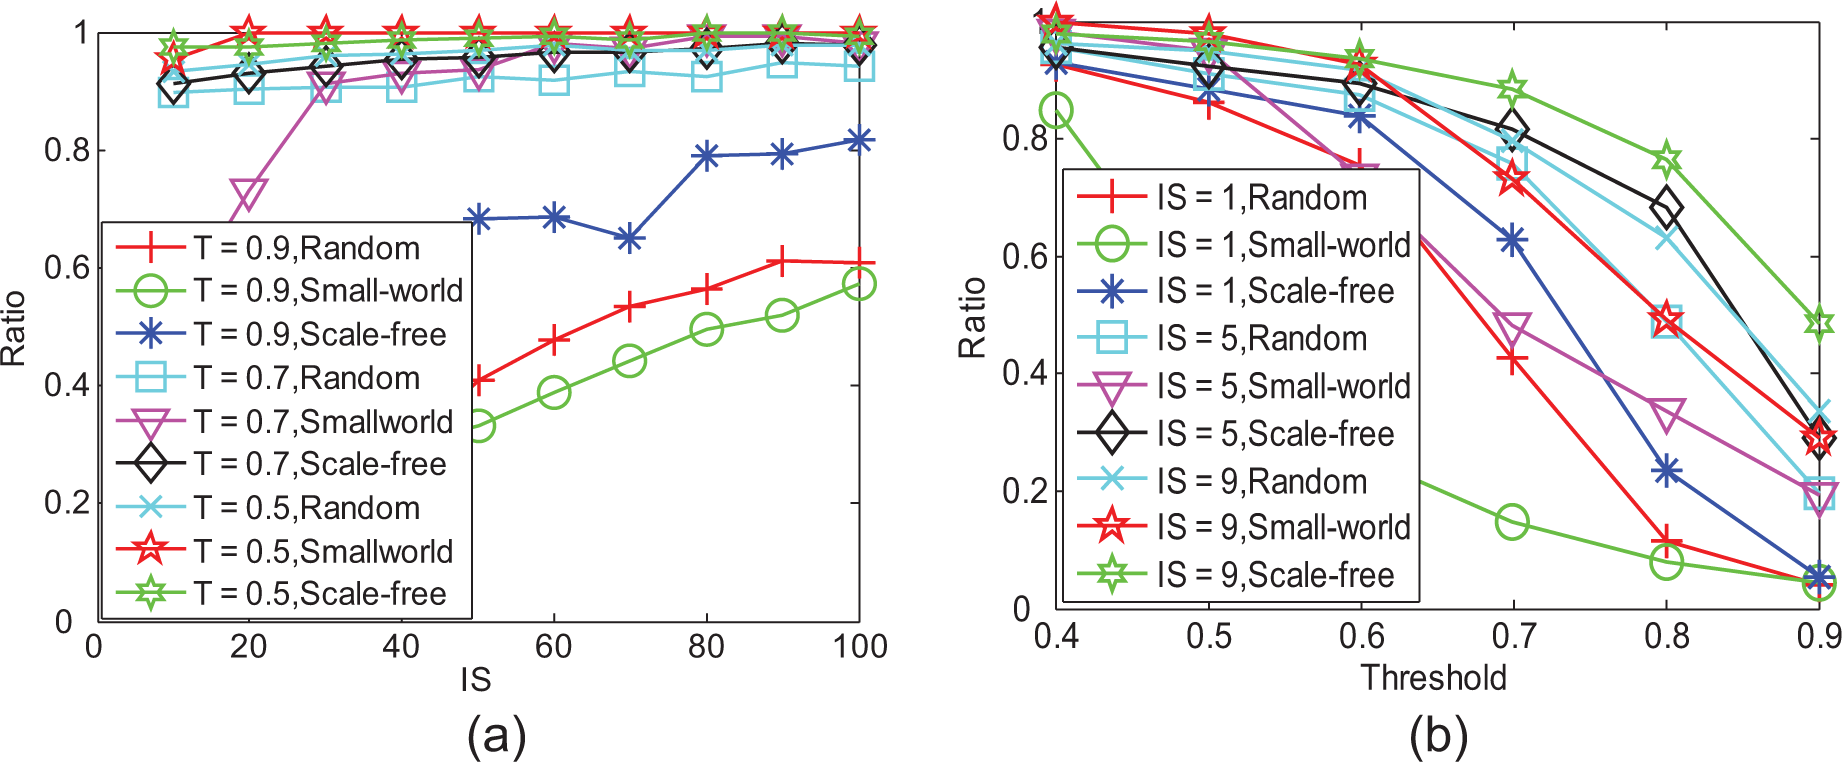
The ratio of final informed nodes as the function of (a) initial number (IS), (b) threshold in networks of different topologies.
7. Simulations in a real online social network
In order to practically test our model and simulations, we used a real dataset as a case study to examine the strategies of combining viral advertising and mass marketing in e-commerce. This real dataset is from Renren.com, the dominant college social-network service in China. We selected a whole college network of some 44,419 nodes with 803,987 links at the beginning of January 2008 (data1); at the end of February 2008 there were 47,546 nodes and 876,983 links (data2). The data1 and data2 sets both follow power-law degree distributions according to our investigation. We sampled a subset of 603 persons (data3) from data1 and data2: first, we randomly obtained a small fraction of the user IDs; second, we used these user IDs to do a snowball sampling by breadth-first search (BFS), which can conserve the power-law nature in the degree distribution. 47 All three networks are therefore scale-free.
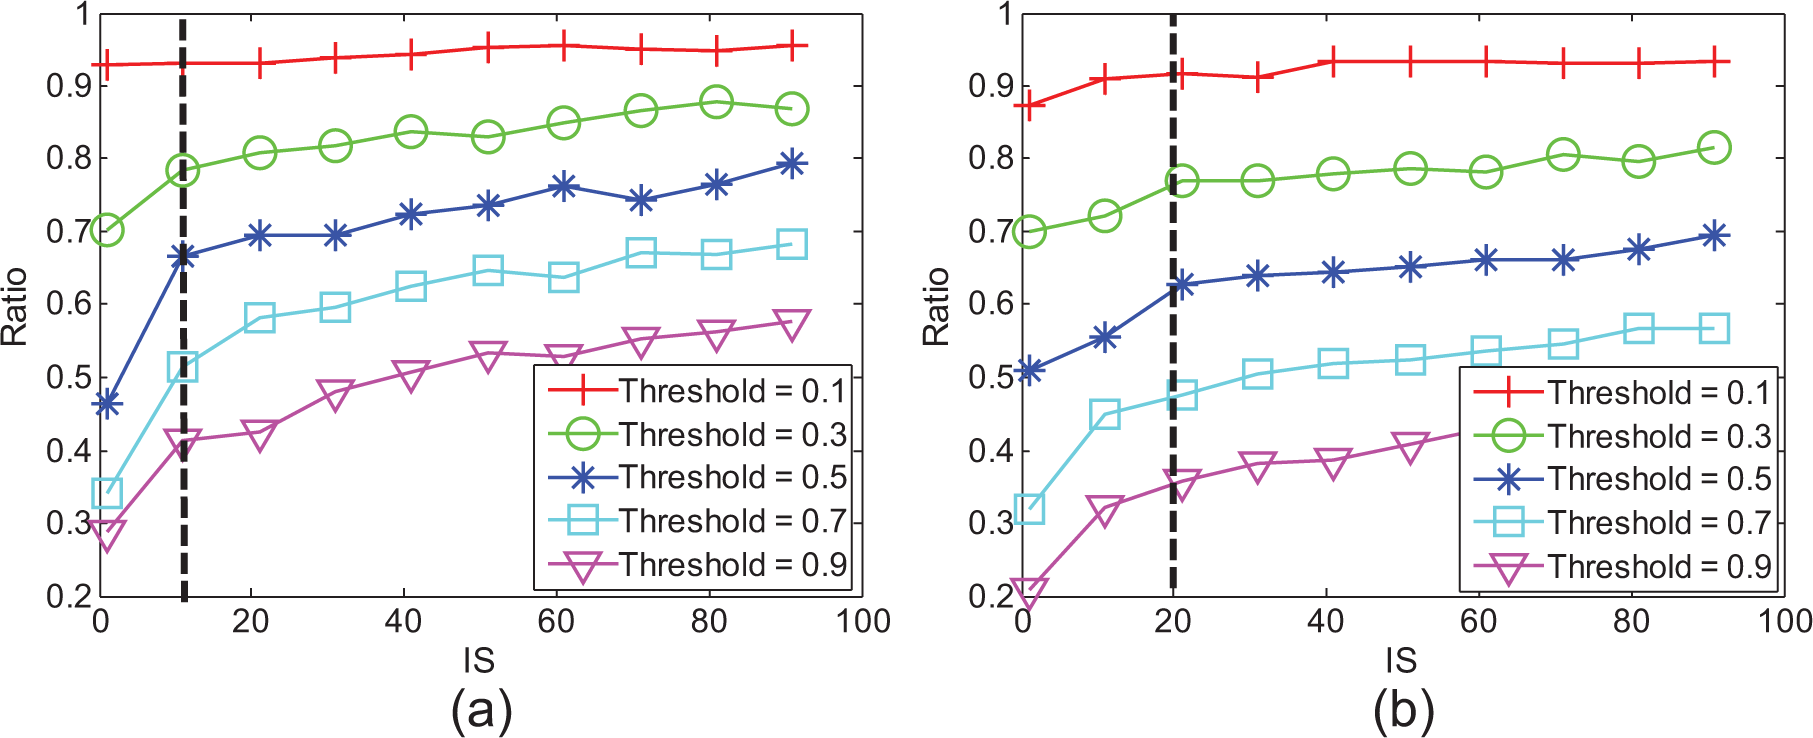
Based on data3, we changed the diffusion thresholds to represent different mass-marketing policies during viral advertising, and ran the simulations with 100 repetitions for each threshold and calculated the average of the final informed number. In this case, the density of the social network was low and some nodes do not connect to one another. As a result, there are not enough ways for spreading advertisements to all the persons if we set the maximum initially selected number to 20 under the budget B that is a constant. Figure 11 shows that increasing the initially selected number does not significantly increase the eventual number of informed persons. Also, by decreasing the diffusion threshold from 0.8 to 0.7, one can increase the performance of eventually informed numbers larger than decreasing the diffusion threshold from 0.9 to 0.8. The pair of curves (threshold = 0.9, threshold = 0.8) are close to each other, and the same phenomena happened in the pairs of (threshold = 0.7, threshold = 0.6) and (threshold = 0.5, threshold = 0.4) curves. Thus, decreasing the diffusion threshold to 0.2 – like decreasing it from 0.9 to 0.7 – is significant in this case. Furthermore, in viral advertising, as shown in Figure 12, using an optimal algorithm to select the initial set of informed nodes is best, and using degree is also good in performance in terms of the final ratio of informed nodes.
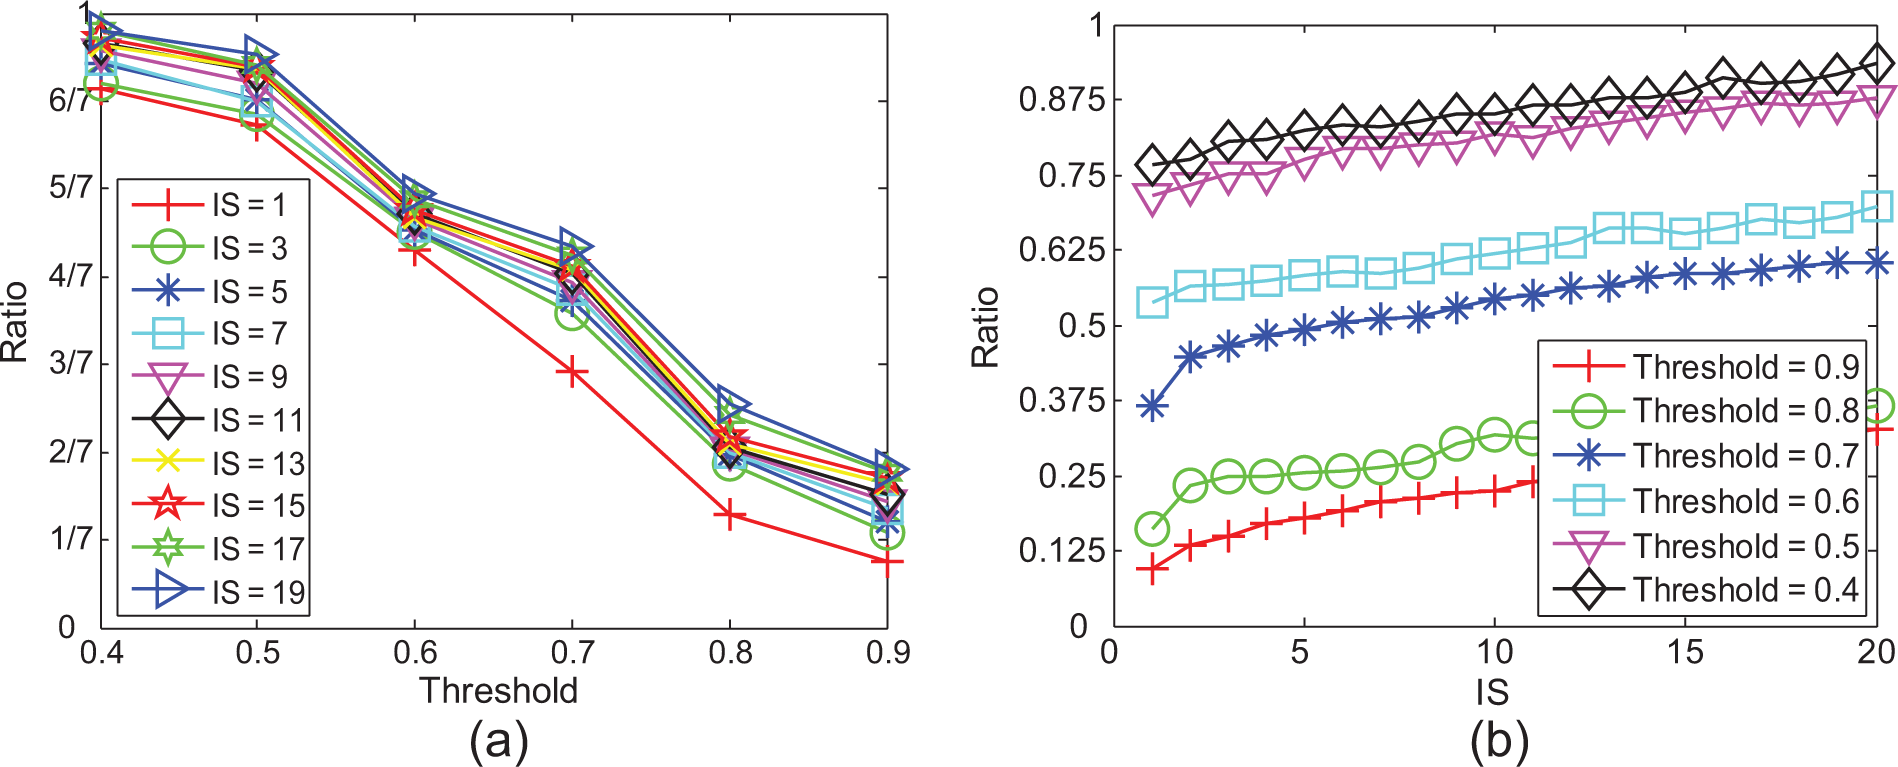
The final informed number. (a) Threshold, (b) initially selected number. Nodenum = 603, the maximum number of initially selected nodes (IS) = 20.
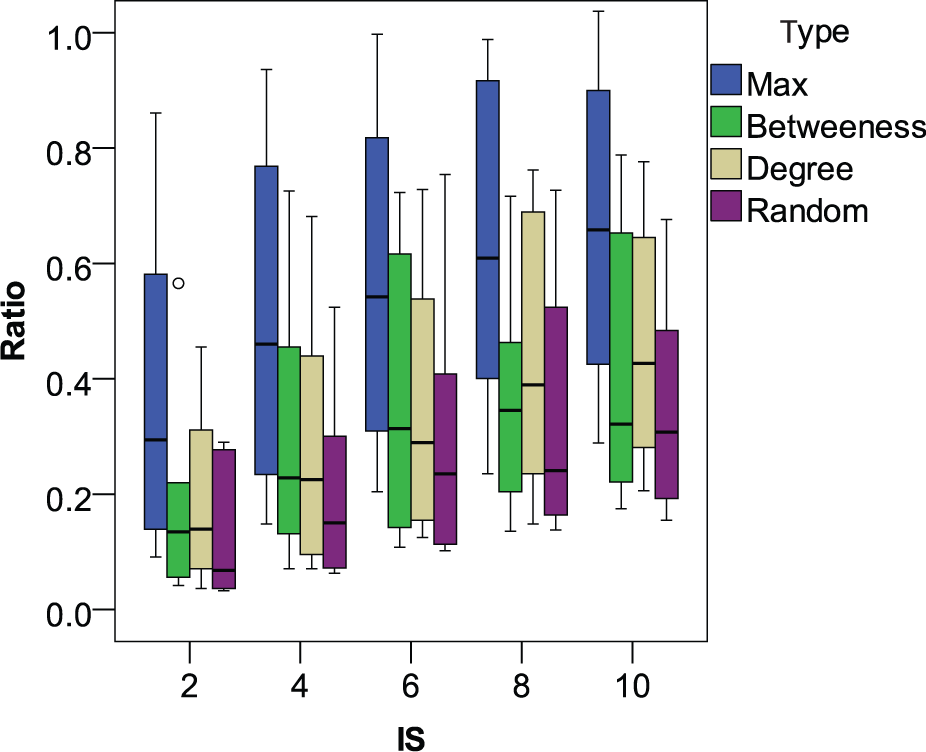
Different selection policies of initial informed nodes in real network. IS: initially selected nodes.
Therefore, the best solution in this case is to combine mass marketing and viral advertising: first, invest money to reduce the diffusion threshold by mass marketing; then, use an approximate maximization algorithm to choose one person as the initial target for viral advertising, and save the additional money to invest in mass marketing. In mass marketing, reducing the diffusion threshold one unit more than the usual policy of mass marketing – that is, reducing the diffusion threshold one unit every time – would help to increase the spread of a given advertisement. At first, when choosing the initially informed nodes, it is better to apply a maximization algorithm, though selecting by degree is an alternative way when the entire structure of a network is unknown. In reality, thresholds are also affected by the most determinants of individual behavior, e.g. background characteristics, social class, education, occupation and social position. 14 Thresholds are situation-specific as well, and thresholds may also change in the course of a situation. Thresholds are behavioral dispositions, and therefore they are difficult to measure with confidence before the behavior actually occurs, but they can be changed as a whole using mass marketing.
8. Conclusions
In this paper we have modeled the spread of viral advertisements using social networks. Indeed, viral advertising is attractive: many marketers regard it as a free lunch, but much of it has had, at best, limited success. 4 One of the reasons for this is that the mechanism of viral advertising has not yet be fully and clearly understood. In order to observe and understand the dynamics of viral advertising, we applied Monte Carlo simulation procedures and ran a series of experiments both virtually and using a real dataset. The simulations showed their power by allowing us to observe and study the emergent phenomena on the macro level while changing parameters at the micro level.
To maximize the performance of advertising diffusion, we used a greedy algorithm to obtain the approximately optimal solution. In simulations, we found:
It was shown that diffusion is more efficient and widespread in scale-free networks than in random and small-world networks.
Furthermore, in order to keep spreading continually, it is necessary to increase the initially selected number of nodes (persons) when the spreading tolerance is too high (i.e. when the diffusion threshold is too high). However, it becomes less necessary to increase the initially selected number of nodes when mass marketing has decreased the spreading tolerance. Therefore, mass marketing and viral advertising should be combined, given the limits of a particular budget.
These virtual experiments also show that the natural greedy algorithm performs best, while degree performs second-best, on average. The heuristic solution that picks the nodes in the network with the highest degree is very close to the optimal solution. Therefore, degree might be an alternative method for choosing an initial set of nodes, especially when the entire structure of the network is unknown.
Nevertheless, there remains one limitation to our model. The speed of the greedy algorithm used to maximize the performance of viral advertising is too low for a massive dataset. This is the reason that we downloaded the whole dataset of a real online network and sampled a subset for experiments in practice. In the future, the key goal is to speed up the maximization algorithm and improve the availability of our model. For future work, one interesting direction would be to study the diffusion of competitive and exclusive products, or competitive yet non-exclusive products. In addition, our simulation system is built based on different program languages and tools. Therefore, successful integration will also be very important in building a real-time decision support system for viral advertising.
Footnotes
Funding
This work was supported by the China National Natural Science Fund (grant numbers 71101059, 71071065 and 71203166) and the China Postdoctoral Science Foundation (grant number 201104436). This work was also supported in part by the US National Science Foundation (grant numbers IIS 0755405 and CNS 0821585).