
Abstract
This paper presents a simulation–optimization model for tandem G/G/K queuing systems with infinite capacity considering reneging and server breakdowns. In this problem, the entities that enter each queue after a certain amount of waiting time renege from the queue. Moreover, each of the servers may break down based on the failure rates and will be repaired immediately according to the repair rates. Owing to the complexity of these systems, the OptQuest approach that combines the scatter search (SS) and tabu search (TS) algorithms is employed to determine the optimal number of servers in each queue according to the capacity of resources as well as budget constraints. The main objective of this optimization is to minimize the total time in the system by keeping the average waiting time in each queue below the allowable waiting time. Finally, 20 distinct samples of tandem G/G/K queuing systems are used to evaluate the validity of the proposed simulation model and the optimization algorithm. To the best of our knowledge, this is the first study that both simulates and optimizes tandem G/G/K queuing systems by simultaneously considering reneging and server breakdowns such that budget constraints are satisfied.
1. Introduction
Reneging is a common and significant phenomenon in actual queuing systems that affects system performance. Based on the available literature, there are few studies in the field of tandem queuing systems with respect to the reneging. Moreover, the role and impact of server breakdowns in many practical queuing systems and their performance is undisputable. On the other hand, the majority of the multi-server queuing systems in the real world are faced with budget constraints for resource allocation. Therefore, while taking into account the mentioned items and owing to the importance and general application of tandem queuing systems in many fields, the main motivation of this study is to simulate and optimize such systems with an emphasis on reneging and server breakdowns according to the system’s constraints and desired targets. It is worth mentioning that, based on previous works and to the best of our knowledge, this is the first study that simultaneously focuses on reneging and server breakdowns in the tandem queuing systems by referring to budget constraints.
1.1. Tandem queue
The word tandem refers to an arrangement of items in which the items are linked up one behind the other, all facing in the same direction. In a tandem queuing network, there are multiple job stations one after the other, and an arriving customer visits each job station before the departure from the system. O’Brien, 1 Grassmann and Drekic, 2 Suzuki, 3 etc. considered the model of tandem queues. Utilizing the concept of reneging and jockeying, Chandramouli 4 also conducted a study of the steady-state behavior of a queuing system where two bi-tandem channels are connected in tandem with a shared channel. Shanthikumar et al. 5 described the optimal number of servers in tandem queue with blocking. Ermakov and Krivulin 6 presented series and parallel algorithms for the simulation of tandem queuing systems with finite capacity to estimate the performance of these algorithms. Krivulin 7 applied the Max-Algebra approach for the simulation of tandem queuing systems with finite and infinite capacity in single-server mode with respect to the blocking. Tandem queue with blocking is suitable in modelling of data communications and production lines. Gómez-Corral 8 considered such a network comprising a sequence of two service classes with an infinite queue allowed before the first class and a middle queue allowed between them.
1.2. Reneging from queue
In real life, many queuing situations arise in which there may be propensity of customers to be disheartened by a long queue. As a result, after being in queue for some time, a few customers become impatient and may abandon the queue. This occurrence is called reneging from a queue. In 1957, the notion of reneging in queuing systems was presented by Barrer. 9 The significance of this system is observable in several real-life problems such as the hospital emergency rooms managing critical patients, the states, including impatient telephone switchboard customers, and the inventory systems that stock perishable products. Hence queuing systems with reneging were studied by many researchers.
Al-Seedy et al. 10 examined the M/M/C queue and solved the system unstable equations with respect to reneging and balking of customers. Wang et al. 11 evaluated the system performance to repair the machines in M/M/R queue and in this system the damaged machines enter the queue with probability b and then leave the queue without receiving any service after waiting time T based on an exponential distribution. Wang and Chang 12 studied the M/M/R queue with finite capacity and calculated the steady-state probabilities and the optimal number of servers with respect to reneging, balking of customers and failure of servers. Cochran and Broyles 13 made decisions about the emergency department capacity at the hospital and the increase of safety in patients with regard to the phenomenon of patient reneging before receiving treatment and visiting doctors. They offered an approximate reneging percentage by using the probabilities of balking in M/M/1/K queue. Al-Seedy 14 considered the steady-state probabilities in queues with the variable number of servers with respect to the concept of balking and reneging. Pazgal and Radas 15 compared the customers’ behavior for decision making about the balking and reneging. Martin and Pankoff 16 presented a model for customers’ decision regarding the reneging from queue, refusing to enter the queue (balking), and changing their queue (jockeying) after a certain period of waiting time in the G/M/C queuing systems. Shawky 17 in his study improved the analytical solutions for the probabilities of model for M/M/1/m/m queue with regard to the concept of reneging, balking and the presence of additional servers for long queues. Liu and Kulkarni 18 analyzed the M/G/s queue with respect to VQT (virtual queuing time) and the concept of customers balking and reneging.
1.3. Server breakdown
In the literature of queuing systems, most of the studies deal with the queuing systems where the service places have never failed. In practice, however, we frequently see the situation where service stations may fail and can be repaired. 19 There are several studies which work under this assumption. A comparison between two randomized policy M/G/1 queues was performed by Wang et al., 20 who take server breakdown and startup into account. Wang et al. 21 considered the supposition of server breakdown in the optimization problem of the T policy M/G/1 queue. In this system, the server needs a startup time before beginning of the activity. Li et al. 19 presented a model of the PH/PH/1 queue with regard to server breakdown and repair. Moreover, Choudhury and Deka, 22 in view of the server breakdown and repair, addressed an M/G/1 retrial queuing system in which there is an extra second stage optional service. In addition, Federgruen and So 23 provided optimal maintenance policies to minimize the average operating costs of the single server queuing systems considering server breakdown. Furthermore, there are other studies that have focused on the issue of server breakdown24–28
1.4. Simulation–optimization
Computer simulation is a potent instrument in assessing complex systems. Simulation models can be used as the objective function and/or constraint functions in optimizing complex systems. An even more influential technique for simulation examination, beyond parameterized simulation, is to use simulation–optimization to automatically discover the best value of one or more variables that we can control. Indeed, the optimization of simulation models converses with the state in which the analyst would like to find which one of possibly many sets of model specifications leads to optimal performance. In the literature, several studies applying the approach of simulation–optimization have been done in various fields.
Figueira and Almada-Lobo 29 provided an overview of the different simulation–optimization approaches. Xiao and Lee 30 combined the genetic algorithms with the concept of optimal computing budget allocation to improve the performance of simulation–optimization. Simulation–optimization for material handling networks in a coal mine has been presented by Nageshwaraniyer et al. 31 They applied the OptQuest package, which is embedded in Arena software, to solve the optimization problem. Merkuryeva et al. 32 presented a methodology based on combination of the response surface and genetic algorithm for industries with batch and semi-batch possess in multi-echelon supply chains. Korytkowski et al. 33 developed evolutionary simulation–optimization approach so that they could create near-optimal solutions for dispatching, and thus improve the performance of system.
Owing to the importance of queuing systems with reneging and server breakdown or server vacation in many real-life issues, and on the other hand, owing to budget constraints in assigning the maximum number of operators proportional to the capacity for each queue, in this study, we present a simulation–optimization model of tandem queuing systems by considering reneging and server breakdowns and according to the system’s limitations and desired targets.
This study is organized as follows: In Section 1 the notion of this study and previous studies in this field were reviewed, and then in the next section, description of the posed problem with details is presented. Section 3 provides a description of the methodology associated to this study including scatter search, tabu search and OptQuest. In Section 4, numerical examples and computational results are given to confirm the robustness of the proposed simulation–optimization model. Finally, Section 5 is dedicated to concluding remarks.
2. Problem description
In discrete simulation, there are two parameters: the first one contains parameters that are constant throughout the simulation (such as an arrival rate, service rate, failure rate of servers, etc.), the other type is variable (e.g., number of servers at each station), which can be quantified according to the definition of various scenarios and for each scenario, the simulation can be done. Finally, by comparing the results of different scenarios, the optimum solution for desired parameters can be obtained according to the specified targets. This method may be appropriate for problems of small size and low number of parameters, and the simulation time short, but with increasing dimensions of the problem, and the number of parameters, achieving an optimal solution based on the definition of different scenarios, takes a long time, and it is not affordable.
However, owing to the large impact and importance of the phenomenon of reneging for the performance of various systems, including production and service systems, as well as the impact of resource failure or vacation of servers for a given time period, in this study, we simulate and optimize tandem G/G/K queuing systems with respect to the reneging, server breakdowns and repairing. For this purpose, at first, the arrival, service, failure, and repair rates, as well as the maximum number of allowed servers per queue are entered into the network depicted in Arena software. Thereafter, according to the average waiting times obtained for each queue through the simulation networks, an approximation for the reneging time is considered. Consequently, for the first queue, 60% of average waiting time, which was obtained from the initial simulation model, is considered as the reneging threshold. Increasing the number of queues causes the reneging rate to be reduced. Hence, it can be perceived that the probability of reneging from the queue after the third queue becomes almost equal to 0 in the above samples. Therefore, for the second, third and fourth queues 70%, 80% and 90% of average waiting times were considered, respectively. For the next queues, the reneging threshold is considered in a way that the reneging rate is nearly equal to zero. After obtaining the reneging condition of the queue, the model of simulation by adding reneging assumption of the queue was improved, and the simulation model is run again. At the end of this stage, the average waiting time in each queue is reconsidered, given the reneging assumption.
In the next step, optimization of the simulated system is discussed using the OptQuest approach, which is a combination of two meta-heuristics methods including tabu search and scatter search. This optimization problem is designed and implemented in order to determine the optimal allocation of servers to each queue. The considered objective function in this problem is single objective, which has been defined to minimize the total time spent by each entity in the system to be serviced. The decision variable is the number of servers in each queue and can be defined as 1 ≤xi≤mi, where xi is a discrete variable representing the number of servers in the ith queue and mi is the maximum capacity of the resource (server) for the ith queue. The raised optimization problem consists of three categories of constraints. The first category of constraints is associated with the waiting time of entity in each queue. It is furthermore defined as the average waiting time in each queue. Moreover, it is kept below the considered upper limit. This constraint can be shown by the equation wq(i)≤Wi; i = 1, …, r, in which wq(i) is the average waiting time in the ith queue and Wi is the intended allowable limit for the ith queue. The second group of constraints is associated with the reneging percentage in the system and is defined such that the number of reneging in the system does not exceed 30% of the total customers in the system. The amount of this percentage is achieved from the simulation model. The final category of constraints includes budget constraints. Budget constraints are defined in the system, where allocating the maximum allowable number of servers for each queue is impossible. Therefore, the optimal number of servers in each queue should be determined such that the total number of servers in the system does not exceed the upper limit (defined based on the system budget). This constraint can be shown by
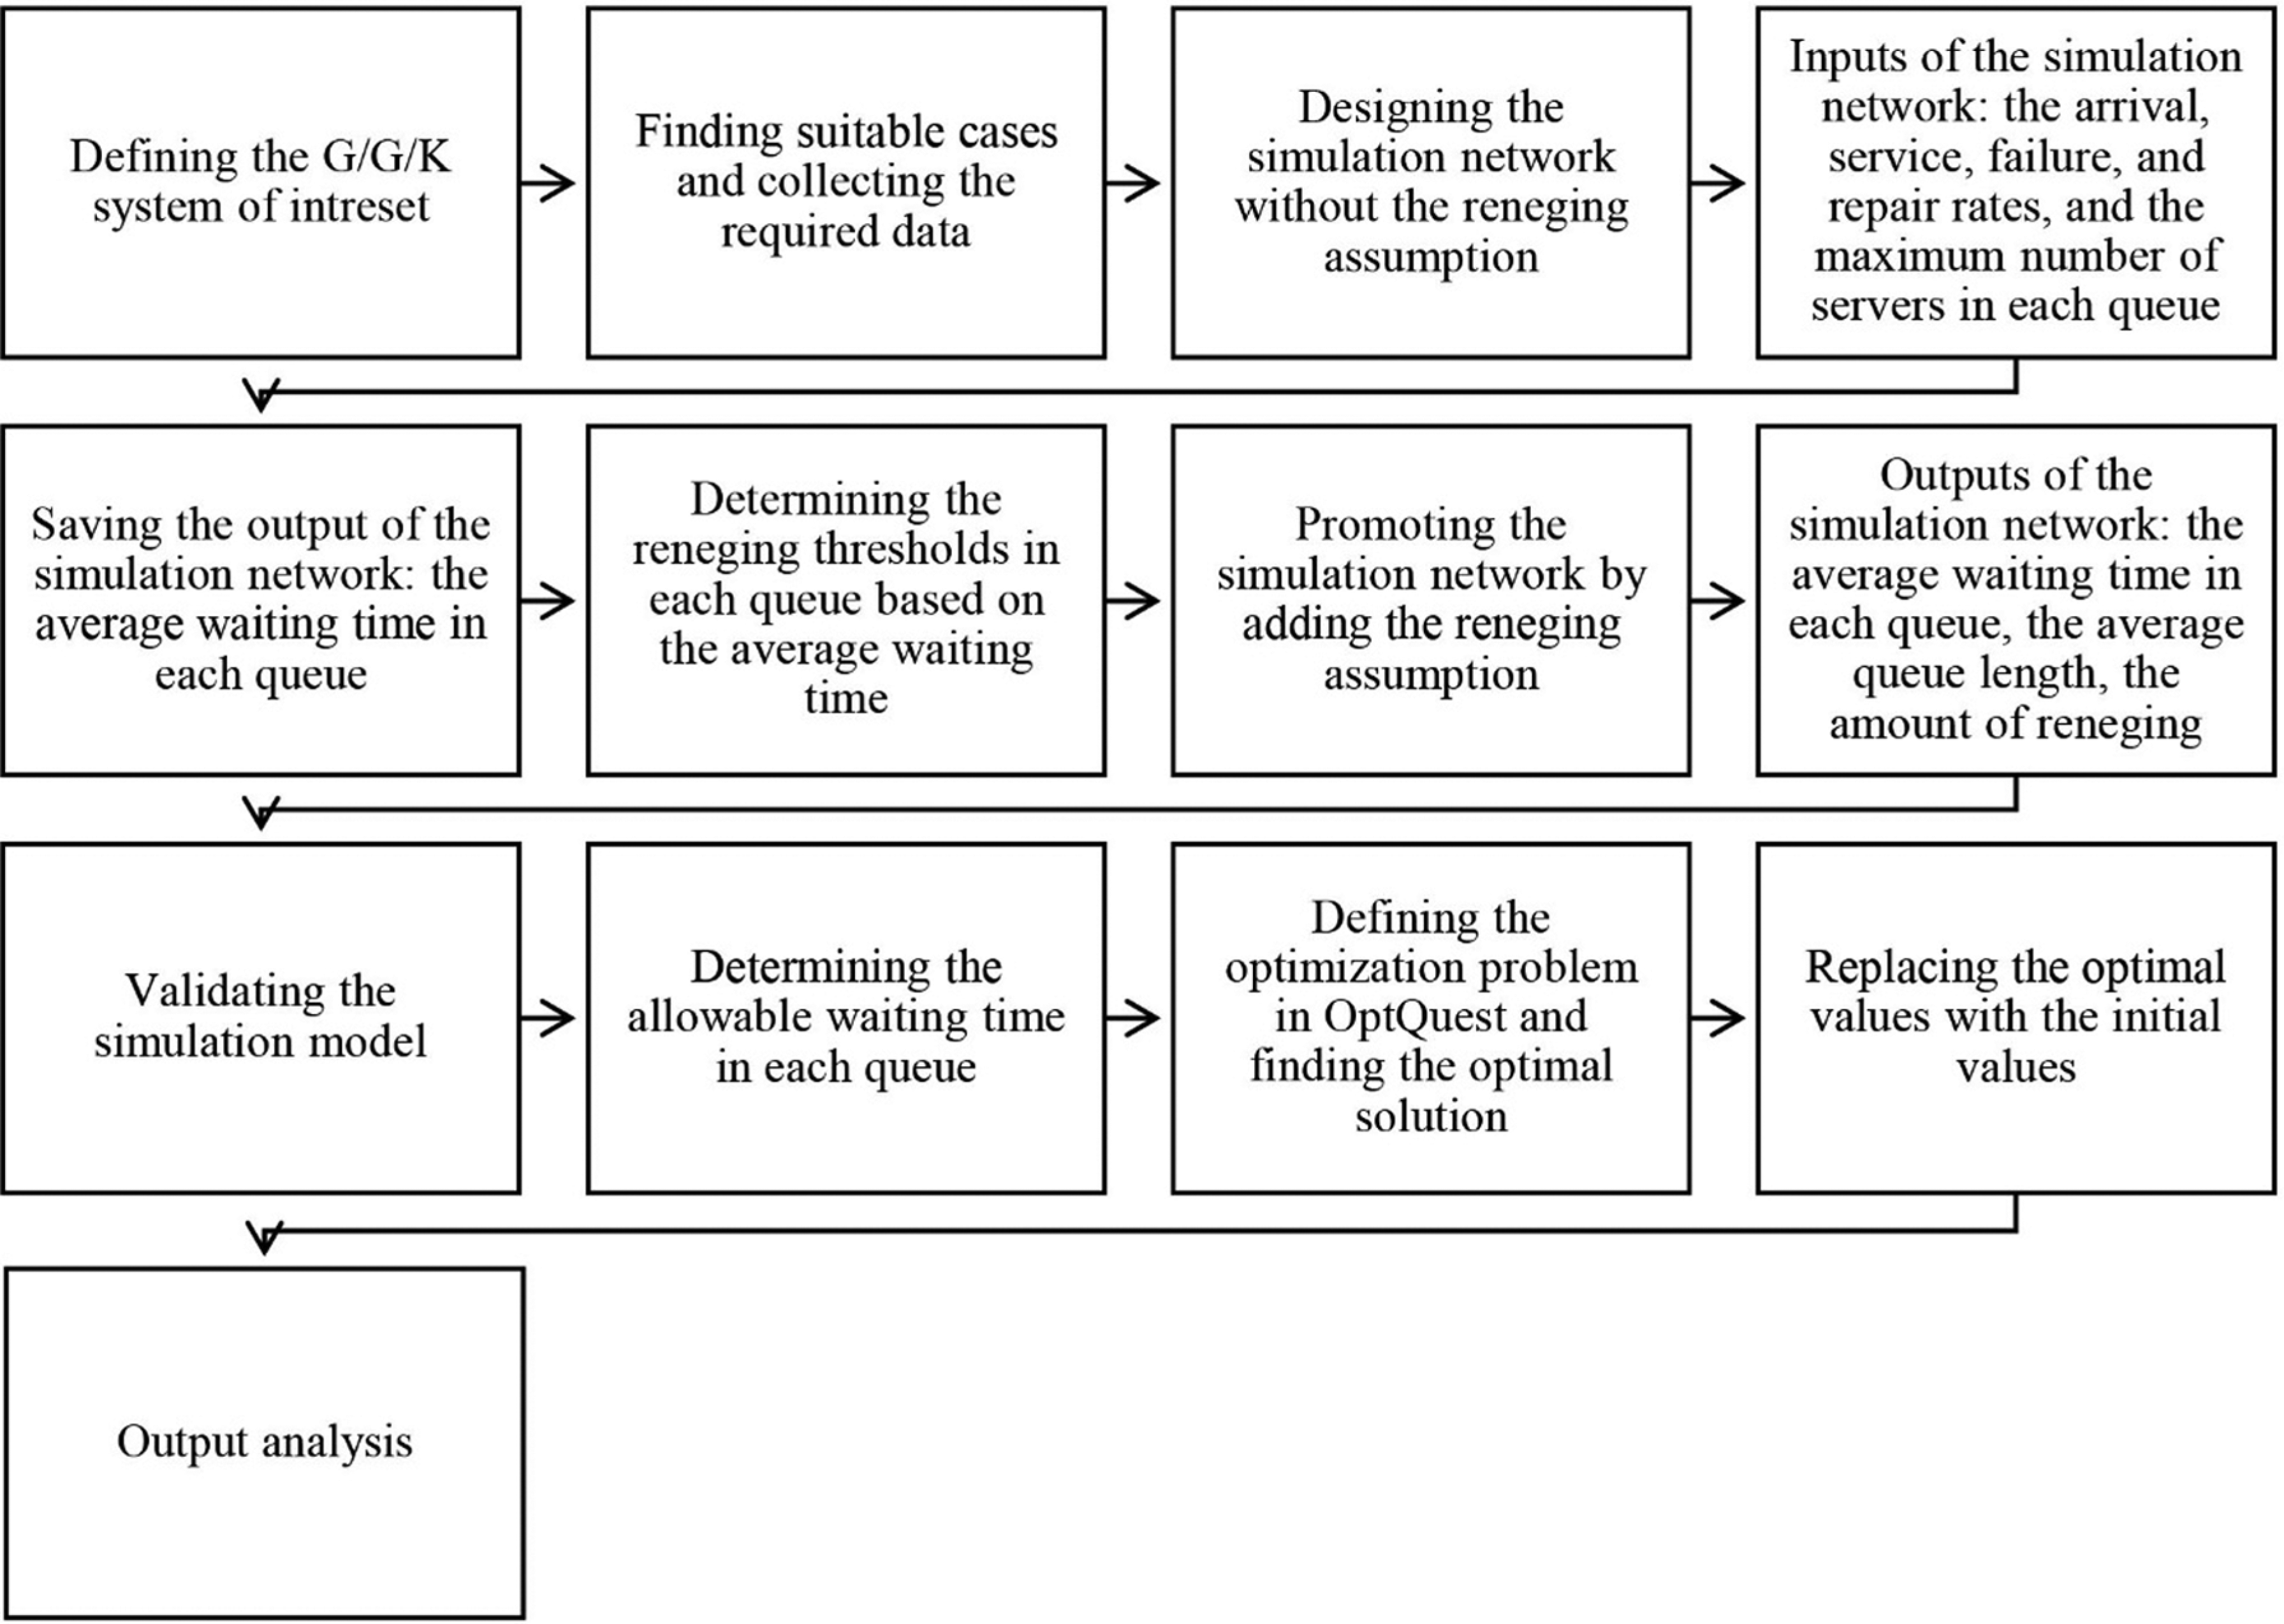
Structure of this study.
It is worth mentioning that the proposed model is applicable to particular telecommunication systems. For instance, in the call center industry, each customer must go through a tandem station prior to communicating with the service agent. On the other hand, most of these systems are faced with impatient customers and this leads to reneging. Another example can be the mobile network which comprises several nodes in tandem, where calls must pass through the nodes. In such a system, voice calls in the preemptive queue have priority over data calls; therefore, the preempted data calls can wait in each queue for a certain amount of time and thereafter, they renege from the queue. 34 The final example deals with the wireless network, which can be considered as a tandem queue, consisting of a set of nodes. In this network, the reneging phenomenon occurs, when some packs of data, if not delivered within the specified time, lose their value, and will be dropped. The model presented in this paper is also suitable for the machine repair problem in manufacturing systems in which there are more than one repairing stage that is known as a tandem queue. In this case, the failed machines awaiting repair may renege from the queue when the repairman is busy; additionally, the repairing equipment may encounter breakdowns.
3. Methodology
3.1. Tabu search
Tabu search (TS), created by Fred W. Glover in 1986 and formalized in 1989, is a meta-heuristic search method employing local search methods used for optimization issues. This algorithm commences at a point or solution, and then searches for neighborhood around that point. Among the neighbors, it selects the best choice and moves to that point. The search continues until a stopping criterion is met. At the end of the search, the optimal point is reported. This meta-heuristic uses a short-term memory to avoid falling into local optimum. The duty of that memory is to protect the latest movements (with a few defined numbers), which are recorded in the list (tabu list). During the movement, if the movement is in the list, transfer will be stopped, unless the forbidden move is within the certain circumstances. Structure of the TS algorithm consists of the following steps:
Step 1. Algorithm settings: While solving an optimization problem, the structure of the ‘tabu search’ algorithm needs special adjustments. Settings include how to code the answer or solutions, the definition of the neighborhood structure, type, and how to design tabu list.
Step 2. Forming initial solution: The tabu search starts with an initial solution. The method to create the initial solution must be initially identified. The initial solution is frequently chosen at random. In complex issues, an algorithm or such steps are introduced to generate the initial solution.
Step 3. Calculating the objective function value: Here, the value of the objective function is calculated for the considered initial solution. At the beginning, the value obtained from the initial answer is also considered as the optimum value. This value is updated during the algorithm.
Step 4. Searching for neighborhood: During each step of the algorithm, the neighborhood search looks for the neighbors of a current solution. At this stage, with regard to the introduced structure of the neighborhood, all the neighbors of the current solution are examined.
Step 5. Finding the best neighbor: While searching the neighborhood, all the neighbors are examined and the best neighbor is chosen.
Step 6. Evaluation of movement prohibition: After the best neighbor is chosen, the move to that solution is compared with the tabu list. Then, if the move is in the list, we take the seventh step, otherwise the eighth step is taken by the algorithm.
Step 7. Goal criteria: During this step, the prohibited movement is compared with the ideal criterion. If the criterion is met, move out; if they do not meet the ideal criteria, the algorithm goes back to the Step 5, and then chooses the next best.
Step 8. Motion: At this step, the new current solution is considered as the current solution.
Step 9. Updating the best solution: During the algorithm, the best solution is always stored. Initially, the first point is considered as the best solution, and after each move, the new answer is compared with the best answer so far. If the new solution is a better one, it is saved as the best solution; otherwise, the best solution does not change.
Step 10. Stop condition: After each move, the stop condition is evaluated. If it is met, the algorithm is terminated, and the results are reported; otherwise, the algorithm takes the next step.
Step 11. Updating the tabu list: After each move, the properties of new moves are input to the tabu list, and the list is updated. Afterwards, the algorithm takes the fourth step and searches for neighborhoods around the new solutions.
3.2. Scatter search
Scatter search (SS) was introduced for the first time by Glover (1977) as a heuristic for integer programming. It uses different methods in order to examine diversification and intensification that have been effective for many optimization problems. Scatter search is a sibling of tabu search, which was established by the same author and on the basis of similar origins. This algorithm searches the problem solution space through producing better solution(s) by combining existing solutions which have the necessary potential to be combined. Scatter search algorithm consists of several main parts: diverse production, improvement, subset formation, and reference set updating. At the beginning, the initial population algorithm is formed using methods capable of diverse production of members. After a phase, recovery is implemented to upgrade the produced members. In the third phase, reference set updating is run for a set of the best found solutions to be built, in terms of fitness and diversity. The reference set is usually much smaller than the genetic algorithm population. In the phase of building subsets, categorized members are produced after combining the solution of any new solutions subset. Then, combining the solutions is run to convert any subset to one or more members. After this phase, the new members will be improved (recovered). The algorithm stop condition is considered without any change, similar to the reference set or after a specified number of iterations.
3.3. OptQuest
All of the practical simulation–optimization methods are iterative heuristics. The OptQuest method combines meta-heuristics of tabu search, Neural Networks and scatter search into a single search heuristic. OptQuest is designed to optimize complex systems, including those systems that are formulated as simulation models. OptQuest has been integrated with several simulation software packages, and the aim of this integration is to add optimization capabilities. OptQuest package is embedded in Arena software. OptQuest allows simulation analysts to define explicitly integer and linear constraints on deterministic simulation inputs. More precisely, if a candidate solution does not fit constraints of OptQuest, the solution will be removed and OptQuest will examine candidates which will be better. OptQuest, additionally, allows boundaries to be specified on random simulation outputs. OptQuest needs to specify lower, suggested, and upper values of variables that are to be optimized. The proposed values determine the starting point (input combination); this selection affects search efficiency and effectiveness. Moreover, the requirement of OptQuest is to choose simulation outputs which are objective variables that will be minimized, and these outputs must meet specified requirements. 35
The optimization approach used by OptQuest comprises the information such as the decision variables, objective function and constraints. In the proposed model, the number of servers in each queue is considered as the decision variable, which their lower and upper bounds are entered into OptQuest. The constraints in this problem are as follows: (1) the budget constraint, which represents the linear relationship between decision variables and is given by equation
4. Computational results and discussion
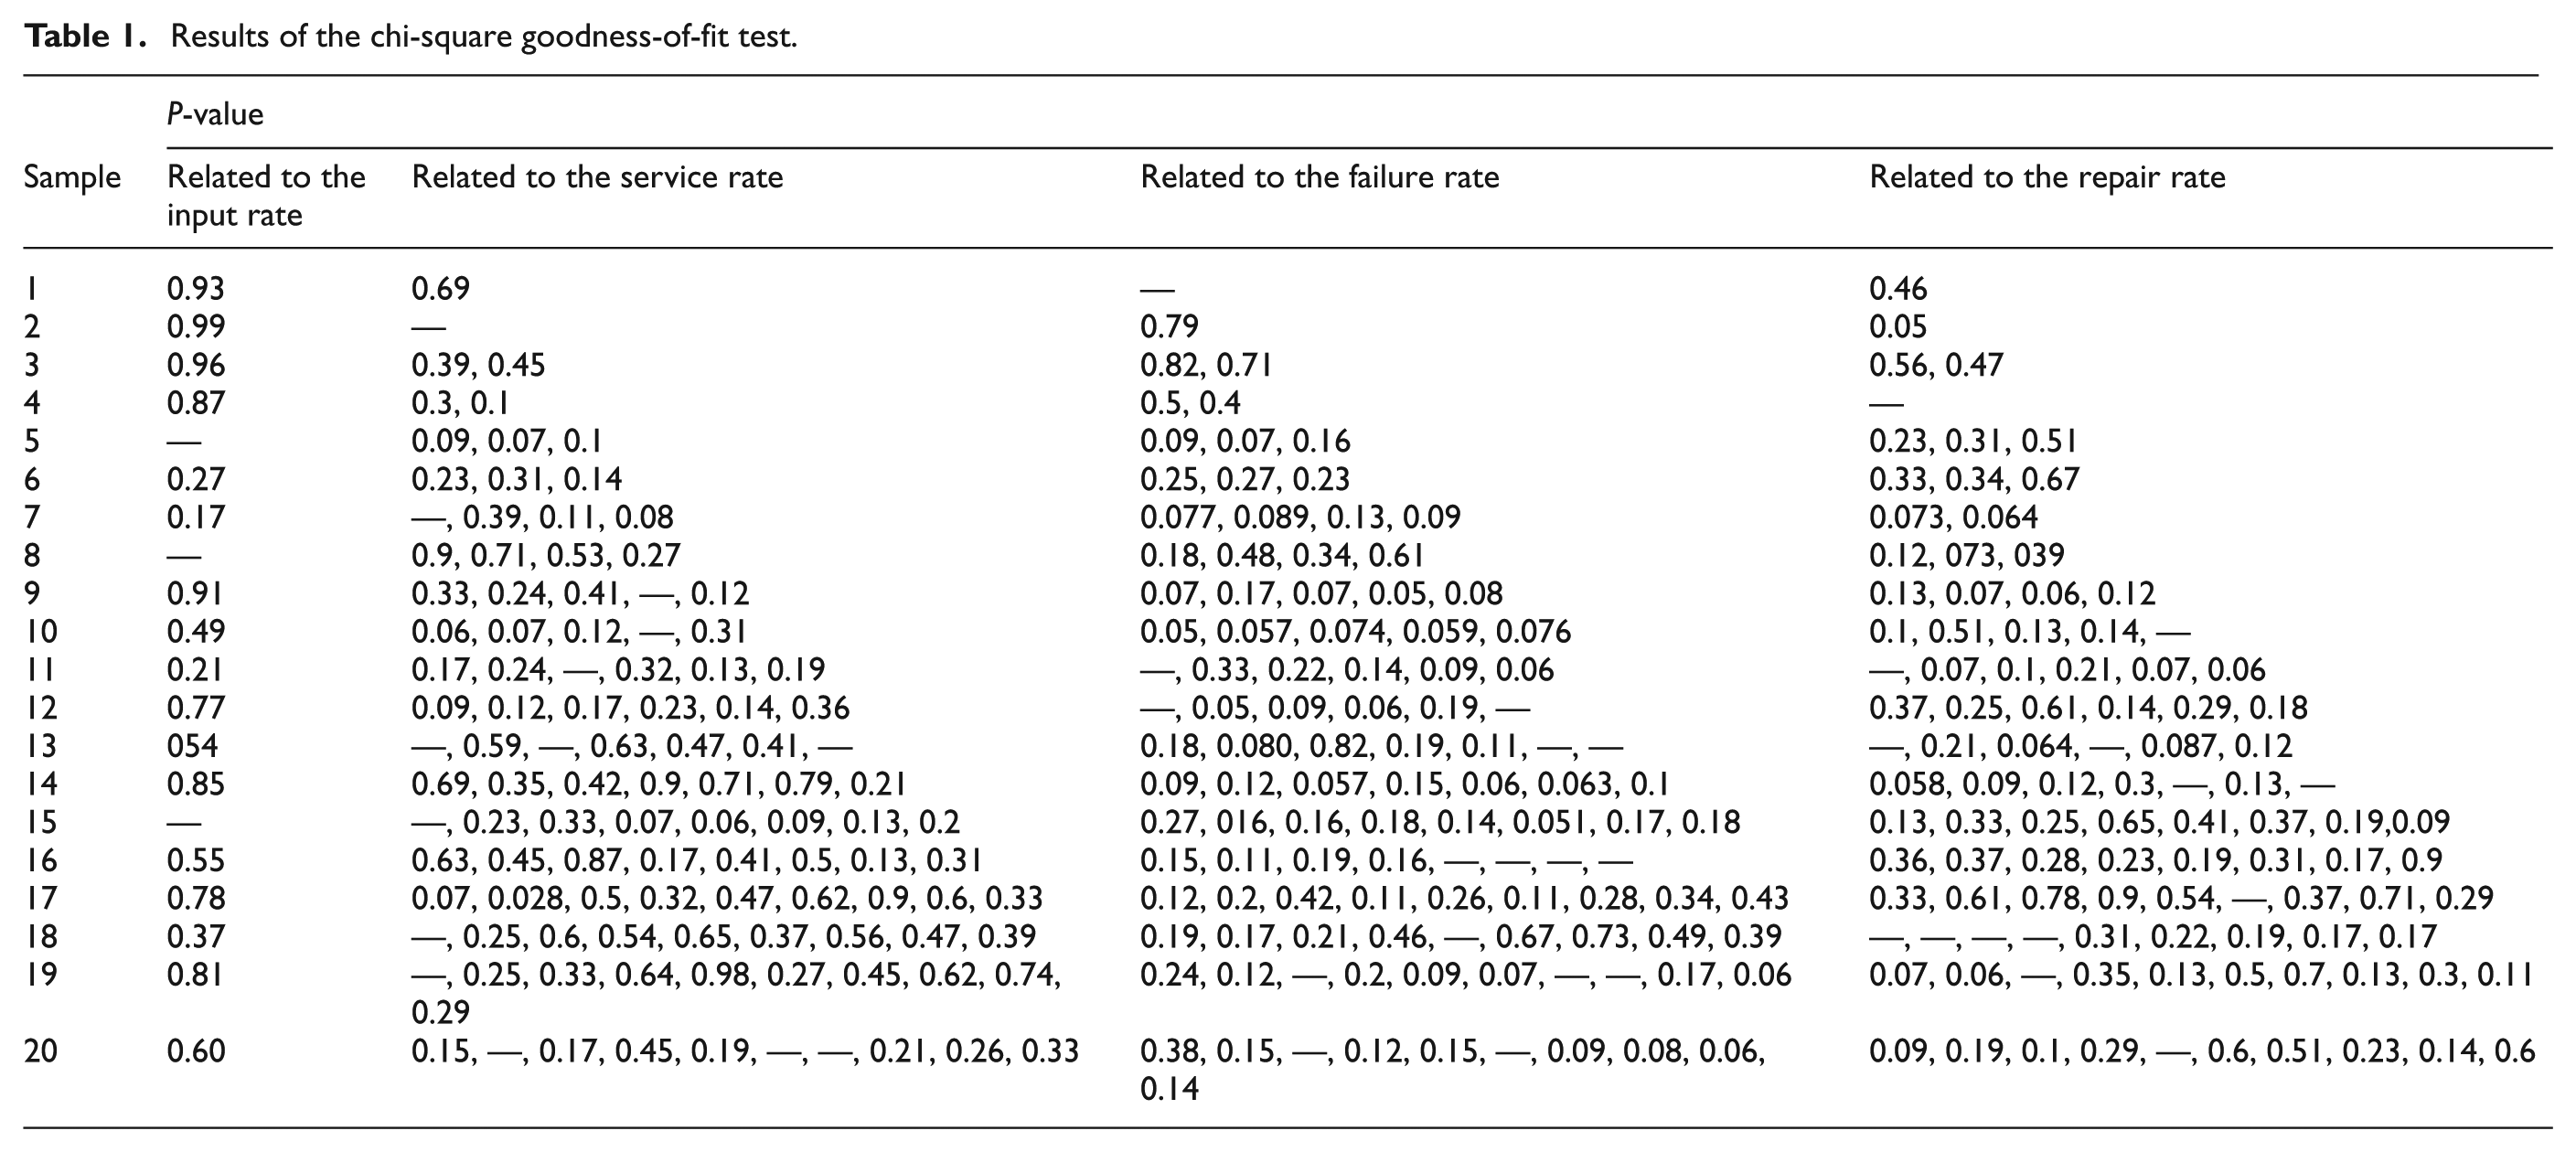
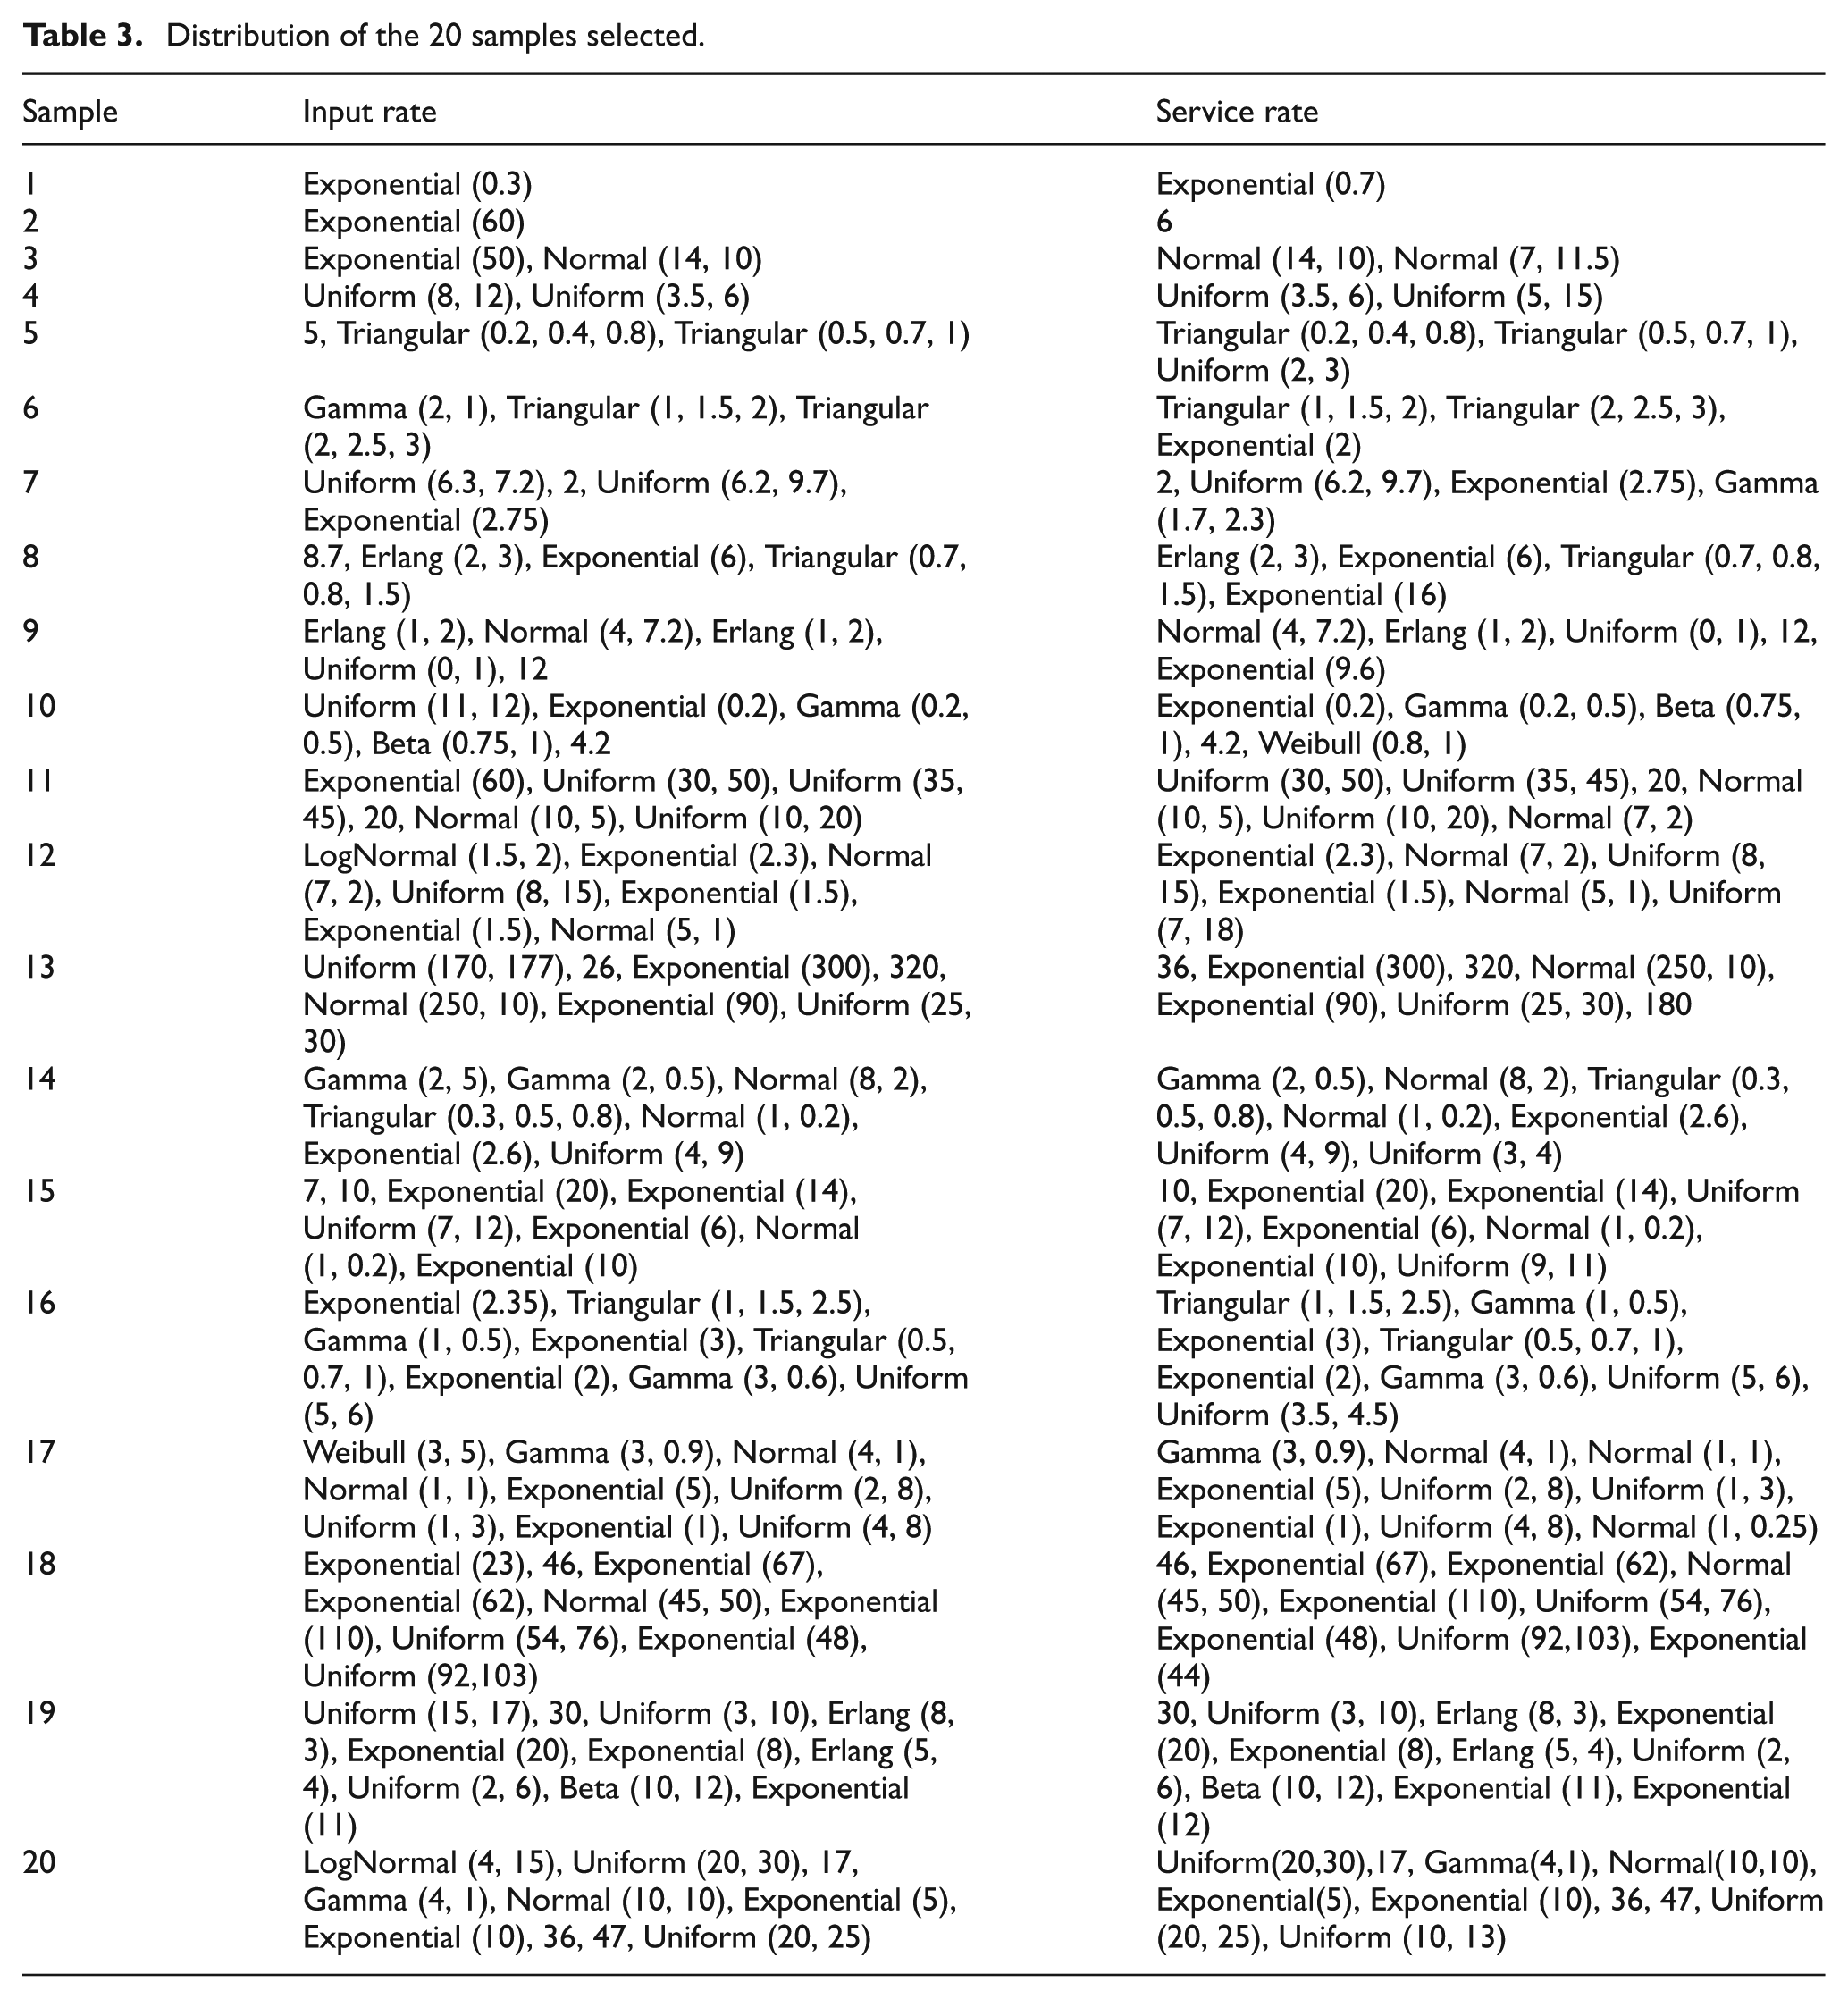
In order to evaluate the applicability and advantage of the proposed algorithm, 20 distinct samples of tandem queue systems have been considered as the case studies. The data related to the samples have been obtained from several real call centers that are located in Tehran, Iran. The data related to arrival, service, failure and repair times are collected from actual call centers for a month period and the statistical distributions have been fitted consequently. Based on the P-value obtained from the chi-squared goodness-of-fit test, the best distribution has been chosen. The results of these tests have been recorded and presented in Table 1. In this table, dashes are related to the constant rates, which do not need to fit any statistical distribution. As an example, the histograms of the initial data and their fitting distribution functions for sample 4 are presented in Figure 2. Well-known distributions such as exponential, Weibull, beta, gamma, lognormal, Erlang, normal, triangular, and uniform are used to generate data related to arrival, service, failure and repair rates. These samples are distinct, which means in some cases, arrival rate follows normal, triangular or other distributions. The detailed information of these distributions is presented in Tables 3 and 4. The other corresponding data of these samples, including resource capacity, budget constraint, reneging thresholds, as well as the acceptable amount of reneging in the system have been determined with the cooperation of call center experts. It should be noted that in this study, the tandem queue systems have been investigated, but since some call centers consisted of only one queue, samples 1 and 2 have been considered as the special tandem queue systems. The next 18 samples are tandem queue networks, which encompass more than two sequential queues.
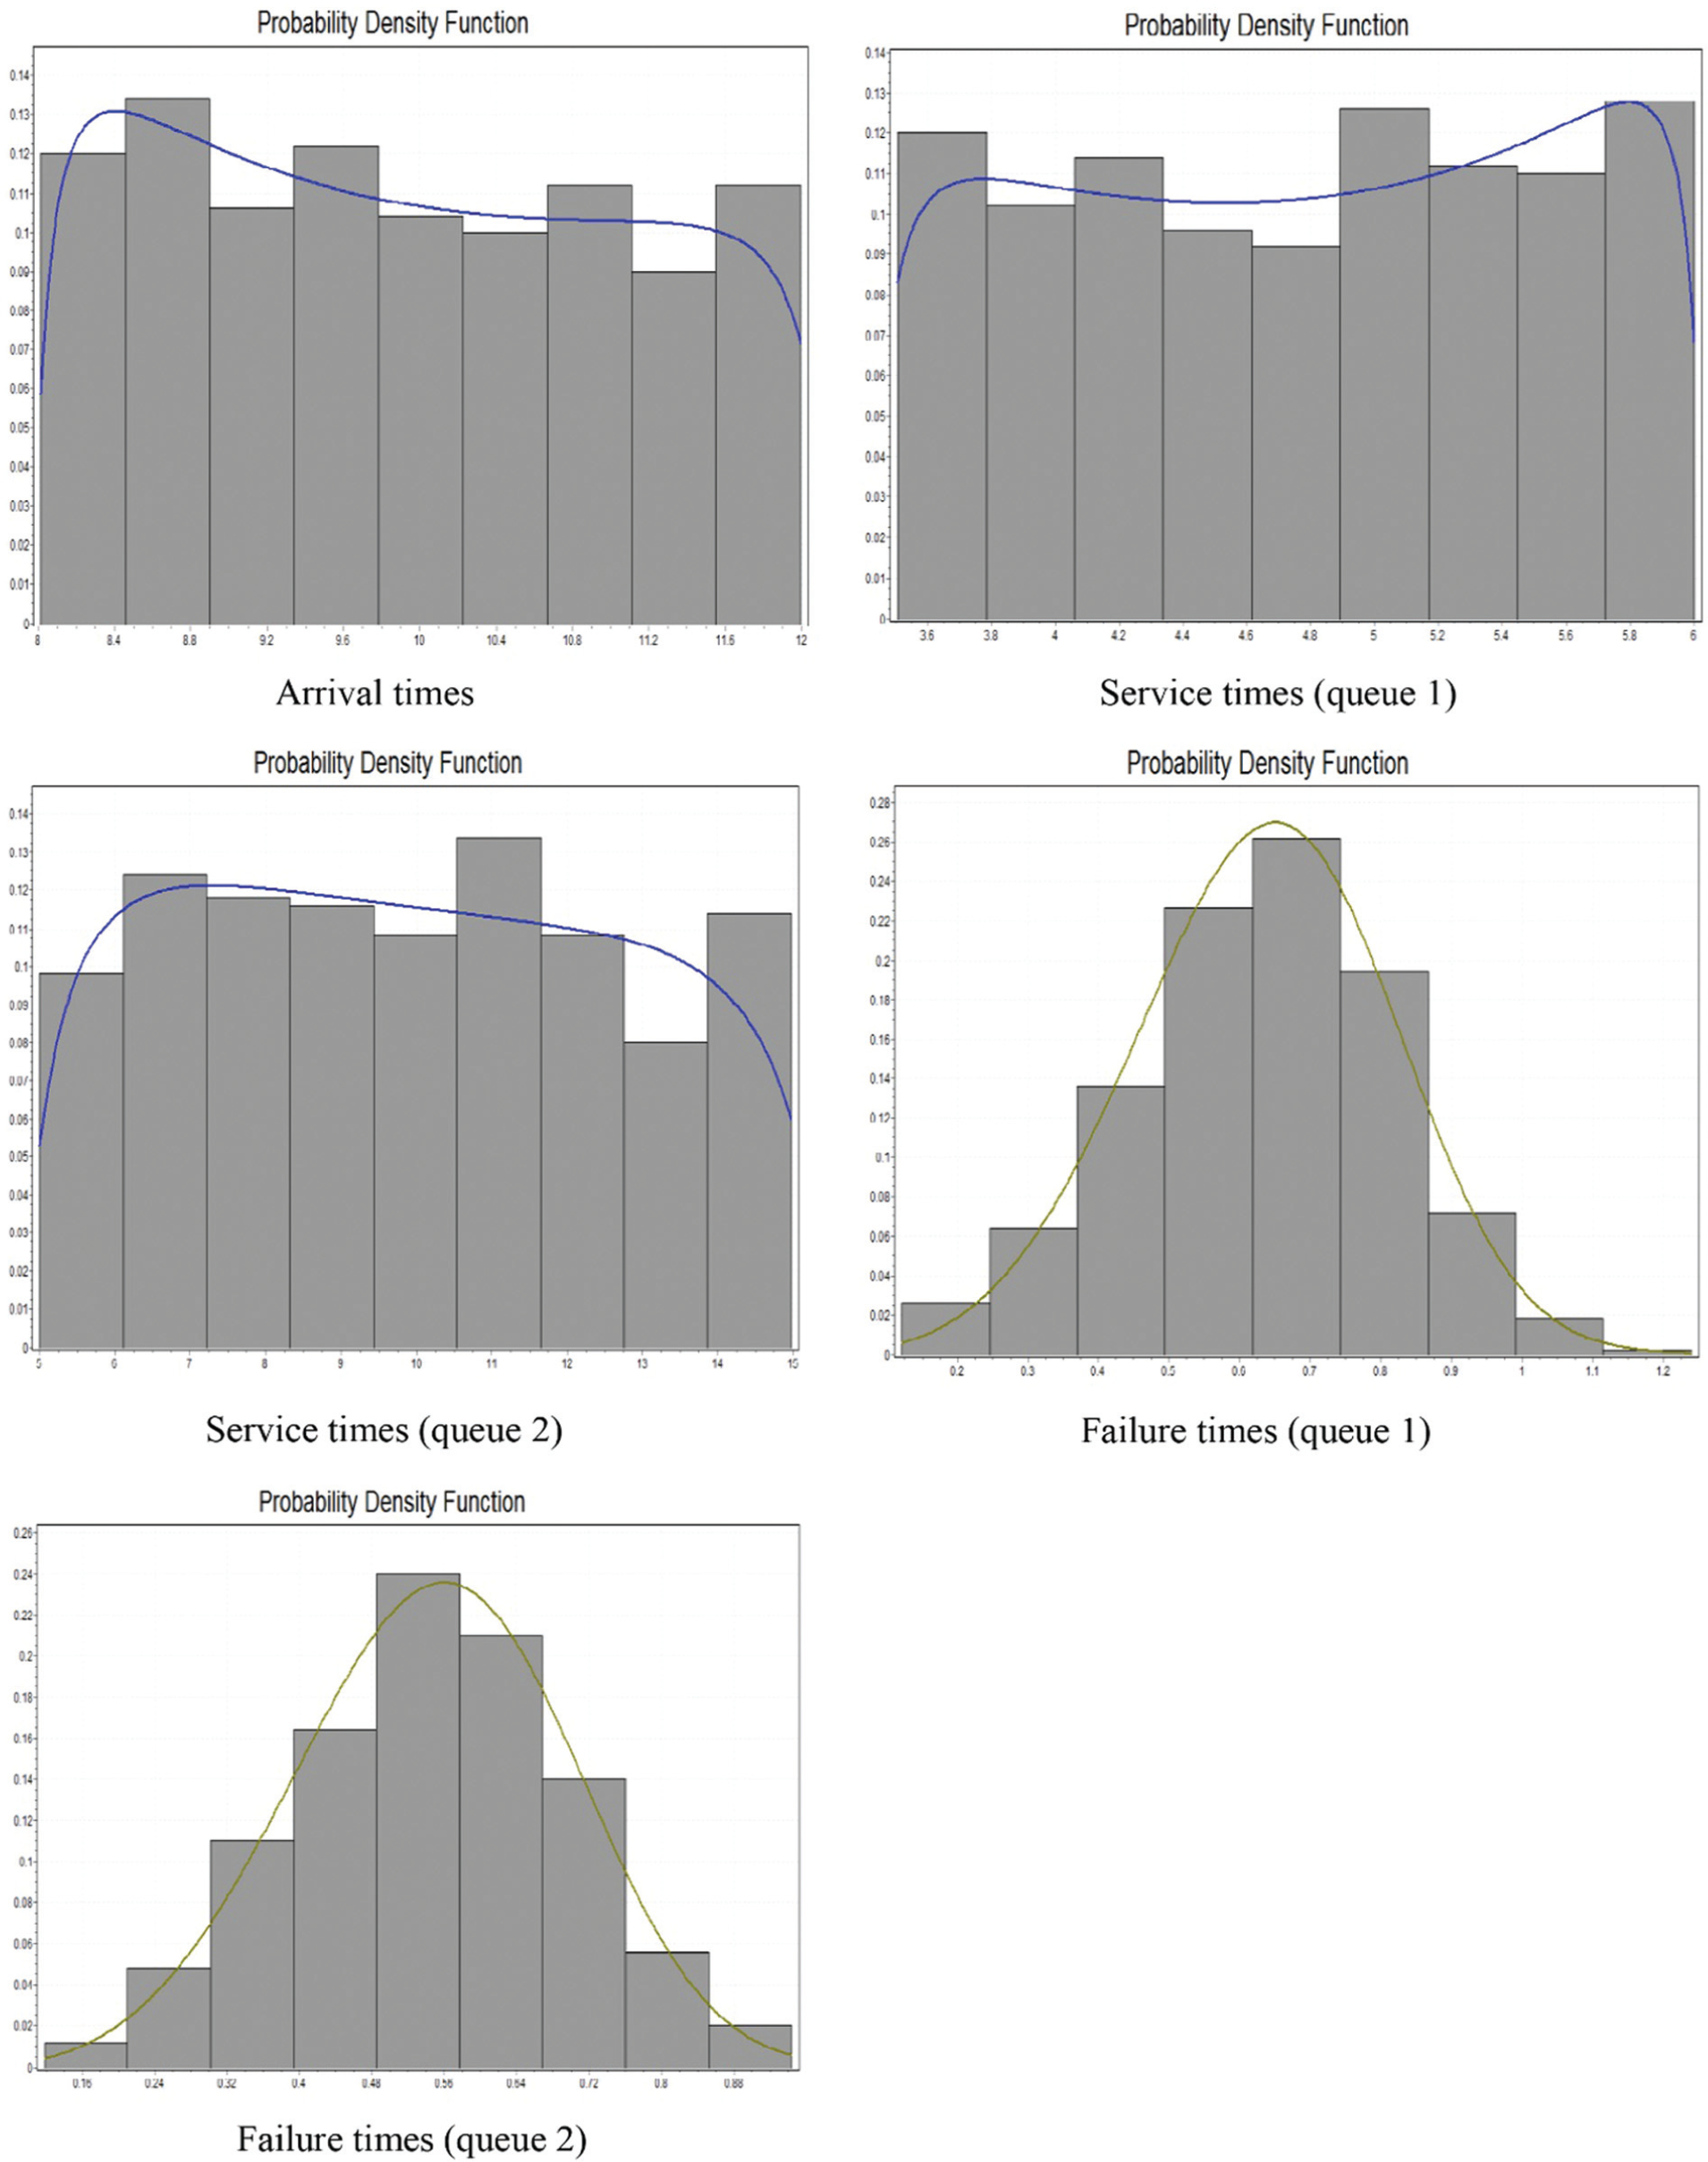
Histogram of the data and the fitted distribution functions.
Results of the chi-square goodness-of-fit test.
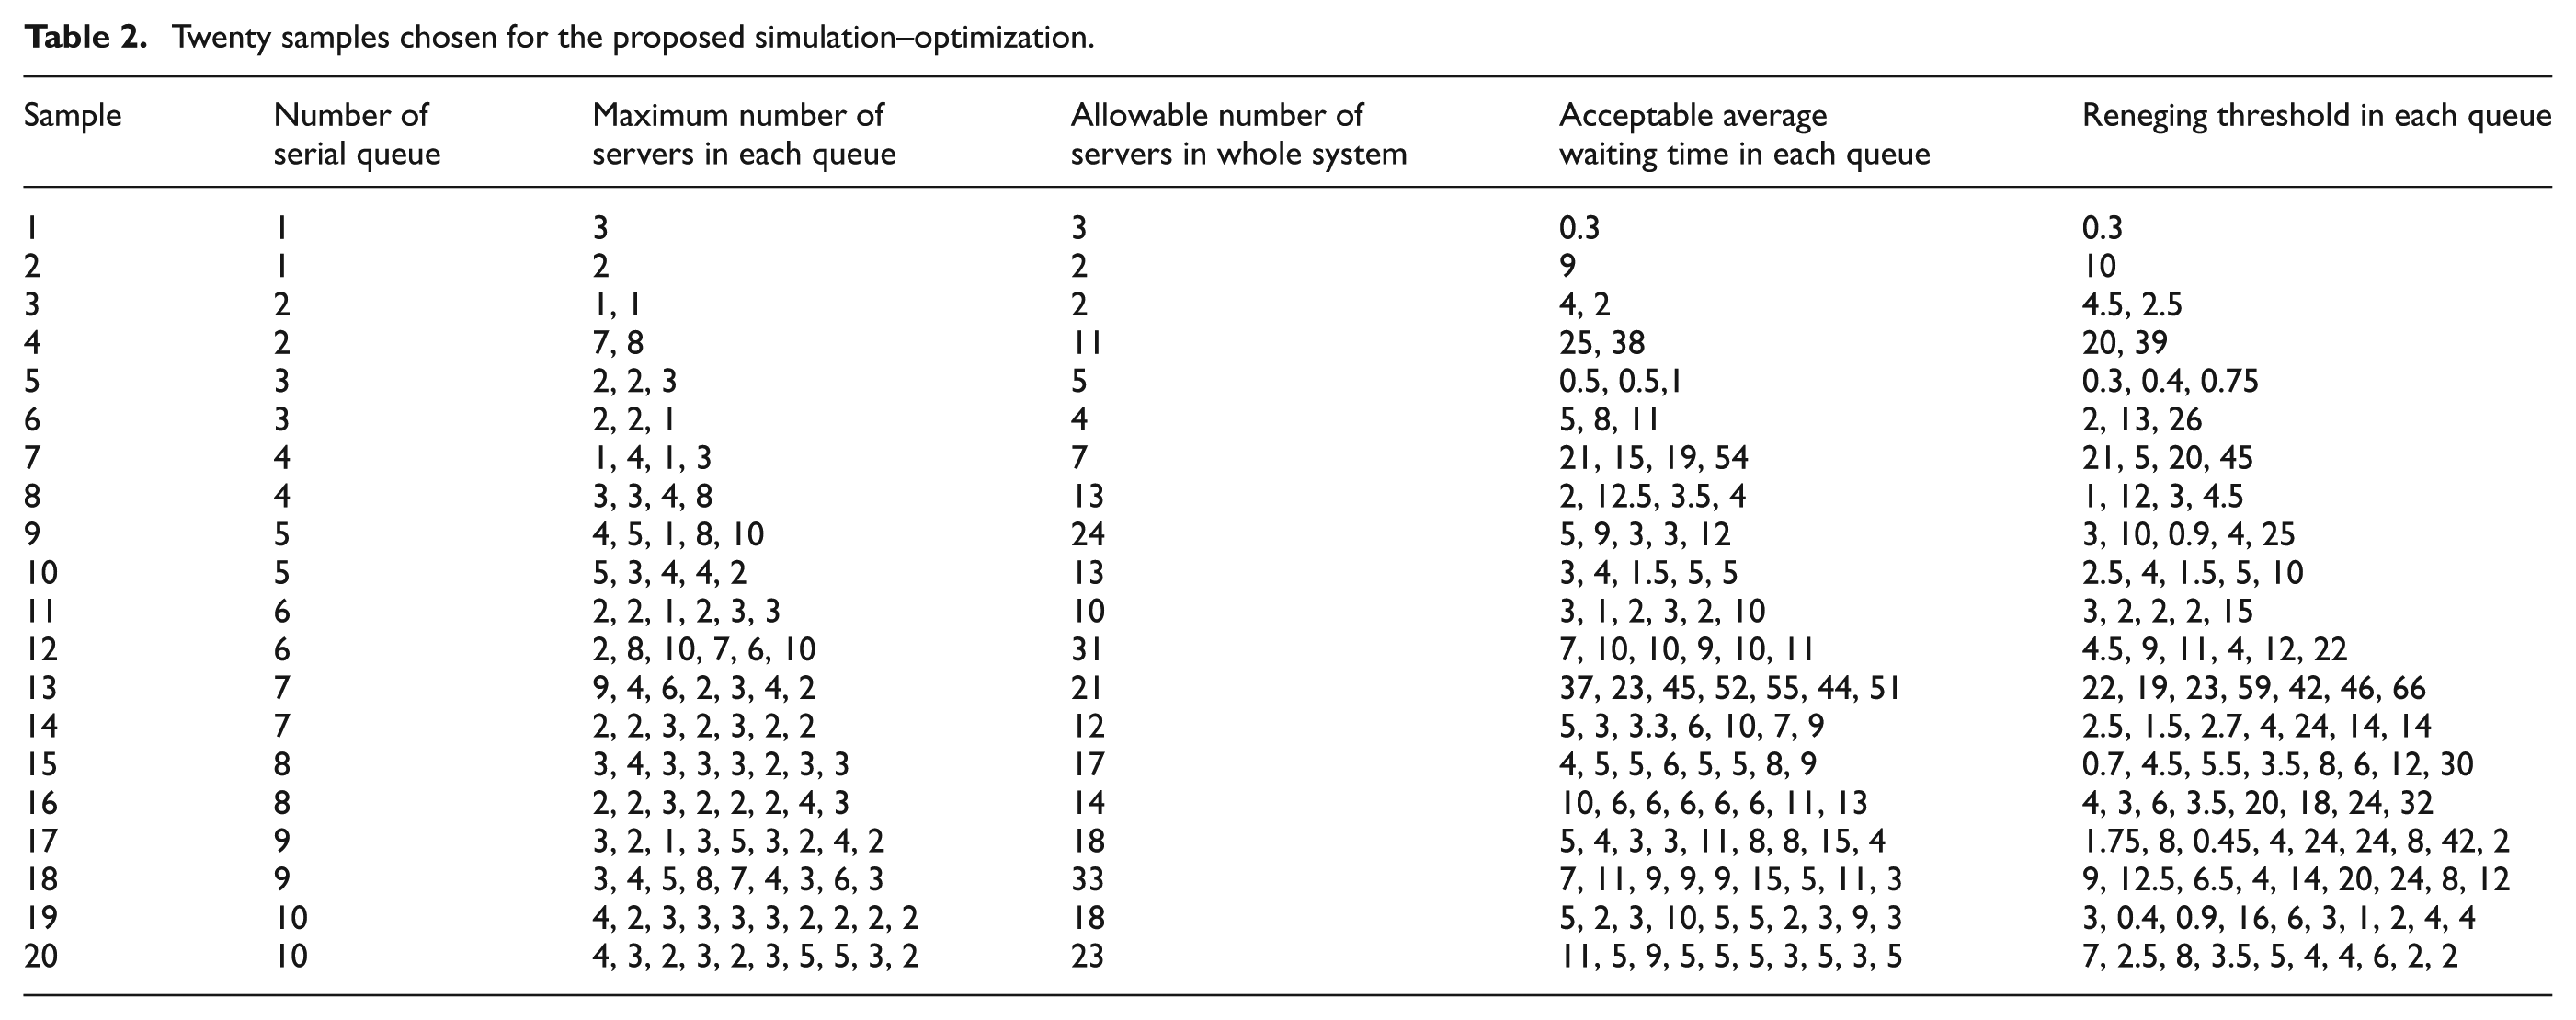
The data related to these samples are given in Tables 2, 3 and 4. In Table 2, the first column represents number of samples from 1 to 20. The second column indicates the number of series queues in each sample. For example, the third and fourth samples include two sequential queues, the fifth and sixth samples include three series queues and so on. The third column indicates maximum number of authorized servers in each queue. For example, in the fourth sample, maximum capacity of resource is equal to 7 for the first queue and 8 for the second queue. The fourth column indicates maximum number of usable servers that, based on budget constraints, can be assigned to the entire system. For example, in the fourth sample, the maximum number of the usable servers is equal to 7 in the first queue and 8 in the second queue, but this system can be paid for using 11 operators. The fifth column includes allowable waiting time in each queue. In fact, the optimal number of servers in each queue should be determined such that mean waiting time in each queue does not exceed this value and limitation of the capacity of resources and total number of operators in the system are met. The last column indicates the reneging thresholds in each queue. In Table 3, the first column indicates number of samples, second column indicates input rates and the third column indicates service rates in queues. Table 4 includes information relating to failure rates and repair rates.
Twenty samples chosen for the proposed simulation–optimization.
Distribution of the 20 samples selected.
Distribution of the 20 samples (failure rates and repair rates).

For each sample, the related network has been drawn in Arena software and input information, including arrival, service, failure and repair rates as well as maximum number of servers in each queue has been entered. The network is promoted after obtaining maximum allowable waiting time in each queue of the simulation network considering the reneging. To increase the reader’s understanding, network of one of the samples is shown in Figure 3. This sample includes three tandem queues and relates to simulation network considering reneging. The simulation network has been designed as explained in the following: The model is started with a ‘Create’ module, which creates entities (customers) based on the intervals between arrivals. Then, the entities enter to the ‘Assign’ module, where the values that will be later needed are assigned. After that, the entities are sent to the ‘Separate’ module to make a duplicate of each entity. The duplicates are the exact replicas of the original entity. The original entities enter to the ‘Process’ module and wait in the queue for receiving the service. The capacity of resources (servers) and the service time are determined in this module. The failure and repair rates for the resources are obtained by the ‘Failure’ module and allocated to each resource by the ‘Resource’ module. It is worth stating that the ‘Resource’ and ‘Failure’ modules are the spreadsheet modules in Arena software. The serviced entities are sent to the ‘Dispose’ module and exit from the system. The duplicate entities enter the ‘Delay’ module, where they are delayed by the defined reneging time. Then, the entities are sent to the second ‘Assign’ module, where the attribute ‘customer’ is assigned to a new variable called ‘search’. The attribute ‘customer’ has been defined in the first ‘Assign’ module and contains a unique entity number, when the entity is created in the network. In the next phase, the entities are sent to the ‘Search’ module in order to search a queue and find the entity’s rank in the queue that satisfies a defined search condition. If the original entity that has created a duplicate entity is found in the queue, the duplicate entity will be sent to the ‘Decide’ module and its rank in the queue will be stored in a variable; otherwise, it departs from the system through the ‘Dispose’ module. At the ‘Decide’ module, the rank of each entity in the queue is compared with the attribute ‘stay zone’. This attribute follows the Poisson distribution with the mean of 0.75, which has been defined in the ‘Assign’ module that is located after the ‘Create’ module. If the rank of entity is less than or equal to the value of the attribute ‘stay zone’, it implies that the position of the entity in the queue is suitable for remaining in the queue. As a result, the duplicate entity will exit from the system via the ‘Dispose’ module; otherwise, the entity will be sent to the ‘Remove’ module. In this module, the duplicate entities exit from the upper exit point of the module and are sent to the following ‘Dispose’ module to leave the network, and the original entities renege from the queue and exit from the lower exit point of the ‘Remove’ module and then, enter the ‘Record’ module to count the number of entities that renege. After reneging, they are sent to the ‘Dispose’ module and depart from the system. This procedure is repeated until each entity crosses three processes.
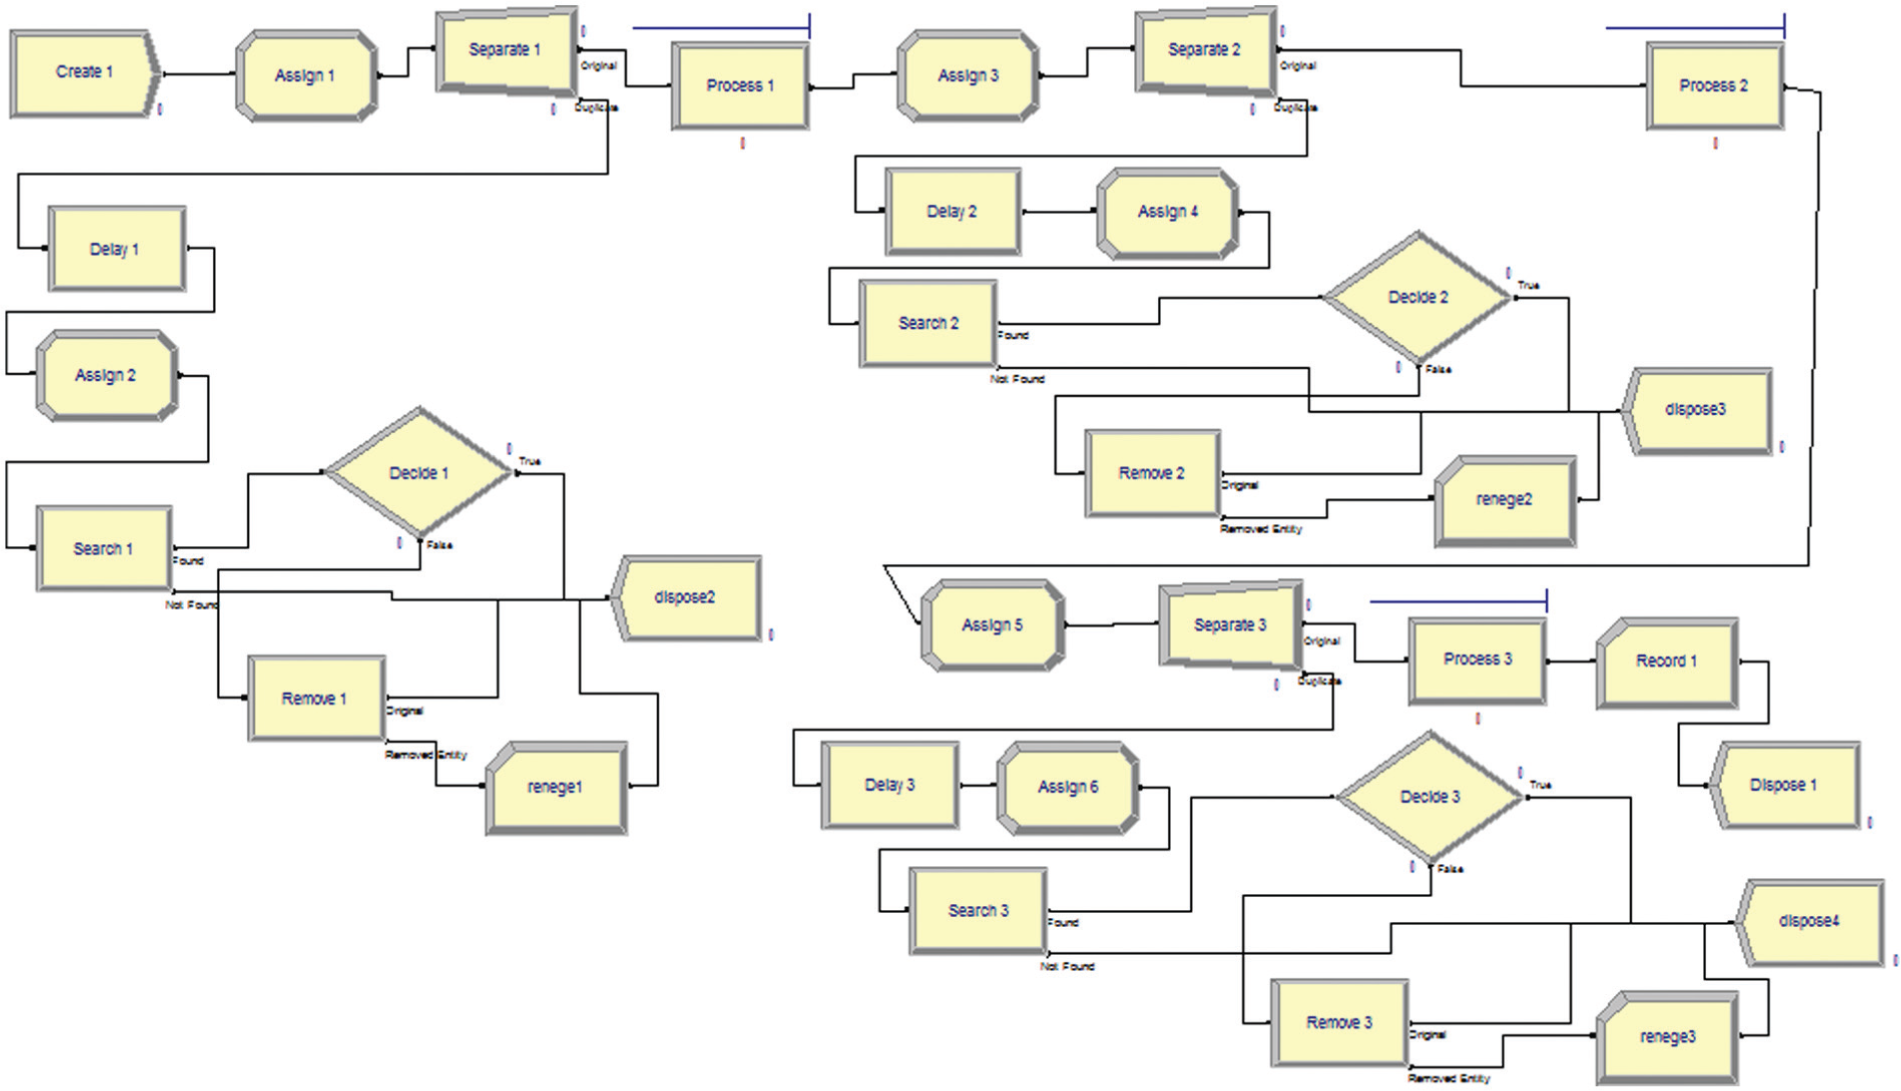
Simulation network.
In each simulation network the number of replications is selected such that half width of the 95% confidence interval for the average output that represents the error rate is placed in an acceptable range. More specifically two performance criteria including average waiting time and the average number of entities waiting in the queue are considered as outputs. For each of the stated criteria, the error percentage by using the formula
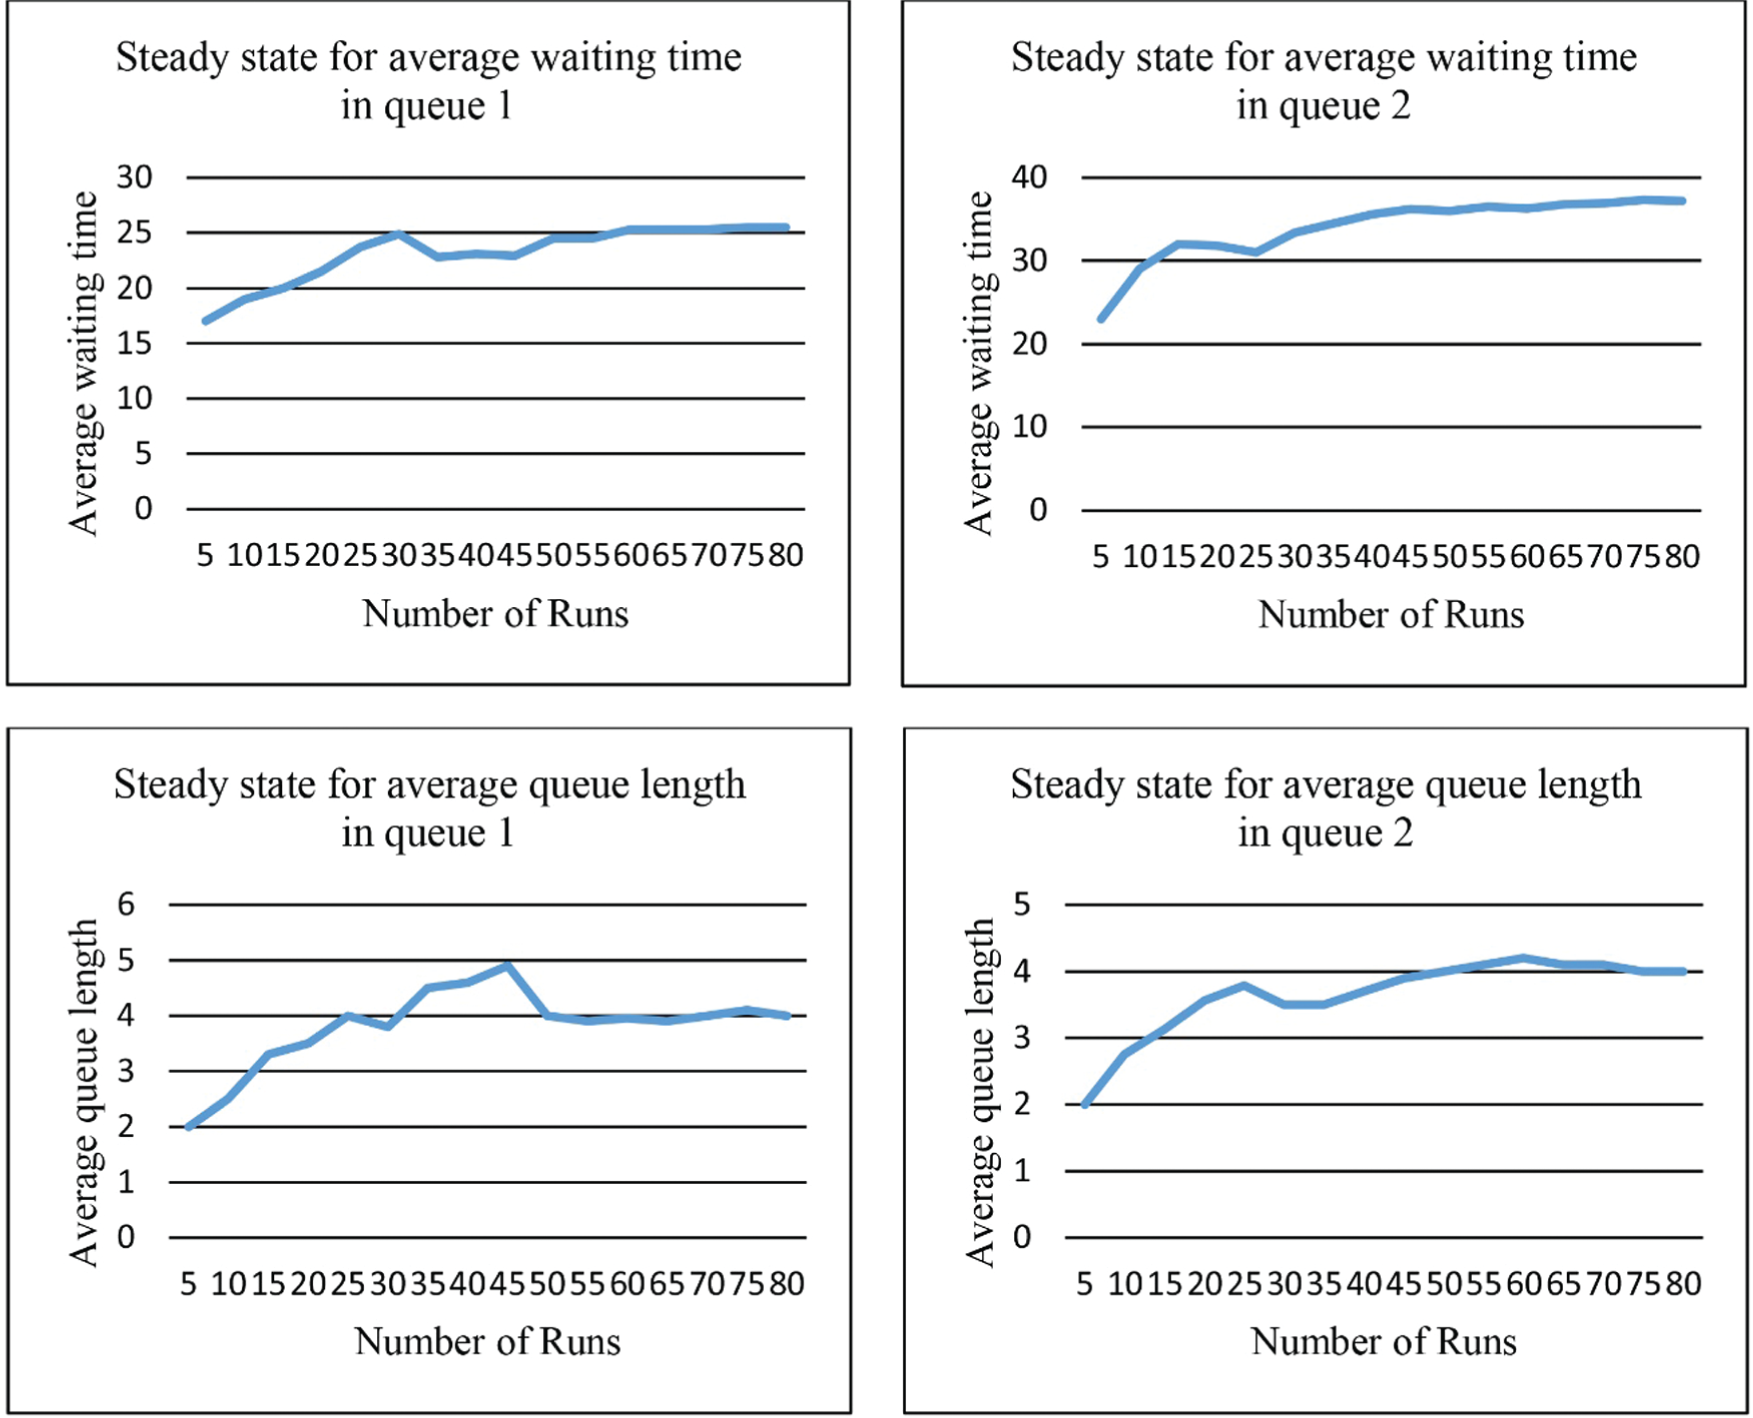
Steady-state diagrams.
After running the simulation model, the validity of the proposed model can be verified. In general, validation is achieved through comparing the simulation model with the actual system behavior. Therefore, in order to validate the simulation model, at first, 10 customers were randomly selected from the real system (for all samples), and then their average waiting time in the system, average waiting time in the queue, as well as average queue length were recorded. Thereafter, by using the simulation model, 10 entities were simulated and their average waiting time in the system, average waiting time in the queue, as well as average queue length were also recorded. Afterwards, by using the paired t-test, the equality of means of these two groups was investigated. According to the obtained P-values for 20 presented samples, which were greater than the related confidence level equal to 0.05, it was realized that there is no significant difference between the averages of these two groups, and consequently, the proposed simulation model was validated. It should be noted that the sample size for these tests was achieved by using the means of the operating characteristic curves. In this approach, the optimal number of samples has been determined in such a way that the power of the test would be greater than 0.9.
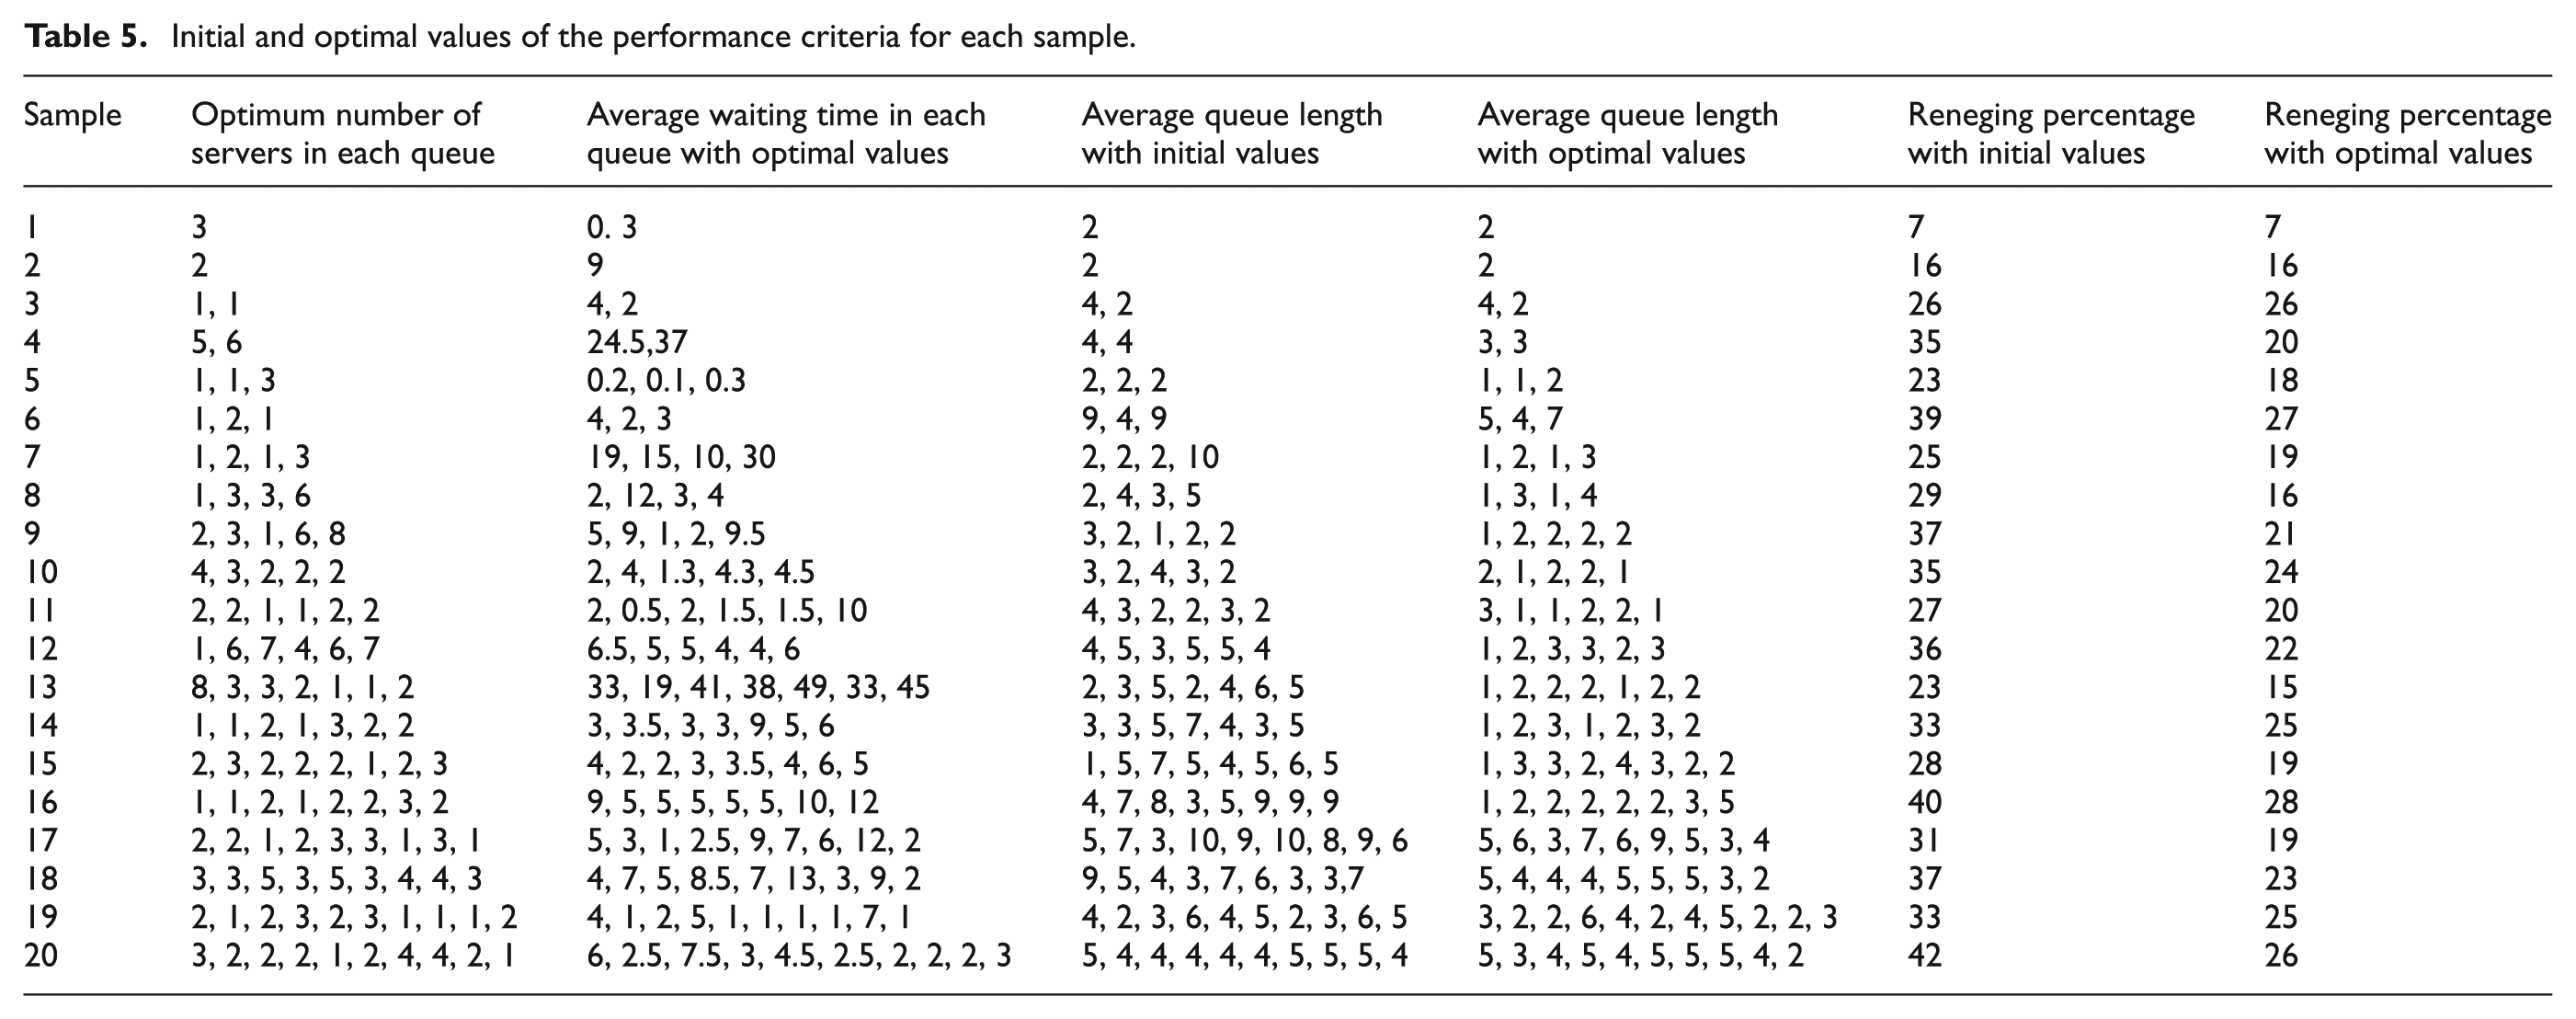
After simulation, the optimal number of servers is determined in each queue considering maximum allowable waiting time, maximum capacity of server in each queue, and maximum number of servers which can be allocated for the entire system through the OptQuest method. After this step, the optimal values are sent in Arena to simulation network and simulation is done again. Results of optimization algorithm, i.e. optimal number of servers in each queue, average number of entities in each queue and average waiting time in each queue considering optimal number of servers, are given in Table 5. The results of the simulation model after replacement of the optimal values with the initial values confirm that all of the defined restrictions in the system are satisfied. As seen in Table 5, the values related to the average waiting time in each queue as a critical performance measure in evaluating the queuing systems are decreased in comparison with the initial values of this measure (initial values have been provided in Table 2 as the allowable limit). Besides, the average number of entities in each queue (average queue length), which has an effect on customer patience, is evaluated as another performance criterion and the results disclosed an improvement in this indicator. On the other hand, the reneging phenomenon in the call center network generally leads to lose a large number of calls. In fact, ignoring the occurrence of reneging can lead to an inappropriate and poor resource allocation in the system. Increasing the number of resources can naturally reduce the amount of reneging. However, in practice, although on one hand systems encounter the capacity constraints, on the other hand they face budget constraints. Therefore, increasing the number of servers in the system until the reneging rate reaches the zero value is almost not possible. Hereby, in order to improve the queuing system performance, in the proposed model, it has been tried that the amount of reneging would have the lowest acceptable rate considering the constraints as well as the inherent features of the system, in such a way that in all the studied systems, the reneging rate in the whole system would be less than 30% of the total customers entering the system. In addition, as can be seen in Table 5, this rate has been decreased in comparison to the situation before the optimization. Thus, based on the performance analysis, it can be stated that using the proposed model for resource management according to the system features has led to the results, where the system performance is enhanced.
Initial and optimal values of the performance criteria for each sample.
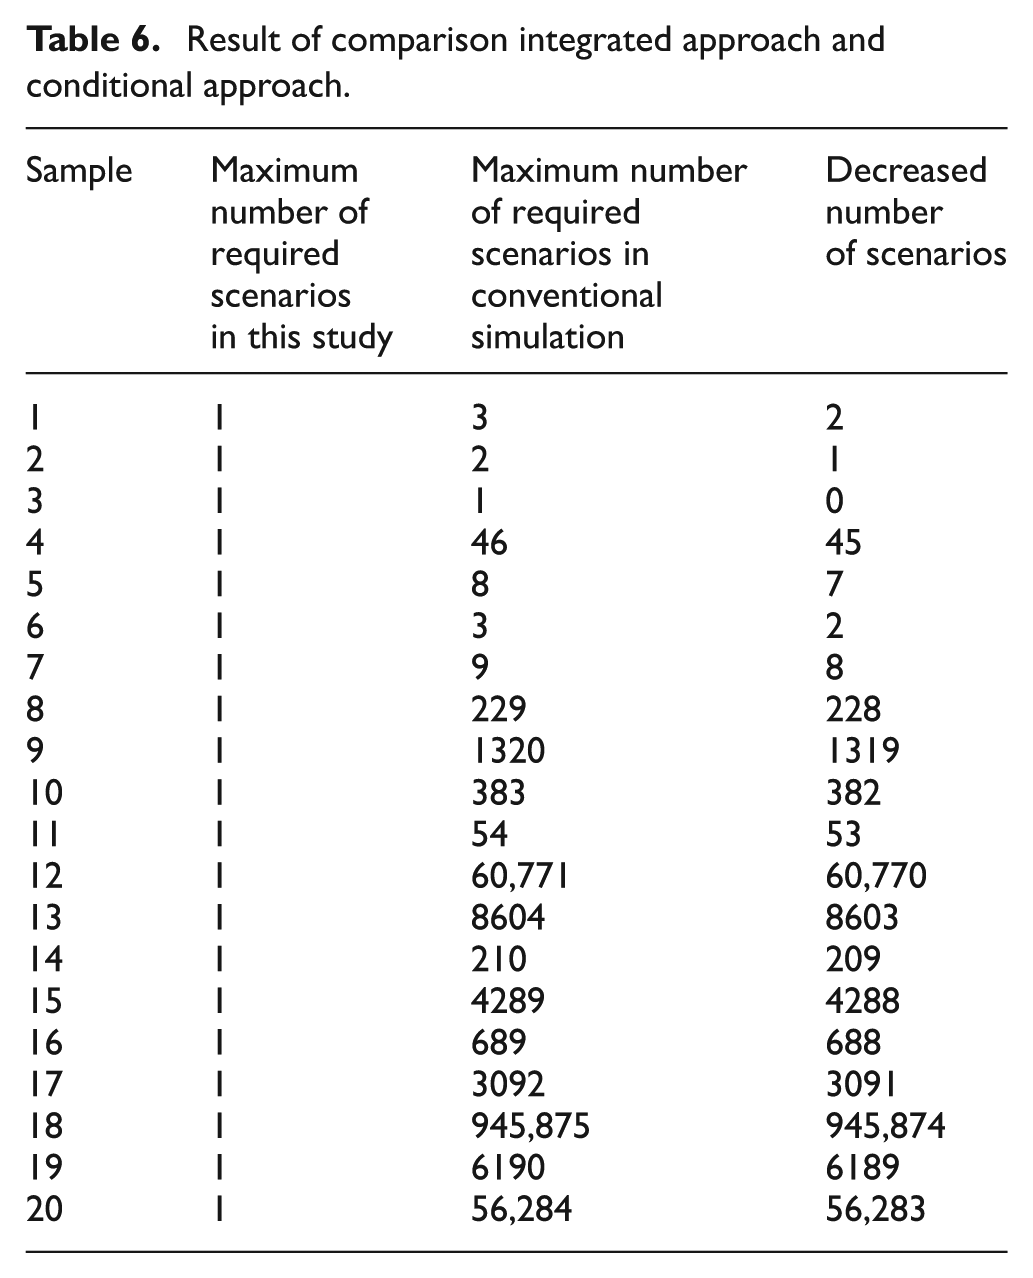
Furthermore, the proposed simulation–optimization algorithm is compared with the traditional simulation method in terms of the number of required scenarios to find the optimal solution. In traditional simulation, according to the case study, the possible scenarios are designed and examined. Then, by comparing the results of different scenarios, the optimum solution is outlined. However, the proposed simulation–optimization model considers all possible scenarios as the solution space. It furthermore searches among the solution space to find the optimum solution with respect to system constraints and desired objectives. The results of this comparison are shown in Table 6. In this table, the number of required scenarios in a conventional simulation is equal to the number of states in which both conditions of
Result of comparison integrated approach and conditional approach.
5. Conclusions
Many systems in real-life problems, such as machine operating systems, production line systems, communication systems, banks, telecommunication systems, etc., include a tandem queuing system, in which the component has to pass several successive queues to be served. However, most of these systems encounter the phenomenon of reneging and server breakdown, which considerably affects the system performance. Therefore, in this study, a simulation model of the complex tandem queuing systems has been proposed while the reneging assumptions, server breakdowns, and repair issues were taken into account. Thereafter, through a combination of the tabu search and scatter search methods by means of the OptQuest approach, the optimal number of servers in each queue was determined with respect to the resource capacity limitations and budget constraints. The objectives were defined in this optimization problem in such a way that the average waiting time in each queue does not exceed the allowable level and the total processing time in the system is minimized. Moreover, 20 distinct samples of tandem queues were randomly selected and studied to evaluate the validity of the proposed simulation model and the optimization algorithm. Finally, the superiority of the proposed simulation–optimization model, in comparison with the traditional simulation method, was shown according to the number of required iterations.
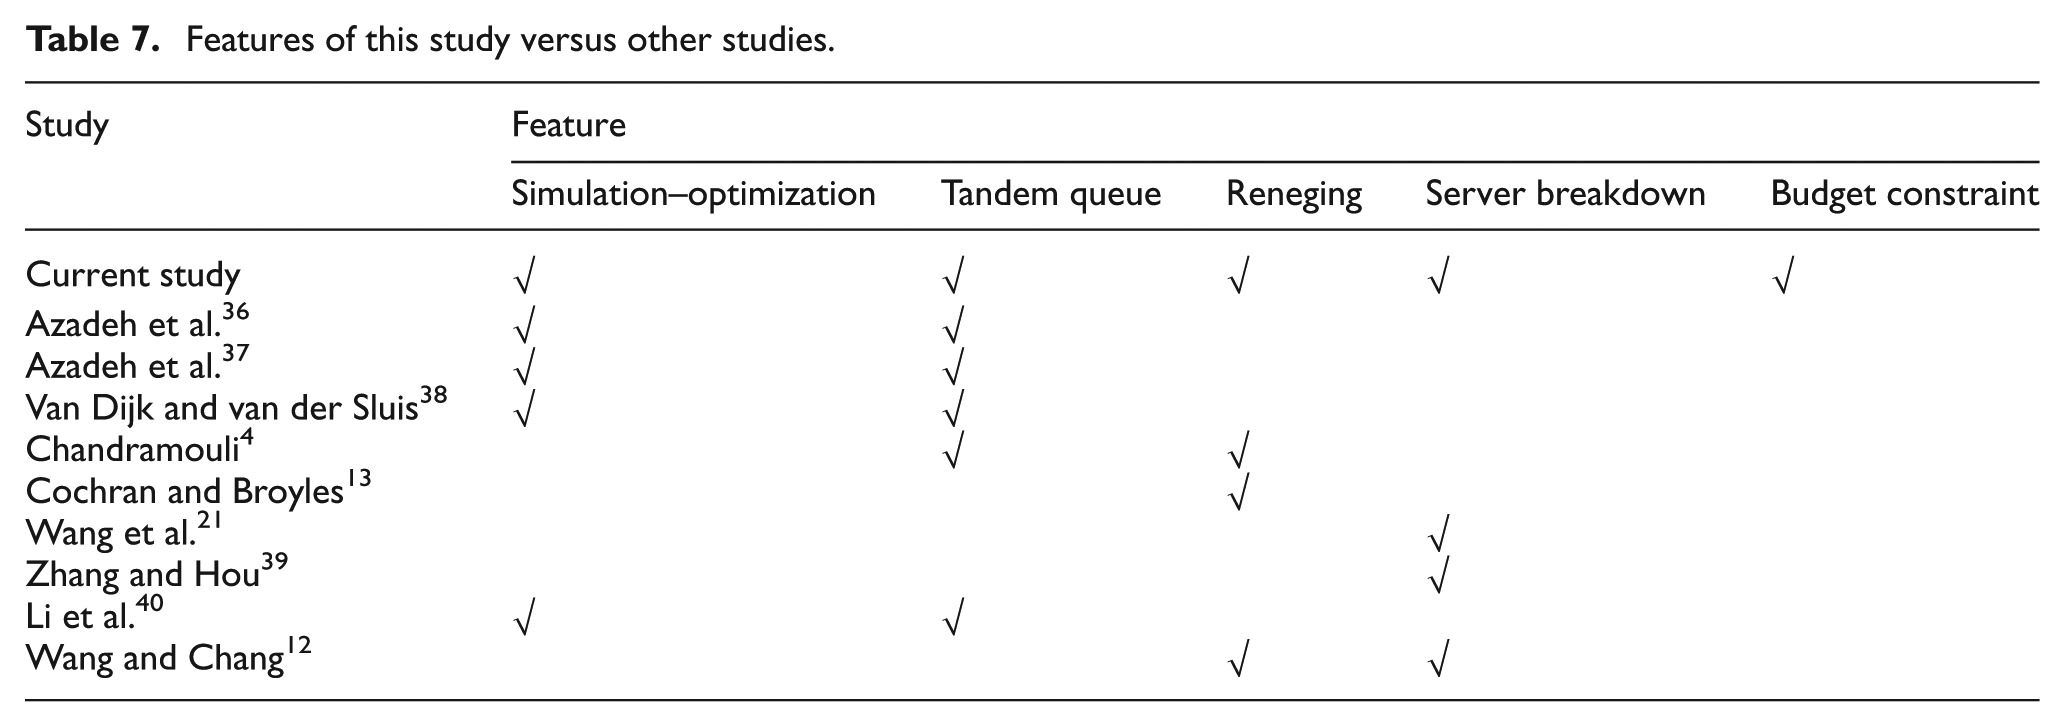
The features of the proposed simulation–optimization model are presented in Table 7. It is capable of providing a simulation model of the tandem queuing systems while reneging and server breakdowns were taken into account. Considering the given limitations of the system, including budget and capacity constraints, this model has the ability to optimize the performance of queuing systems in accordance with the desired objectives. Furthermore, it is able to reduce the computation time in comparison with the traditional simulation method. Therefore, the proposed model can help the designers of queuing systems improve the system performance by referring to the system’s limitations and the specified targets.
Features of this study versus other studies.
Footnotes
Funding
This study was supported by a grant from University of Tehran (No. 8106013/1/20). The authors are grateful for the support provided by the College of Engineering, University of Tehran, Iran. This study was also supported by a grant from the Iran National Science Foundation (No. 94002128). The authors are grateful for the financial support provided by the Iran National Science Foundation.