
Abstract
To study the law of sizes on gas explosions, numerical simulations of methane–air mixture explosions in spherical vessels were performed. The law of sizes on gas explosions is studied using FLUENT simulations with the
1. Introduction
In modern industrial production processes, most of the gas in a chemical process reactor is flammable, and the combustible gas is in a high-temperature, high-pressure condition. Thus, if equipment malfunction or damage occurs, a serious fire or explosion accident may result. Two safety characteristics are essential for the design of explosion protection: the maximum explosion pressure Pmax and the maximum explosion pressure rising rate (dp/dt)max, and/or according to the cube law, the KG-value (Equation (1) in NFPA 68 1 ). Parameter K (MPa2·s−1) can also be used to describe the danger degree of explosion. 2 It represents the product of the maximum explosion pressure and maximum pressure rising rate:
Many scholars conducted extensive research on the numerical simulation of gas explosion in vessels and pipes. Studies have found that a variety of vessel properties can influence the explosion process, such as the vessel–pipe combined form, size, and structure.3,4 The explosion intensity varies with the geometric size of the vessel when combustible gas explodes. This phenomenon is called the size effect.5–7 Zheng and Wang 8 and Shen and Du 9 established different pipe models with different cross-sections and lengths. Their studies demonstrated that at the beginning of the spreading of a sudden expansion in a pipe, part of the detonation wave is attenuated into a deflagration wave. The different peak values of the detonation overpressure in different cross-section shapes of the gallery result in significant differences. Maximum explosion pressure of the tunnel with a circular cross-section is minimum, at about 60% of the straight wall–circular arch tunnel’s value. The maximum explosion pressure of the square tunnel is the most, and is three times as high as that of the straight wall–circular arch tunnel. Yi et al. 10 and Singh 11 studied the gas explosion process in different connected vessels. The results of these experiments show that because of the special structure of a linked vessel, compared with an independent vessel or pipe, the explosion process of the internal premixed gas in a linked vessel is more complex. Furthermore, the ignition position, volume ratio between containers, and the ratio between the length and diameter of the container all influence the maximum explosion pressure.
Currently, the complex phenomena that occur in a gas explosion and the scarcity of experimental data hinder a quantitative understanding for such explosions. As a consequence, only a few indications exist regarding their prevention and mitigation. Specifically, there are only a few numerical simulations of gas explosions in spherical vessels. The law of gas explosion in the container or pipe, the properties of the explosion source, and the influence of obstacles on the explosion process are extensively studied. The current study is mainly aimed at the size effects of gas explosions in spherical vessels under different physical conditions. Therefore, in this paper, numerical simulations of the gas explosion process in a spherical vessel of different sizes are performed. The size effects of methane–air mixture explosions in a spherical vessel are further analyzed, which provides references for the safe design of industrial vessels and a model system that can be used to test and design industrial vessels.
2. Numerical simulation model
2.1 Experimental model
The experiments were performed in two spherical vessels with volumes of 110 and 22 L with diameters of 600 and 350 mm, respectively, as shown in Figure 1. The two spherical vessels are made out of 16 MnR steel. The wall thickness of the 110 L vessel is 0.025 m, and that of the 22 L vessel is 0.015 m. The working pressure of the two spherical vessels is 2 MPa. The design pressure of the two spherical vessels is 20 MPa. An XDH-6 storage battery was used as the electrical ignition source for high-voltage spark plugs, where the ignition position was at the center of the vessel. The ignition energy is 6 J. A SY-9506 compound gas system, which is capable of rapidly producing an accurate methane–air mixture by controlling the velocity of the gas, was used. In this study, this system was used to obtain a mixture of methane and air with a concentration of 10%. The explosion pressure was monitored by means of a CYG 1401MF pressure transducer with a detection zone of 0–5 MPa, which has an error of less than 0.25%. The signals from the pressure transducers were recorded with a multi-channel data acquisition system (JV 5231) that can provide eight synchronous sampling channels.
Structure diagram of the spherical vessels.
The experimental conditions are shown in Table 1. The initial temperature is 300 K. The initial pressure is 0.1 MPa. The methane concentration is 10%. Explosion pressure changes of the spherical vessels were measured by the pressure sensors. Each set of experiments was done three times, and average pressure values are reported in this paper.
Comparisons between large vessels and small vessels.
2.2 Computational model
2.2.1 Numerical modeling and grid size
The spherical vessels are all characterized by a regular morphological form. Thus, in this paper, a two-dimensional (2D) model is applicable. To adapt to a 2D circular round face, an unstructured triangular grid is adopted. The grid size of the simulation mesh is 5 mm in this paper. To verify the effectiveness of the grid size, leaving all other conditions unchanged, different space sizes of grids of 3, 4, 5, 6, and 7 mm are compared, and the calculation results are shown in Table 2. The maximum explosion pressure (Pmax) decreases gradually with the decrease of the grid space dimension. In addition, when the space size is 5 mm or less, the maximum explosion pressure tends to be stable and close to the experimental results. Hence, a grid space size of 5 mm is the most appropriate.
Grid validation.
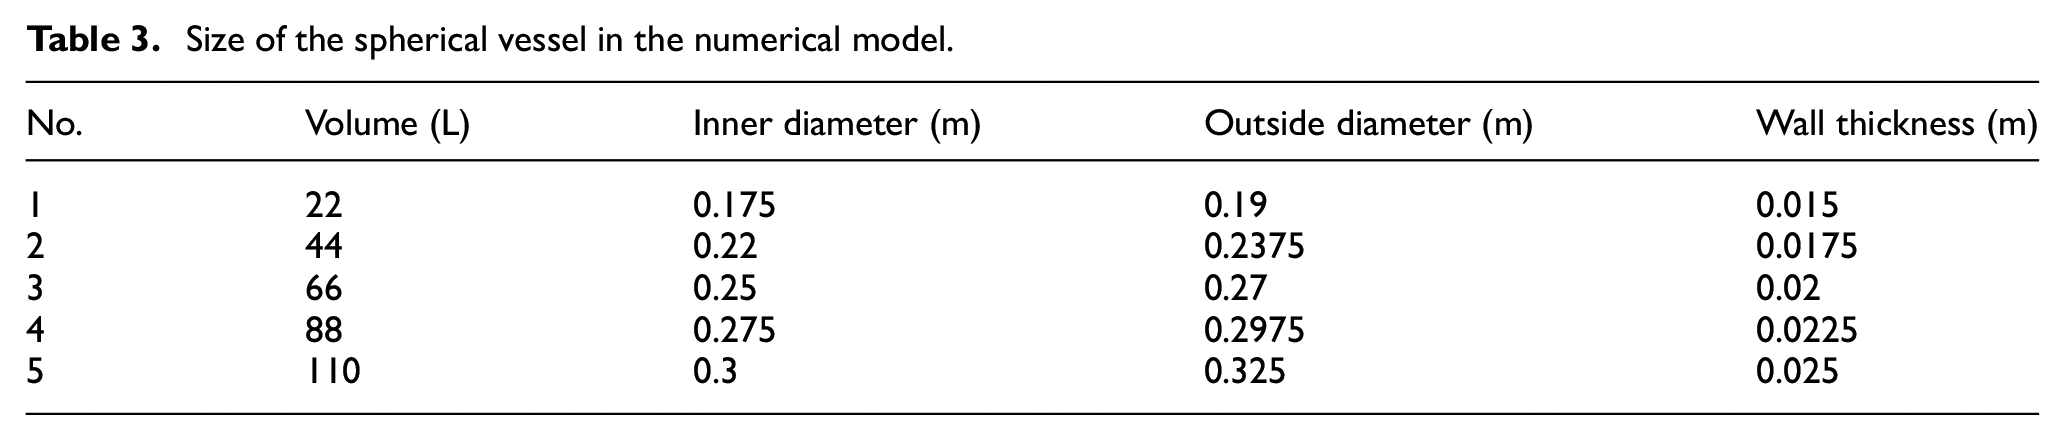
As shown in Figure 2, two monitoring points are set for pressure and temperature monitoring. The physical model of the wall thickness is considered in the numerical model. The material of the annular region of the spherical vessels is 16 MnR metal. Fluid–solid heat coupling is used between the fluid area and solid in the model. The density is set to 7900 kg·m−3 and the specific heat and thermal conductivity coefficient are set to 496 J/ (kg·K) and 54 W/ (m·K), respectively. The reaction models studied in this paper involve a one-step reaction. The numerical model size of the spherical vessel is shown in Table 3.
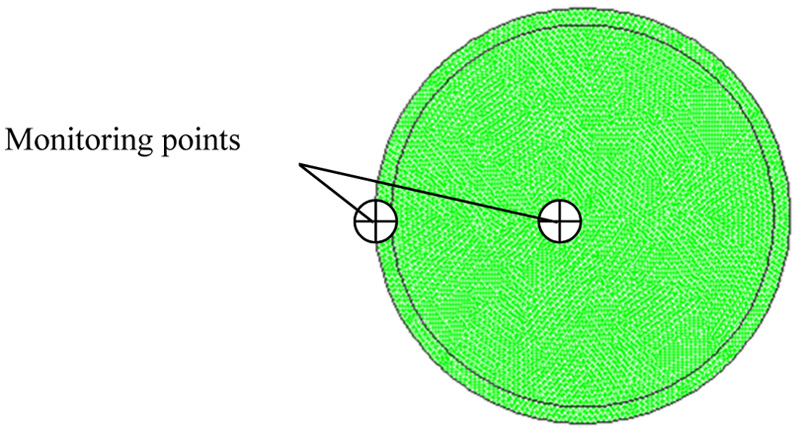
Schematic diagram of a spherical vessel.
Size of the spherical vessel in the numerical model.
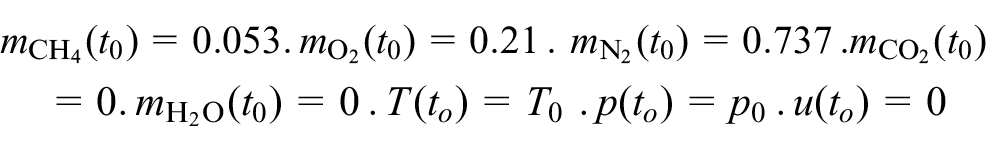
2.2.2 Initial conditions and boundary conditions
The initial concentration is 10% methane–air premixed gas when the initial time is t0. The initial temperature of the whole flow field is 300 K and the initial pressure is 0.1 MPa. The input parameters for the premixed gas are as follows. The experimental devices used in this paper are spherical vessels, so the wall condition is adopted for the exterior and interior walls as boundary conditions, and an axisymmetric condition is used for the center of the 2D domain. The ignition is realized by giving the initial temperature of 2000 K at 1/10 of the area in the center of the spherical vessel, and setting 50% of the gas mixtures in that area to be completely reacted:
2.2.3 Governing equations and the discretization equation
The essence of simulated calculation on a closed gas explosion in the spherical vessel is to solve the incompressible viscous flow N-S equations.
12
The explosion problem studied in this paper is a turbulence fully developed problem, so the
In this paper, we used three models consisting of five sub-modules. The first one is the adiabatic model that contains the
2.3 Numerical simulation validation
The methane–air mixture explosion experiments were performed in 22 and 110 L spherical vessels. The ignition position is at the center of the spherical vessel, and the concentration of methane is 10%. In this section the heat dissipation and thermal radiation model is used. In addition, the spherical vessels adopted in the experiment are the same as that in the numerical model. A comparison of the trends in the explosion pressure and explosion pressure rising rate obtained from the experiments and numerical simulation of the 22 L spherical vessel is shown in Figures 3 and 4, and that of the 110 L spherical vessel is shown in Figures 5 and 6. The maximum explosion pressure results are presented in Table 3.
Explosion pressure comparison between experimental and numerical simulation results in a 22 L vessel.
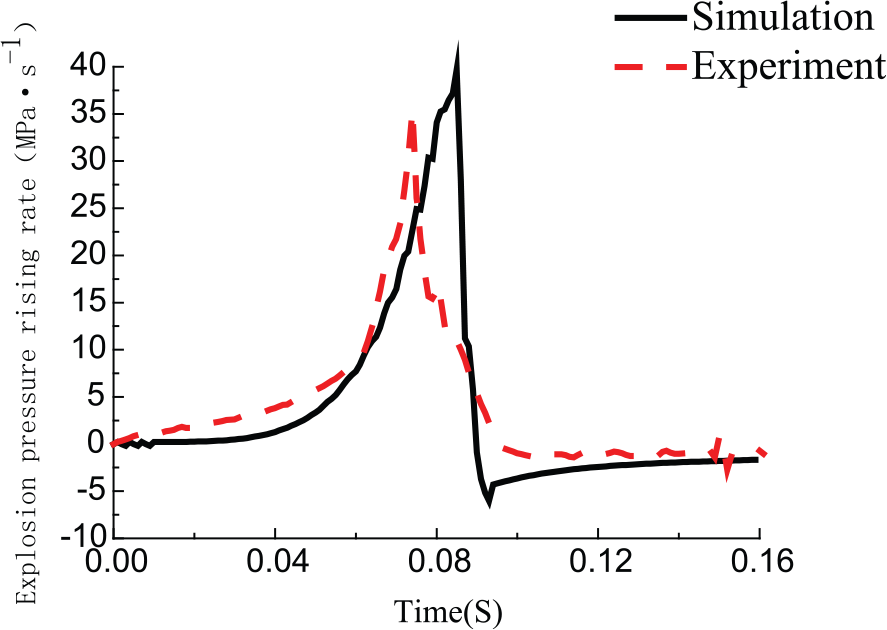
Explosion pressure rising rate comparison between experimental and numerical simulation results in a 22 L vessel.
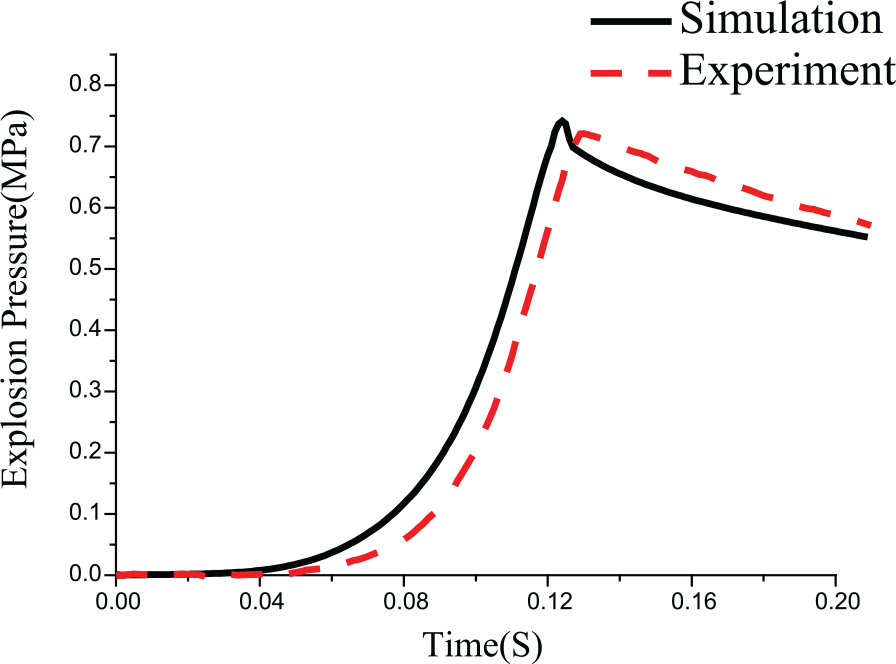
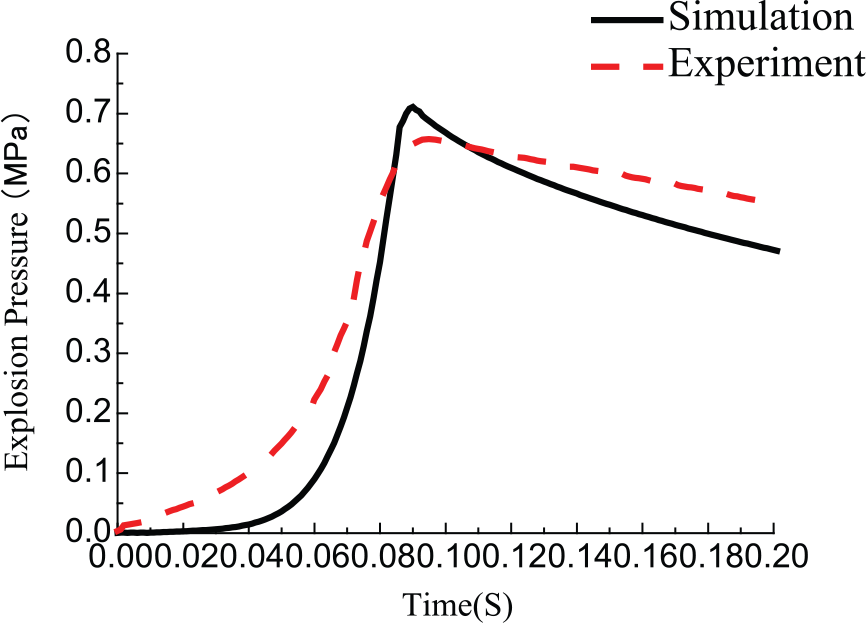
Explosion pressure comparison between experimental and numerical simulation results in a 110 L vessel.
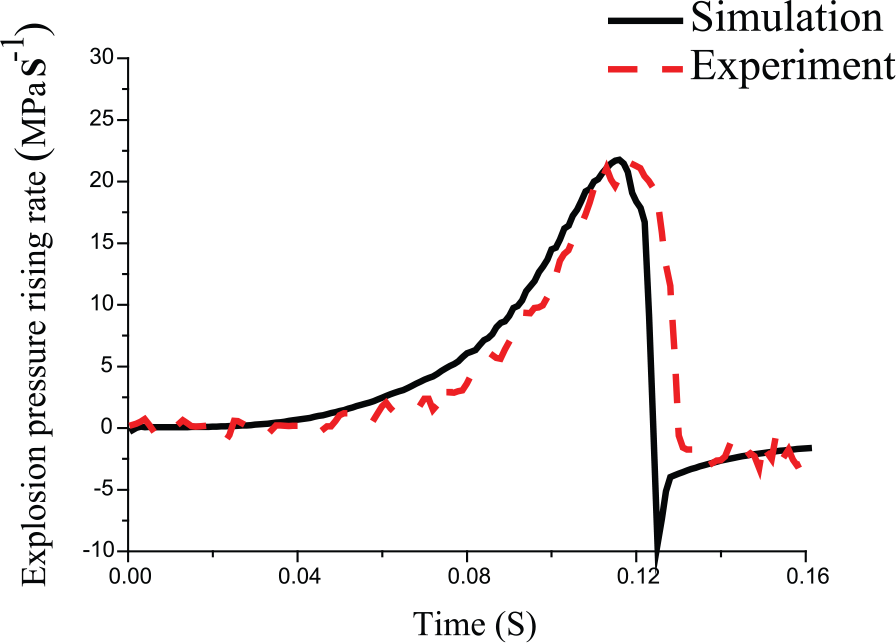
Explosion pressure rising rate comparison between experimental and numerical simulation results in a 110 L vessel.
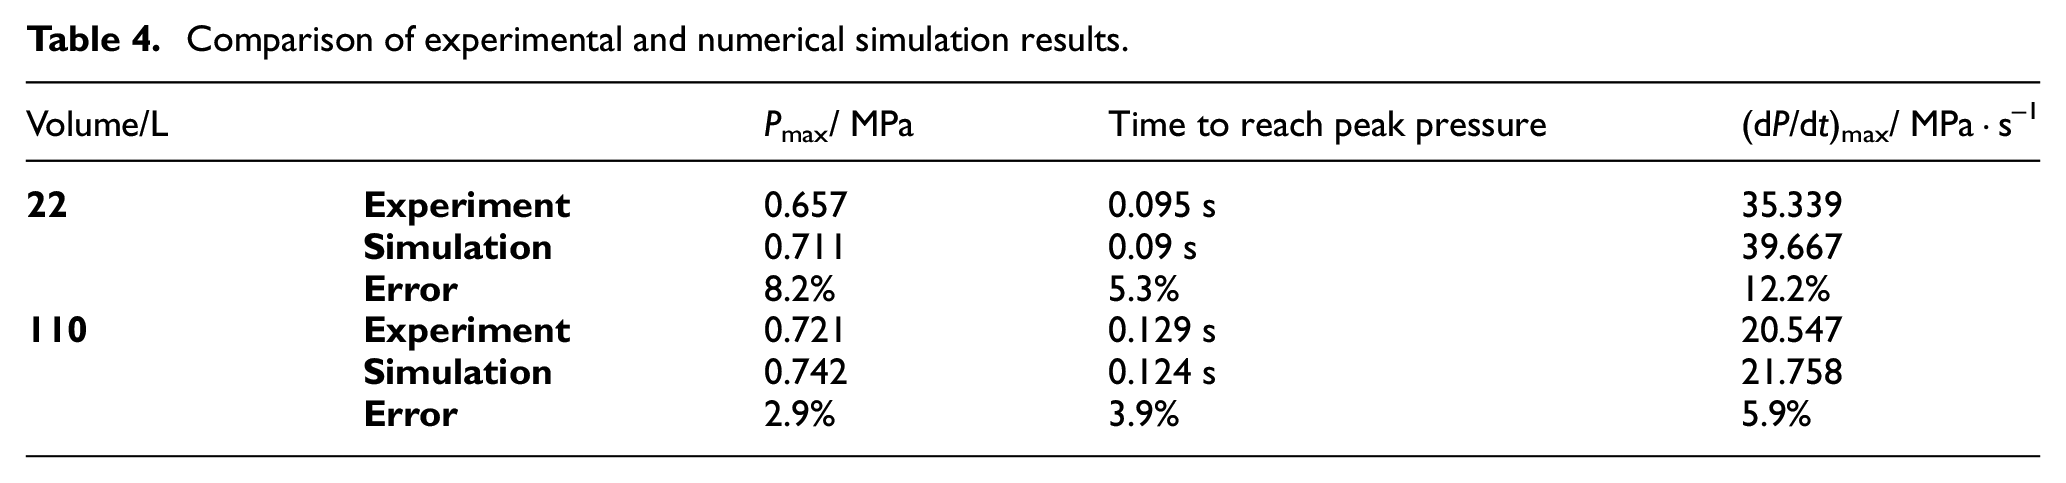
As shown in Figure 3 and Table 4, compared with the experimentally obtained value of 0.678 MPa in Wang et al., 13 the experimental error is 3.1%. Thus, this experimental result can be thought of as accurate. The simulated results accurately capture the experiments. From Figures 3–6 we can find that there is a common changing trend between the experimental data and the results of the numerical simulation. The error of the maximum explosion pressure between the simulation and experiment is 8.2%, and the time error regarding the amount of time required to reach the explosion pressure peak is 5.3%. Furthermore, for the 110 L spherical vessel, the maximum experimental explosion pressure is 0.721 MPa with an error of 2.9% and time error of 3.9%. The error of the maximum explosion pressure rising rate of the 22 L spherical vessel is 12.2% and that of the 110 L spherical vessel is 5.9%, which are all within an acceptable range. The primary reason for the error is neglecting the vessel wall roughness and certain heat losses, such as the absorption of carbon on the vessel inner wall in the process of the numerical simulation. After reaching the maximum explosion pressure, the simulated pressure gradually decreases with time, which is consistent with the pressure drop trend in the experiments. This result demonstrates that the heat dissipation and thermal radiation model is more suitable, where the process of energy loss is truly reflected in the experiments. Therefore, this model can be used to numerically simulate a gas explosion in a spherical vessel.
Comparison of experimental and numerical simulation results.
3. Results and discussion
3.1 Wall heat dissipation and heat radiation effects on gas explosion
Three explosion environments were simulated: adiabatic, wall heat dissipation, and the combined effects of wall heat dissipation and heat radiation by using these three models. After ignition in the center of the spherical vessels (with volumes of 22, 44, 66, 88, and 110 L), the explosion pressure is recorded. For the three explosion environments, the explosion pressure histories from the different sized spherical vessels are illustrated in Figure 7.
Curves of explosion pressure in different volumes of spherical vessels under different thermal conditions.
As shown in Figure 7 and Table 5, the wall heat dissipation and heat radiation all influence the gas explosion intensity in the five volumes of spherical vessels. The explosion reaches the maximum explosion pressure of 0.82 MPa under the adiabatic condition. However, the explosion pressure does not decay after reaching the maximum explosion pressure. Compared with the adiabatic condition, the maximum explosion pressure under the condition of wall heat dissipation is smaller, although the difference is minor. The explosion pressure exhibits a slow downward trend after reaching its peak, where its decreasing range decreases with increasing vessel volume. In contrast to the adiabatic simulation, the maximum explosion pressure clearly drops under the combined effects of heat dissipation and heat radiation. In addition, the explosion pressure decreases much more rapidly after reaching the maximum explosion pressure than when only heat dissipation is considered.
Explosion characteristic parameters in spherical vessels with different volumes.
In consequence, the explosion intensity is affected by the wall heat dissipation. However, the effect is small. The size effect is significant under the combined effects of heat dissipation at the wall boundary and thermal radiation. The maximum explosion pressure and the maximum explosion pressure rising rate significantly decrease compared with that under the adiabatic condition or wall heat dissipation condition. In the gas explosion process, the influence of thermal radiation in a spherical vessel on the explosion intensity is evident and plays a dominant role. The maximum explosion pressure increases with volume of the spherical vessel, whereas the rate at which the maximum pressure increases decreases with volume of the spherical vessel.
3.2 Size effects under an adiabatic condition on gas explosions in spherical vessels
In this numerical simulation of a closed gas explosion, the numerical model used is the adiabatic model. Five spherical vessel volumes are tested: 22, 44, 66, 88, and 110 L. By setting the high-temperature area of ignition in the center of the spherical vessels, heat loss is neglected. Figures 8 and 9 show the results of the simulation. The explosion pressure–time curves under different sized vessels are shown in Figure 8. Curves of the explosion pressure rising rate with times under different sized vessels are shown in Figure 9.
Curves of explosion pressure in spherical vessels of different volumes under the adiabatic condition.
Curves of explosion pressure rising rate with time in spherical vessels of different volumes under the adiabatic condition.
Figure 9 and Table 5 show that the maximum explosion pressure rising rate decreases with the volume of the spherical vessel. The maximum explosion pressures in different spherical vessels from the numerical simulation are all 0.82 MPa. Both the maximum explosion pressure and the maximum explosion pressure rising rate are greater than those of the experimental results. This is primarily because under an ideal state, the explosion pressure is only related to the initial and end state of the explosion; furthermore, there is no heat loss.14–17 Therefore, the maximum explosion pressure is constant due to having the same initial condition and without energy loss.
Through the above analysis, under an adiabatic condition, the size effect on the explosion intensity is small, which is primarily because in the process of numerical simulation, heat dissipation and thermal radiation that result from the wall materials and roughness of the spherical vessel are ignored. Therefore, the pressure constraint on each infinitesimal surface in the vessel is the same under the condition of no heat loss. The maximum explosion pressure is equal, and the explosion pressure rising rate is related to volume; however, the results do not coincide with the “cube” law.
3.3 Size effects under the wall heat dissipation condition of gas explosions in spherical vessels
Numerical simulations of a closed gas explosion were conducted for five different spherical vessels under the condition of wall heat dissipation by using the heat dissipation model. The ignition position is located at the center of the vessels. The fluid–solid interface was set at the critical plane of the fluid and solid areas to calculate the heat exchange between these two areas. In addition, this model considered wall heat dissipation but not heat radiation loss. The explosion pressure–time curves for different vessel sizes are shown in Figure 10. The explosion pressure rising rate–time curves for different vessel sizes are shown in Figure 11.
Curves of explosion pressures in spherical vessels of different volumes under the condition of heat dissipation.
Curves of explosion pressure rising rate in spherical vessels of different volumes under the condition of heat dissipation.
As shown in Figures 10 and 11, the explosion pressure experienced a slow increase, then a sharp increase, and finally slowly decreased after reaching the peak for each of the five volumes. In contrast to the adiabatic explosion process, the entire fluid area and solid area are coupled to the energy transfer within the first seconds of the explosion. As the explosion develops, the high-temperature gas in the fluid area creates convection heat transfer inside the wall surface, which gradually increases the wall temperature and results in energy loss from the gas. As a consequence, the explosion pressurization tends to slow down after reaching the maximum explosion pressure in the thermal heat dissipation simulation, as demonstrated by comparing Figure 11 with Figure 9.
Table 5 demonstrates that a small size effect occurs when modeling only thermal dissipation to the walls. The maximum explosion pressure increases with volume of the spherical vessel, whereas the maximum pressure rising rate decreases with volume of the spherical vessel. The simulation results are slightly greater than the experiment results, which is mainly because the absorption of the wall and the combustion products H2O and CO2 on the flame thermal radiation are ignored in the process of simulation. The convective heat transfer coefficient of different materials varies, and is minimal for the gas. Thus, the temperature increases sharply after the gases are ignited, but due to the lower convective heat transfer coefficient, the heat transfer between the gas and the wall is deficient during the process of gas explosion. Furthermore, there is less heat dissipation, where the influence on the explosion intensity is also lower.
The temperature curves for spherical vessels with different volumes are shown in Figure 12. The inner wall surface temperature curves for spherical vessels with different volumes are shown in Figure 13. Figure 12 shows that the temperature inside the spherical vessel dramatically increases and then slowly decreases after reaching the peak temperature. In Figure 13, the warming trend of the inner surface temperature is clear, and the temperature also slowly decreases after the temperature reaches its highest value.
Temperature curves in the middle of the spherical vessels of different volumes.
Temperature curves of the inner wall surface in spherical vessels of different volumes.
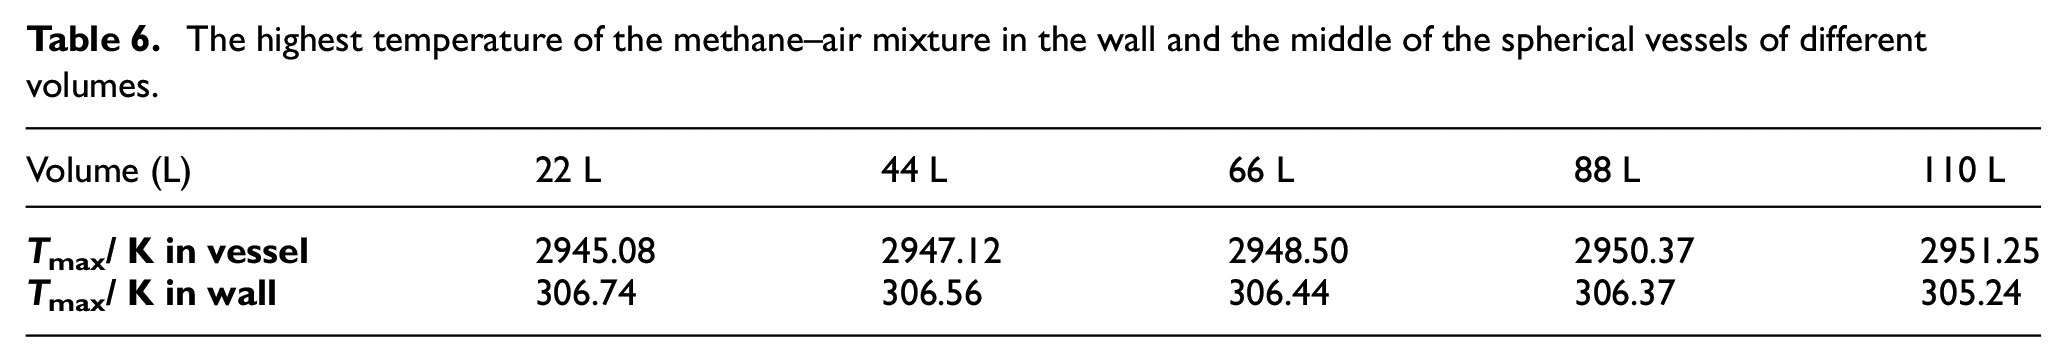
Table 6 shows that the highest temperature gradually increases as the volume of the spherical vessel goes up. The maximum temperature is 2951.25 K, and the minimum temperature is 2945.08 K. When the maximum explosion pressure is reached in the spherical vessel, the maximum wall temperature is 306.74 K, and the minimum wall temperature is 305.24 K. The highest wall temperature decreases with the volume of the spherical vessel because of the convection heat transfer between the wall and the internal gas. The larger the spherical vessel diameter is, the greater the temperature gradient is, such that the gas energy transfer from the sphere center to the wall requires more time. In large vessels, the surface for convection heat transfer is insufficient compared with that of smaller vessels. Furthermore, the energy of the high-temperature gas is transferred to the solid surface, which increases the surface temperature and gradually spreads heat to the outside wall. So, the wall temperature decreases slowly after reaching the maximum wall temperature. The wall temperature does not vary greatly among vessels of different sizes because of the low convection heat transfer efficiency. Thus, the wall heat dissipation is not the primary factor for the size effects.
The highest temperature of the methane–air mixture in the wall and the middle of the spherical vessels of different volumes.
3.4 Size effects under the wall heat dissipation and heat radiation condition of gas explosions in spherical vessels
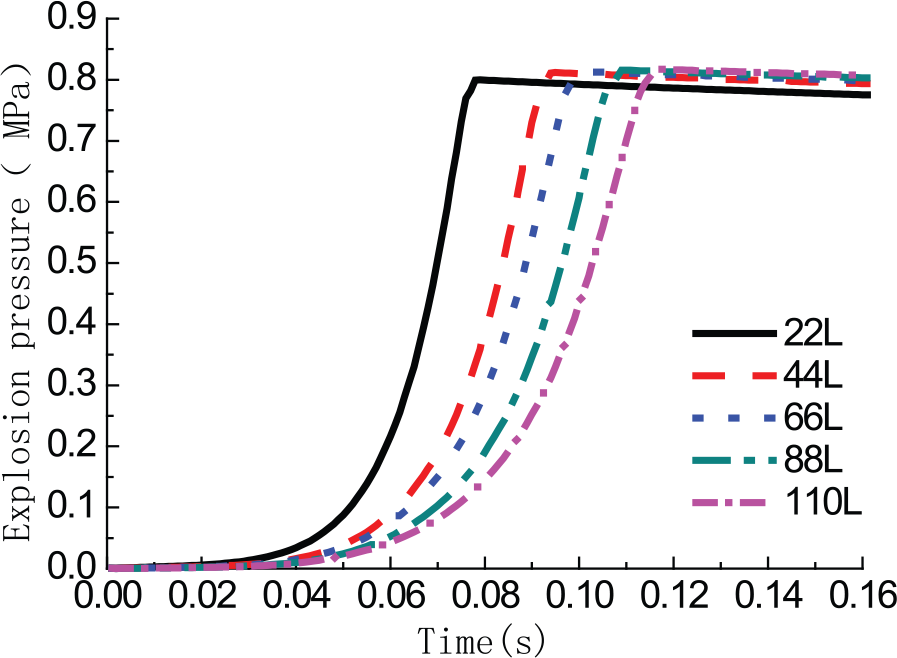
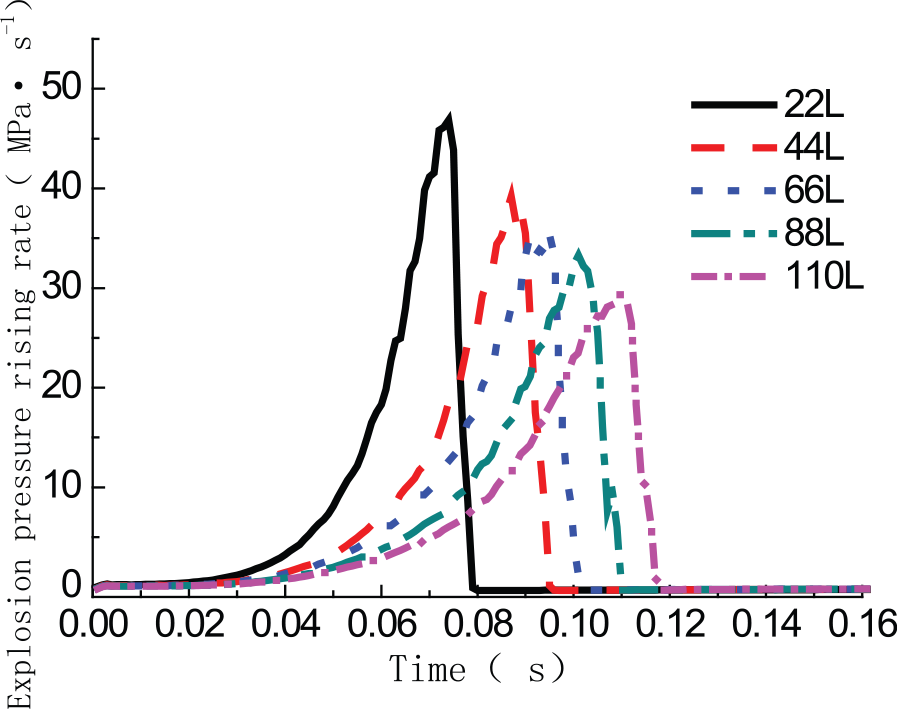
The numerical simulation for a closed gas explosion was conducted for five spherical vessel models by using heat dissipation and heat radiation models. The P1 radiation model is added to the simulations on the foundation of the fluid–solid heat coupling surface that is set at the critical plane of the fluid and solid zones. Furthermore, the radiation and absorption between H2O, CO2 and the wall must be considered in the explosion process. Figure 14 shows the explosion pressure–time curves under different sized vessels. The explosion pressure rising rate–time curves under different sized vessels are shown in Figure 15.
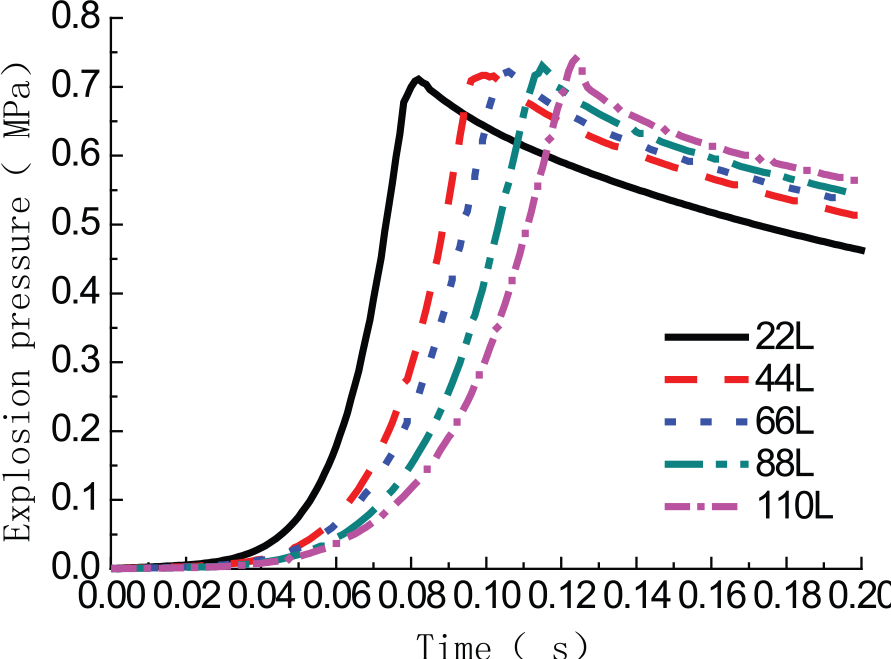
Explosion pressure curves in spherical vessels of different volumes under the condition of heat dissipation and thermal radiation.
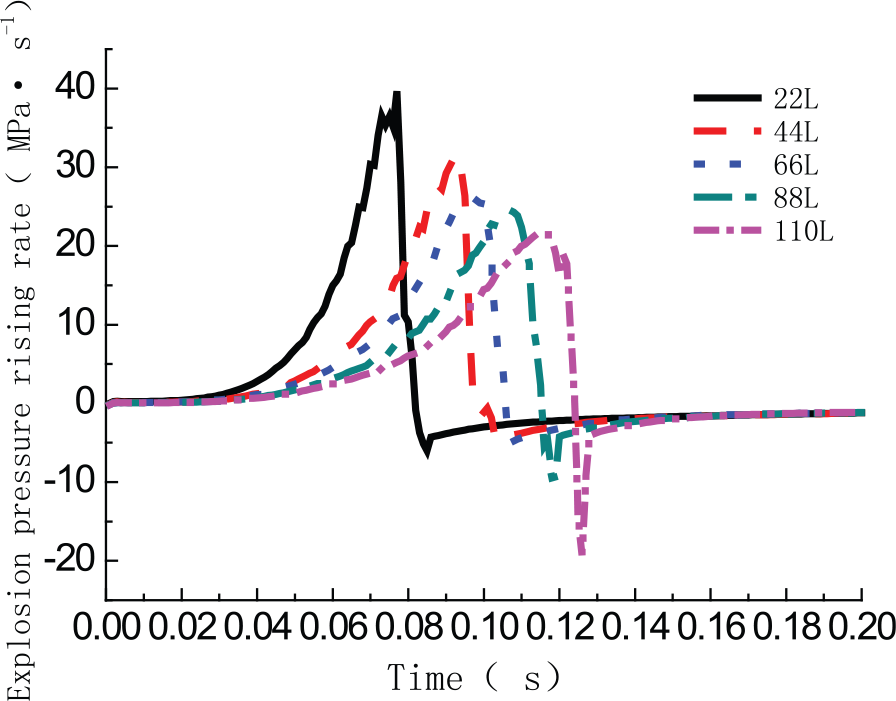
Curves of explosion pressure rising rate in spherical vessels of different volumes under the condition of heat dissipation and thermal radiation.
As shown in Figures 14 and 15, the explosion pressure slowly increased, then sharply increased, and finally slowly decreased after reaching the peak in all five spherical vessels. Unlike the closed explosion process under the condition of wall heat dissipation, there is not only energy transfer between the fluid area and solid area, but also, there is radiation and absorption of the energy when the explosion begins under the condition of wall heat dissipation and heat radiation. Following the explosion, the high-temperature gas within the fluid area continuously transforms heat energy into radiant energy. Simultaneously, the combustion products of H2O and CO2 in the center area of the vessels constantly absorb both the ambient gas and the thermal radiation that is reflected by the wall. Then, the absorbed radiant energy is converted into heat energy. The wall temperature constantly increases because of the high-temperature gas radiation, which causes more energy loss. After the explosion, thermal radiation is ongoing, and the high-temperature gas, wall, and external environment do not reach thermal equilibrium. Thus, energy loss is still ongoing. Under the combined effects of heat dissipation at the wall boundary and thermal radiation, the explosion pressure rapidly decreases after reaching the maximum explosion pressure.
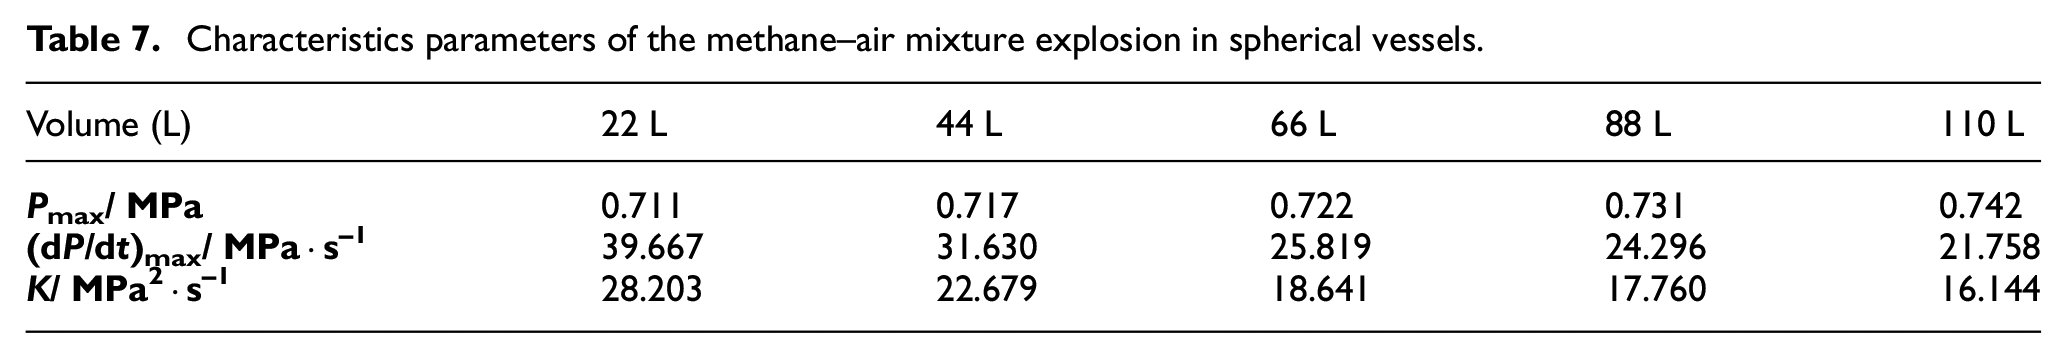
Table 7 shows that the size effect on the explosion intensity is clear under the combined effects of heat dissipation at the wall boundary and thermal radiation. As the volume of the spherical vessel increases, the maximum explosion pressure increases, whereas the maximum pressure rising rate decreases with the volume of the spherical vessel. From the analysis of the above phenomenon, after center ignition, transient laminar burning is formed first under the influence of the matrix differential speed mechanism of the flame front. Then, combustion spreads to the unburned zone. As the combustion products gather, the pressure and temperature increase rapidly, which causes the speed of the wave propagation to gradually accelerate. The variation degree of the local gas’s turbulence state in the flow field caused by a shock wave is similar to that from a pressure change process because of the geometric symmetry of the spherical vessels. Compared with the larger vessels, the spread distance of the shock waves from the center to the wall is shorter in the small vessels. After repeated oscillation in the small vessel, the rate of the pressure increase is higher. The time it takes for the gas temperature to reach its maximum is shorter at the wall, and the efficiency of the convective heat transfer is also greater. Thus, under the condition of wall heat dissipation and thermal radiation, the smaller the diameter of the vessels is, the greater the energy loss and the smaller is the maximum explosion pressure.
Characteristics parameters of the methane–air mixture explosion in spherical vessels.
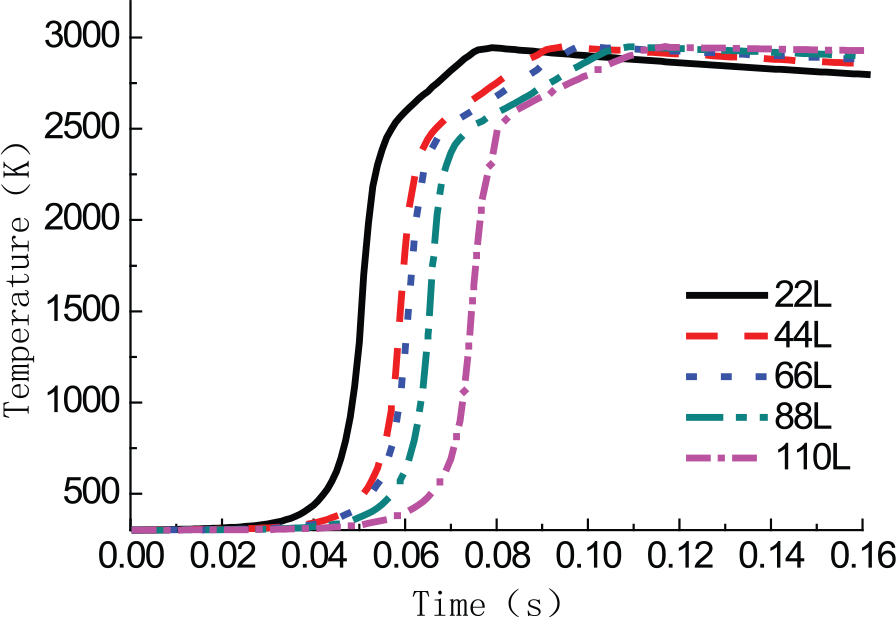
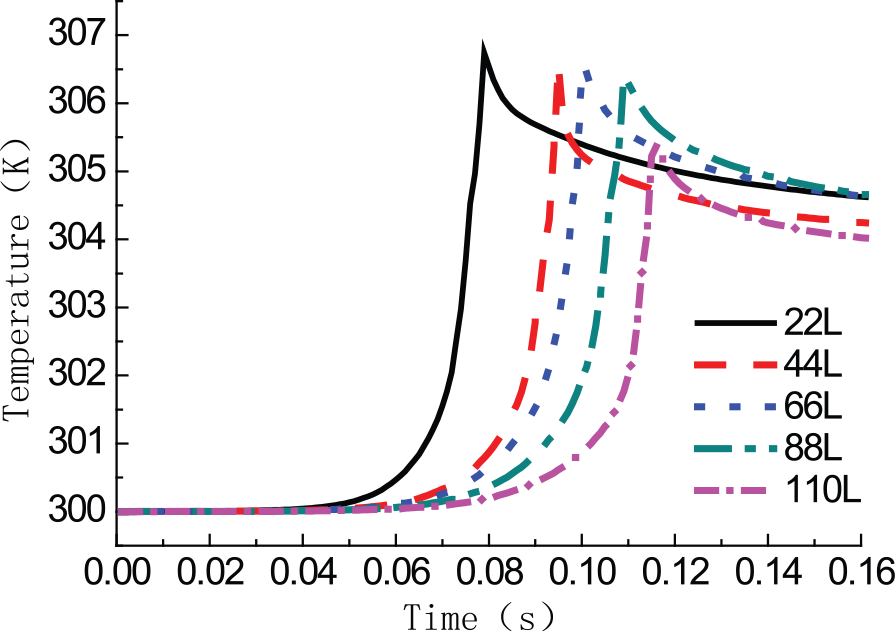
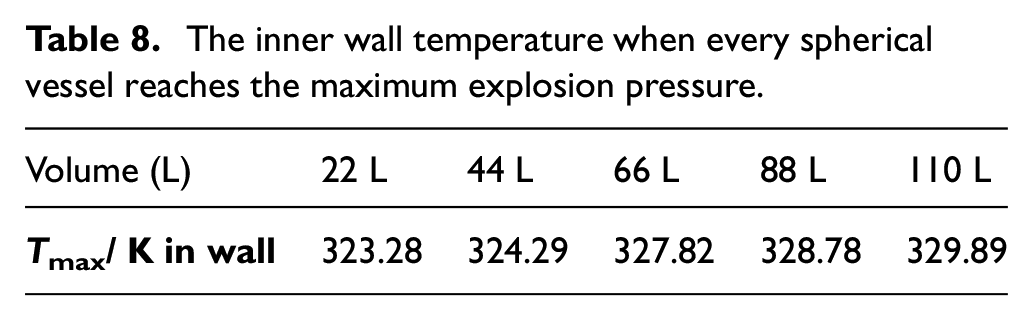
Figures 16 and 17 indicate that under the condition of wall heat dissipation and thermal radiation, the changing trends of internal temperature and inner wall temperature are similar to that of the adiabatic condition or the wall heat dissipation condition. Figure 16 shows that the highest temperature gradually increases with volume of the spherical vessel. The maximum temperature is 2628.53 K, and the minimum temperature is 2474.93 K. Table 8 shows the inner wall temperature when every spherical vessel reaches the maximum explosion pressure. The maximum inner wall temperature is 329.89 K, the minimum value is 323.28 K, and the wall temperature increases with volume of the spherical vessel. However, after reaching the maximum explosion pressure, the inner wall temperature of every spherical vessel continues to rise and then drop in an irregular manner. This is primarily because there is convection heat transfer between the wall and fluid of the spherical vessel. In addition, after the thermal radiation energy is projected to the wall, it is repeatedly absorbed and reflected. The energy that reaches the wall from extremely short distances is absorbed, and the remaining energy is reflected. Absorption decreases the amount of radiant energy. As a result, a larger diameter of the spherical vessel results in more reflected radiant energy, more surface absorption of the radiant energy, and higher wall temperatures. Under the condition of wall heat dissipation, the wall temperature decreases as the spherical vessel size increases. However, if the combined effects of the wall heat dissipation and thermal radiation are considered, the wall temperature would decrease as the spherical vessel size increases. Thus, thermal radiation plays a dominant role in the explosion energy loss in spherical vessels of different sizes.
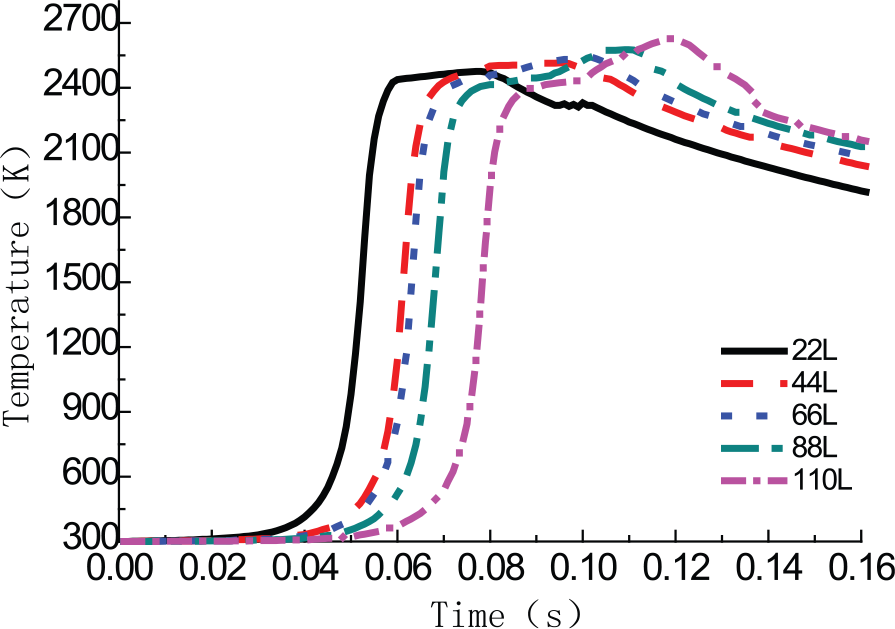
Temperature curves in spherical vessels of different volumes.
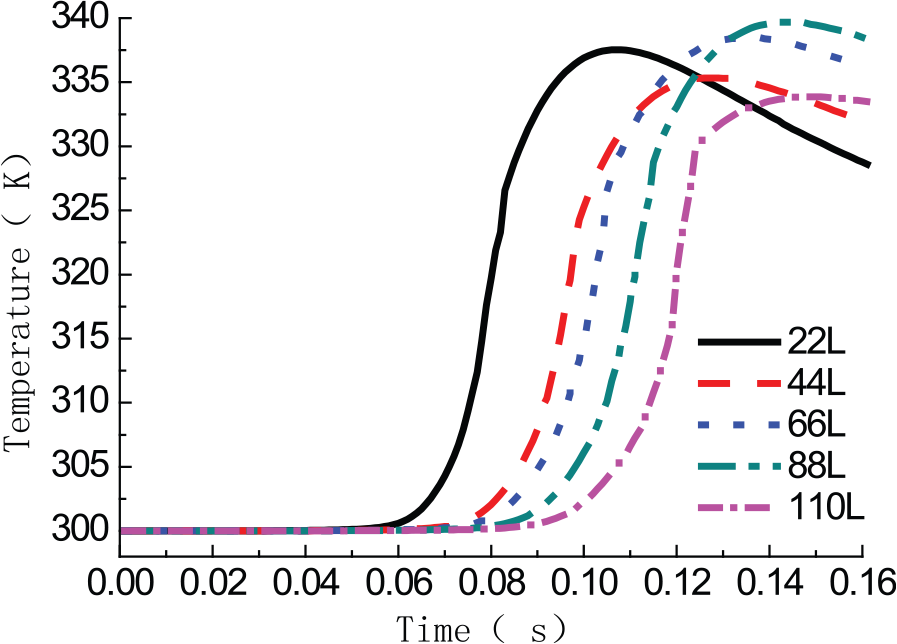
Temperature curves in the inner wall surface of spherical vessels of different volumes.
The inner wall temperature when every spherical vessel reaches the maximum explosion pressure.
4. Conclusions
Convective heat dissipation and heat radiation both influence the explosion intensity, although the latter is dominant. The size effect on the explosion intensity is significant under the combined effects of heat dissipation at the wall boundary and thermal radiation. Compared with the adiabatic condition, the maximum explosion pressure is larger when these effects are considered, which is consistent with experimentally observed phenomena. Under the adiabatic condition, the maximum explosion pressure is constant at 0.82 MPa in spherical vessels of different sizes. The explosion intensity decreases due to the energy loss caused by the heat dissipation. However, the pressure decrease is not significant, and the size effect is not obvious. Considering both heat dissipation at the wall boundary and thermal radiation influences the explosion intensity. The maximum explosion pressure increases with the volume of the spherical vessel, whereas the maximum pressure rising rate decreases with volume of the spherical vessel, which coincides with the “cube” law.
Footnotes
Funding
The authors are grateful for the support given by the National Natural Science Foundation of China (grant number 51376088), the National Key Research and Development Plan (number 2016YFC0800102), the Opening project of the State Key Laboratory of Explosion Science and Technology (Beijing Institute of Technology; grant number KFJJ16-03M), and the Jiangsu Project Plan for Outstanding Talents in Six Research Fields.