
Abstract
Recognizing the need for responsible highway agencies to effectively manage emerging autonomous vehicles (AV) flows in contending with daily recurrent congestion, this study presents a systematic procedure for understanding the impacts of AV flows on traffic conditions under different AV behavioral mechanisms (i.e., car-following and lane-changing), and different penetration rates. Research results show that the presence of AV flows, depending on their adopted behavioral mechanisms, may have significant (either positive or negative) impacts on the overall traffic conditions. Hence, it is essential for responsible highway agencies to have proper operational guidelines to manage and coordinate AV flows. To demonstrate the proposed methodology, this study has carried out extensive simulation experiments using a congested segment of the MD-100 network (a multilane highway segment located in Maryland) under various AV penetration rates and observable behavioral patterns. The collected Measures of Effectiveness highlight that at each AV penetration level there exists a set of optimal behavioral patterns for the AV flows to coordinate with non-AV flows via the Vehicle to Infrastructure or Vehicle to Vehicle infrastructure so as to maximize the roadway capacity and minimize the resulting highway congestion.
Keywords
1. Introduction
Transportation technologies, primarily relating to autonomous vehicles (AVs), have evolved rapidly during the last decade and promise to have a significant impact on daily commuting patterns. Automobile companies, including BMW, Tesla, Audi, GM, and Ford, have plans to introduce AVs to public roads in the USA by the middle or end of the next decade.1–5 To support the advancement of AV technologies, federal agencies have sponsored multiple legislations during the past five years.6,7 With support from both the public and private sectors, it is inevitable that within the next decade, AVs will constitute a significant percentage of traffic flows on US highways.
Current AV technologies, such as ACC (Adaptive Cruise Control) and LKAS (Lane Keep Assist System), allow drivers to transfer control of the longitudinal behavior of the vehicle from the driver to the vehicle sensors. The International Organization for Standardization (ISO) recommends the manufacturers of ACC equipped vehicles to offer drivers a pre-defined desired time-gap setting ranging between 0.8 and 2.2 seconds. 8 Drivers may choose to assign time-gap settings, depending on their driving preference, the freeway traffic conditions, and confidence in the automation system. In doing so, the driver may choose the settings without the benefit of the entire highway system in mind. Conceivably, the prevalence and fast penetration of vehicles, equipped with autonomous capabilities, will have a significant impact on the dynamic properties of traffic flows and the congestion patterns. Hence, how to minimize the potential negative impacts of such AV flows on the traffic conditions, and also to ensure the best use of the available roadway capacity, will be a challenge for the responsible highway agency.
Over recent years, researchers have delved into understanding the impacts of different ACC control strategies and their interaction with human-driven vehicles at different penetration levels. For example, Kesting et al. 9 simulated a one-lane highway to test a proposed jam-avoiding driving strategy based on the Intelligent Driver Model (IDM), and observed that at 10% ACC vehicle flow rate the cumulative delay reduced by 50%. Tientrakool et al. 10 showed that when all vehicles in the system have ACC capabilities, the capacity increased by 43%. Some other studies also report that the introduction of ACC equipped vehicles to the traffic flow can avoid delays 11 in bottleneck areas and reduce congestion and jams. 12 ACC vehicles suppress wide moving jams and thus promote stability. 13 On the downside, however, they also found that in some cases ACC vehicles could induce congestion at bottlenecks.
The impacts of ACC on multilane highways have also been investigated through simulation-based methodologies. For example, Marsden et al. 14 carried out detailed simulation-based tests using a FLOSIM microscopic model and demonstrated that the average journey time increased at higher levels of ACC vehicle flows. Similar outputs were observed in other studies.15,16 They attributed the increase in average travel time to the sharp deceleration caused when non-ACC vehicles moved into the lane of ACC equipped vehicles, thereby resulting in the manual takeover of the ACC vehicle’s controls. In contrast, Kesting et al. 17 observed that ACC equipped vehicles could significantly reduce travel time, even at lower market penetration levels. They used a microscopic modeling approach, based on the IDM and lane-changing decisions with the MOBIL (Minimizing Overall Braking Induced by Lane Changes) algorithm. 18 Simulation results showed that at the market penetration rate of 25%, the traffic congestion in their simulated network was eliminated. From a safety standpoint, the Insurance Institute for Highway Safety 19 predicts that if all vehicles are installed with driver assistance technologies, such as forward collision warning, the total crashes and fatalities will drop by 33%. As AVs are equipped with more such technologies to improve their performance, it is expected that their introduction on freeways can result in a reduction of all accidents by up to 10%. 20 Apart from this, AVs with the embedded design feature of gradually accelerating and decelerating during the car-following stage can improve the overall fuel efficiency by up to 10%.21,22
To show the impacts of a mixed fleet of vehicles containing vehicles with CACC (Connected Adaptive Cruise Control) capabilities and human-driven vehicles, Arnaout and Bowling 23 simulated a four-lane highway using a microscopic traffic simulator and reported that the impacts of CACC on the flow rate were significantly different when the penetration levels were higher than 40%. Zhu and Ukkusuri 24 analyzed the mobility benefits of connected vehicles with different demand and penetration levels and showed a 20% reduction in travel time at 100% AV penetration rate. VanderWerf et al. 25 in their study of CACC systems observed that the roadway capacity increases quadratically with an increase in market penetration of vehicles equipped with CACC systems. The throughput of the highway segment is also expected to improve with the introduction of AV flows.26,27
Note that, despite the emergence of a large body of studies associated with AV properties, most such works are focused on the impacts of the different car-following logic of AVs. Very few studies have looked at the compounded impacts of different AV car-following and lane-changing parameter settings on the design of congestion management strategies from the perspective of responsible highway agencies, that is, how the travel time and throughput on a freeway corridor under different volumes and AV penetration rates can be improved with the optimal but dynamic behavioral mechanisms for AV flows. Furthermore, on freeway segments experiencing congestion, responsible highway agencies can convey such optimal time-varying behavioral mechanisms for AVs, and thus convert their potential negative impacts, if adopting improper behavioral settings, to a traffic state beneficial to both AV and non-AV flows.
This study attempts to address the following questions often raised by highway operating agencies:
- the impacts of various behavior mechanisms, governing AVs (car-following and lane-changing behavior), on a target highway segment under different penetration rates; and
- how to identify the set of behavioral mechanisms for AVs that can avoid causing undesirable negative impacts, and further best interact with non-AV flows to maximize the operational efficiency of a target highway segment.
Conceivably, precise answers to these two issues may vary among different highway corridors in different states due to the discrepancies in both the behaviors of driving populations and other environmental as well as geometric factors. Therefore, the primary objective of our study is to highlight the compatibility issue between the AV and human-driving flows (under a given level of traffic congestion), when the focus of the highway agency responsible for managing the traffic conditions is to maximize the efficiency (e.g., throughput) of the roadway system by smoothening the interactions between the AV and non-AV flows. Most importantly, our main objective for this study is not to propose a method to simulate AV flows, but to highlight the issue that AV flows, although governed mainly by drivers’ driving preferences, should coordinate with non-AV flows under the instructions of the responsible highway agency. The goal behind this interaction will be to maximize the efficiency of the shared highway system, because there will exist a set of optimal behavioral patterns for the AV flow to best interact with non-AV flows.
Hence, this study presents a simulation-based methodology to produce such operational guidelines and has used MD-100 (a multilane highway segment located in Maryland) as the case study to illustrate the step-by-step development procedures.
1.1. Flowchart for the guideline development
Figure 1 illustrates the key steps involved in the methodology development and their outputs. Additional description of primary activities to be done in each step is presented in the sequence below.

System framework and methodology flowchart. AV: autonomous vehicle: MOE: Measure of Effectiveness.
1.1.1. Step-1: develop a reliable traffic simulator for the target highway system
The first step is to develop a simulation platform for the target highway system that will enable the responsible highway agency to explore the impacts of the AV flow’s driving behaviors on the traffic conditions and formation of congestion under different AV market penetration rates. Similar to platforms used in traffic system control, such a simulation platform shall be microscopic in nature such that it can effectively reflect the key geometric features, environmental factors, and the behavior of the driving population on the recurring traffic conditions. This platform can be developed with most commercially available microsimulation software (such as VISSIM), as long as it can offer the following user-friendly functions: (a) providing a user-friendly interface mechanism that allows users to modify the behavior mechanisms, based on traffic flows observed from the field data; (b) allows users to modify the system’s operating characteristics at each simulated time-step; and (c) also executes two-way feedback operations between user-developed algorithms for all modules embedded in VISSIM models, using computer languages, such as C#, C++, MATLAB, and Visual Basic.
1.1.2. Step- 2: calibrate key parameters governing the driving population in simulation
To ensure the fidelity of the developed simulator, one of the most critical steps is to calibrate the behavioral-related parameters embedded in the simulator’s car-following and lane-changing models with field data. There are a variety of calibration methods, such as the genetic algorithm (GA), available in the literature.28,29 Only after the simulator-produced speed, flow rate, and occupancy on the target freeway system (including mainline, ramps, weaving segment) are statistically indifferent from those measured from field detectors, can one conclude that the behavior of the driving populations is consistent with those performing daily commutes, and the simulator is ready for control and strategy development.
1.1.3. Step-3: modeling the observable behavioral patterns of AV flows
Conceivably, AV flows on a highway segment (irrespective of their embedded complex interactions between data acquisition, learning, and decision mechanisms) will be seen as a stream of vehicles with relatively sensitive car-following and lane-changing behaviors if perceived from the macroscopic view and from the perspective of the responsible highway agencies. Hence, the focus of this step is mainly to model the behavioral patterns manifested by AV flows in the traffic stream (rather than their actual control algorithm), and to simulate their interactions with non-AV flows under varying traffic scenarios.
Note that the control algorithms to govern the behaviors of AV flows have not been standardized yet by the AV industry. Most companies currently working in this sector (e.g., Google and Uber) have focused on their internal technological developments, and have not yet produced a standardized and sufficiently reliable control algorithm for testing on freeways. At a federal level, the National Highway Traffic Safety Administration has not yet set any rulemaking on the AV control algorithm and specifications for its interactions with non-AV flows. As such, the development of optimal control algorithms for best governing the AV with respect to both safety and efficiency from both individual users’ and traffic agencies’ perspectives remains an ongoing issue for both researchers and their industrial counterparts.
Recognizing the fact that there are no universally accepted AV behavioral algorithms, it is nevertheless unquestionable that any AV from the perspective of highway traffic monitoring remains a particle, similar (except with a more sensitive and better reaction rate) to human-driving vehicles via executing lane-changing and car-following exercises to progress in the traffic stream. Hence, we have utilized VISSIM (a well-established software for simulating conventional vehicle flows) as the tool to modify and simulate the mixed traffic flows of AVs and non-AVs. Wiedemann-99 is the car-following model adopted by VISSIM and has been utilized in this paper. We fully recognize that the typical parameter set for VISSIM’s car-following mechanism (i.e., Wiedemann-99 model) is not sufficient to reflect the AV’s wide range of operability and flexibility. However, in view of the facts that no well-established simulation logic for AV flows exist in the traffic community and that our primary objective is to reflect the manifested driving patterns rather than the embedded control algorithm, we adopt the VISSIM core car-following model supplemented with five additional key control parameters to reflect the wide range of AV patterns observable in the typical traffic stream.
Note that AVs are expected to be able to maintain a range of time-gaps. This is observed in ACC equipped vehicles being sold in the market today, where the driver can change the time-gap settings to reflect their preferences. Invariably, the change in the time-gap settings is accommodated through pre-defined levels set by the vehicle manufacturer. This is reflected by a range of time-gaps that drivers select while driving ACC and CACC equipped vehicles. Results from field tests 30 show that the mean time-gap setting for the ACC system is 1.54 (±0.41) seconds and for CACC equipped vehicles is 0.71 (±0.41) seconds. As this is an evolving technology, similar standards and range can also be expected for the lane-changing parameters of AVs.
To simulate AV flows’ flexible and sensitive functions and the discrepancy in exercising such functions by AV owners, we modify the parameters that define the car-following and lane-changing parameters of AVs (shown in Figure 2) to reflect the aggressive, calibrated (same as the human-driven vehicles on the target freeway), and moderate AV operation settings.
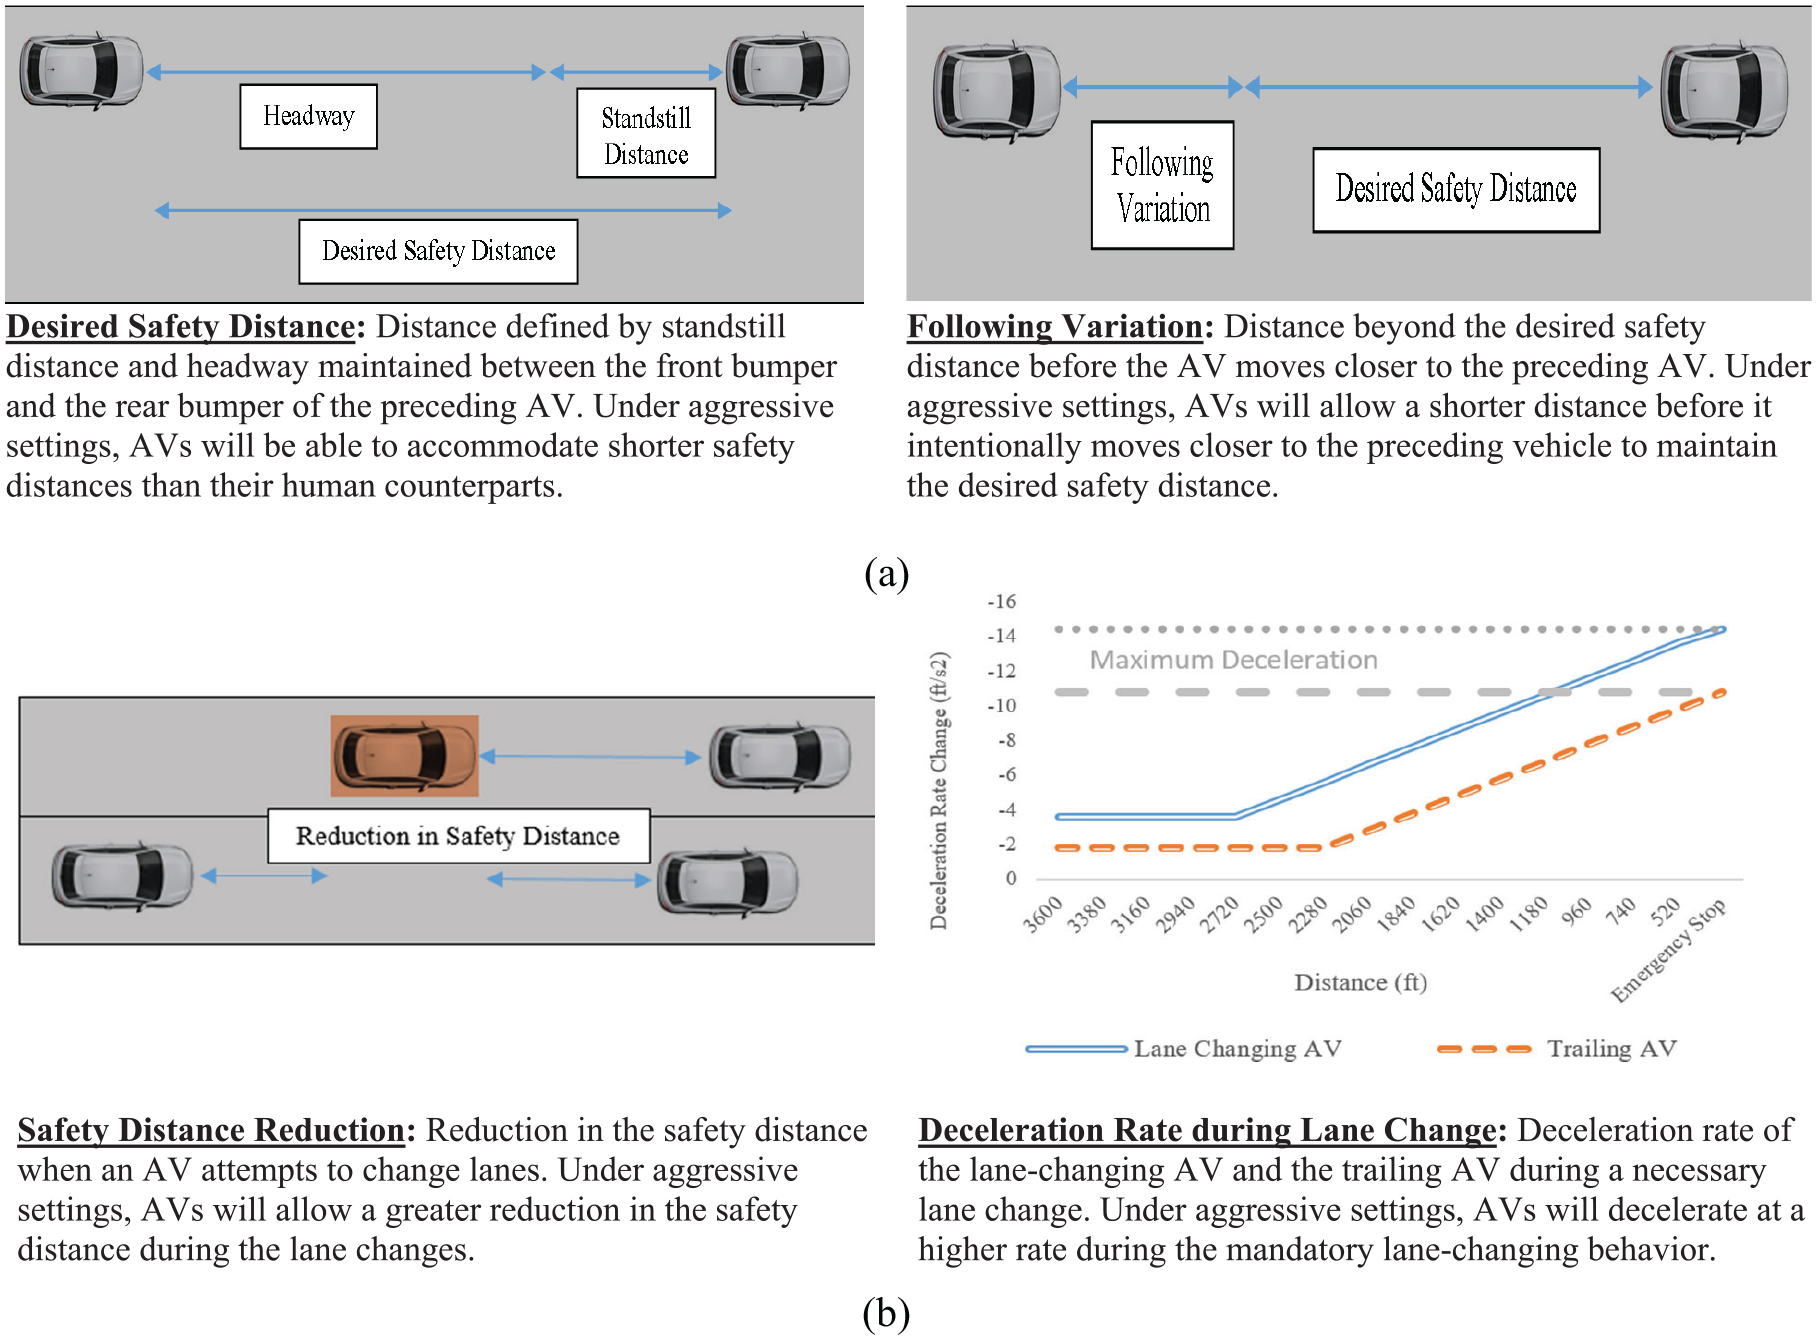
Autonomous vehicle (AV)-specific car-following and lane-changing parameters: (a) AV car-following parameters; (b) AV lane-changing parameters.
Within the simulation platform, the following tasks need to be carried out.
- Create a new driving behavior set in the simulation platform that reflects the possible behavioral variation of AVs (Note: the base vehicle car-following and lane-changing settings should be set equal to the values determined for the non-AV flows during the calibration process.) These parameters are later modified, independently from the parameters in the non-AV driving behavior set, to reflect different AV driving settings.
- Create a new vehicle class to represent AVs and connect them to the AV driving behavior set with the user-developed interface program.
- Identify the range of values for the parameters described in Figure 2, and accordingly define upper bound and lower bound limits while maintaining the calibrated parameter value as the reference point (i.e., if the calibrated headway is 2 seconds, then the upper and lower bounds could be defined by a 50% increase or decrease).
- Specify different levels of AV-specific driving parameters (i.e., aggressive, calibrated, and moderate) by their upper and lower bound limits.
With the above modeling work, the simulator can reflect the different possible behaviors of the AV flows defined through the AV occupant’s selection of the AV’s embedded car-following and lane-changing mechanisms.
1.1.4. Step 4: design of simulation experiments to cover extensive traffic scenarios on the target highway segment
The purpose of this step is to simulate those traffic scenarios most likely to be seen on the target freeway segment in the presence of AV flows under different AV penetration rates. The simulation experiment will involve the following process:
- divide both the car-following and lane-changing parameters of the AV flows into multiple levels (i.e., Aggressive-2, Aggressive-1, Calibrated, Moderate-1, and Moderate-2), where the parameters for calibrated AV flows are the same as those for non-AVs (i.e., calibrated settings);
- maintain the car-following and lane-changing parameter values of the human-driven vehicles constant at the calibrated values;
- distribute the volume between AVs and non-AVs for AV penetration rates ranging from 0% to 100% at 10% increments;
- simulate the sets of car-following and lane-changing behaviors of AVs, based on the number of levels defined for each parameter;
- replicate five times for each set of driving behaviors of AVs with different random seeds to account for randomness.
1.1.5. Step-5: output analysis for developing the operational guidelines
The experimental analysis of all simulated scenarios will focus on the following issues:
- the performance discrepancy between AV and non-AV flows with respect to travel time on different highway segments;
- Measures of Effectiveness (MOEs) resulting from different AV driving settings at various AV market penetration rates and on different highway segments (i.e., weaving and non-weaving segments);
- the set of car-following and lane-changing parameters that can yield the best performance with respect to each of the selected MOEs in each experimental traffic scenario.
Note that the MOEs for the above issues include travel time, throughput, and queue lengths, where travel time and throughput are computed separately for AV and non-AV flows. Also, the MOEs are determined by location (i.e., ramps, mainline segment, bottleneck area). With the above output, the traffic operators will have sufficient information to make decisions regarding the proper AV control mechanism and relay the recommended settings to the vehicles during the congested period. Similarly, when the detectors in the field indicate the occurrence of an incident, the responsible agencies can summon the AVs upstream from the incident to re-program and operate using the prescribed driving settings.
2. A case study with MD-100 for illustrating the application process
This case study aims to serve as an example for illustrating the potential applications with the aforementioned methodology.
2.1. The freeway selected for illustration and case study
MD-100 West is a two-lane highway in each direction with a speed limit of 55 mph, connecting Anne Arundel County in the East and Howard County to the West. Figure 3(a) describes the westbound segment of MD-100 between MD-170 and US-1 used in this study.
The segment between MD-713 and US-1 experiences recurrent congestion between 3 pm and 5 pm, and its average flow speed decreases from 60 to 20 mph within 3 miles. As shown in Figure 3(b), recurrent congestion at the on-ramp for Coca-Cola Dr. usually extends over 1.75 miles to the MD-713 on-ramp, and even longer during inclement weather conditions.
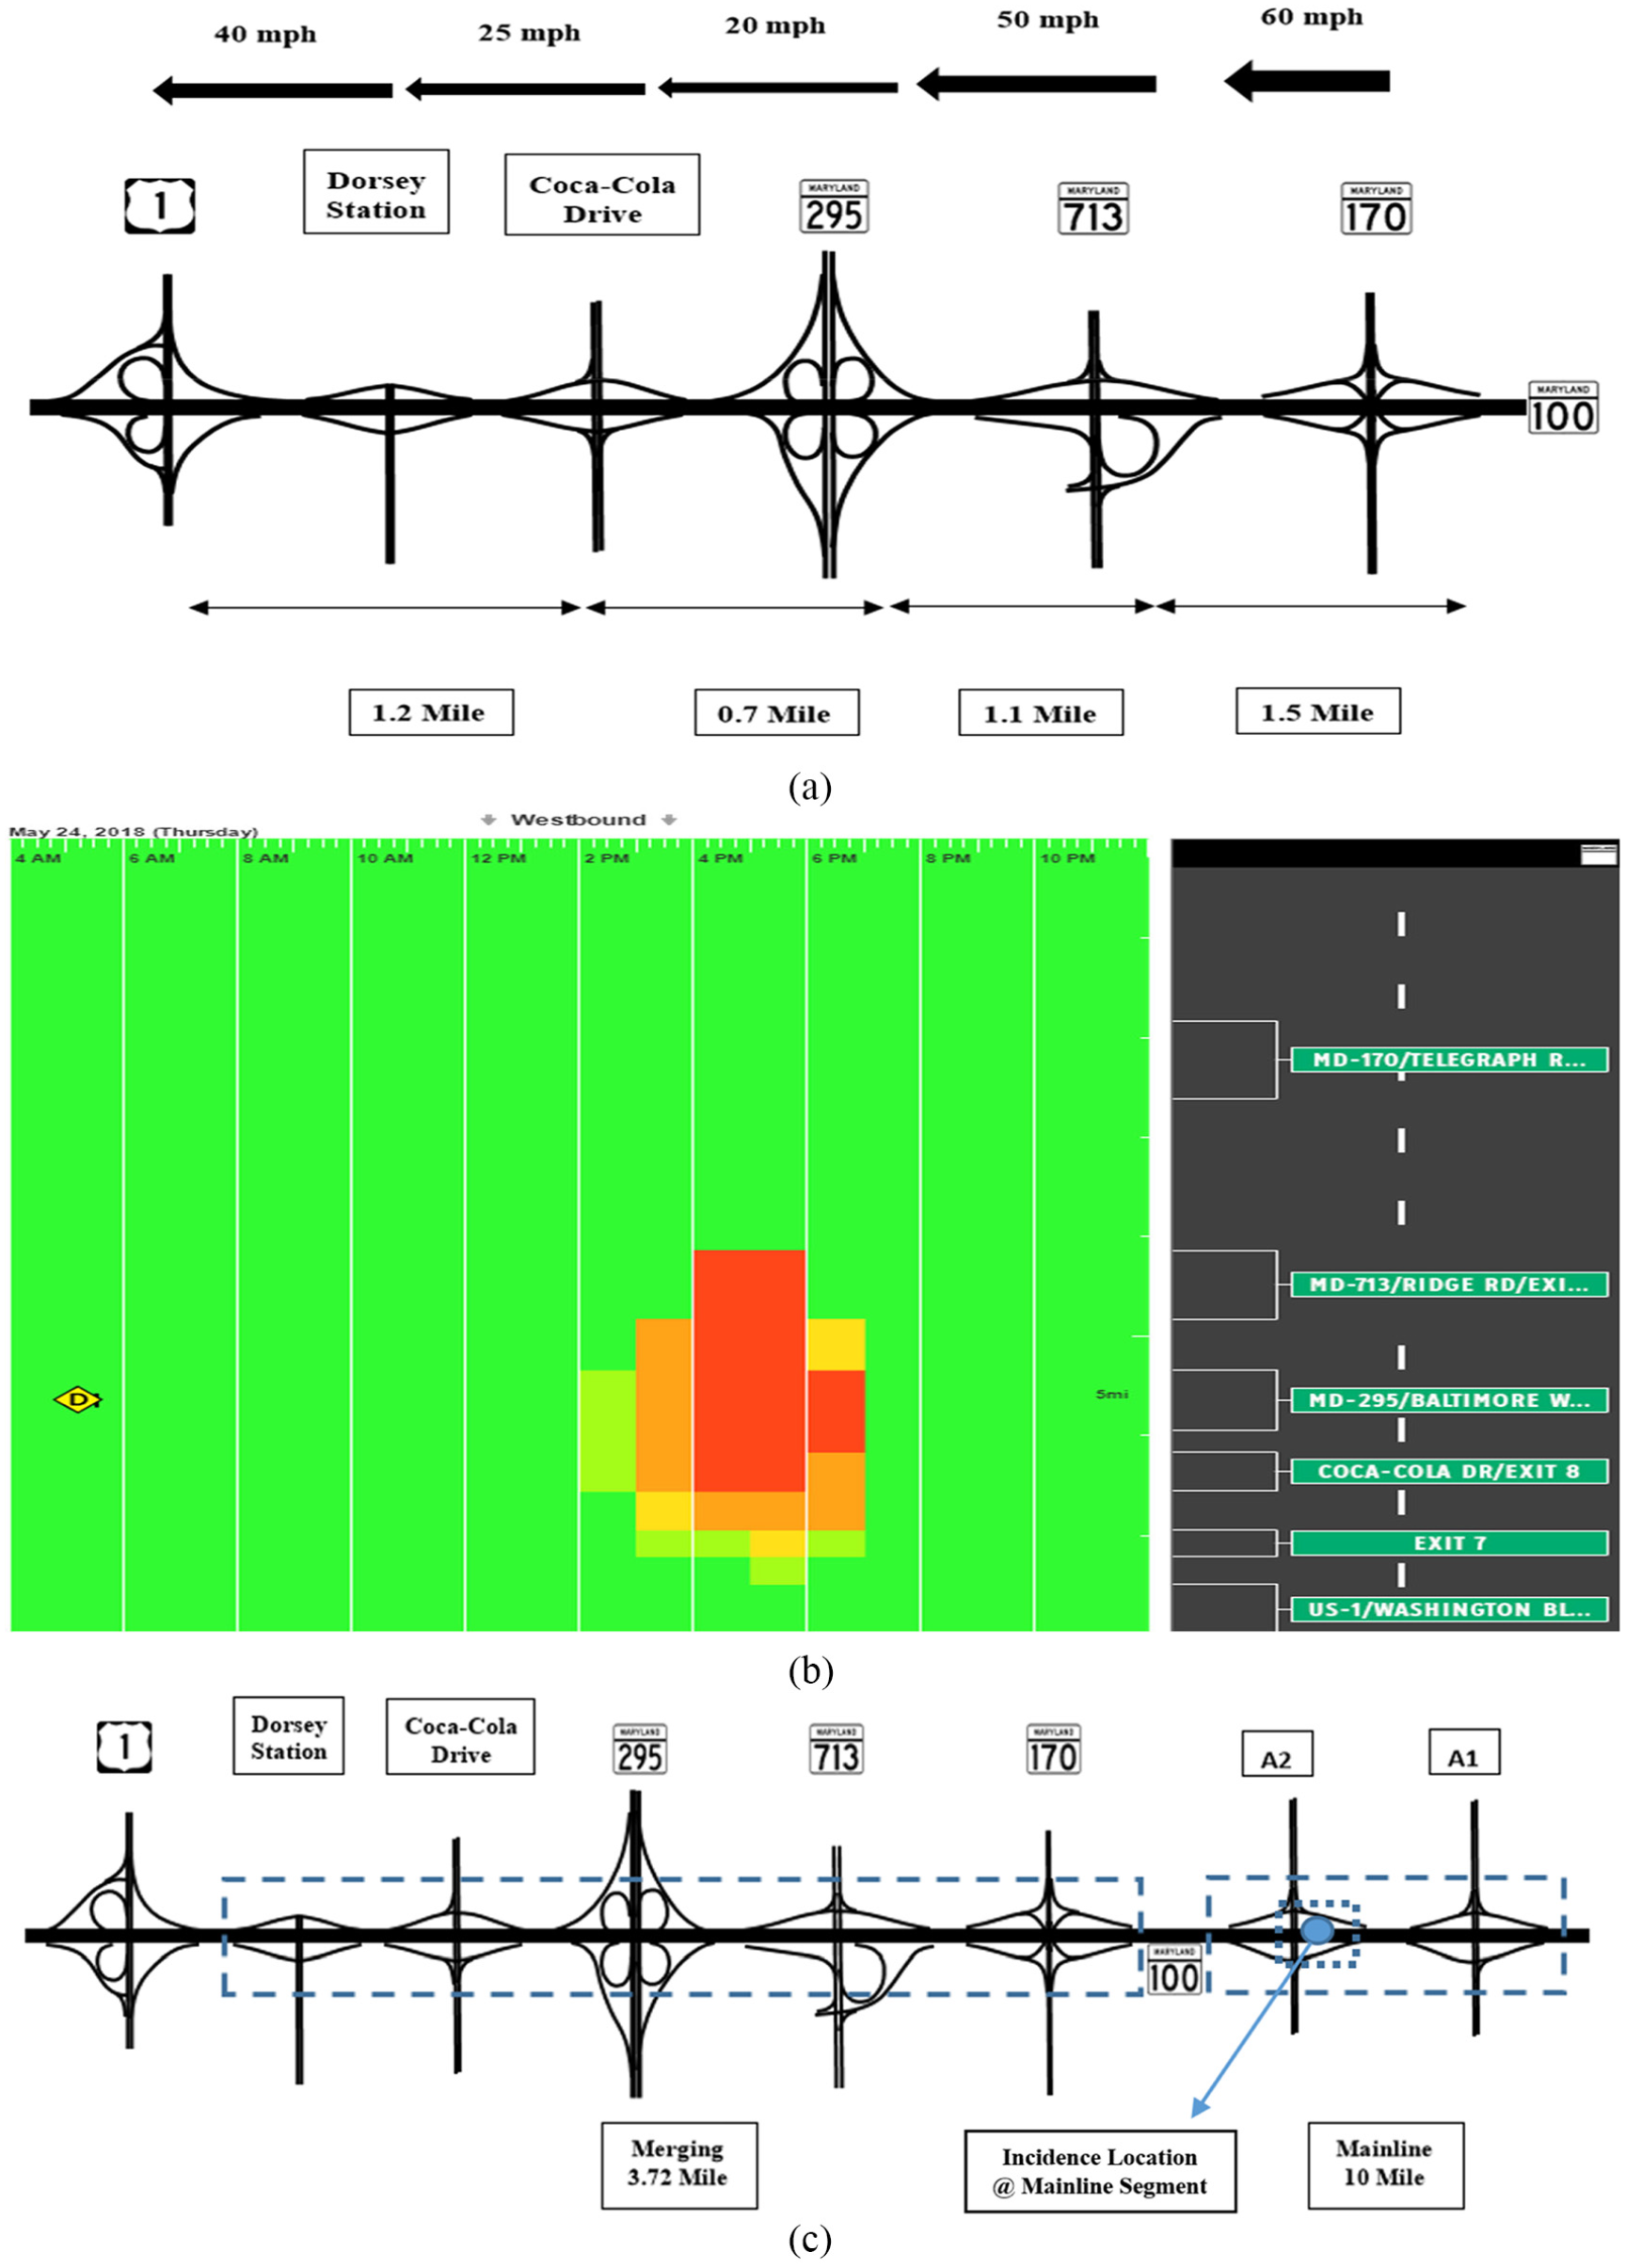
Geometric features and spatial distribution of speeds on MD-100 westbound: (a) spatial distribution of traffic flow speeds; (b) congestion pattern on a typical weekday; (c) freeway network segmentation.
2.2. Simulation software
VISSIM 5.40, a microscopic traffic simulator, was used in this study as there still does not exist a commonly available AV traffic flow simulator. The parameter calibration was carried out using a total of 4 hours of data, including volume and speed data collected during a previous field demonstration. 31 To accurately replicate the observed traffic conditions, the human-driving car-following and lane-changing parameters are calibrated from field data using the GA. The calibrated car-following and lane-changing parameters in VISSIM are shown in Table 1(a). The calibrated values obtained from the target freeway with 100% human-driven vehicles are used as the baseline driving settings for both AVs and human-driven vehicles.
Car-following and lane-changing parameter values.
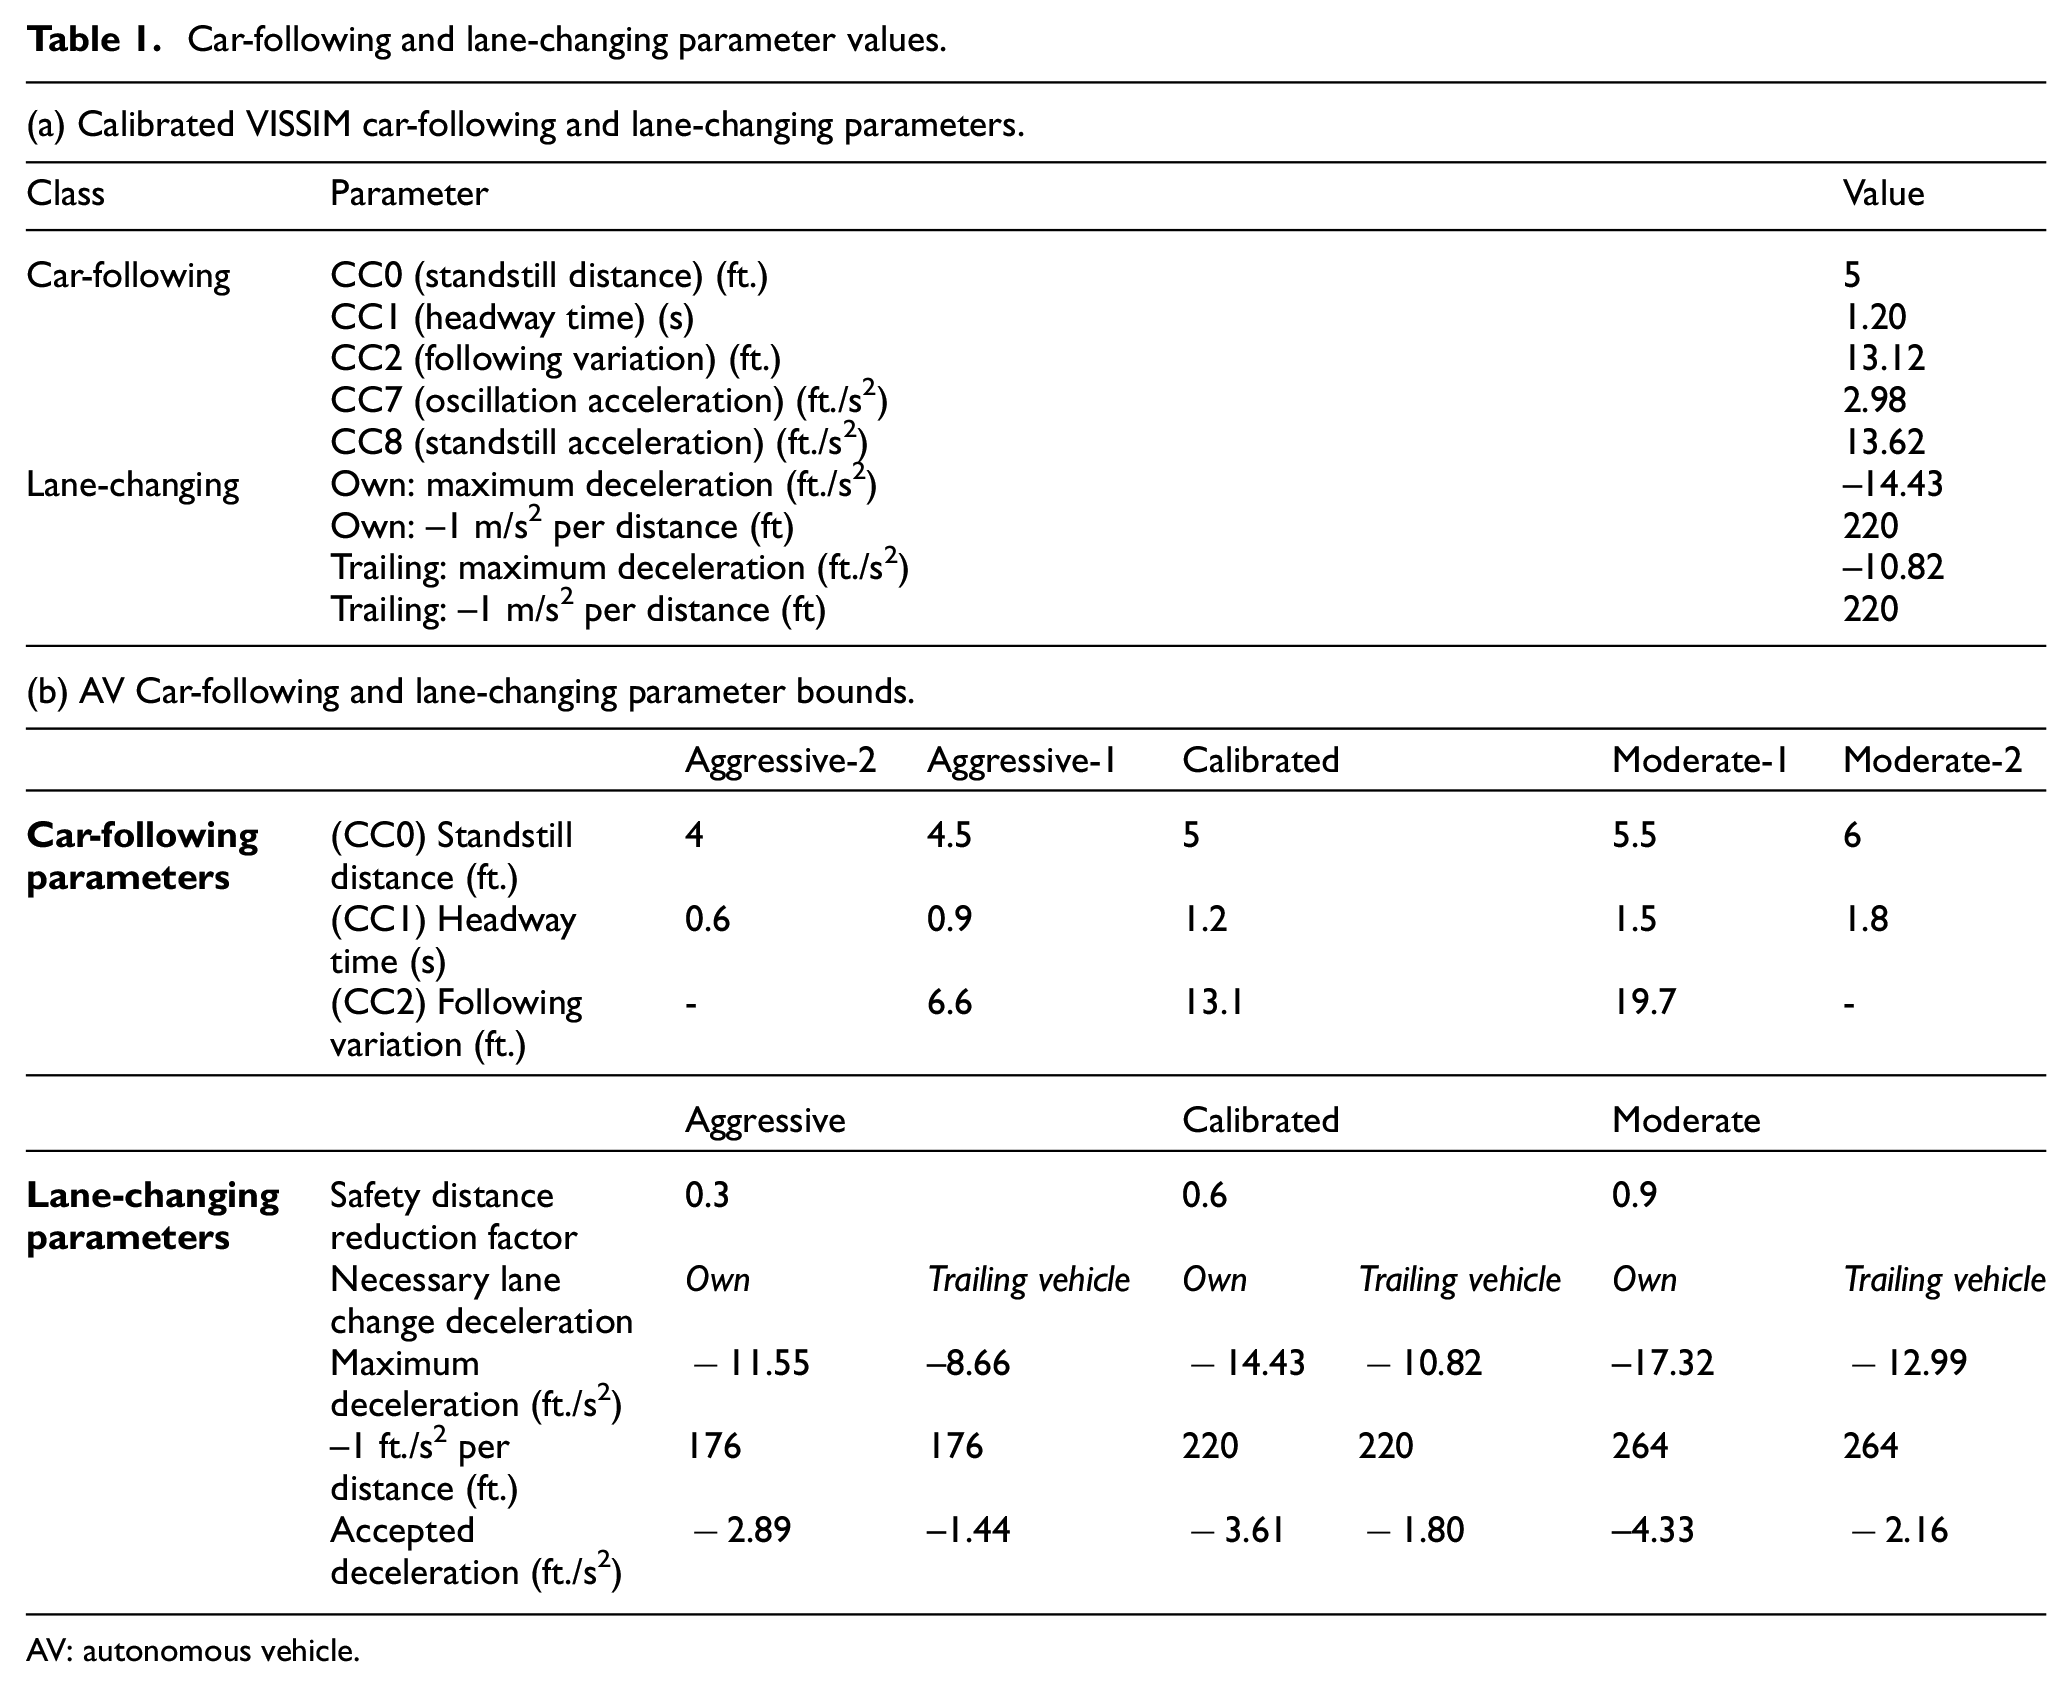
AV: autonomous vehicle.
The AV flow car-following parameters and their sensitivity thresholds are defined using three Wiedemann 99 car-following calibration parameters, 32 that is, CC0 (standstill distance), CC1 (headway time), and CC2 (car-following variation). CC0 and CC1 together describe the specified safety distance maintained between two AVs, while CC2 defines the car-following variation distance. Two VISSIM lane-changing parameters, the safety distance reduction factor and the deceleration rate during a lane change, are selected to describe both mandatory and non-mandatory lane changes undertaken by AVs.
To ensure that the laboratory experiments have sufficient samples to cover all possible traffic scenarios of different manifested AV patterns and penetration rates, one shall first conduct a sensitivity analysis of all key variables (listed in Table 1(a)) to be changed incrementally in generating simulated scenarios with respect to the selected MOEs.
The results of the sensitivity analysis show that both the throughput and travel times on the target highway under the given demand will vary significantly from the field-observed traffic MOEs if CC0 and CC1 are set to change by +/–25% and 50%, respectively. Significant impacts of the MOEs have also been observed if CC2 is specified to vary between +/–50% from the calibrated value. As for the impact of lane-changing variables, it was found that the target freeway system’s overall MOEs will change significantly provided that one chooses to alter the safety distance reduction parameter in the range of +/–50% from the calibrated value, or the necessary lane-changing deceleration rate of +/–20% deviated from the calibrated value.
As mentioned earlier, occupants of AVs (as in the current ACC equipped vehicles) are expected to be able to modify the car-following and lane-changing parameters through pre-defined levels set by the vehicle manufacturers. In order to reflect such behavioral preferences in a simulation setting, we allow the AV driving setting to be set to different aggression levels. Table 1(b) provides the range of aggressive and moderate car-following and lane-changing parameters for AV flows used in this study. The aggressive and moderate behaviors of AVs have been referenced to the parameters calibrated using field and detector data. During the simulation process, CC0 and CC1 are combined to reflect the safety distance to the preceding vehicle. Given the possible range of variation, CC0 and CC1 are divided into five different levels (i.e., Aggressive-2, Aggressive-1, Calibrated, Moderate-1, Moderate-2), while the remaining parameters are analyzed at three levels (i.e., Aggressive, Calibrated, and Moderate). Therefore, at each penetration level, there are 135 different driving settings for AV operations.
To replicate the autonomous behavior with VISSIM, a new vehicle class is created and is connected to the AV driver behavior set, that is, car-following and lane-changing parameters. To evaluate the 135 possible driving settings, the VISSIM COM application programming interface (API) is employed. A MATLAB application program is also developed to load the network and to start the simulation through the VISSIM API.
2.3. Design of simulation experiments
The freeway segment is modified and extended upstream of MD-170 to include a 10-mile segment to capture the traffic evolution from moderate to congested conditions. With this addition, the simulated MD-100 network is separated into a 10-mile mainline segment and a 3.72-mile merging segment, as shown in Figure 3(c).
The simulation analysis is carried out at different penetration levels of AVs, ranging from 0% to 100% at increments of 10%. The simulation process at each penetration follows the following steps.
- Distribute the 2015 evening peak-hour volume between autonomous and human-driven vehicles, based on the specified AV penetration rate.
- Simulate the 135 sets of car-following and lane-changing behaviors for the AVs with a 30-minute warm-up, followed by 1 hour of traffic input based on 2015 volume data. The car-following and lane-changing parameters of the human-driven vehicles are held constant at the calibrated values.
- Replicate each AV car-following and lane-changing combination five times with different random seed values to account for randomness.
- Analyze the resulting impacts with different MOEs, including travel time, throughput, and ramp and freeway queue lengths.
In addition, as shown in Figure 3(c), this study has also modeled an incident in the mainline segment between the A2 on- and off-ramps. This incident involves a single lane closure for 30 minutes. The lane drop scenario involves the same simulation process as the non-lane drop scenario.
2.4. Analysis of simulation output
The outputs of the extensive experiments are used to analyze the following three issues. (a) Whether the prevalence of AV flow has a negative impact on the performance of non-AVs or on the freeway at the system level. (b) What are the impacts of AV flows on the traffic conditions under different car-following and lane-changing behavior parameters? (c) What set of behavioral parameters for the AV flows can best benefit the traffic conditions of the entire freeway segment?
2.5. AV versus non-AV performance
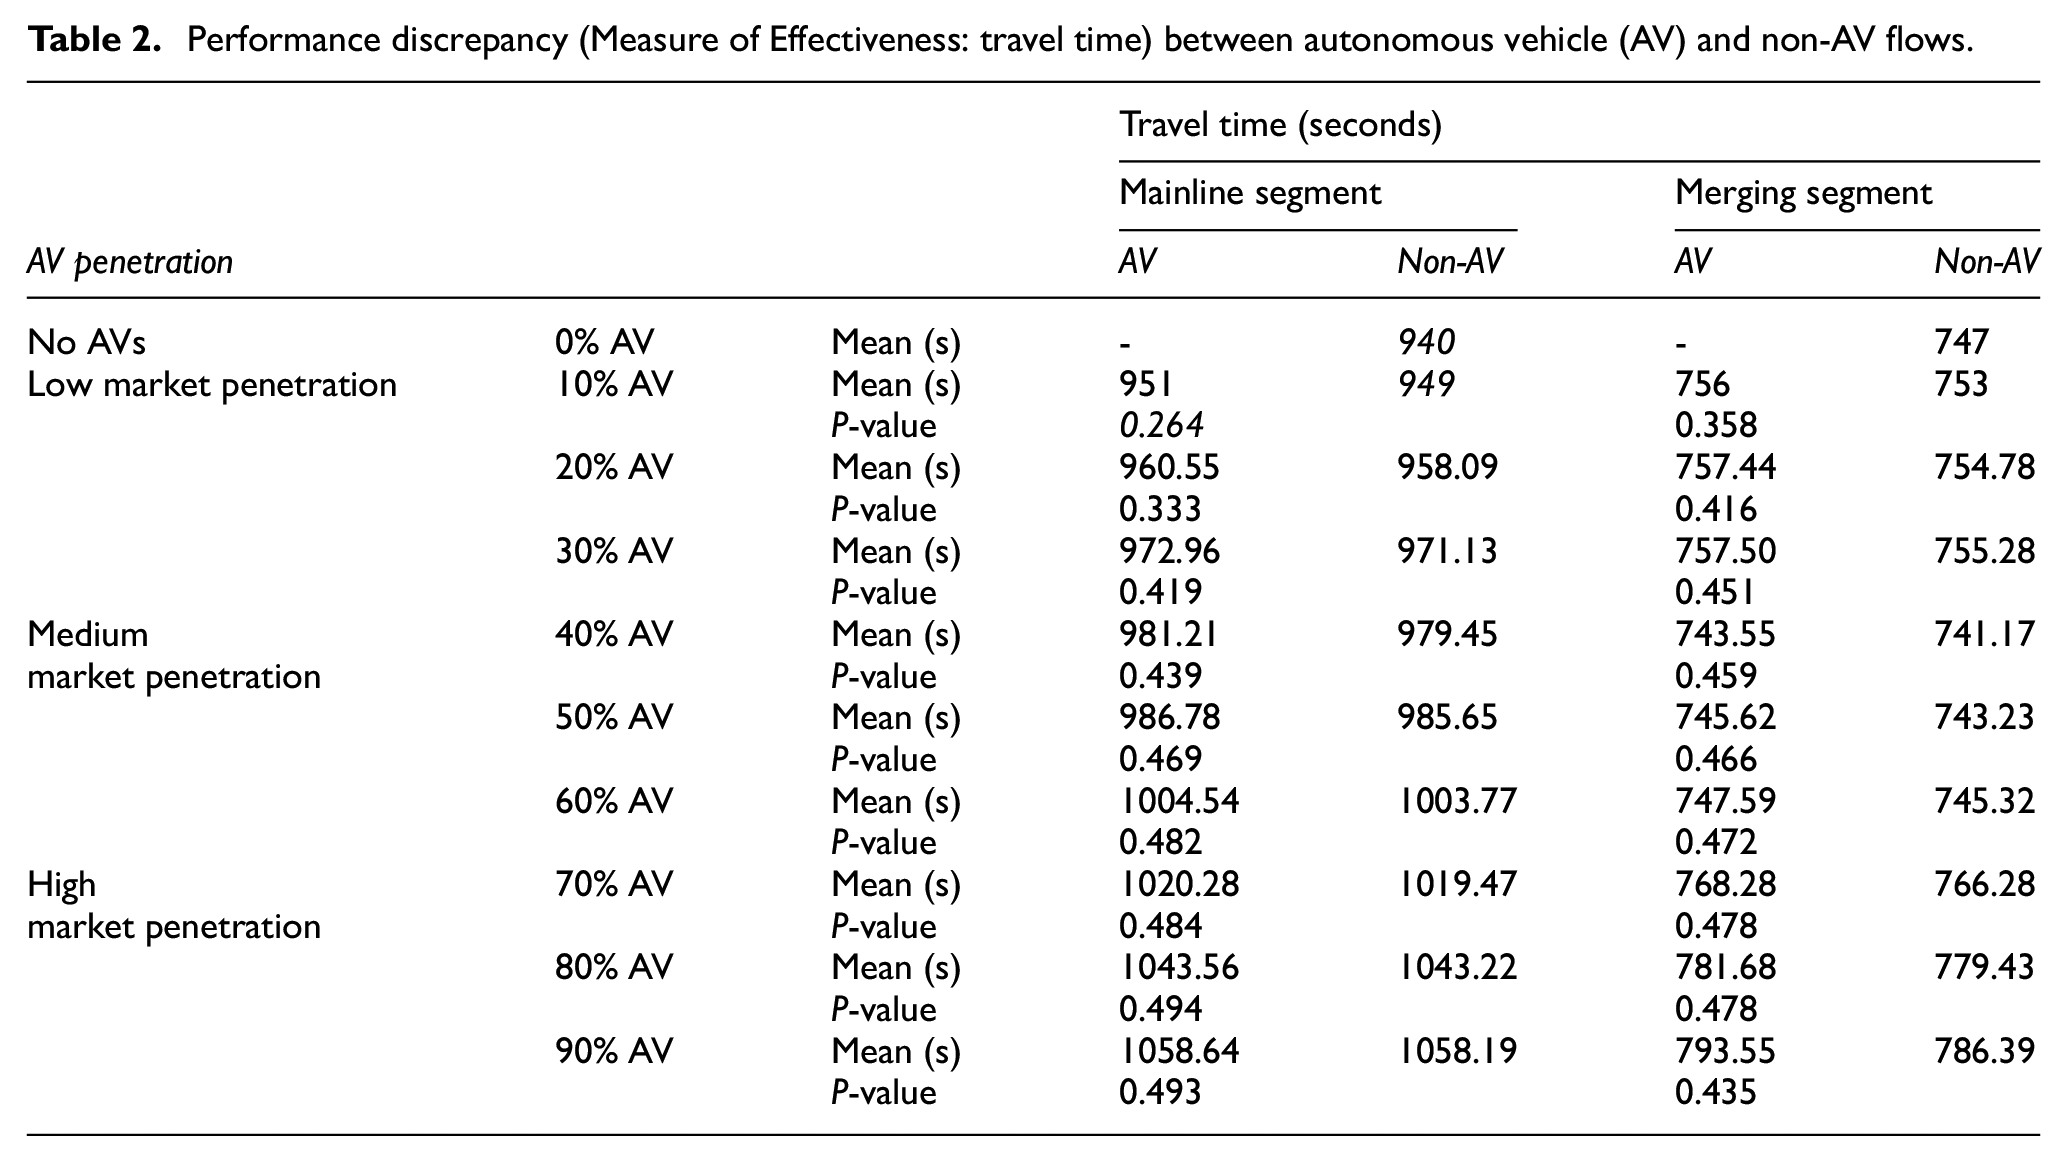
Table 2 summarizes the performance, in terms of the time taken to travel across the mainline and the merging segment, for both AV and non-AV flows. Comparisons are made at low (10–30%), medium (40–60%), and high (70–90%) AV flow rates by comparing the average travel times obtained by simulating the 135 sets of car-following and lane-changing behaviors for the AVs. The t-test results indicate that no significant differences exist between average travel times for AV and non-AV flows under different penetration rates on both mainline and merging segments. This reflects that the change in AV driving settings does not have a disproportionately negative or positive influence on the traffic performance of the non-AV flows. Therefore, it can be concluded that both AV and non-AV flows are equally influenced by the introduction of AVs to the network, and no performance discrepancy exists. Hence, AV operational guidelines can be developed by focusing on the collective performance, in lieu of analyzing the output by vehicle type.
Performance discrepancy (Measure of Effectiveness: travel time) between autonomous vehicle (AV) and non-AV flows.
2.5.1. MOE performance
2.5.1.1. Travel time and throughput
Figures 4(a) and (b) shows the travel time and throughput as a function of the AV penetration rate, at both the merging and the mainline segments. Each box plot describes the distribution of the 135 different AV driving settings at each penetration level.
When AVs are programmed to reflect the baseline settings (i.e., all parameters are set to the calibrated values), the average time for both AV and non-AV flows to travel across the merging segment and mainline segment is 747 and 940 seconds, respectively. The segment’s average throughputs are 3520 and 3242 vehicles/hour, respectively, for merging and mainline segments. The impacts of different AV driving settings on throughput and travel time are observed even at a 10% AV market penetration rate. Depending on the selected AV driving setting, the travel time on the merging segment can either increase to 879 seconds or reduce to 619 seconds. Similarly, the throughput can either increase to 3690 vehicles/hour or drop to 3392 vehicles/hour.
Note that the impacts of different driving settings are significant both within a specific AV penetration level (e.g., at 10% penetration level) and between different AV penetration levels (e.g., between 10% and 100% market penetration levels). This can be viewed by comparing the travel time and throughput results between 10% and 50% AV penetration rates in the merging segment. With appropriate AV driving settings, the lowest travel time on the merging segment decreases from 619 to 338 seconds, and the throughput increases from 3690 to 4127 vehicles/hour. In contrast, if appropriate AV settings are not assigned, then the system performance can deteriorate significantly. For instance, at 50% AV flow rates, the travel time increases to 1217 seconds while the throughput drops to 3101 vehicles/hour, compared with 747 seconds and 3520 vehicles/hour in the base case scenario.
At the current demand levels, as vehicles move from the mainline segment to the merging segment, the traffic flow moves from a region of moderate to one of congested conditions. As the mainline segment is uncongested, significant improvements in travel time and throughput are not observed beyond 10% AV flow rates. However, the performance of traffic flow is impeded significantly when AVs are prescribed incorrect driving settings. The travel time and throughput in the mainline segment, as shown in Figures 4(a) and (b), highlight the negative impact of incorrect AV driving settings as AVs gain 100% market share, resulting in increasing the travel time to 1584 seconds and decreasing the throughput to 1783 vehicles/hour.
Table 3 shows the resulting change, in comparison with the average travel time, for the longest and the shortest travel times taken to cover the MD-100 segments and the adopted AV behavior mechanisms (note: these are not the recommended settings) at low (10%), medium (40%), and high penetration rates (70%). As highlighted in Table 3, at the medium level of AV penetration (i.e., 40%), depending on the AV driving settings, the travel time either increases by 47% or decreases by 52%. Such results not only demonstrate the potential negative and positive impacts of AV flows on the overall traffic conditions, but also justify the need to guide AV flows to adopt the proper behavior mechanisms so as to benefit both AV and non-AV flows in the entire system.
Positive and negative impact on travel time due to autonomous vehicle (AV) behavioral mechanisms.
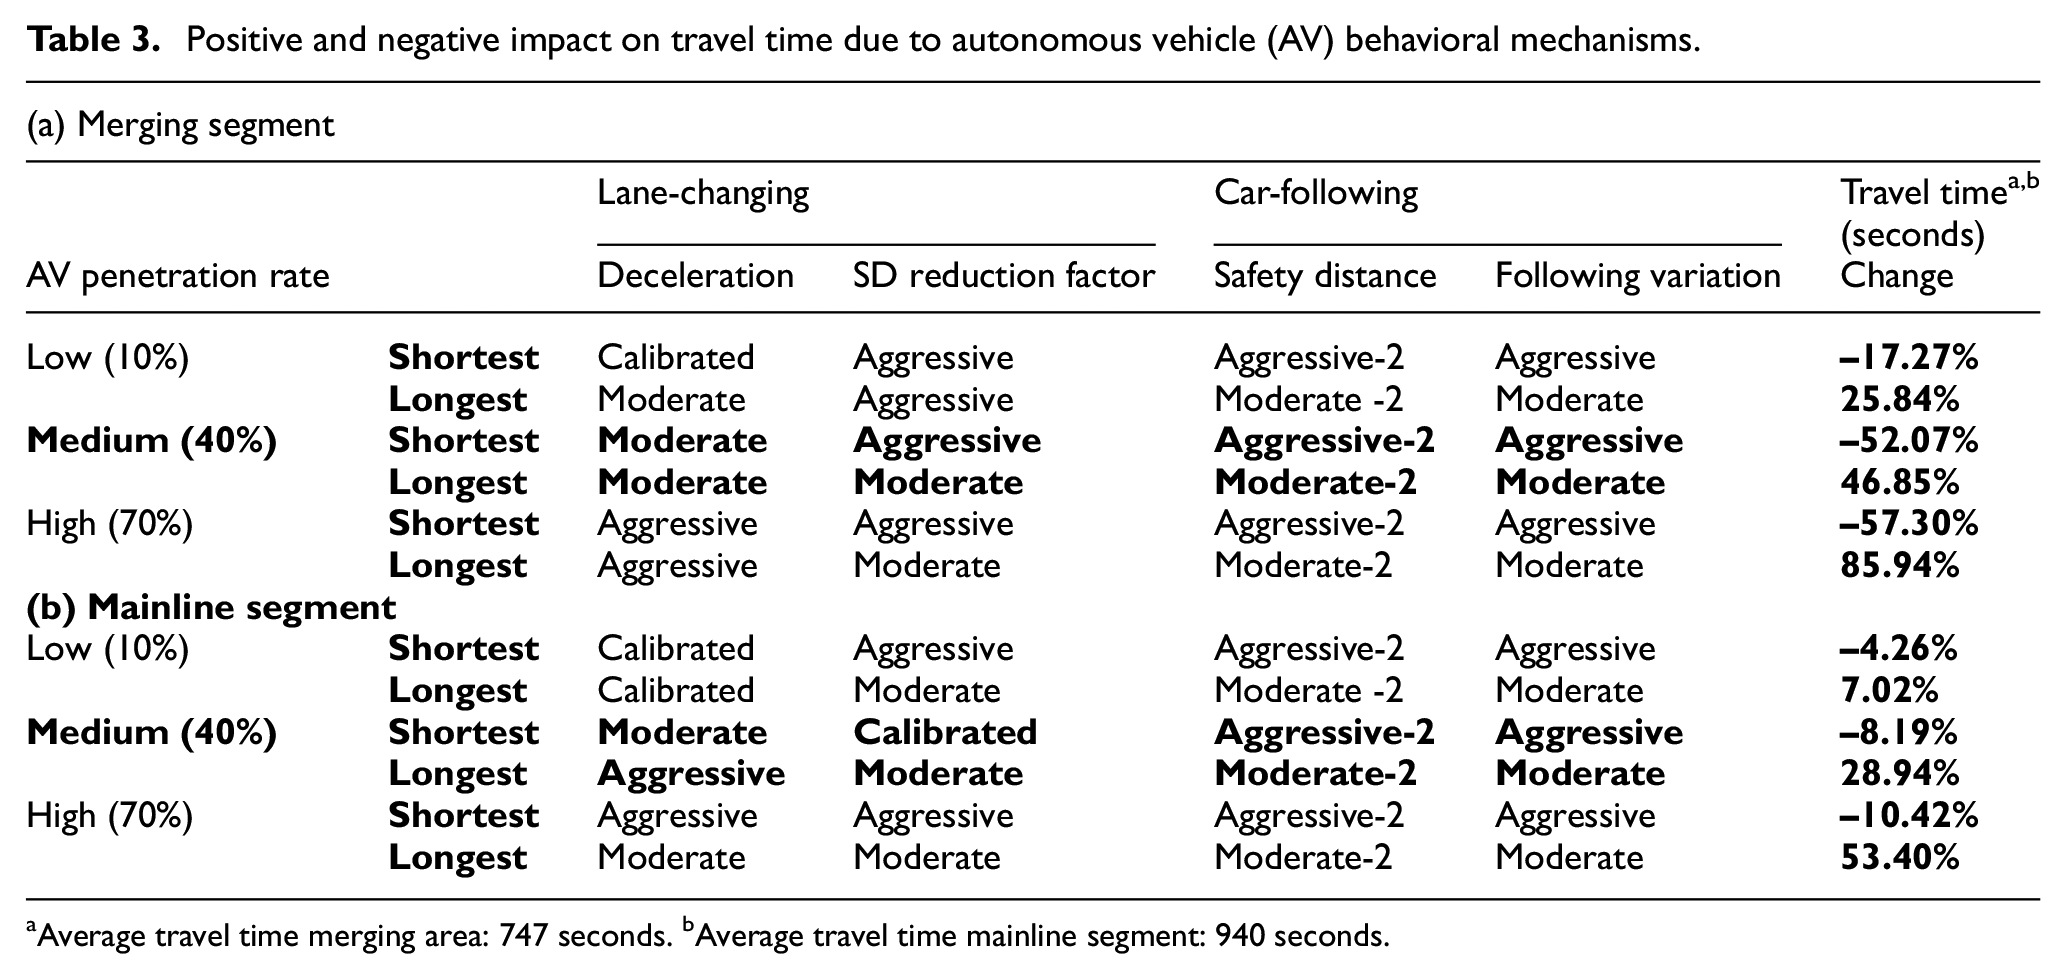
Average travel time merging area: 747 seconds.
Average travel time mainline segment: 940 seconds.
2.5.1.2. Queue length
At the baseline settings, queue lengths do not propagate on the mainline segment or its on-/off-ramps. However, queue lengths in the range of 4500 feet are observed in the bottleneck area between Coca-Cola Drive’s on-ramp and Dorsey Drive’s off-ramp and extend to the upstream segment. Also, the changes in vehicle speed and merging behavior due to high on-and-off-ramp volumes cause significant queues in the vicinity of the I-295 off-ramp. Figure 4(c) shows how the queue length evolves with the change in the AV driving settings. The figure shows that at 50% penetration rate, the queue length at both locations reduces significantly, concurrently reaching below 50 feet in comparison to 4606 feet at the Coca-Cola Drive/Dorsey Drive merging area and 2967 feet before the I-295 off-ramp had the vehicles had been programmed to operate at calibrated settings.
Note that the three MOEs shown in Figure 4 clearly indicate that incorrectly programmed AVs could result in a situation where traffic breakdowns become more prevalent and severe. Therefore, proper control with adequate knowledge of the resulting impact of a particular driving setting is essential for the operational agency to effectively manage traffic conditions.
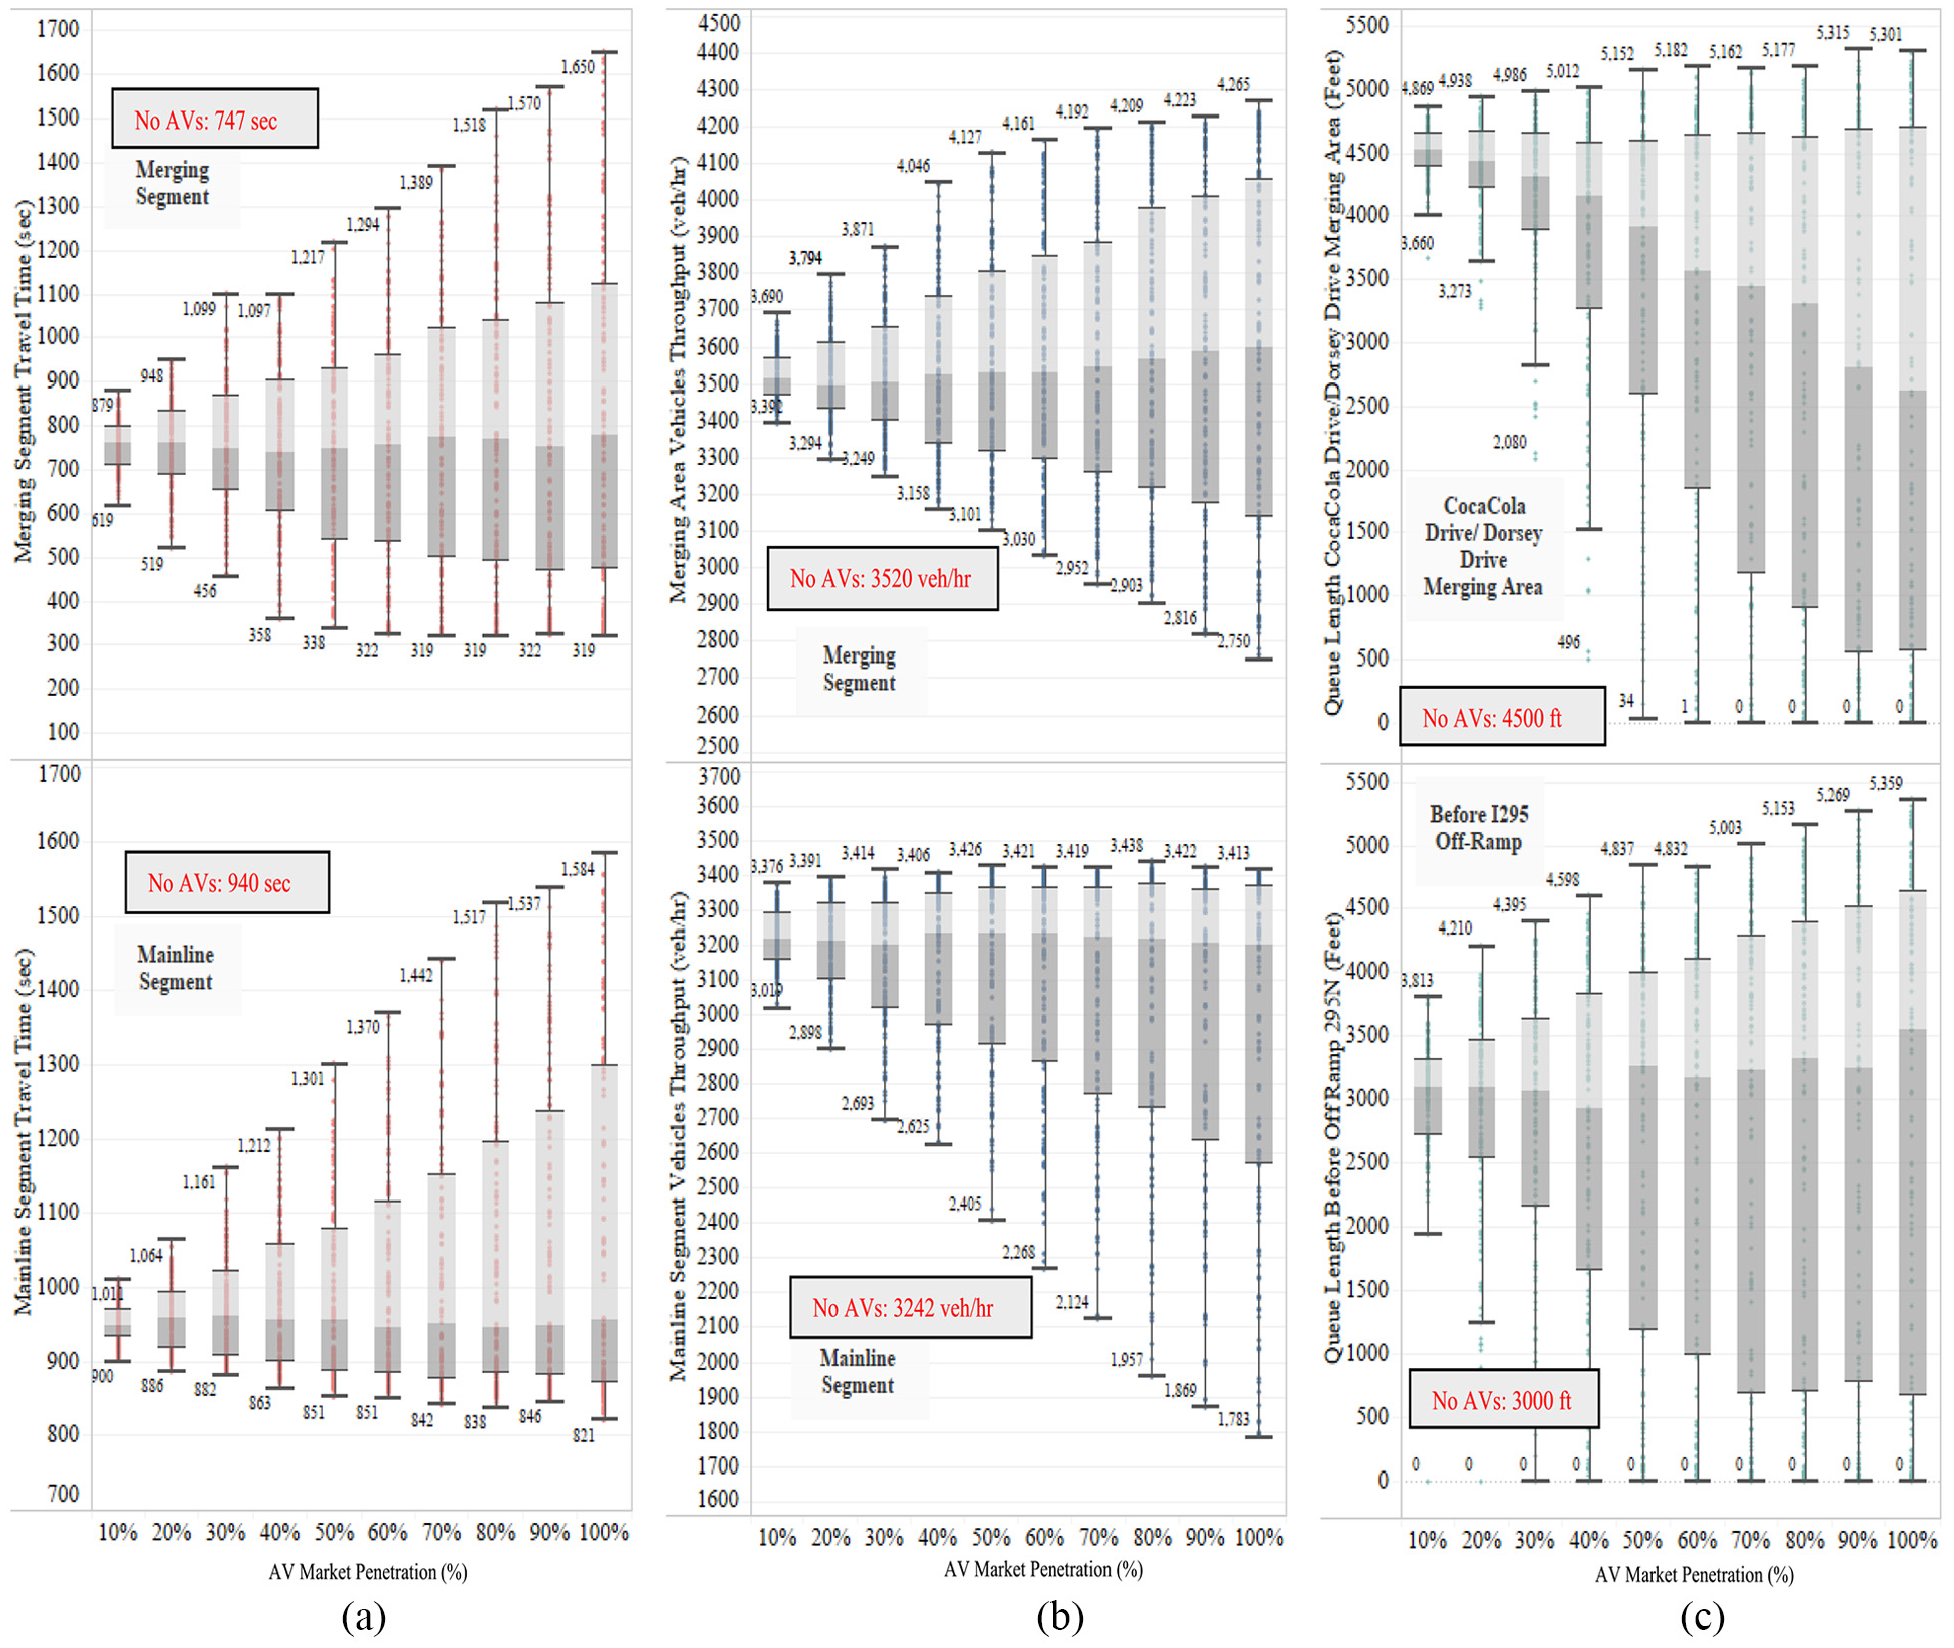
The upper and lower bounds of travel time, throughput, and queue lengths under different autonomous vehicle (AV) driving settings and penetration rates: (a) travel time at merging and mainline segments under the 135 different AV driving settings; (b) throughput at merging and mainline segments under the 135 different AV driving settings; (c) queue length variation in the merging segment under the 135 different AV driving settings.
2.6. Optimal AV driving settings
Table 4 shows the most appropriate AV driving settings for the merging and mainline segments (with/without lane drop) with respect to the improvement in travel time, throughput, and queue length as a result of administering the suggested driving settings. The choice set was filtered down by using the k-means clustering method while considering all three MOEs.
Autonomous vehicle (AV) parameter settings and resulting improvements (with reference to the baseline settings, i.e., MD-100 calibrated settings) at each penetration level.
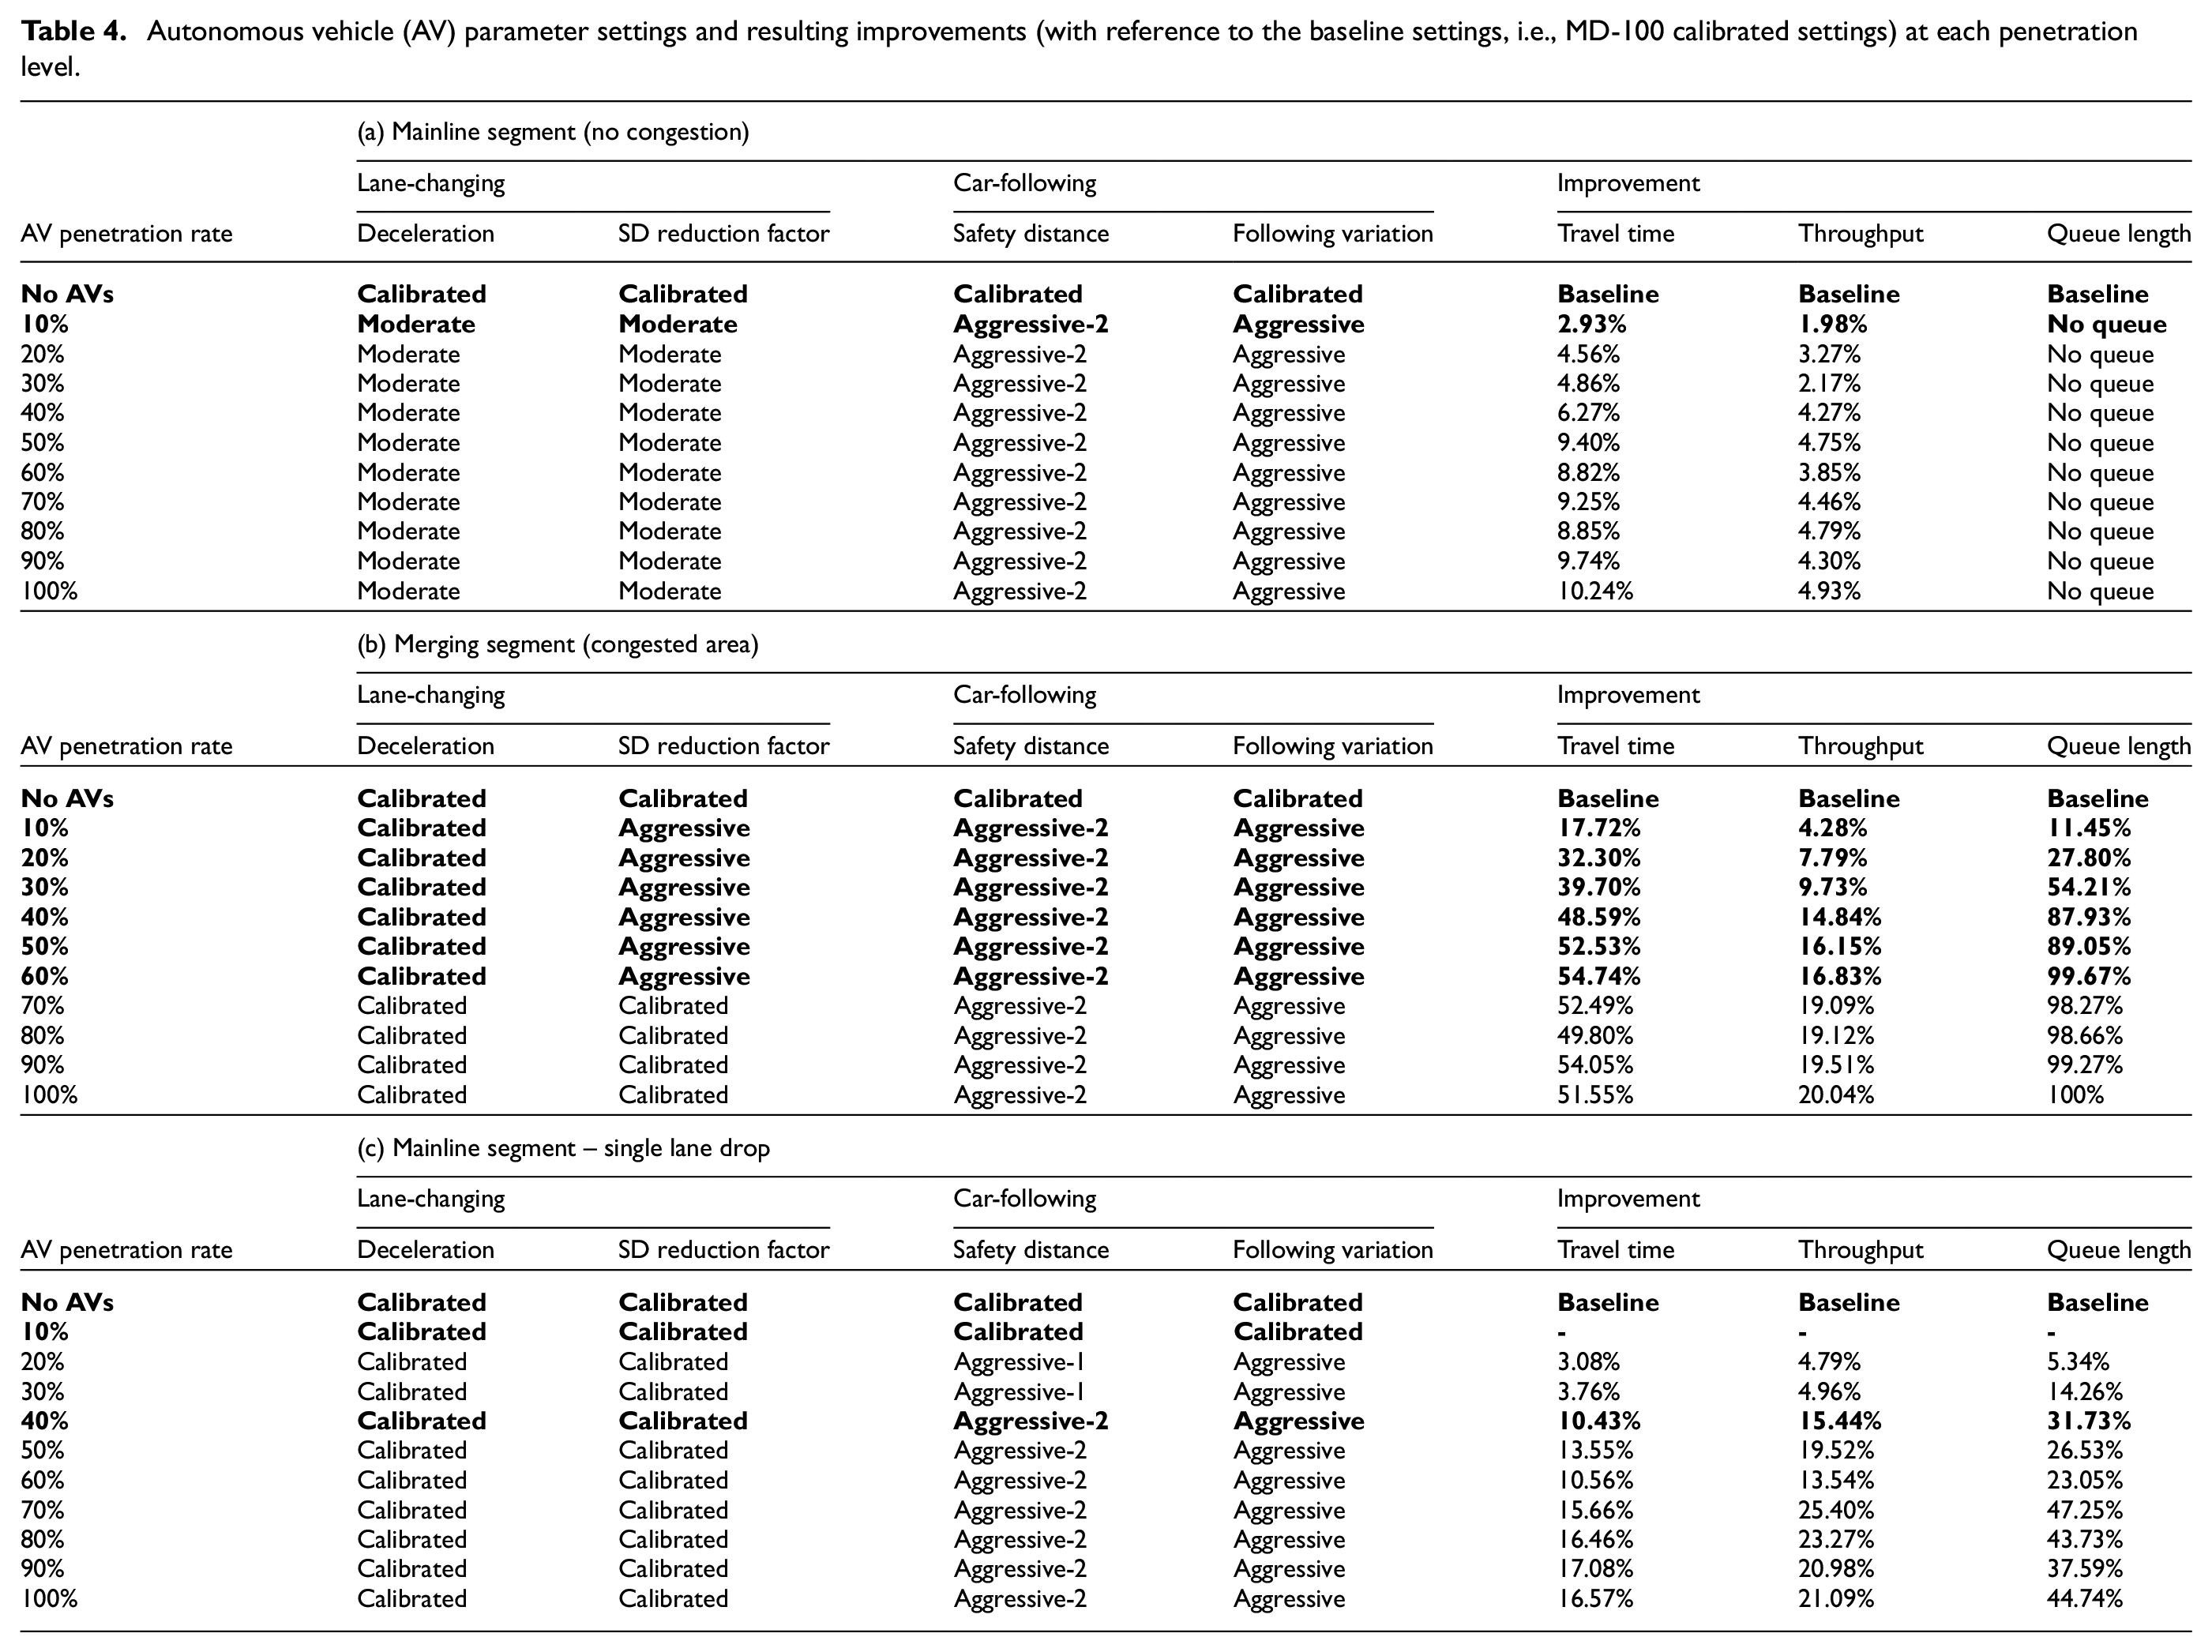
On the mainline segment, the lane-changing setting at all AV market penetration levels is recommended to be set at moderate levels. The car-following settings should both be set to aggressive levels. With such behavioral settings for AV flows, as shown in Table 4(a), all vehicles traversing through the mainline segment observe about a 3% drop in travel time and a 2% increase in throughput at 10% AV market penetration. At 50% penetration levels and above the travel time and throughput do not improve, and at these levels a 10% decrease in travel time and an almost 5% increase in throughput is achieved.
The improvements in the merging area, which experiences a daily bottleneck due to high on-/off-ramp volume, are more pronounced. The recommended car-following setting is aggressive for both the safety distance and car-following variation at all AV market penetration levels. However, between 10% and 60% AV market penetration, the lane-changing behavior should be set at the calibrated settings (i.e., same as non-AV driving population) for the deceleration parameter and aggressive settings for the safety distance reduction parameter. At penetration levels of 70% and above, the lane-changing behavior should be set to calibrated settings.
The magnitude of improvement is considerable even at lower AV market penetration levels. As shown in Table 4(b), at 10% levels throughput is increased by over 4% and travel time decreases by upwards of 17%. The traffic performance continues to improve up to 50% penetration levels, beyond which the improvements level off. At 60% and above AV market penetration levels, the queue lengths in the merging area are eliminated and the travel time is improved by over 50%, along with the throughput increase of 19%, in comparison to the case where no control is administered. The improvement of 100% in queue length signifies that the merging segment of the network previously plagued by queues now no longer experiences such traffic conditions. Therefore, all vehicles can traverse through this region without encountering queues.
Table 4(c) shows the recommended car-following and lane-changing behaviors for AVs traversing through the mainline segment under a single lane closure. It is observed that the change in the lane-changing behavior of AVs does not have a significant impact on traffic improvement at all penetration levels. Also, at 10% AV penetration levels, change in the car-following behavior does not result in significant traffic improvements; therefore, AVs are recommended to operate under calibrated car-following settings. At penetration levels greater than 10%, AVs are recommended to operate under aggressive car-following settings in order to yield maximum benefit from AV flows. As highlighted in Table 4(c), when 40% of AV flows operate with aggressive car-following settings, the traffic flows experience up to 10% reduction in travel time and up to 32% reduction in queue lengths.
The improvements in travel time, throughput, and queue length at each AV penetration level (as a result of the appointment of the recommend AV settings) are summarized in Figure 5.
The selection of the AV driving settings for both mainline and merging segment of MD-100 are discussed below.
- For both the merging and mainline segments, the suggested car-following behavior is aggressive, that is, AVs follow a shorter headway and respond to the following vehicle at shorter distances. The resulting positive impact on travel time and throughput is consistent with that reported in the literature.9–12
- The lane-changing behavior in the mainline segment is recommended to be moderate (i.e., AVs will decelerate at a lower rate and will accept non-mandatory lane changes at a smaller reduction to their safety distance than their human counterparts). The specified lane-changing behavior will result in fewer non-mandatory lane changes, thereby requiring the vehicles to minimize their lane changes and limiting them only to mandatory lane changes.
- The prescribed lane-changing behavior in the merging segment is different for market penetration levels between 10–60% and 70–100%. At 10–60% penetration levels, AVs are recommended to set the calibrated setting (i.e., same as the non-AV driving populations) for their deceleration behavior during the mandatory lane change and aggressive settings for a reduction in their safety distance. The behavior is changed to calibrate for both parameters at 70–100% penetration levels. The change in the settings for the lane-changing parameters is the result of a higher proportion of AVs in comparison to human-driven vehicles. Therefore, the added benefits of having aggressive lane-changing behavior along with aggressive car-following behavior become insignificant once AVs constitute 70% or higher percentage of the traffic flows.
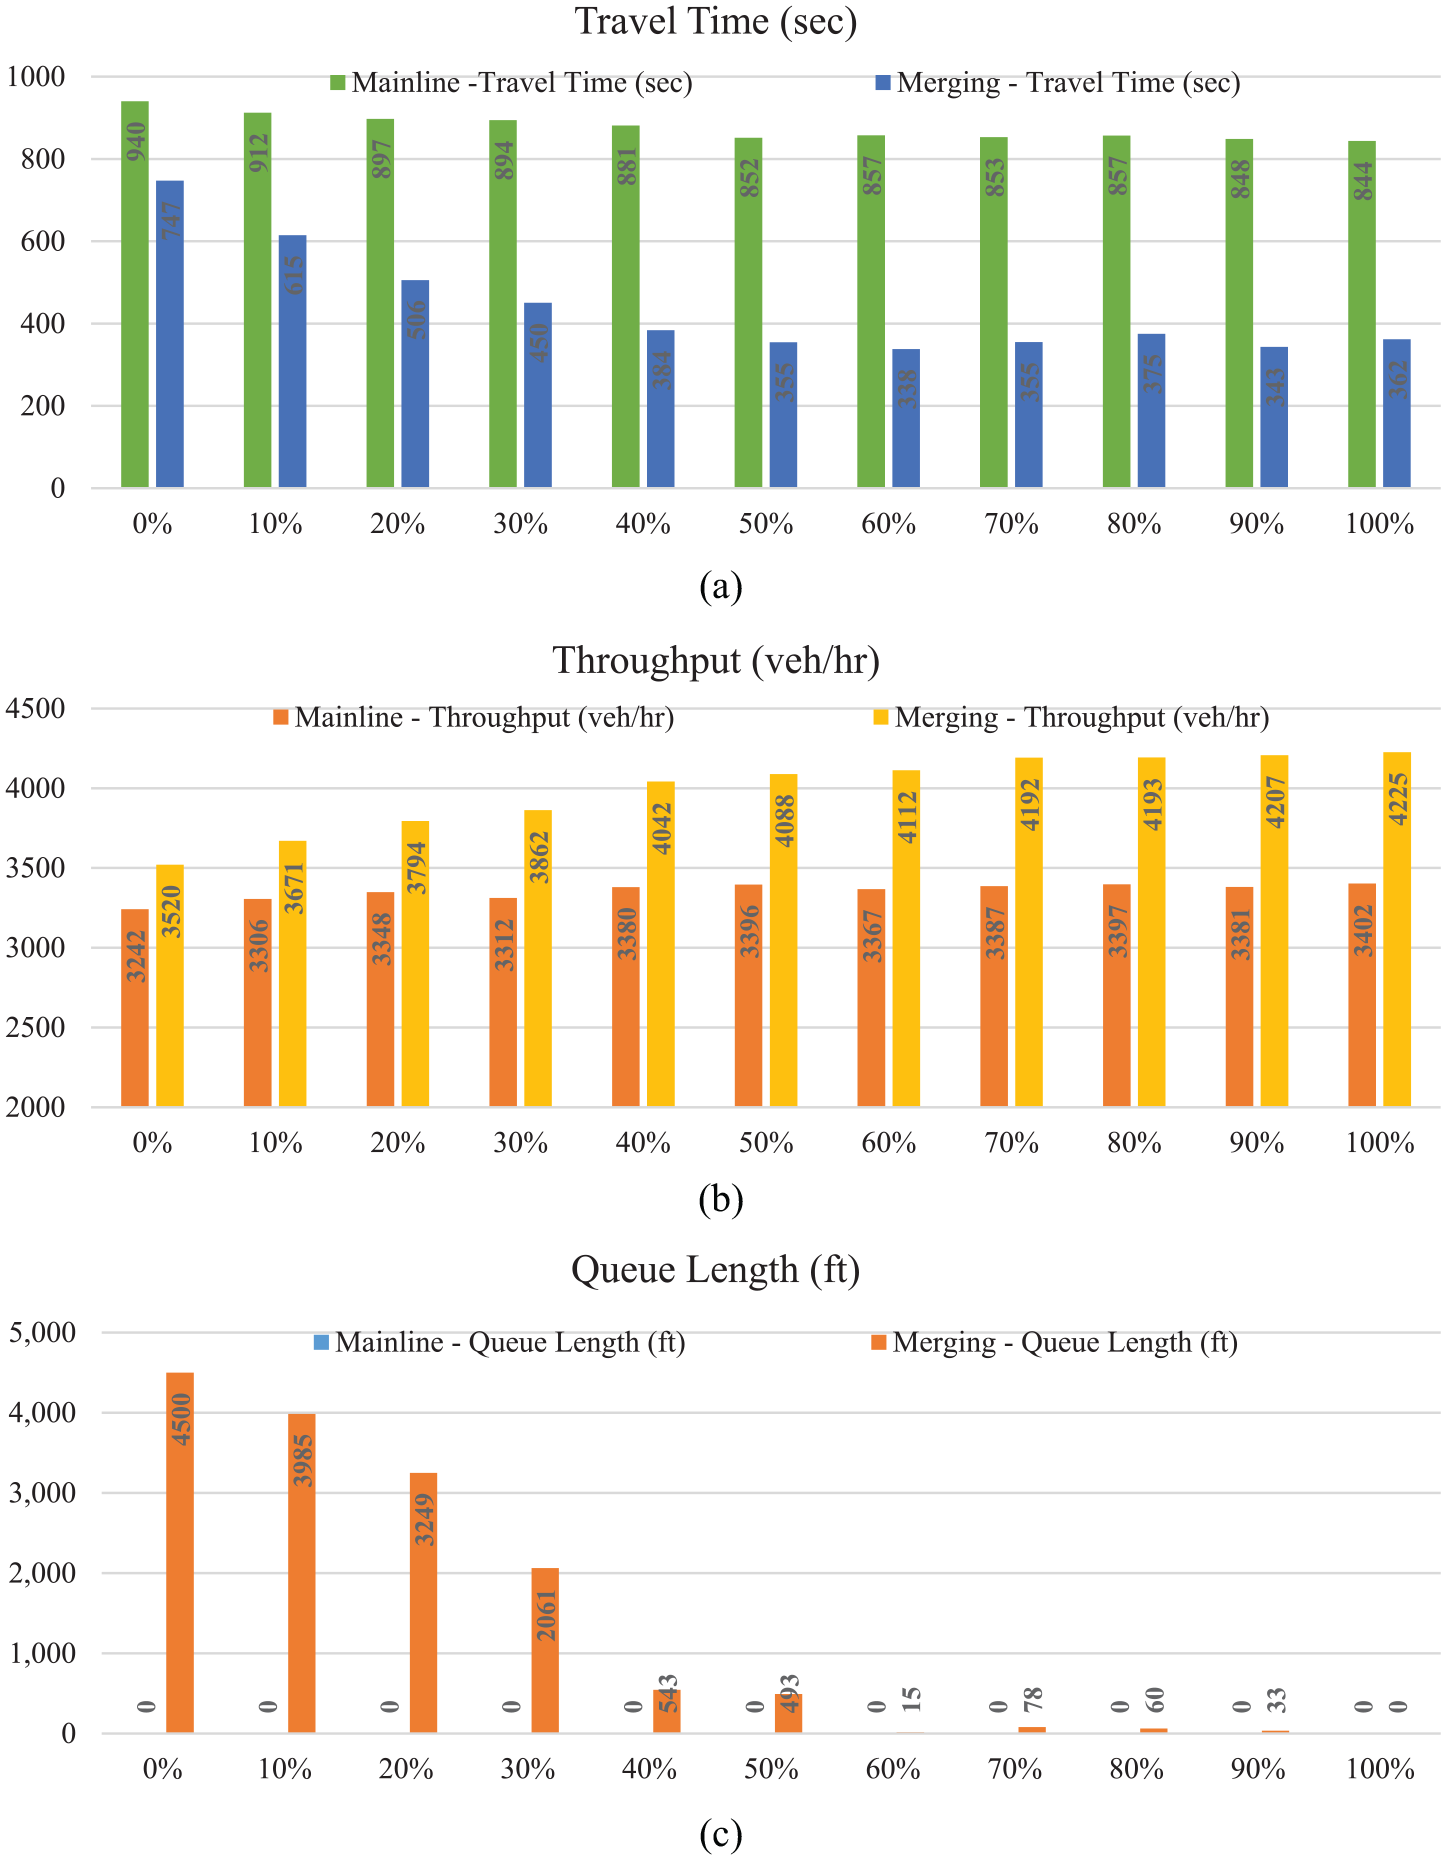
Change in travel time, throughput, and queue length resulting from the adoption of the recommended autonomous vehicle (AV) settings: (a) travel time at merging and mainline segments under recommended AV driving settings; (b) throughput at merging and mainline segments under recommended AV driving settings; (c) queue length at merging and mainline segments under recommended AV driving settings.
3. Conclusions
This study has addressed an issue often overlooked when the topic of AVs is discussed in the literature. Instead of focusing on different AV-specific car-following and lane-changing models alone, this study has focused on the role of an operational agency in coordinating with the AV traffic flows. In this effort, a methodology for developing operational guidelines has been presented to manage the impacts of different AV flows on congested highway segments.
The methodology was applied to a congested two-lane highway in Maryland, and the results of different AV settings show that improper AV behavioral mechanisms can severely impede traffic operations at all AV penetration levels. Under appropriate settings administered by the external traffic controller, the experimental analysis shows that the introduction of AVs even at the 10% penetration rate can result in a reduction of average travel time, an increase in throughput, and a decrease in queue lengths on the merging and mainline segments. These improvements, due to the exercise of optimal behavioral mechanisms for AV flows, have yielded the same benefits to both AV and non-AV flows.
The experimental results in the study highlight the existence of an optimal set of behavioral mechanisms for AV flows that are required to be executed over different segments of the commuting freeway under the given traffic volume to maintain and improve traffic flow. Hence, the responsible highway agency can follow our proposed method to develop operational guidelines that will enable traffic operators to properly coordinate with AV flows to make the best use of the roadway capacity and to avoid any potential negative impacts of AVs.
Other ongoing research tasks associated with AV traffic flow include developing models that take into account the lower reaction time of the automated system, evaluating the impact of different AV behavior compliance rates and the need for enforcement, the Vehicle to Vehicle (V2V) communication component, and the use of AVs to implement VSL (variable speed limit) strategies on recurrently congested freeway segments.
Footnotes
Funding
This research received no specific grant from any funding agency in the public, commercial, or not-for-profit sectors.