
Abstract
The purpose of this research is to define the bottlenecks in a port’s rail container transport process and simulate the proposed scenarios in a real port using the lean-railroading approach. After visiting the selected port and holding several meetings with the authorities, all functions relating to containers have been identified. Each section’s arrival and departure times were used in this analysis for all containers shipped by rail in 2017, including 19,000 records. The data was accomplished by the processing time of transferring the containers between the railway areas and the port berth. The value stream map (VSM) related to the processes was prepared using the lean approach, the current port situation and proposed scenarios were simulated using the AnyLogic software. The results showed that the two proposed solutions effectively reduced time and costs by up to 20%. The research port also could increase the rail share to 8% without spending on infrastructure. Nevertheless, the rail container terminal warehouse will be a significant bottleneck for the port by growing the load operations. Reducing the turnover of the wagon will also halve the required number of wagons in the network. Therefore, it is recommended that a framework be established to direct freight to rail transport through the Ports Organization by meeting the infrastructure and operational requirements of the port and through the Railroad Company by launching the scheduled freight train and providing the required fleets.
1. Introduction
Today, approximately 90% of the World’s cargo is transported by sea, and the US$12 trillion business of container transport accounts for 60% of the maritime transport.1,2 However, during 2000–2018, the global container transport has been increased from 224 million TEU (twenty-foot equivalent unit) to 752 million TEU. 3 According to the statistics, the origins and destinations account for nearly 60% of the shipping time. 4 Changing the mode of transport in the ports takes considerable time out of the total travel time. This time takes up to one month in some ports. 5 One of the ports’ critical problems is the loss of time in the cargo handling and, consequently, facing the warehouse or delaying cargo transport in the ports. Up to 77% of the loading and unloading time is often wasted. 4
One way to accelerate the port unloading process is to use rail for fast and large handling. While more than 30% of the cargo is carried by rail in major European ports such as Rotterdam and Hamburg, it only represents an 8–10% share in some other countries. 5 As trains can bring considerably more goods than trucks, delivering cargo via the railway system increases ports’ handling capacity. In addition, trains are more environmentally friendly and keep roads clear of large dangerous vehicles.
1.1. Related works
Steer and Page 6 and Beattie et al. 7 are the pioneers in port simulation studies who used the Monte Carlo statistical model in their research. Then, Lawrence 8 and Borovits and Ein-Dor 9 simulated the port container terminal’s emerging processes with the Fortran software. In the late 1970s, David and Collier 10 simulated the operation of container equipment (forklifts and cranes) along with the time between two ships to calculate the optimum time of cargo operations.
Kondratowicz 11 is at the forefront of the container transport process simulation who used the Fortran language to simulate the container loading and unloading process. His studies made significant progress by defining a complete hierarchical model for better decision-making and understanding of the dynamical system. Subsequently, Pope et al. 12 used the Fortran simulation for Virginia’s port and examined the cargo handling processes in and around the port. By increasing the freight volume carried in the port cities, the traffic passing through the surrounding area will be increased, causing traffic in those areas. This study addressed three issues: the impact of highway construction, doubling the terminal capacity, and creating a daily scheduled train. They analyzed the processes of cargo handling in and around the port using the Fortran language. After simulating the three scenarios, they analyzed each one’s advantages and disadvantages according to the municipal policies.
Later, Kozan 13 performed the simulation with the Siman software on the container terminal at Brisbane Port in Australia. The purpose of this study was to increase the efficiency of the container terminal by providing the proposed solutions, including the optimal train size, required equipment, and allowed delay time using the simulation techniques in Siman software, as well as heuristic programming techniques for the dispatch of trains. Unlike previous studies, Kozan innovatively introduced the heuristic techniques into the modeling. One of the gaps in this paper is the cost–benefit analysis that plays an important role in decision making. 13
Gambardella et al. 14 simulated and scheduled the container terminals on the Tyrrhenian Sea coast in Italy with the MODSIM software. In this research, Gambardella et al. first used the realistic representation of processes. This research aimed to find the optimal solution for the resource allocation model in this terminal. Owing to this terminal’s lack of physical space, the containers are stored on five floors. The input and output flow to the terminal is provided by trucks, ships, and trains. 14
Kia et al. 15 discussed the necessity for modern information systems in container terminals and, for the first time, rail terminals were considered. In this study, the authors used the TAYLOR software and selected Melbourne’s port, Australia, as the case study. They offered some suggestions for using different equipment to trace the containers and schedule the movements. Finally, the results of simulations for the terminals with and without the information systems confirmed the hypotheses. 15
Rizzoli et al. 16 conducted a similar study to simulate container terminals’ inland transport with MODSIM software in northern Italy, where various rail segments are in contact with the trucks. The simulation was made at this terminal, taking into account other equipment such as cranes and schedules for trains and trucks. This simulation aimed to examine different scenarios and the impact of new equipment and technology on the terminal efficiency. 16 Afterwards, Martínez et al. 17 conducted a study on moving containers between the trains in a container terminal and simulated the transport processes of four gantry cranes with the Witness software. These processes were examined in different scenarios to identify effective parameters and the best solution for each scenario. In the end, the results indicated that, in addition to the transport modes, the technical specifications of cranes, container sizes, and program of train movement affect the efficiency of this terminal. In this study, the side processes were not closely studied, which can have a significant effect on the results. 17
Following the previous studies, Parola and Sciomachen 18 conducted studies on the intermodal flow of containers in two Spanish ports. In this research, the discrete event simulation was developed to assess the system potentials for improving the container flow during the increased volume in recent years. Some scenarios were defined to simulate the current situation for achieving the goals of the next seven years. The key parameters in assessing scenarios were the share of rail traffic and the percentage of road traffic increase, and ultimately the best scenario was provided. 18 Kozan 19 again conducted a study on the capacity of the intermodal port terminals in Australia to reduce the delay time for optimizing the terminal processes. He analyzed the costs and delays during the process using the analysis of different scenarios simulated by the ARENA software. In the simulation, the parameters of delivery and loading policies, train scheduling, arrival of export containers, container loading and unloading, stored containers, and imported containers were considered. This study’s results were the optimal number of transport equipment, process balance, and feasible solution to the problem. 19 . Afterwards, Bielli et al. 20 simulated all operations of a container rail terminal using the Java toolkit to demonstrate the simulation capabilities for improving the processes.
The literature review suggests that the lean production approach has also been used to identify the rail-port processes’ bottlenecks and wastes. Loyd et al. 21 showed that the implementation of lean production modelling at the port of Alabama in the south of the United States led to a 30% increase in revenue, 26% and 44% decrease in the ship loading and unloading time, 100% improvement in rail wagon unloading. Esmemr et al. 22 identified the port’s present situation utilizing the lean production concepts with the ARENA simulation software to increase the port’s productivity in Turkey. According to the analysis, the optimum number of equipment was calculated based on the reduced idle time. Olesen et al. 23 studied two multimodal terminals in Denmark and Norway to discover the effect of lean thinking on improving the flow of goods at the multimodal terminal level. They found that the standardization principle has the most significant impact on reducing the deviations and increasing the flow at the terminal level. Carteni and De Luca 24 carried out a similar study on the Salerno container terminal in southern Italy using the discrete event simulation software (Witness) considering the rail terminal. He sought to obtain the best model by comparing the time of processes, which ultimately can be used to decide on the development of this terminal. In recent years, Taner et al. 25 developed a simulation model for a rail container terminal to better understand the processes, including rail processes, to identify the potential for improvement. The purpose of this study was to test the impact of transporter dispatch rules and the resource allocation strategies on the length of the annual process. According to the results, the terminal efficiency is greatly influenced by the equipment layout under different dispatch rules and allocation strategies. Then, Zehendner and Feillet 26 conducted a review of the benefits of transportation system scheduling on ground transportation quality at Marseille port’s multimodal terminal. In this study, Zehendner and Feillet implemented the Marseilles port’s planning process during the discrete event simulation using the ARENA simulation software. This study can be further completed with the planning for other transportation equipment. Later, in a fascinating study in 2015, the effect of applying synchronization of transport flow without making any change in the port’s structure or infrastructure on a port has been assessed. 27 Lima et al. used an agent-based simulation and queueing theory to estimate the improvement in port. The results show scheduling decision-making will significantly reduce the storage time and the time of goods in transit after the change.
Among the current global issues, the Sevilla port can be used as a hub in the Spanish and the Canary Islands’ logistic cargo chain. The port is responsible for changing the mode of transport between rail and sea. Ruiz-Aguilar et al. 28 reviewed various scenarios and methods to reduce the delay using the full-scale simulation from origin to destination. The simulation was done with the Simulink software. In addition, Mazouz et al. 1 used the Witness software to simulate one of China’s ports to identify and evaluate the container terminal with the discrete event approach. Among recent trends in port logistics research, there is a study 29 that introduces an intelligent decision support system (DSS), contributing to collaboration between port logistics freight operators, using a multi-agent simulation approach and reinforcement learning inspired by human decision-making techniques. The model puts together optimization modeling and decision theory to work in a complex world between agents and dynamic changes over time. Their results show significant saving in total cost and travelled distance as well as higher utilization of trucks.
1.2. Problem description
According to the literature review, no comprehensive study is aimed to increase the rail share in any ports. Therefore, the purpose of this study is to examine the rail container processes of a real port to identify the points to be improved and analyzing their impact on the port operation and infrastructure using the lean railroading approach and discrete event simulation in the AnyLogic simulation software. In this study, one of the most active ports across a country has been selected to be analyzed in railway cargo functioning. Although the port has the infrastructure of a railway system and the benefits of using this transportation method are clear, its railway performance seems to have potential for improvement. It is worth mentioning that it is the cargo owners that will choose to transfer their cargo either by truck or rail; therefore, the first problem that has been dealt with in this study is how to encourage the cargo owners to choose railway instead of trucks. The mentioned encouragement policies are coming from understanding their needs and expectations through investigations, which in this paper are called “solutions.” The second step is to find out what would happen in the port in terms of activities and needs if most cargo owners decide to switch from trucks to railway transportation. This assessment is based on several discrete event simulations on different possible “scenarios.” Various scenarios were developed by reviewing the processes and were compared using the simulation tools to observe the time/cost effects and calculate the operational changes and equipment needed for each scenario.
2. Research methodology
In this study, the simulation was used to model the current situation and the proposed port scenarios owing to the incredible complexity of the processes and the high cost of real-world changes. The simulation allows the real world to be explored through the change in techniques, operations, and methods at a low cost without interfering with the real-world systems. In addition, by increasing or decreasing the study variables, the effect of changes can be globally observed. 30
2.1. Database
Three sources of information were collected during this research to fully understand all the processes in the containers carried by rail. The first source is the four field visits to the study port made in October 2017, February and December 2018, and May 2019 for a total of 160 hours. During the visits, all the steps taken by the containers and owners for the rail freight transport, including the loading and unloading equipment, rail and road container terminals, transport equipment, and the customs located at the port, were investigated and scheduled. In addition, in the visits made for other physical processes such as transportation, the simulation software’s scheduling was obtained.
In this research, to draw on the experiences of the experts and to identify the existing conditions and the improvement solutions, 10 interviews totaling 30 hours were conducted with the relevant authorities, including the Ports and Maritime Organization of Iran, Shahid Rajaee Port, Iran Railroad Company, Ministry of Road and Urban Development, and cargo owners. The interviews were to investigate the rail transport issues from the experts’ point of view. A complete database of all existing problems and solutions was obtained.
In this study, the scheduling data of all 19,000 rail container records in the port during 2017 was extracted from the CCS software system and analyzed statistically. The data consists of 12,000 containers of 20 ft and 7000 containers of 40 ft and includes the container type and number, transporter ship, mooring time, unloading time, time of transport to the container yard, time of arrival at the rail support terminal, time of clearance, wagon number, and destination of the cargo.
2.2. Case study
This study reviews the Shahid Rajaee port with an annual container capacity of 2.6 million TEU and the connection with 80 major ports globally, the largest port located in the south of the Islamic Republic of Iran. The area is 25 km2, which can expand up to 2400 hectares. Different routes connect this vital port to the Iran road network, the most important of which is the Bandar Abbas–Tehran route, which at 1330 km long is the shortest route between Bandar Abbas and the capital. In addition, Shahid Rajaee port is connected to the national rail network through the national railway of Bafgh-Tehran, which has led to the growth of freight transportation activities in the region.
According to the study’s purpose, the container terminals are investigated among the terminals in this port. In Shahid Rajaee Port, two terminals 1 and 2 and the adjacent berths are devoted to container freight. There are various container terminals in the support area for performing the required operations (strip, CFS, loading, warehousing, etc.). However, the two container terminals are of great importance in this study because they connect the container freight to the rail.
Initially, the containers imported by container ships enter the port catchment area. With the Port Affairs Bureau’s permission, they are moved to the assigned berth using the tugboats in this port and wait for the unloading order. With the container terminal operator’s order and assigning the required equipment to the berth, the ship unloading process begins using the gantry cranes and terminal transporters. At the time of unloading, the terminal operator tallies the cargo and matches the results to the bill of lading submitted by the cargo owner. The transporters carry each container to the container yard. Each container is put in its place using the transtainers in the area under the predetermined schedule.
The information system existing in the port (called CCS), which container terminal operators jointly use, is responsible for assigning the containers to support areas. There are various terminals available for servicing different cargo types in the support areas located at the port hinterland, some of which are charged with the container cargo tasks. Two terminals exclusively carry out the rail loading and unloading operation for the containers among the terminals. The transfer of containers to support areas (rail and road) is the destination terminal’s responsibility, using the leased trucks for the transfer. If the containers are removed from the initial site five days before the warehousing, the cargo owner’s bill does not include the warehousing cost. Once the containers arrived at the destination terminal, they are stored until the owners complete the clearance stages, including the weighbridge, evaluation, and X-ray operations, and receive the exit bill.
The processes associated with the containers transported by rail and road are similar until the transfer to the second terminal. The differences arise from this stage, and the road cargo owners’ operation is slightly more accessible and faster. However, rail transport should be a better incentive for the user due to its higher efficiency than road transport. One of the reasons for the further difficulty of the rail container owners’ operation is the lack of proper rail equipment, including the weighbridge and railcar X-ray scanning system. That makes it mandatory for the owners to lease the truck and pay the loading and unloading charges. In other words, the owner incurs a US$40 cost per container for choosing the rail mode. In addition, waiting for the formation of a train and the long idle time of containers before loading on the train are among the rail cargo owners’ problems. As for the road cargo, after obtaining the bill of exit, the freight is carried to the intended destination.
Figure 1 shows the flow of information from the perspective of owners. According to the diagram, the cargo owner first registers the bill of lading. Then, at the unloading and issuing of the warehouse bill, the deadline for the clearance process begins. The clearance involves providing the documents and information required by the customs (evaluation, weighbridge, and X-ray) and settling with the port. In addition, by registering the order in the Railroad Company website, the container is loaded onto the train and shipped to the destination.
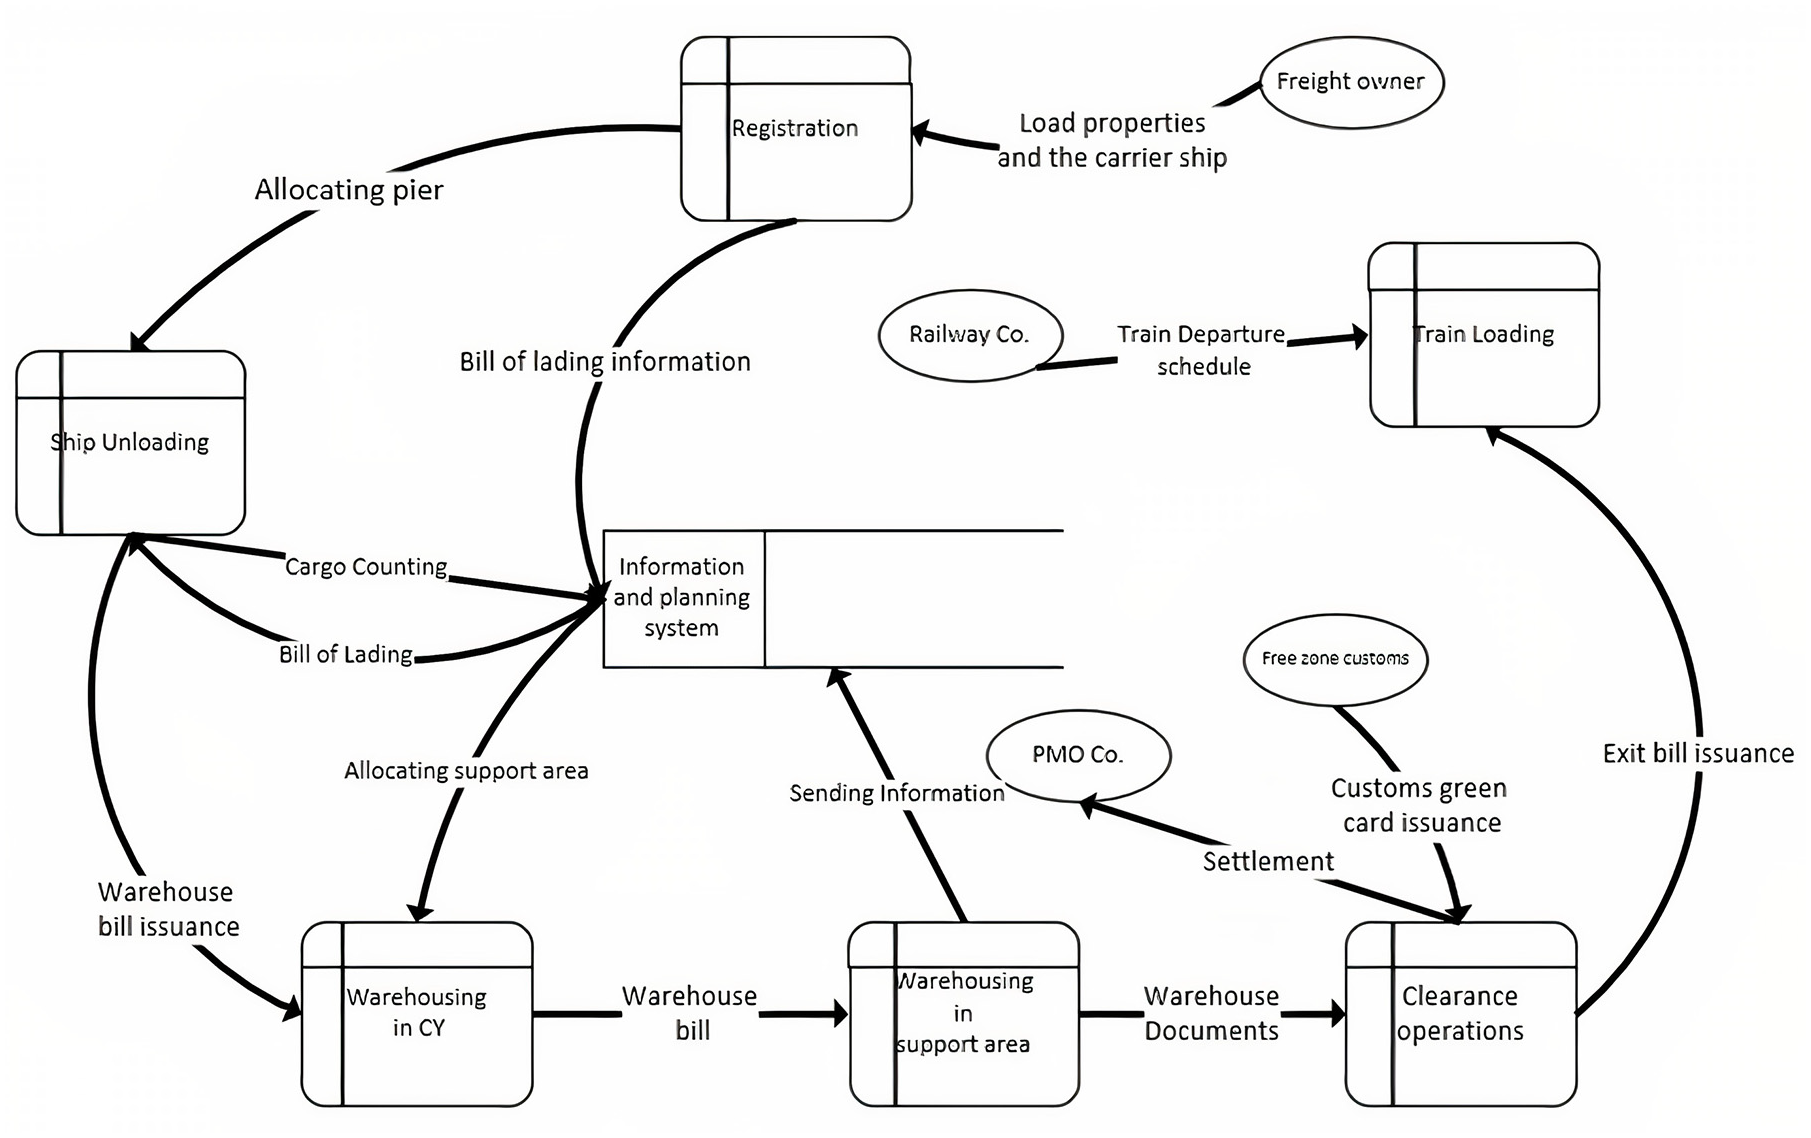
Data flow diagram of an imported container at the port.
2.3. VSM and simulation model
After collecting the required data, the frequency diagram of the data was plotted using SPSS software. The distribution functions and simulation parameters, including the waiting time of containers, transportation time, time of unloading, and use of equipment, were estimated. The VSM of processes was drawn to identify the wastes. The VSM provides a separate representation of each process, where the valuable time and waste of each part are displayed. As cargo owners’ primary concern is wasted time during rail cargo clearance, the VSM clearly shows which part needs attention for reducing wasted time. As mentioned before, the “solutions” are developed based on the results from VSM to minimize the wasted time and money on rail cargo clearance to encourage cargo owners to select railway transportation.
The AnyLogic simulation software was used to develop a discrete event simulation model. This international software is one of market leaders in all fields of simulation, including the discrete event, dynamic, and agent-based systems used in this study due to the various simulation modules for the port and rail, Java programming, and having a graphical and functional interface. 31 The simulation model of this study ranges from container ships to loading on trains and trucks. The previous and next processes, such as the berth assignment, assignment of a specific number of gantry cranes to the ship, and train maneuvering, are not considered in this study. In addition, there are no details of warehousing, such as container sorting schedules in this model.
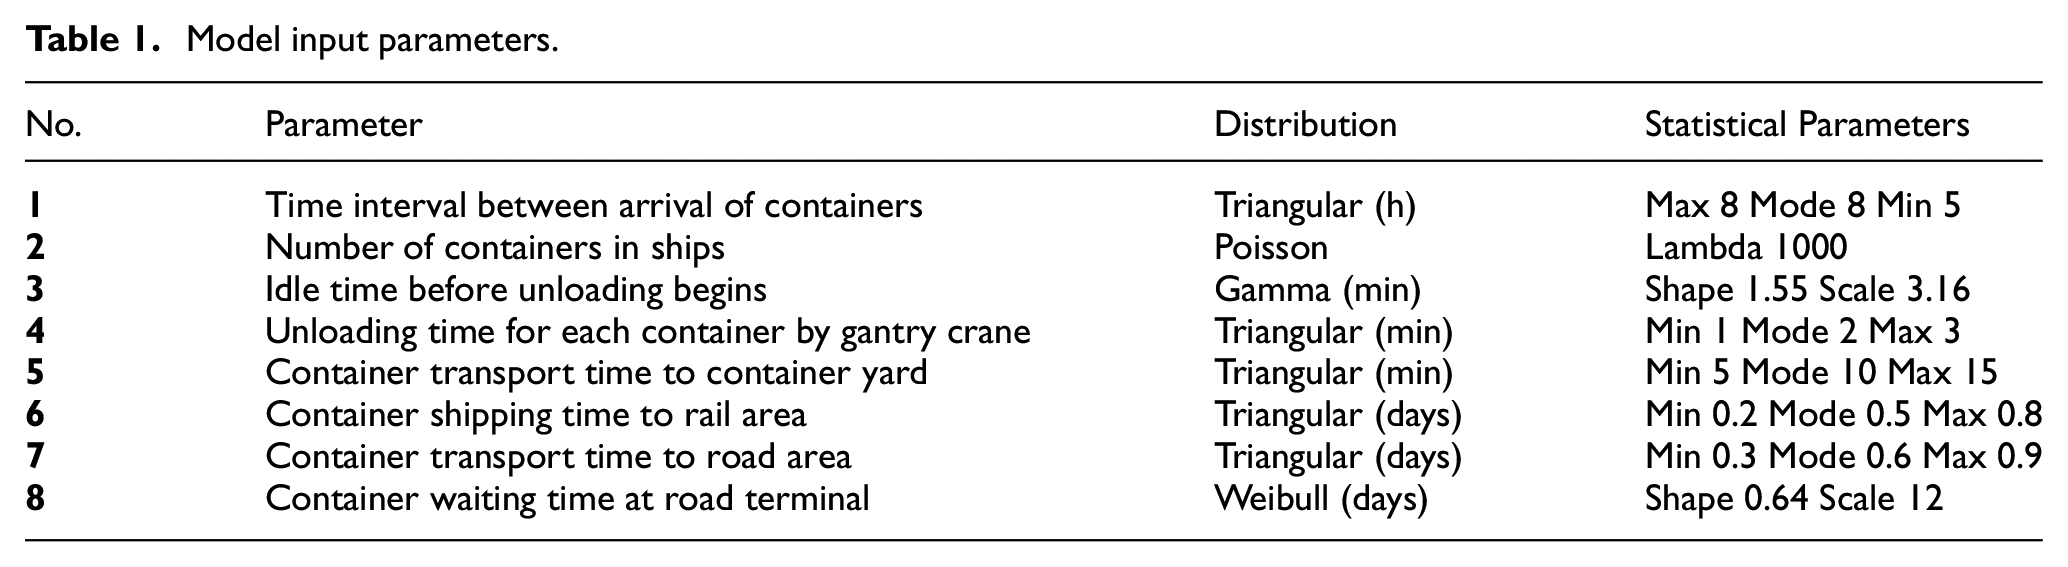
In this study, the processes conducted for the containers in the port are investigated. In Table 1, using the SPSS software, the distribution functions of related parameters are determined by the maximum likelihood method. In addition, the parameters of annually imported containers, annual exports, percentage of rail share, and turnover of wagons in the rail network are considered the model’s quantitative inputs. The time patterns, parameters of distribution functions, and input parameters are listed in Table 1.
Model input parameters.
In this research, after fitting the obtained data and explaining the statistical distribution for each of the processes, the simulation model was implemented in the AnyLogic software, considering the initial hypotheses. The components of the simulation system in this software are as follows.
The entities in this study’s simulation model include the export and import containers where the former is shown in red and the latter in green in the software’s schematic environment (Figure 2). In this model, the transportation and servicing equipment is referred to as the sources, including the gantry cranes, container terminal yard trailers (Terberg), transporter trucks inside the port and outside the port, and trains. The shipping of containers in this simulation model is performed in various parts of the model, including the berth, container terminal yard, rail container terminal, and road container terminal.
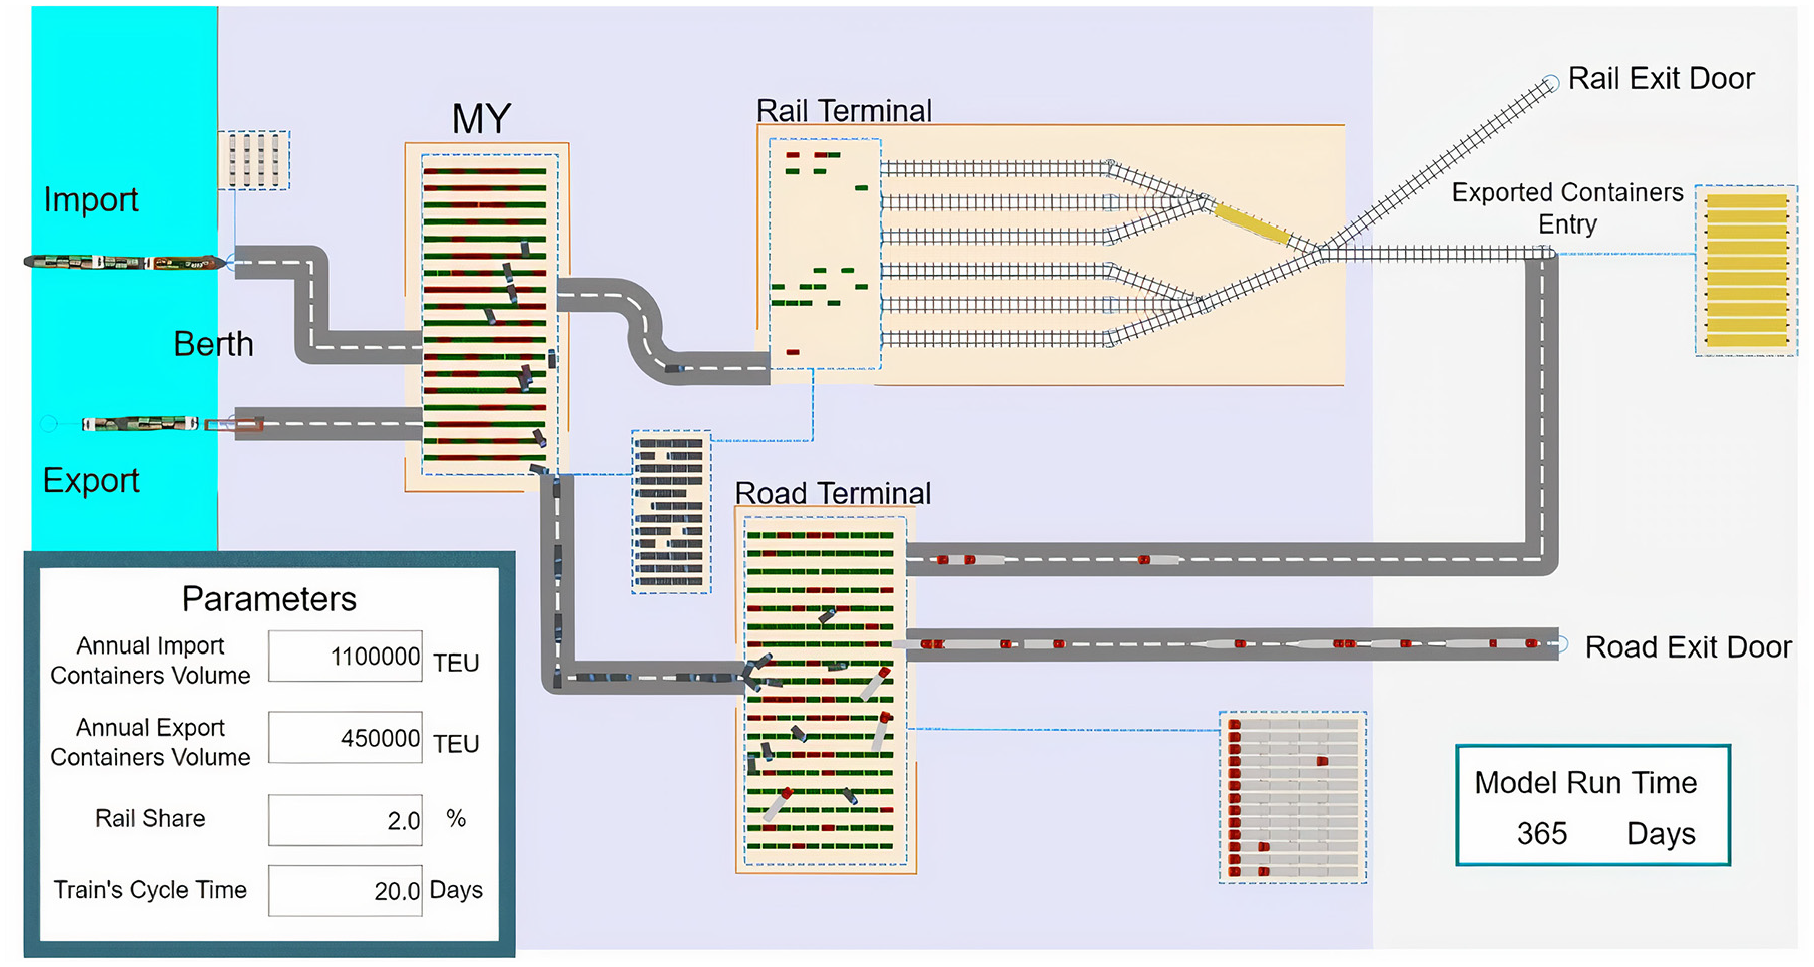
Simulation model two-dimensional view.
In the container import simulation model, the imported containers at the ship mooring location at the berth are allocated based on the statistical distribution of production and then moved to the gantry crane. The operation of moving the containers from the side of the ship to the placement on the area’s trailer begins. Then, the trailers move to the container yard, and the containers stop there for a specified period. After a period determined by the statistical distribution, the containers are assigned to the port’s trucks and transferred to the rail and road terminals. The container transport ratio between the road and rail terminals is indicated by the user, representing the percentage of the rail share for the port container. After the container reached each of the areas, the stopping time is determined by the statistical distribution. Eventually, they are loaded onto the train or truck and leave the port. One of the features of this software is the capability to simulate two-dimensional and three-dimensional displays of the model for a better understanding of the simulated space and a more attractive view. This feature allows a model similar to the real world to be provided to the audience using the default image. Figure 2 shows the two-dimensional model capabilities.
When designing a conceptual model of simulation, it is necessary to consider the assumptions that reduce the analysis’s unnecessary details. These assumptions can be weakened or intensified in future investigations for other simulation purposes. In this simulation, the port’s activity is not influenced by holidays or significant port routine operations changes. The initial number of entities in the travel model and the system’s warm-up period is two months and the total simulation period is one year. The average capacity of the container terminal warehouse is 2 million TEU. The average speed of gantry cranes is 27 moves per hour, and the shipping time from the gantry crane to the container yard has a triangular distribution, as shown in Table 1. The number of vehicles (trailers) is enough to carry the container inside the port, and they are available. The first and second rail terminal yard’s nominal capacity is 6000 TEU, and the container cargo loading for each train is 80 TEU. The container terminal’s average transport time from the container terminal to the rail terminals without traffic is between 20 and 45 minutes and with traffic is about half a day. The road terminals are also concentrated in one place, and the operation of assigning the berth and gantry crane to the ships is not considered.
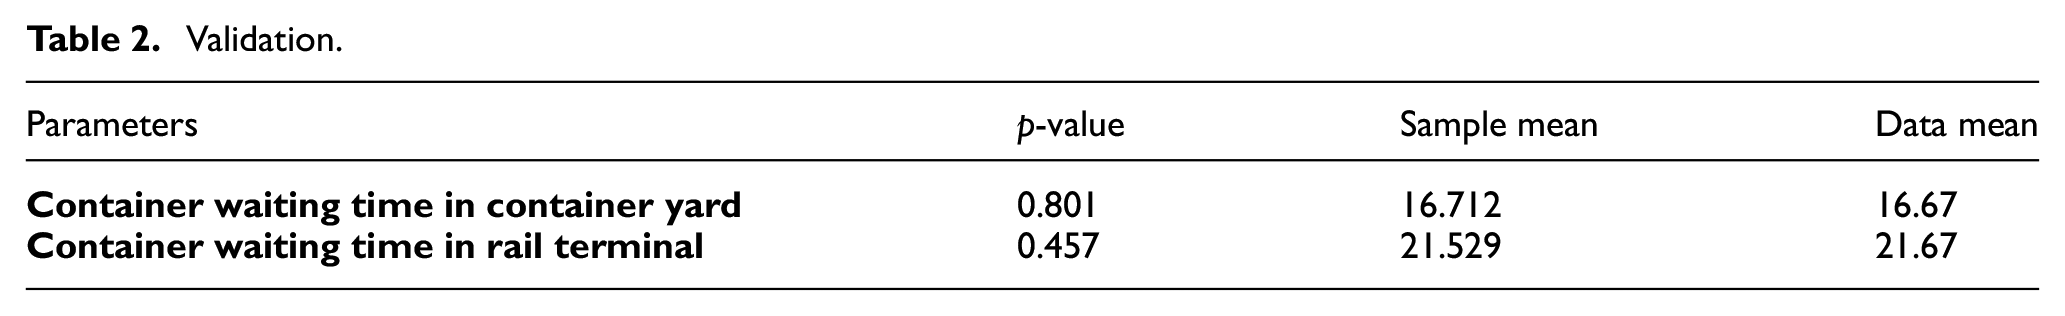
The data extracted from the model was evaluated using the equality of means test to verify the real-world simulation model (Table 2). In this test, two parameters, “container waiting time in container yard” and “container waiting time in rail terminal,” were selected as the measurement parameters. The equality of means test was performed for the one-year simulation data of the parameters. According to this test, at a 95% confidence level, the mean of the simulation model’s data is not significantly different from the mean obtained from the real-world data.
Validation.
2.4. Solutions
The operational and policy-making solutions were proposed and evaluated in this research to encourage the cargo owners to use rail transport. The solutions A and B were developed to reduce the time and cost of clearing the rail containers. These two solutions attract the cargo owners to use the rail transport mode and increase rail share. In the next stage, considering different situations of imported and exported containers, percentage of rail share, and wagon turnover, various scenarios were developed to examine the required operations, equipment, and infrastructure.
Solution A, through bill of lading (TBL): In the first step, the customs processes were transferred from the port to the destination customs, which reduces the idle time of containers and the warehousing costs for the cargo owners. In TBL, the number of imported rail containers and the intended destinations are pre-specified for the railroad. The formation of scheduled trains is facilitated for accelerating the delivery of rail freight to the destination. The container owners can also deliver their empty containers at the destination and prepare the empty containers for the export cargo rather than transferring the empty containers.
Solution B, separated rail exit door (SRED): owing to the separation of the rail and road customs inspection site and the installation of weighbridge and X-ray rail systems, the integrated queue of train and trucks is prevented, and the costs imposed by leasing the truck for the weighbridge and X-ray of the rail containers are removed. Therefore, these two scenarios’ impact on reducing the cargo owners’ time and the cost is expected to encourage the use of railroad and increase the demand for rail transport.
2.5. Scenarios
Sixty-six scenarios are defined in different situations for assessing the port requirements and potentials. These scenarios are intended to identify the required (a) operations and (b) equipment and infrastructure. Assigning different values of (1) annual container operation of the port, (2) percentage of rail share, and (3) wagon turnover makes different possible situations for the port; each combination is called a scenario. The three mentioned parameters are varied as follows.
2.5.1. Annual container operation
Annual container operation is the total amount of container operations in the port, including the import, export, transit, and transshipment, carried out over one year. After reviewing the values of container operations in the past 10 years in this port using the prediction of a least-squares estimate for the 10-year horizon, these values are predicted. Then, they are approved using the port development programs and the forecasts of the consulting company. The annual container operation ranges from 1.5 to 6 million TEU.
In this study, the operations ranging from 1.5 to 3.5 million TEU are considered the near horizon with low rail shares. The operations ranging from 4 to 6 million TEU are considered the far horizon with higher rail shares.
2.5.2. Percentage of rail share
The percentage of rail share is calculated from the ratio of containers transported by rail to the road. According to the port data, this ratio is currently about 2% and is predicted to rise by 30% in the long-term horizon. According to experts ‘ consultation, the rail share was decided to be 2–30% for the different modes. A rail share of 2–12% is used for the near horizon and 15–30% for the far horizon.
2.5.3. Wagon turnover
The wagon turnover time is calculated from loading a wagon and its departure from the port until reaching the destination, unloading, and returning to the port. This time is currently 20 days, which optimistically can be reduced to 12 days. Therefore, these two modes are considered 12 and 20 days for the wagon turnover for defining the scenarios.
3. Results
Figure 3 draws the VSM to find the bottlenecks and waste. Figure 3 shows the processes of the rail container transport so that once the ship was moored in the berth, the “ship unloading” operation begins for each container by gantry cranes coincident with the “tallying operation” and “transfer to the container yard.” The time of these three processes is estimated to be about half an hour (0.1 + 0.1 + 0.25), followed by issuing the warehouse bill.
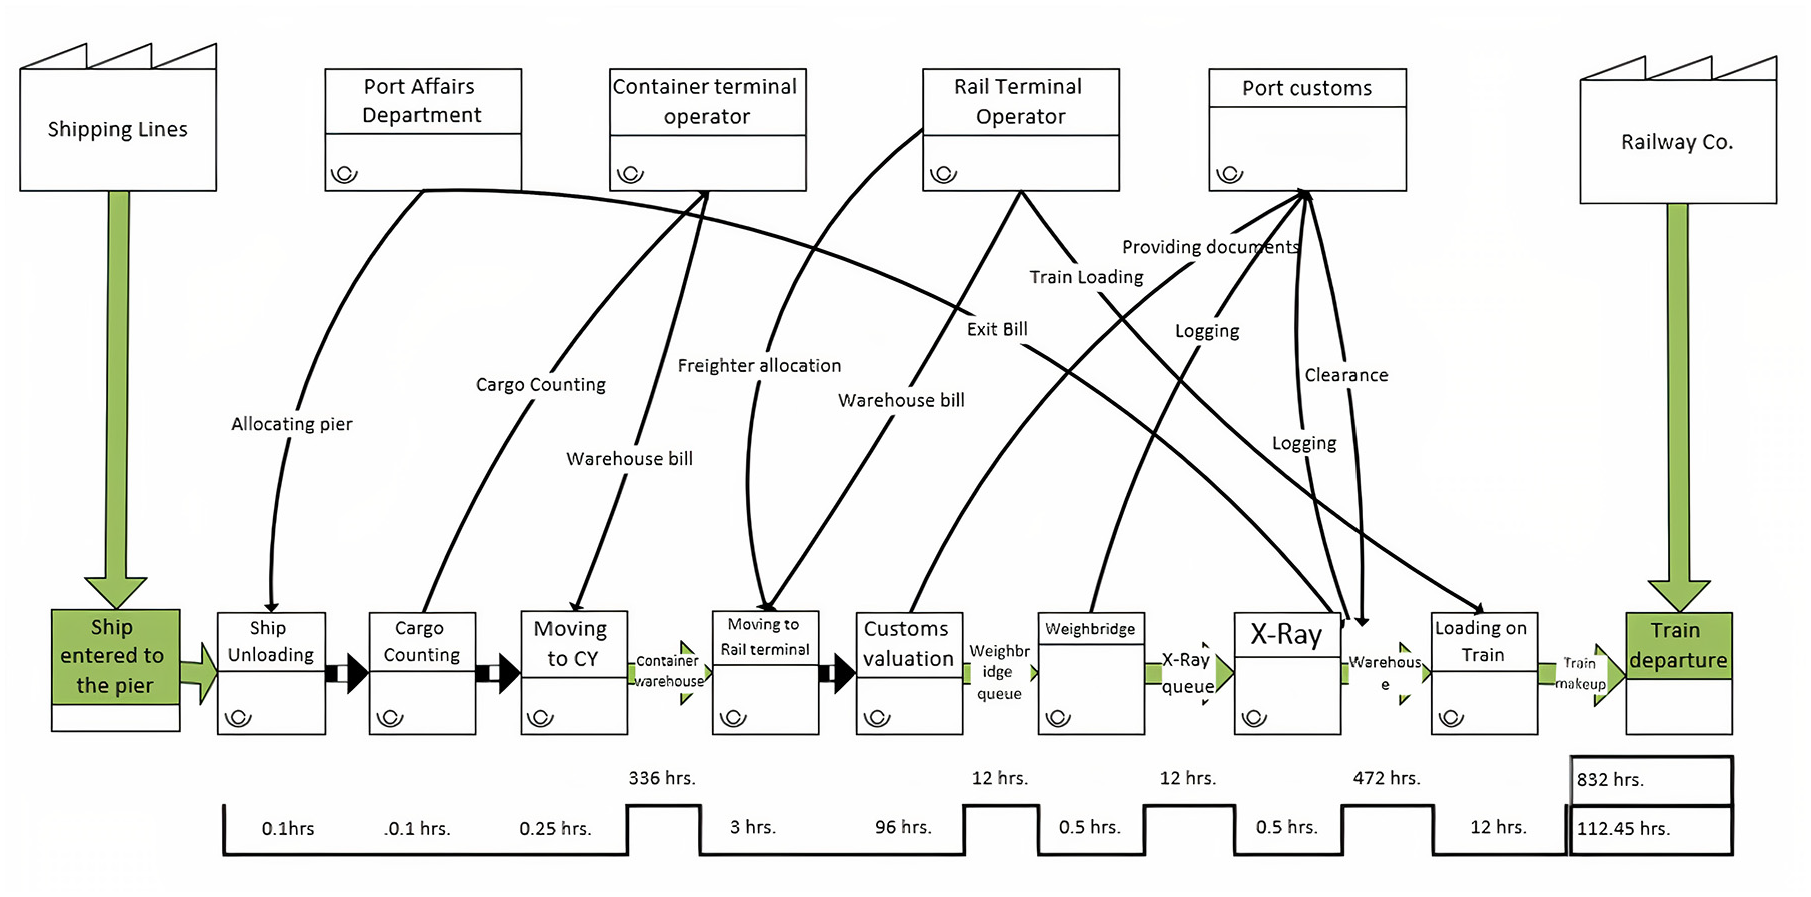
VSM of the imported container at the port.
One of the critical issues in Figure 3 is the 336-hour (14-day) idle time for the “container yard.” The containers are then loaded by the rail terminal operator and “carried to the rail terminal” over about 3 hours. Subsequently, the “customs evaluation” process begins and lasts about 96 hours. Owing to the lack of rail-specific “weighbridge” and “X-ray,” the additional time and cost are incurred by the cargo owners, resulting in a processing time of approximately 12 hours. The idle time in the rail terminal represents an average of 19 days. According to customs evaluation, weighbridge and X-ray processes (about 120 hours) involve a high waste rate.
In this study, following the implementation of solutions A and B in the simulation software and implementing the model within one year, the results were examined. Among the two solutions, the rail containers’ idle time in solution A is reduced by 20% because the containers are transferred to the destination with the rail without removing the seal (in the internal transit mode), and all the customs processes are conducted at the destination. On the other hand, in the current situation, due to the lack of rail weighbridge and X-ray, the cargo owners will incur the additional truck leasing cost of about US$40 for each container. However, with the TBL implementation, there is no need for this extra cost, which reduces the owners’ expenses by 15%.
In solution B, the distinct installations specific to the rail container, including the rail weighbridge and X-ray, eliminate the idle times resulting from the queues integrated with the road cargo. The results indicate that with solution B’s implementation, the customs clearance process results in an up to 10% reduction in time for the cargo owners. In addition, in the presence of rail weighbridge and X-ray, it will reduce the clearance costs by 15%.
The results indicate that at the time of demand for 1.5 million TEU (less than current port conditions), the port infrastructure is ready to accept the increase in rail share up to 12% without changing the equipment. However, the increase in demand up to 2.5 million tons (current operating capacity of the port) showed the current equipment without the need to increase port infrastructure and only with minimal modifications and utilizing proper planning and removing the existing waste, can meet the operational rail requirements up to 8%. At the same demand, with increasing the share of rail from 8% to 10% and 12%, there will be a need for more storage space for the containers in the rail terminal. Eventually, for targeting the 12% rail share and the 20-day wagon turnover, the number of low-sided wagons needed in the rail network will be greater than the number available in this network, and there is a need to purchase about 1000 wagons to meet the needs of container transport to destinations.
If demand is increased to 3 million TEU, the port can support up to 6% of rail container operation without infrastructural changes. By reducing the wagon turnover, the share of rail can also be increased up to 8%. Nevertheless, the simulation results show that if the demand is increased to 3 million TEU, even with the minimum 8% share and the 20-day wagon turnover, it is still necessary to buy low-sided wagons to remedy the shortage of the network. In addition, with the demand of 3 million TEU, even with the 10% rail share, the rail container terminal’s capacity does not meet the containers’ needs, and the need to develop this space is apparent.
In the event of the increase in demand of up to 3.5 million TEU, the port’s infrastructure capacity tolerates up to 6% rail share, and there is no difficulty meeting the needs. However, with the demand of 3.5 million TEU, even with the 8% rail share, the rail terminal warehouse’s capacity is not sufficient. With the 20-day wagon turnover, there is a need to buy the low-sided wagons for container handling.
Figure 4 shows the results for near-horizon scenarios based on the amount of container operation and rail share. Each point on the diagram represents one of the scenarios and has two dimensions of rail share and container operation. As shown in Figure 4, the port with current equipment can meet the specified scenarios indicated in circles, which means the amount of content needed to be operated by rail is less than the rail terminal capacity. It is also stated that increasing the rail terminal warehouse capacity by 25% can increase the port capacity for the higher share of rail (diamonds). In this diagram, the port cannot handle the scenarios with the higher container operations and rail shares (crosses), and there is a need for equipment purchase and infrastructure development.
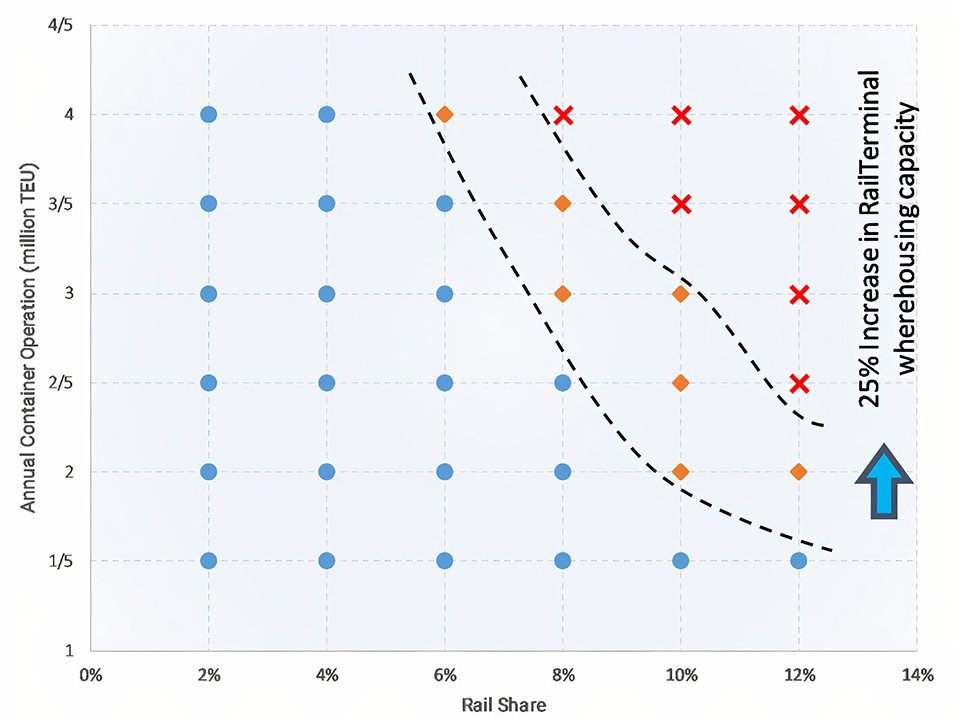
Near-horizon figure of possible scenarios.
Figure 5 shows that the wagons needed to move this container volume with rail have a direct relationship with the wagon turnover length. Changing the turnover from 12 to 20 days doubles the number of required container-carrying low-sided wagons. It is indicated that the proper and optimized planning for the movement of trains and accelerating the departure and arrival time of wagons can prevent incurring additional costs for wagon purchase.
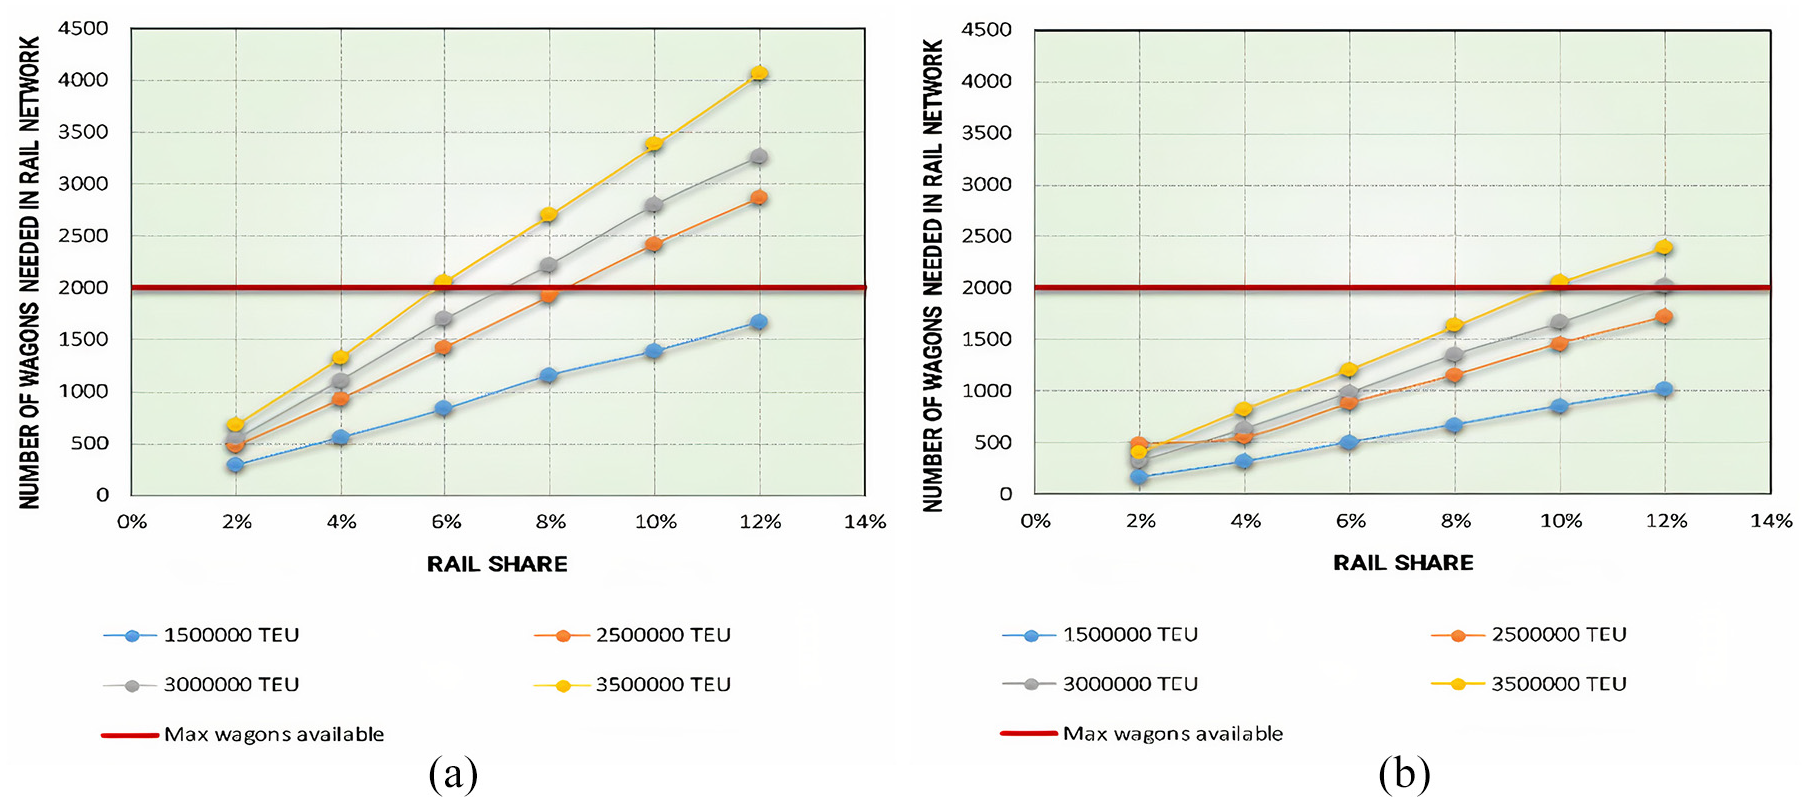
Number of wagons needed in railroad network for turnover of (A) 20 and (B) 12 days.
In Figure 6, where the horizontal and vertical axes represent the percentage of rail share and container operation, each point represents one of the scenarios in the far horizon, separated by dotted lines. Each dotted line shows the required rail terminals and the space needed for the rail terminal warehouse. The number of necessary terminals is calculated so that each new terminal has a capacity equivalent to the current terminal. In other words, the existing rail terminal is considered the unit for the construction of new terminals, and it is possible in the construction and operation phases that the number and capacity be changed as needed. Subsequently, with the increased share of rail up to 30%, the amount of container operations at rail terminals is higher than the nominal capacity of 750,000 TEU, which no longer meets the needs. Therefore, a new rail terminal must be constructed by calculating the future demand and part of the rail container operation to be transferred to the new terminal. In this situation, the number of required scheduled daily trains exceeds 12. The current rail container terminal with the existing equipment can only unload and load 12 trains per day, which indicates the need to deploy more unloading and loading equipment (reach stacker and RTG crane) to raise this capacity on each line. The number of low-sided wagons is not sufficient, and there is a need to buy a large number of wagons.
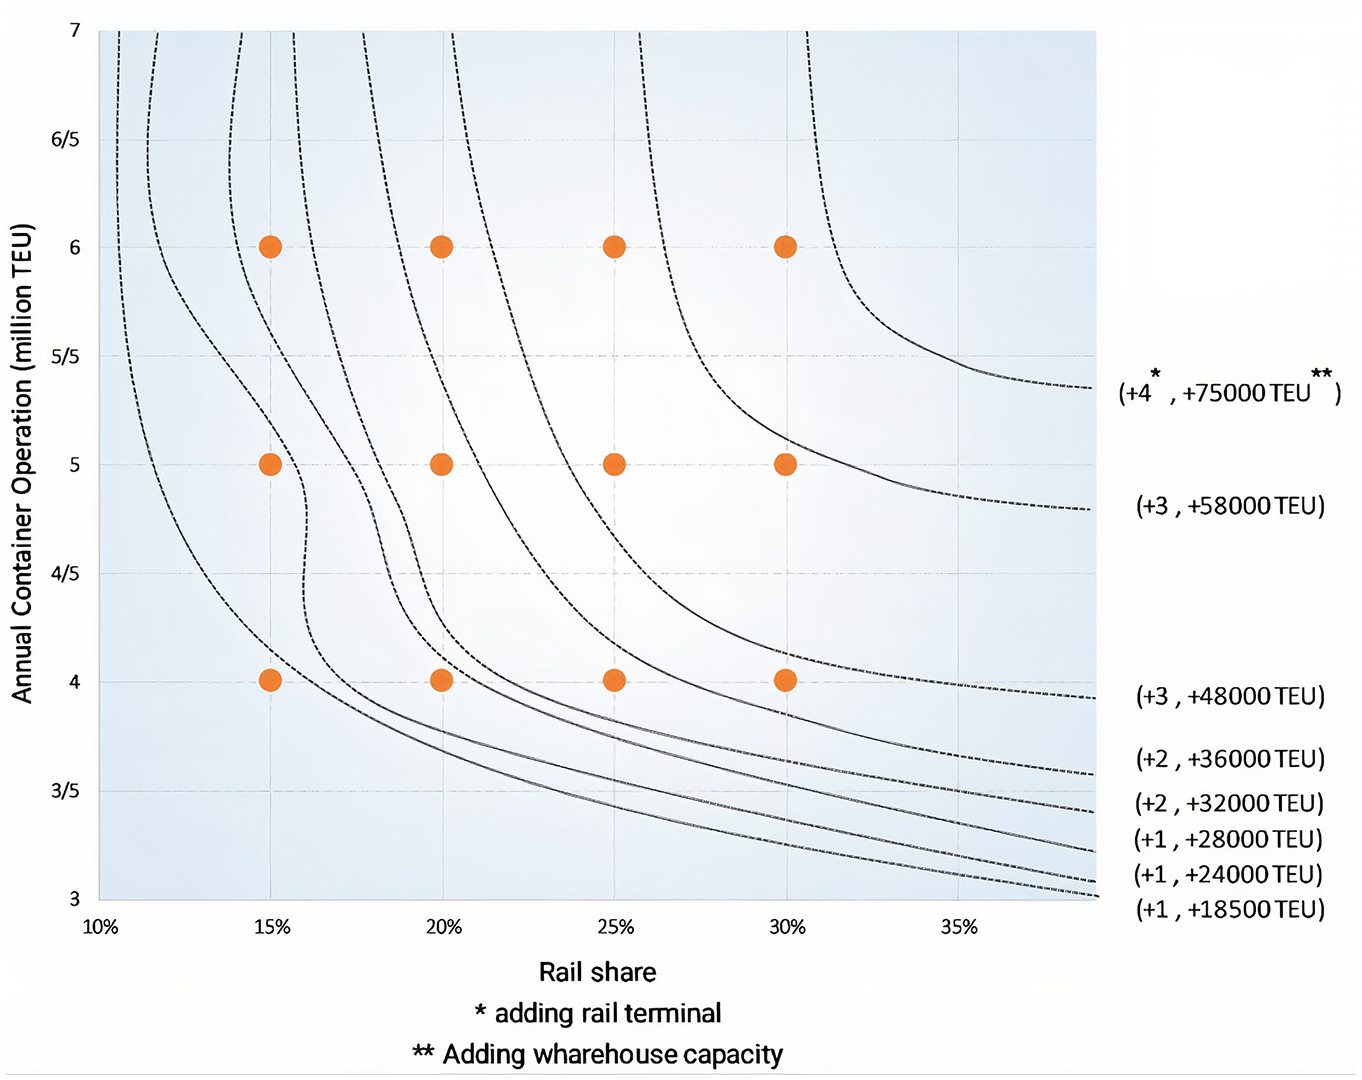
Far-horizon figure of possible scenarios.
Figure 6 shows that with the increase in the annual container operation volume in the far horizon to four, five, and six million TEU and the increase in the share of rail to more than 15% (15%, 20%, and 30%), the warehouse area is not sufficient for storing the containers inside the terminal with the capacity of 12,000 TEU, and there is a need to extend the site for more containers
4. Conclusion
According to the results, the implementation of two solutions, “TBL” and “construction of SRED,” have a significant influence on reducing the time and expense for the cargo owners and offer an incentive to attract customers to use the rail transport mode. The results also show the following.
The port can increase the share of rail up to 8% without spending on equipment or infrastructure.
In the near horizon, one of the most critical bottlenecks for the port is the operational capacity and warehouse of the rail container terminals, so that with only a one-quarter increase in the capacity of the rail terminal warehouse, we will see a 2% increase in the rail share capacity of the port.
Reducing the wagon turnover can reduce the need to purchase low-sided wagons by half.
On the far horizon, there is a need to purchase new equipment for unloading and loading, construction of new railroads, and even constructing a new terminal.
A large number of organizations are needed to involve to achieve the set goals in the share of rail freight from the port. The most important organization is the Railroad Company.
According to the results of this research, some suggestions are made for the Railroad Company as follows.
The predicted number of scheduled trains to be launched.
The rail weighbridge and X-ray to be purchased as required.
The movement of trains to be optimized to reduce the wagon turnover.
The wagons to be purchased and provided in the required number.
In this study, only the imported freight containers were investigated. Therefore, it is necessary to consider other cargo types, such as bulk, oil, mineral cargo, and export freights, as the current model’s development plans. It is also recommended to add optimization models to obtain local optimal solutions for each section. Recommended models are allocating gantry cranes at the berth, sorting containers in the container yards, and performing the port’s train maneuvering operation. We could use the data envelopment analysis models to compare the results of each one with the others. On the other hand, in future studies, all the existing road terminals in the port can be considered real and separated. The amount of container allocation to each terminal is included in the container handling calculations.
Footnotes
Acknowledgements
We would like to show our gratitude to all members of Transportation Systems and Logistics Lab (TSL), in particular Mr. Hamed Mehranfar, for sharing their pearls of wisdom with us in the course of this research.
Author Contributions
The authors confirm the paper’s contribution: study conception and design, M. Bagheri and M. S. Pishvaee; data collection, M. Sadeghi, analysis and interpretation of results, M. Sadeghi, M. Bagheri, and M. S. Pishvaee, draft manuscript preparation: M. Sadeghi and M. Bagheri. All authors reviewed the results and approved the final version of the manuscript.
Funding
The author(s) received no financial support for the research, authorship, and/or publication of this article.