
Abstract
Emergency department (ED) overcrowding is a well-recognized worldwide phenomenon which affects the quality of emergency care. A direct consequence of overcrowding is a long wait for visit and treatment of people who require primary care, possibly endangering the lives of critical patients. Healthcare management literature devoted to analyze ED operational policies is very wide, and many approaches have been proposed to address this important problem. However, less attention has been given to patient peak arrivals caused by the occurrence of some critical events which can strongly strain the operational efficiency of an ED. In this paper, we consider the particular case study of a medium-size ED located in a region of Central Italy recently hit by a severe earthquake, aiming at assessing the effects of such an occurrence on the ED operation. In particular, we propose a discrete event simulation (DES) model to analyze the patient flows through this ED, simulating unusual operational conditions due to a critical event, like a natural disaster, which causes a sudden spike in the number of patient arrivals. The availability of detailed data concerning the ED processes enabled building an accurate DES model and performing extensive scenario analyses. The model provides a valid decision support system for the ED managers in assessing specific emergency plans to be activated in case of mass casualty disasters.
1. Introduction
Emergency medical service (EMS) represents one of the most important healthcare services, considering that it concerns people’s lives. The recent survey paper by Aringhieri et al. 1 reports a comprehensive review on EMSs and introduces the novel concept of emergency care pathway (ECP). Following the new patient-centered approach that focuses on patients rather than caregivers, the ECP considers the whole healthcare chain, composed of several steps (namely the appropriate sequence of activities), aiming at growing patients’ safety and gratification. Relying on ECP, the entire emergency care delivery system is considered instead of single EMSs, thus enabling optimal allocation of the resources requested along the whole pathway. Of course, to this purpose, an effective interaction among ECP stakeholders is needed to guarantee timeliness and fairness of the delivered services.
Emergency department (ED) represents the entry point of the ECP, and its operational efficiency is fundamental for providing healthcare services to people who need urgent medical treatments. An ED is open 365 days a year and 24 h a day, and people with different urgency arrive requiring treatment. Since the services delivered by an ED are time-critical, the main issue concerns the response time. Unfortunately, the well-known and growing problem of overcrowding tends to enlarge the waiting times (WTs), endangering the life of critical patients. Today, the overcrowding is an international phenomenon widely considered in the specific literature.2–4 In particular, according to Hoot and Aronsky, 2 possible causes of overcrowding are insufficient staff, shortcomings of the structures, flu season, request of nonurgent treatments, and unavailability of hospital beds. Besides treatment delays, other possible consequences of overcrowding are reduced quality of the services, higher patient mortality, ambulance diversion, growing number of patients who leave without being visited, and greater expenses for the service provider due to longer patient stay. Moreover, negative issues due to overcrowding are greatly amplified whenever mass casualty disasters occur. In this case, the rate of patient arrivals suddenly increases and some different tactical and strategic decisions must be adopted to ensure timely treatments. It is worth noting that an overcrowded ED may have a negative impact on the downstream units, too. In fact, after treatments in an ED, patients who are hospitalized are transferred to an appropriate hospital ward, to the intensive care unit (ICU), or to the intermediate care unit, i.e, the step-down unit (SDU).5,6
In this paper we propose a DES-based approach for analyzing a particular case study: the operation of an ED of a medium-size hospital located in an Italian region where the recent earthquakes have put a strain on the EDs of the area. For such an ED, it is crucial to assess the impact of unusual/critical events which cause peak arrivals to design suited contingency plans. We study the effects of spikes in the number of patient arrivals on the ED operation. The availability of detailed data concerning the ED processes allowed us to build an accurate DES model, well reproducing the actual ED operating modes. After a complete input analysis and the accurate construction of a conceptual model, we implemented it by using ARENA 16 Simulation Software7,8 which is one of the most commonly used general purpose DES packages. Based on flowchart modules, it enables building the simulation model and performing input analysis, simulation runs, and output analysis. The model has been accurately verified and validated to guarantee that it is an accurate representation of the system under consideration. Several scenario analyses have been performed, aiming at evaluating the impact of possible changes in the ED operating conditions. We focused on assessing the main ED key performance indicators (KPIs) under different critical scenarios.
Patient peak arrivals can be of different patterns, and they seriously affect the ED operation. We experienced some artificial scenarios we have specially created trying to reproduce really occurred situations. The model we propose is very helpful for the ED managers both in the daily management of the resources and in the assessment of suited emergency plans to be adopted in case of critical events.
The paper is organized as follows: Section 2 reports some background material and a literature review. In Section 3, generalities on operating conditions of Italian EDs are briefly reported. Section 4 describes the case study of the ED we consider. In Section 5, we detail the DES model we propose, along with the input analysis and the model verification and validation. Section 6 reports results for the “as-is” status along with extensive scenario analyses, mainly focused on peak patient arrivals. Finally, some concluding remarks are included in Section 7.
2. Background
In the recent years, techniques from operations research have been frequently applied for tackling the problem of overcrowding of EDs. Since 2005, the National Academy of Engineering and the Institute of Medicine have highlighted the importance of using tools from operations research and systems engineering (statistical process controls, queuing theory, mathematical modeling and simulation) in healthcare delivery, to improve performance of care processes or units. 9
It is well known that complexity and high variability of the processes related to healthcare delivery in most cases make the application of standard techniques very difficult. Simulation is considered of fundamental importance for analyzing several healthcare settings (see, e.g., Reid et al. 9 and the several examples reported therein and Almagooshi 10 ). In particular, simulation models have been widely applied to EMS operations (see Aboueljinane et al. 11 for a survey). Several papers in the simulation literature are devoted to study the patient flow through an ED by means of discrete event simulation (DES) models11–18 and agent-based simulation (ABS) models.19–23 In particular, DES has been extensively used for studying causes and effects of ED overcrowding. We refer to Paul et al. 24 (and to the many references reported therein), and to the more recent paper by Nahhas et al., 25 for a review of simulation studies available in the literature devoted to the ED overcrowding phenomenon and for a discussion on the effectiveness of using DES models. Among the many papers which deal with ED overcrowding, we mention Wong et al., 17 where an ED in Hong Kong is simulated to assess how modifying the path of the patient clinical process and the level of resources affects the performance; Joshi et al., 14 where the simulation model is used to understand the process which allows shortening the WTs and the length of stay (LOS) by varying the workload among staff members and by giving nonurgent patients the possibility of returning afterwards; the many papers addressing the adoption of fast track systems in the ED, such as Kuo et al. 26 and Aroua and Abdulnour, 27 which propose to send less urgent patients to specific queues so that they receive the service early, and hence, they will be discharged earlier; Whitt and Zhang, 28 where an in-depth study on patient interarrivals and lenght of stay in an ED located in Israel is reported; and Daldoul et al., 29 where a stochastic model is considered to reduce the average total patient WT in a university hospital. From the wide literature on the topic, it clearly emerges that a study based on DES provides important insights into ED overcrowding. Moreover, since the management of ED resources strongly affects overcrowding, an optimal resource allocation is considered a key tool for achieving a good level of service and possibly reducing overcrowding (see the recent survey paper by Ahsan et al. 30 for a review on different analytical methods and modeling techniques used for improving patient flow through an ED by means of optimal resource allocation).
Furthermore, as well known, a simulation-based study can also be combined with optimization tools to determine which setting results the best, once one or more objectives (to be minimized or maximized) are defined. The resulting simulation optimization approach has also been applied in healthcare contexts (see, e.g., literture31–35 and the very recent systematic review 36 ) and in particular, in dealing with ED.37–40 For instance, in Guo et al., 39 a simulation model for the ED of a public hospital in Hong Kong is built and integrated with an optimization tool to find an optimal medical staff configuration to minimize the total labor cost, given the service quality requirement; in Diefenbach and Kozan, 38 the patient flow through an Australian ED is studied and optimized on the basis of bed configurations.
However, as far as we are aware, in the wide literature on ED management, few papers have been devoted to studying the specific topic considered in our paper, i.e., the effects of peak arrivals on an ED due to disaster or extreme events. First we mention the paper by Kadri et al., 41 which provides a characterization of different strain situations in an ED and introduces some “strain indicators”; moreover, a simulation-based decision support system is also developed to prevent and predict such situations. As regards papers more specifically devoted to ED peak arrivals caused by critical events, we refer to the paper by Gul and Guneri. 13 A literature review on ED simulation models for both normal and disaster conditions is reported in that paper; in particular, in their systematic classification covering 106 reviewed papers, the authors indicate only five papers devoted to ED simulation model applications during disaster conditions: Xia et al., 42 where the patient workflow through an ED located in Western New York during extreme conditions is studied; the aim is to reconfigure the workflow for improving the overall management of the patient flow. Patvivatsiri, 43 where the impact of a hypothetical bioterrorist attack on a medium-sized ED located in Texas is assessed. Al-Kattan and Abboud, 44 where the performance of an ED is evaluated under critical conditions due to a disaster and several scenarios for disaster recovery plans are examined; Joshi and Rys, 45 where different arrival patterns to an ED during a conventional terrorist disaster are considered along with an estimate of additional resources that would be required to accommodate all patients arriving to the ED. Cao and Huang, 46 where an “optimal scarce resource–rationing principle” for allocating scarce ED medical resources in natural disaster responses is sought. More recently, Gul and Guneri 47 and Gul et al. 48 studied disaster scenarios corresponding to a patient flow surge for EDs located in an earthquake area in Istanbul, Turkey. In particular, Gul and Guneri 47 developed a model enabling early preparedness of ED resources to overcome bottlenecks due to critical situations; Gul et al. 48 proposed a hybrid framework which uses artificial neural networks to estimate number of casualties and a DES model to analyze the effect of surge in patient arrival as consequence of a disaster in a network of five EDs located in a high earthquake risk region. All these papers dealing with the impact of disaster events on EDs use DES models to represent patient flow, highlighting the importance of such models to improve ED policies in these critical cases.
The current paper is placed in the workstream of references now cited, focusing on a medium-size ED located in a high seismic risk area for which a prompt response in case of earthquake is crucial. Besides representing an effective decision support system for the ED managers, our model can be successfully used to properly design the plan to be adopted in case of critical emergencies that recent Italian laws have made mandatory for every ED. Moreover, besides assessing KPIs of interest for mildly and extremely loaded scenarios, in our experimentation, we also focus on evaluating the instantaneous usage of the ED resources. The latter is not properly a performance measure, but ED managers deemed such information very useful to possibly design different resource allocations during mass casualty disasters.
3. Generalities on EDs and Italian guidelines
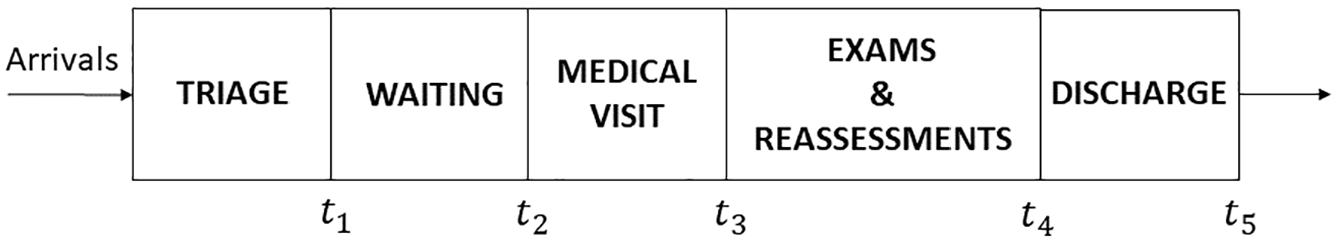
The ED consists of two categories of stakeholders: care providers (physicians and nurses) and patients needing a specific care. Moreover, there are physical resources, such as beds, machineries, stretchers, and so forth, necessary to host and visit patients during their stay. Each patient arrived to the ED goes through different clinical paths. This flow comprises several steps which generally consist in the triage, whose aim is to assign an urgency code to every patient, medical visits, examinations, reassessments, and, finally, the leaving of the ED, with diverse kinds of discharge.
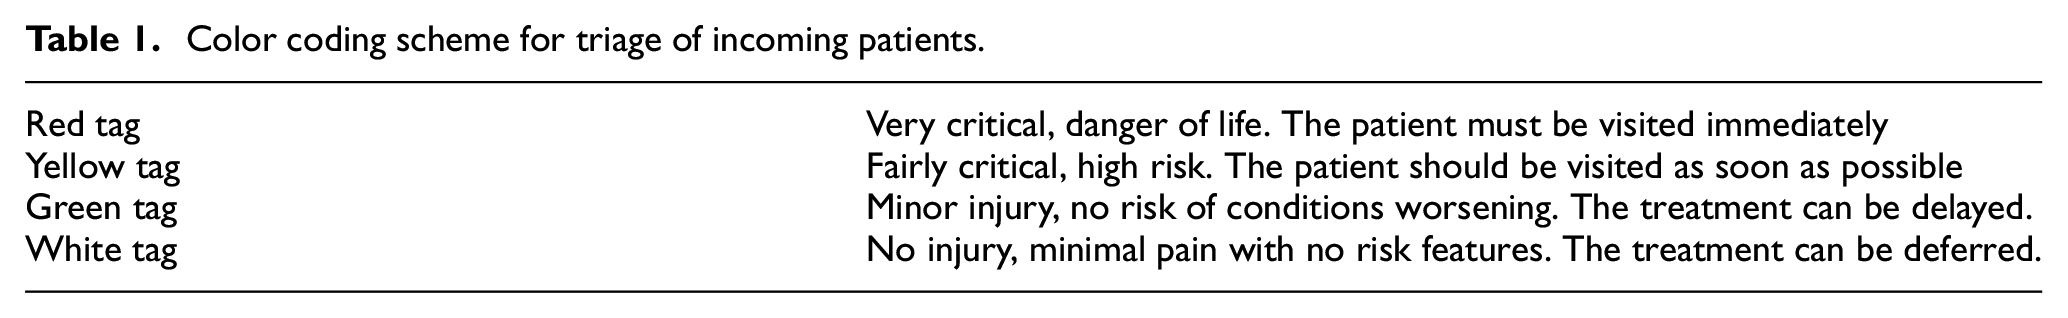
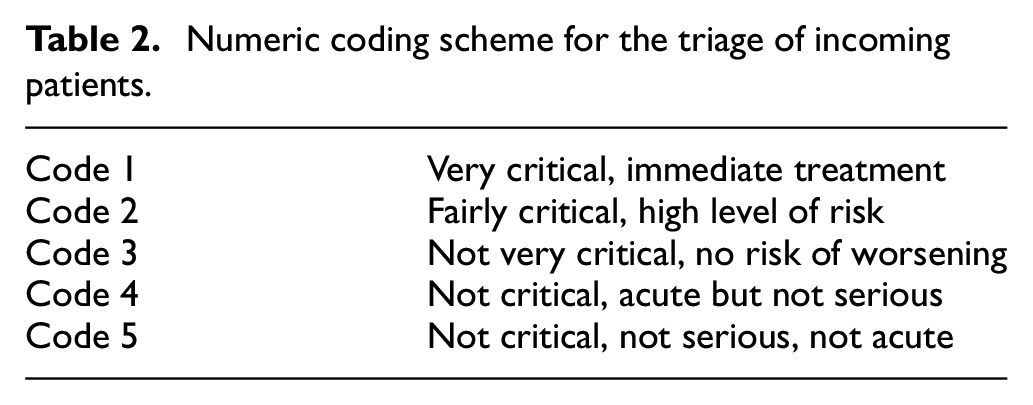
As a first step, a triage tag is assigned to every incoming patient, to determine the priority of treatment. Different systems of classification are usually adopted. The most commonly used scale in Italy is reported in Table 1. Moreover, in some regions, a blue tag is also used as intermediate case between green and yellow tags. In some countries, more fine-grained (sometimes numerical valued) scales are adopted. To guarantee more appropriate clinical paths and following the main current international scientific evidence, the Italian Ministry of Health is going to adopt new guidelines. They are based on a new triage which considers five numerical urgency codes49,50 as detailed in Table 2. This classification closely resembles the Emergency Severity Index (ESI) adopted in the United States, which is based on an algorithm that rapidly yields grouping of patients into five classes, as described in Gilboy et al. 51
Color coding scheme for triage of incoming patients.
Numeric coding scheme for the triage of incoming patients.
After assigning the triage code, the more appropriate Diagnostic-Therapeutic Care Path (DTCP) is activated. In particular, a patient can be sent (1) to an ED room, (2) to outpatient facilities, (3) toward a “Fast Track,” and (4) to the “See and Treat” service. The fast track and see and treat are novel services recently introduced to reduce the WTs, the LOS in the ED, as well as the percentage of patients who leave without being seen (LWBS). The patients directed to ED rooms follow different clinical pathways which include medical examination and diagnostic tests up to the definition of the outcome. The patient flow inside ED rooms is very complex, due to the many and different specific needs (often even difficult to identify in a short time) and the high variability of medical conditions of the incoming patients. Moreover, the flow is also strongly affected by the availability of the resources such as staff on duty, number of rooms and machinery dedicated to different services, capacity of holding areas, and beds for hospitalization.
The ED process is usually characterized by the following outcomes: discharged home with reliance, if necessary, on territorial structures which provide control at outpatient facilities; hospitalization at an hospital ward (if a bed is available) or transfer to another hospital; admission to the short stay unit (SSU) (whenever such unit exists). The SSU is an inpatient unit attached to the ED, managed under the clinical governance of the ED staff, designed for the short-term treatment, observation, assessment, and reassessment of patients. When a patient is discharged at the end of the clinical pathway, a physician assigns an exit code corresponding to the outcome.
Unfortunately, very frequently, the great number of incoming patients leads to overcrowding of an ED, which is a worldwide phenomenon and it is well perceived by the stakeholders: long patient WTs before the medical examination, excessive number of patients in the ED, and high percentage of patients who LWBS are clear indications of such problem. To give a formal assessment of the degree of overcrowding, some measures have been proposed. They enable monitoring the state of the ED, describing the current situation, and they can also work as alarm bells to avoid reaching a critical level. The most commonly used are the Real-time Emergency Analysis of Demand Indicators (READI), the Emergency Department Work Index (EDWIN), the Work Score, and the National Emergency Department Overcrowding Scale (NEDOCS). They are continuous valued indicators computed on the basis of some operational variables which enable us to quantify the degree of overcrowding of an ED (see Hoot et al. 52 and the references reported therein for the definition of these methods of measurement). However, the study reported in Hoot et al. 52 showed that none of these measures actually provides a reliable predictive analysis at a low percentage of false warning.
To analyze (and to possibly prevent) the overcrowding phenomenon, it is necessary to detect the time spent by the patient inside the ED, during the different phases of the whole process. To this aim, novel Italian guidelines recommend monitoring the times of the clinical pathway in relation to the assigned priority codes. In light of these guidelines, a great interest is shown by the ED managers in tools which enable performing scenario analysis, like those provided by DES. The aim is to assess how the main KPIs change after possible redesigning of ED patient flows and changing of the model of care.
A great and increasing interest concerns the use of simulation modeling for studying the impact of patient arrival surges caused by some disaster. The related Italian guidelines state specific measures to be adopted to efficiently tackle such situations. In particular, the so-called “Internal Emergency Plan for Massive Inflow of Injured” (in Italian, Piano di Emergenza Interno per il Massiccio Afflusso di Feriti (PEIMAF)) has been issued in recent years. In this plan, different critical levels have been provided, and suited operative measures are indicated to reallocate ED human and physical resources, whenever it is activated due to critical events. Moreover, low-complexity patients can be addressed to outpatient facilities to enable the ED staff to timely deliver the most urgent treatments. The application of such an emergency plan occurred in Genoa, Italy, on 14 August 2018, when Morandi’s Polcevera viaduct collapsed, causing 43 deaths and many injuries and, more recently, in many Italian EDs for the maxi-emergency due to COVID-19 pandemic.
4. The case study: the ED of the“E. Profili” Fabriano hospital
In this section, we detail our case study concerning the ED of the “E. Profili” Fabriano (Ancona) hospital. This hospital is located in the Italian region of Marche, and the catchment area covers about 48,000 inhabitants. Every year, about 27,000 patients arrive at ED requiring medical assistance; hence, it can be considered of medium size. A detailed understanding of the ED operation was gained through the process mapping we performed assisted by the ED staff. In the sequel, we report a brief description of the ED rooms and staff; moreover, we summarize the patient flows through the ED. This ED is composed by
A triage area, where a nurse assigns the color tag at each incoming patient and it can host one patient at a time;
A waiting room where patients queue for the triage and (after the triage) they wait for the medical examination;
Three areas for medical treatment:
Area A: the shock room for red tagged patients;
Area B: the room for green and white tagged patients;
Area C: the room for yellow tagged patients.
A holding area;
An SSU.
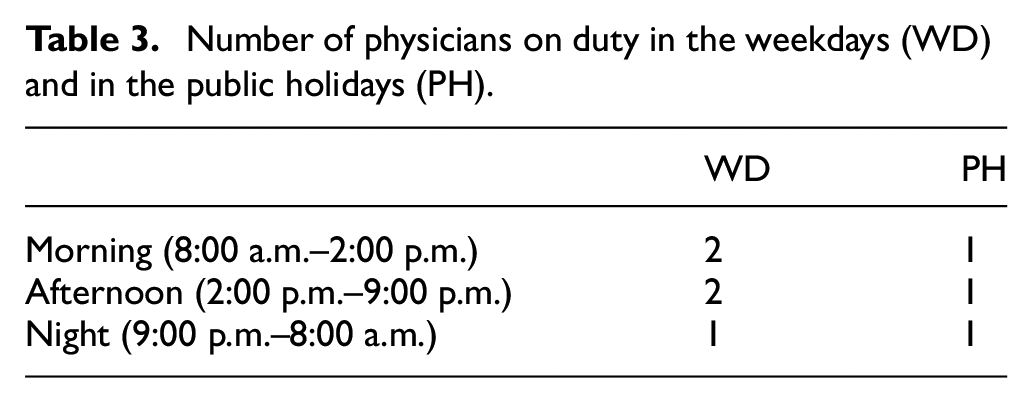
As regards the areas for the medical treatment, Area A (the shock room) is the most equipped one, and two critical patients can be hosted simultaneously. In Area B and in Area C, one seat is available. During the night (9:00 p.m.–8:00 a.m.), only Area A and Area B are in operation, so that also yellow tagged patients are visited in Area B. As regards the ED staff, physicians and nurses are on duty according to the shifts reported in Tables 3 and 4.
Number of physicians on duty in the weekdays (WD) and in the public holidays (PH).
Number of nurses on duty each day.

As regards the patient flow, arrivals are by ambulance or autonomously. After the registration at the check-in desk, all the incoming patients are admitted to the triage area where a nurse collects patient’s health information and assigns the color tag. Critical patients arriving by ambulance are directly transferred to a medical area for immediate treatment, without going through the triage area. After the triage, a patient waits for the call in the waiting room where the estimated WT is displayed on a screen. Then the patient is transferred to an appropriate area inside the ED for medical visit according to the assigned color tag. In severely urgent cases (red tags), the patient is examined in the shock room (Area A) for possible immediate treatments. In less severe cases, physicians, after performing health assessment, decide the clinical pathway which must be followed by the patient, possibly changing the color tag assigned at the triage. The pathways can be very differentiated on the basis of the acuity of patient’s illness. In many cases, the physician requires additional examinations for the patient (e.g., clinical laboratory tests, X-ray, electrocardiogram). In other cases, patient is transferred to the SSU for a short observation. Moreover, patients with less serious illness and single specialist relevance are assigned to the fast track service, namely a specific area of the ED provided by a multidisciplinary team, where timely patient treatment and discharge are ensured.
Physicians and nurses are shared among all the areas of the ED, including the reassessment area, and they move among different areas based on needs. One physician and one nurse manage the visit and the treatment of one patient. If a red tagged patient arrives and all the physicians on duty are busy, the less urgent patient treatment (corresponding to the less severe priority tag) is interrupted for immediate treatment of the red tagged patient. The less urgent treatment is then resumed at a later time. Note that this “preemptive-resume” service scheme is adopted only in the case of red tagged patient arrivals; in the other cases, patient join a waiting queue. A similar scheme is adopted for nurses, to guarantee immediate treatment of red tagged patients.
Whenever additional examinations are requested, patients are brought to specific laboratories. When the related diagnostic reports have been issued, a reassessment of the patient is performed by the physician, who can require further examinations and/or an additional observation period. At the end of the pathway, the final diagnosis is delivered and the patient is discharged from the ED. When a patient is discharged, a physician assigns an exit code corresponding to the outcome, to identify the patient’s clinical severity level. Furthermore, a detailed description of the outcome must be issued. The outcome is encoded according to the following list:
O1: patient is discharged home;
O2: patient is discharged home with reliance on outpatient facilities or family physician;
O3: patient is hospitalized at an hospital ward;
O4: patient is transferred to another hospital due to bed unavailability at the appropriate ward of the hospital;
O5: patient refuses hospitalization and leaves the ED despite the medical request;
O6: patient leaves during examinations, i.e., the patient does not complete all the required tests and abandons the ED without informing the staff;
O7: patient leaves without being seen, i.e., the patient abandons the ED waiting room before being examined by a physician (LWBS);
O8: patient dies during the stay at the ED;
O9: patient has arrived deceased to the ED.
To perform a complete process mapping of the ED, many interviews have been carried out to the staff (physicians, nurses, managers) and direct observations took place. Moreover, all the available data concerning patient flow during February 2018 have been anonymously collected. We chose February because, according to interviews to the ED staff, it is one of the most representative months regarding the functioning of that ED. It is in fact a month that includes requests related to the winter season, not affected by holidays (such as December and January), thus reflecting a standard workload of the ED of that period. If data were available over several months, our current model could be easily extended to take into account different seasonal patterns. However, our work is focused on the effect of a sudden peak of the patient arrival rate which can intervene at any time of the year, overlapping the standard patient arrivals of that time. Especially in the extremely loaded scenario described in Section 6, actually if the sudden increase in the arrival rate considered is very large, we expect the results to be slightly affected by changes in the standard patient arrival rate due to seasonality.
From 00:00 of February 1 to 23:59 of February 28, 2018, the overall number of patients arrived to the ED is 2046. The timestamps recorded are reported in Figure 1. They have been extracted and organized in a suited database. Note that, since the holding area and the SSU are not subject of our study, these two units of the ED are not specified in our model, and hence not represented in Figure 1. In Table 5, we report the number and the percentage of color tags assigned at the triage on arrival. Moreover, we also report in Table 5 the number and the percentage of color tags on discharge. As already noticed, in some cases, at the end of the clinical pathway, the patient tag can be different with respect to that assigned at the triage, since it can be changed by physician during the visit. In the same table, the percentage of patient leaving without being seen, for each triage tag, is reported. Finally, the number and the percentage of deceased patients is included in the table, too. For the sake of brevity, we do not report a table with all the tag changes, but by observing Table 5, it is clear that some color tags are changed to another tag (always an adjacent tag).
Collected timestamps for the ED process.
Number and percentage of color tags assigned at the triage at incoming patients (Columns 2–3), number and percentage of color tags on discharge (Columns 4–5), and percentage of patients LWBS (Column 6).
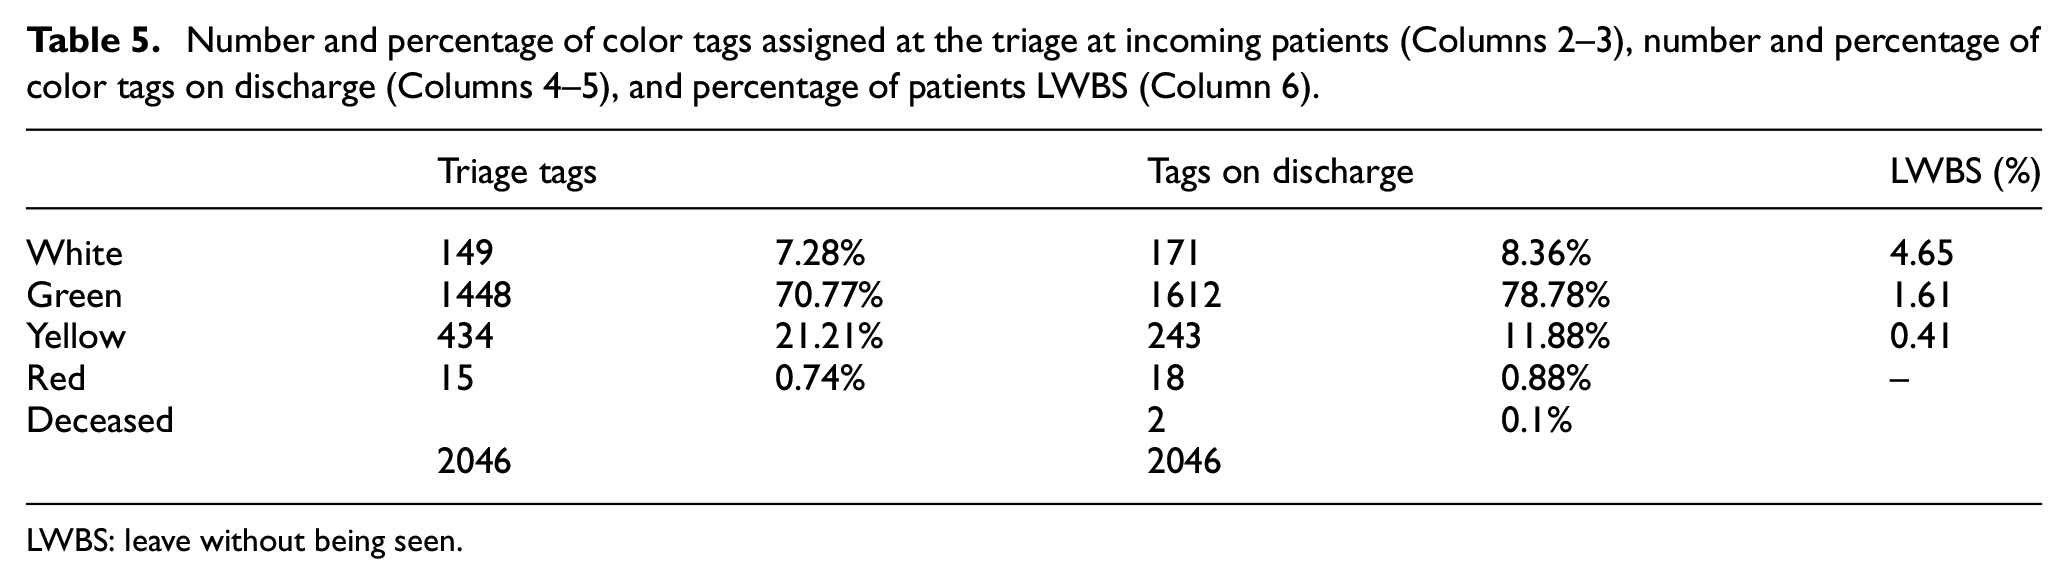
LWBS: leave without being seen.
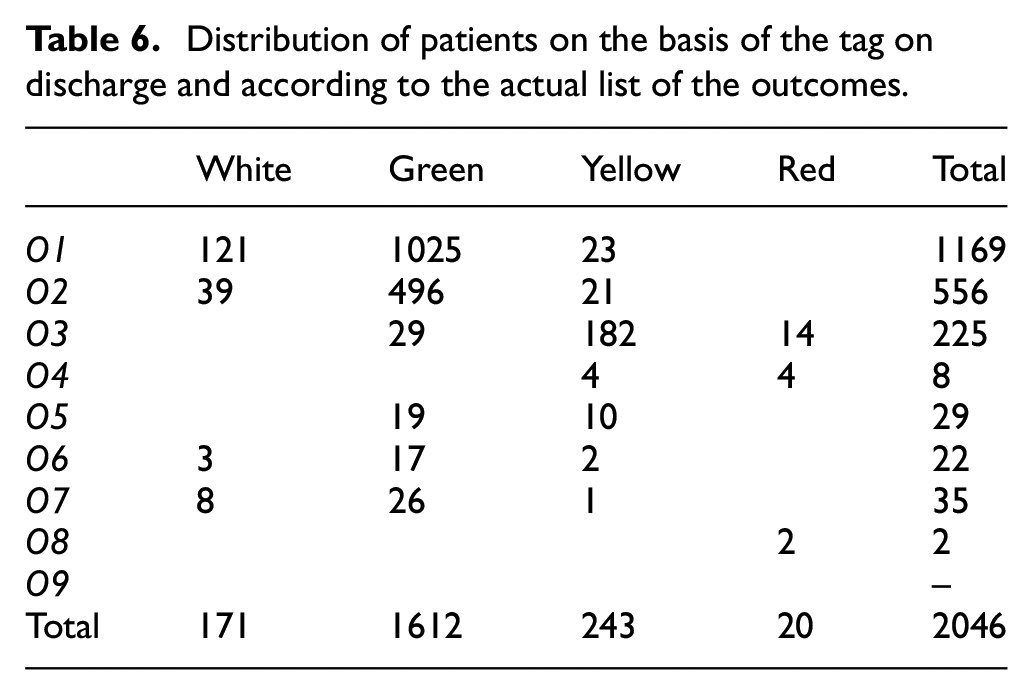
In Table 6, we report the distribution of patients on the basis of the tag on discharge and according to the list of the outcomes.
Distribution of patients on the basis of the tag on discharge and according to the actual list of the outcomes.
5. The DES model
In this section, we detail the DES model of the ED under study described in Section 4. As regards the structure of the model, each area for medical treatment (Area A, Area B, Area C) is represented by a submodel grouping the related modules; the triage area is represented by a process with a single server and a single queue and the waiting room is handled as a queue with priority (with infinity capacity).
The model entities are patients: an entity is created on patient arrival, and then, it flows through the different segments of the model according to specified logical rules, enabling us to reproduce the proper patient flow. The resources are physicians, nurses (whose availability is based on the schedule in Tables 3 and 4), and the seats at each ED area (fixed capacity resource).
A brief description of the flows through the model is the following: as soon as an entity is created, a check is performed to verify if the patient arrived deceased (Outcome O9); in this case, the entity is removed from the model. If an entity represents a critical (red tagged) patient arriving by ambulance, then it is directly sent to the shock room (Area A) for immediate care and the corresponding resources (one physician, one nurse, and one seat in the area) are seized. A preemptive-resume priority service scheme is implemented to model ED staff behavior when a red tagged patient arrives, and all physicians and/or nurses on duty are busy. Indeed, in this case, the treatment of a lower priority patient must be interrupted to release resources needed for immediate treatment of the red tagged patient.
An entity corresponding to not critical patient undergoes the triage process and receives a color tag as entity attribute. Then, the entity joins the queue of the waiting room, waiting for the visit. During the wait, an entity may possibly leave (Outcome O7). Entities waiting for the visit are selected from the queue on the basis of the priority (the color tag), and first-in, first-out (FIFO) criterion is used within each priority class, i.e., for entities with the same color tag. At the beginning of the visit, one physician, one nurse, and one seat in the corresponding area are seized. The duration of the visit is assigned by the probability distributions reported in Table 7, depending on the entity color tag. During the visit, the DTCP for the patient is decided, possibly changing the entity color tag assigned at the triage. A change of the color tag implies that the entity will be handled as a new-color tagged entity in all the downstream modules. After the visit, an entity can be sent to many different segments of the model. In less severe cases, an entity leaves the system (the patient is discharged) for Outcomes O1 and O2.
Probability distribution of visit times and additional examinations and reassessments times.
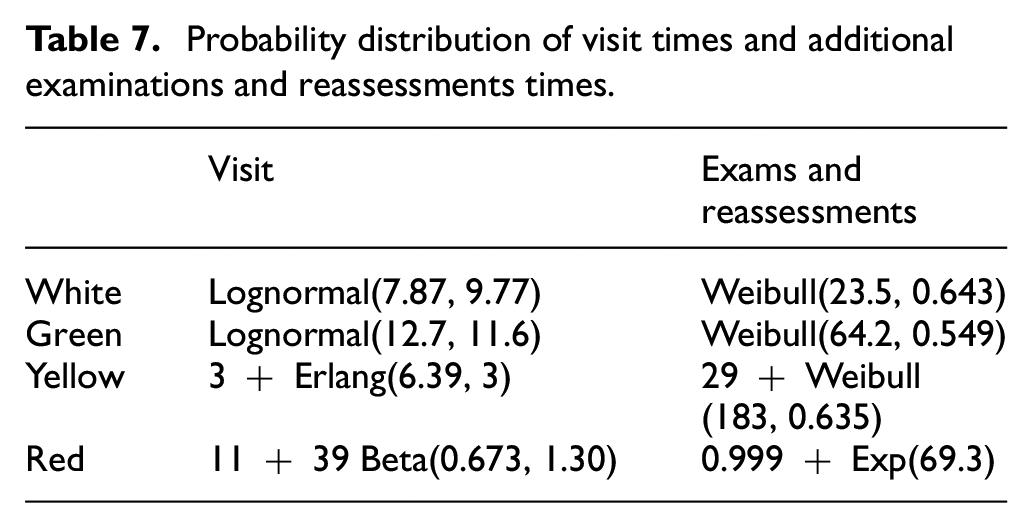
The phases following the visit are additional examinations and reassessments. In our model, they are represented by a single process whose overall service time is given by means of the probability distributions reported in Table 7. Note that all possible further treatments are considered in this module since the service time also includes duration of all treatments and reassessments after visit. At the end of the DTCP, the entity is discharged from the system model, according to the proper outcome.
In this summary description, for the sake of brevity, a number of specific issues implemented in our model are not reported. In fact, in our model, we also take into account some details we have become aware of by interviewing ED personnel, e.g., the setup times needed for environmental sanitation of the ED areas at the end of each visit. Moreover, note that the choice of using a single process module to represent additional examinations and reassessments is motivated by the availability of only timestamps
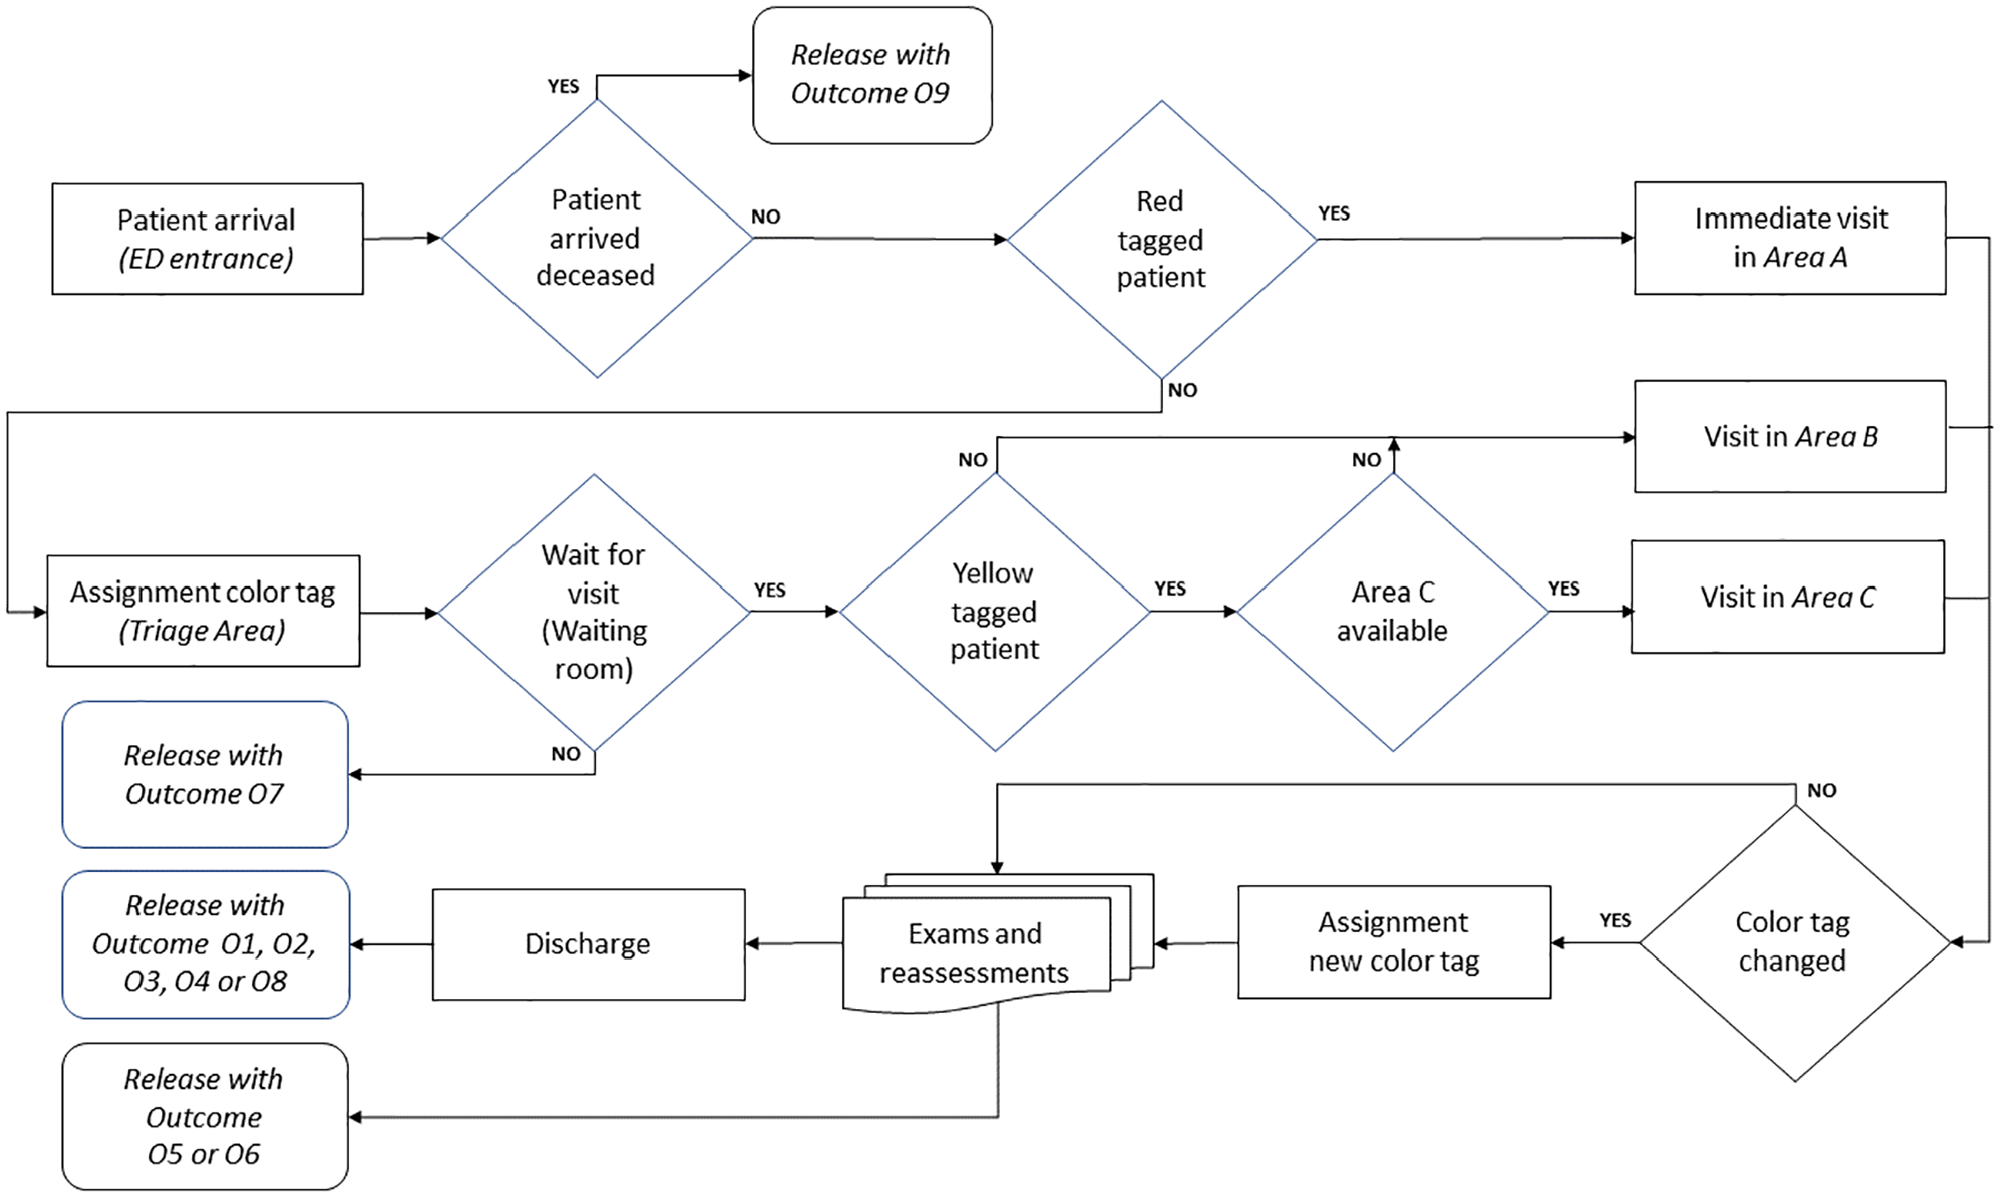
Conceptual representation of model process flow. Release with Outcome O5 or O6 in the “Exams and reassessments” block is possibly expected only for white, green, and yellow tag patients.
As regards the KPIs of interest, to meet specific demand of the ED managers, we focus on the analysis of the patient flow starting from the end of the triage and, in particular, in monitoring, for each color tag,
The waiting time (
The total time (
These indicators are very similar to “door-to-doctor time” and “door-to-disposition time” metrics used in literature53,54 with the only difference that triage time is not included in WT and TT. As already mentioned, this choice is motivated by the practitioners’ request of focusing on all the processes following the triage phase. But, on the other hand, triage is usually carried out as soon as patient arrives and triage duration is usually negligible with respect to waiting and treatment times. Therefore, similarly to door-to-doctor time, waiting time WT is a very important component of ED throughput, having strong implications with the percentage of patients who LWBS. 55 Moreover, even if a discussion on the quality of care and the patient satisfaction cannot be carried on due to lack of the related data, it is worthwhile noting that a long WT could possibly lead to compromising the quality of care. On the other hand, from a service quality point of view, certainly WT significantly affects patient satisfaction.
As concerns the total time TT, even if it does not coincide with LOS (since the initial part of the pathway until the end of the triage is not considered), it represents the most significant component of ED throughput, thus being mostly responsible for the ED crowding.
5.1. Input analysis
Input analysis is based on real data concerning the ED collected during February 2018, as reported in Section 4. The data were used for a detailed input analysis of all the processes in the ED, namely the patient arrival process and the processes related to visits and additional examinations and reassessments.
Patient arrival process to an ED has been widely studied in the literature. A proper nonstationary process must be considered to reproduce such time-dependent arrival process, and the standard assumption adopted is that the arrival process to an ED can be modeled as a nonhomogeneous Poisson process (NHPP).15,18,28,37,39,56–58 In fact, as well known, NHPP has nonstationary increments, and this makes the use of NHPP suitable for modeling patient arrival process, which is usually strongly time-varying. Then, statistical tests are applied to data to check that NHPP hypothesis holds. This is typically performed by assuming that NHPP has an approximately piecewise constant rate.
In our case study, to obtain a good accuracy of the arrival rate, and following the usual approach proposed in literature, we consider 24 time slots for each day at an hourly basis, starting from 00:00. A plot of the hourly arrival rate for each day of the week obtained from the collected data is reported in Figure 3. It shows a within-day and day-to-day variation in the number of arrivals. In particular, the maximum value of the hourly arrival rate is attained on Monday, while Sunday is the day with the least number of arrivals. Moreover, a slight increasing trend in the daily arrivals peak is observed from Tuesday to Saturday. We used the Kolmogorov–Smirnov statistical test applied to each 1-h interval as a goodness of fit test. Note that, recently, a more sophisticated technique which considers not equally spaced intervals has been proposed in the paper 58 by De Santis, Giovannelli, Lucidi, Messedaglia, Roma, but we have not considered it here. On the basis of these considerations, we estimate the arrival rate on hourly basis and by distinguishing among the different days of the week.
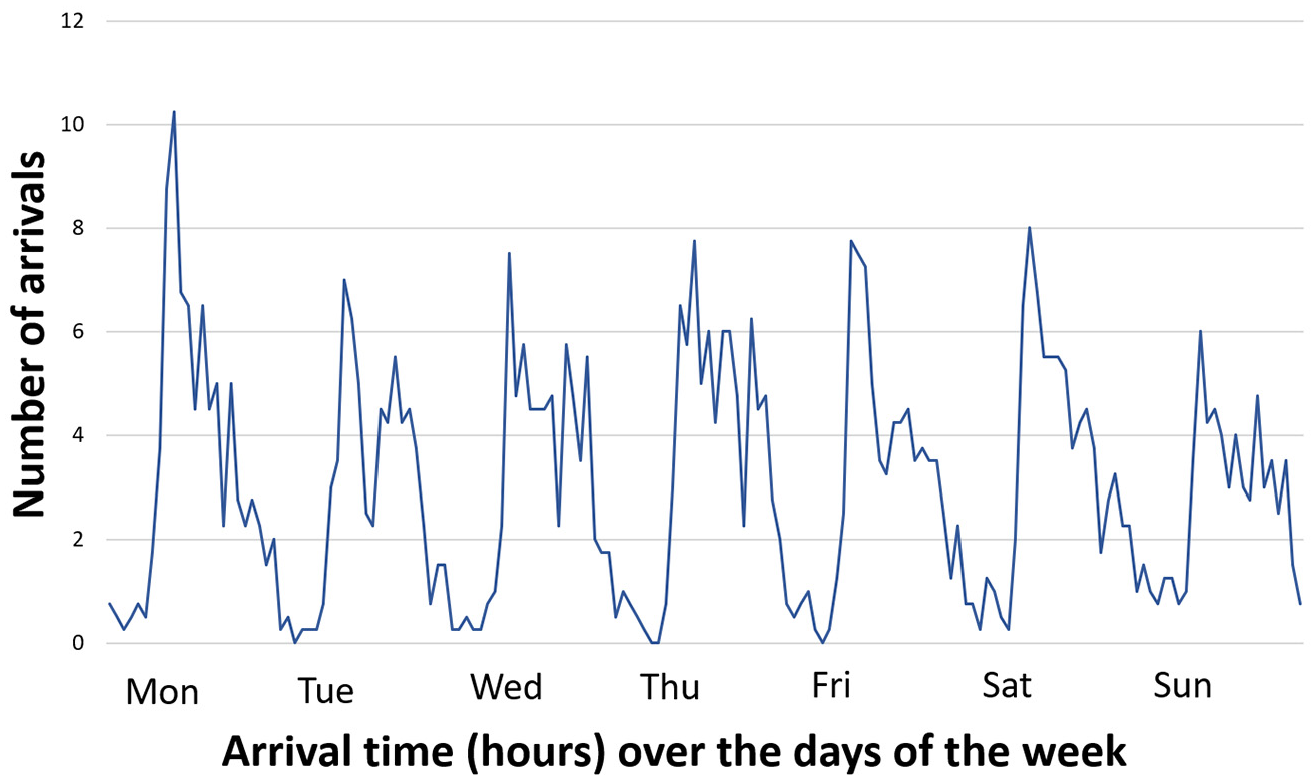
Hourly arrival rate over the days of the week.
As regards the timing employed in the visit process and in the additional examinations and reassessments process, we used the collected data to obtain the probability distribution of such times. To this aim, we used standard statistical procedure (see, e.g., Chapter 6 of the book by Law 59 ). Namely, based on summary statistics and histograms of the real data, we first hypothesized families of distributions that might be representative, and then, we performed parameter estimation. Finally, we used the Kolmogorov–Smirnov goodness of fit test for assessing whether the data are a sample of the particular probability distribution hypothesized. The obtained probability distribution of visit times and additional examinations and reassessments times (in minutes) are reported in Table 7 for each color tag.
5.2. Model verification and validation
To guarantee that the DES model we built provide us with sufficient accuracy of the output, the model has been widely verified and validated by using standard techniques. In particular, after a preliminary debugging, we ran the simulation model under several different settings of the input parameters, accurately checking its functioning and observing the output of each run, to determine whether all the logical paths have been correctly implemented. Model trace has been also used for a deepened verification of the model.
As regards the model validation, we compared the real system values with the corresponding simulation outputs, namely the average values (with their confidence interval) obtained from 50 independent simulation replications, each of them 35 days long, with a warm up period of 7 days. In this way, we can perform a fair comparison with data which refer to 28 days of February. In particular, we consider some fundamental KPIs of the overall process in terms of times and entity counters.
As concerns KPIs related to process times, we focus on the waiting time WT and on the total time TT previously defined. In Figures 4 and 5, we report the current values, namely those corresponding to the “as-is” status, and the simulation output of WT and TT (in minutes) with the relative confidence interval (with 95% confidence level).
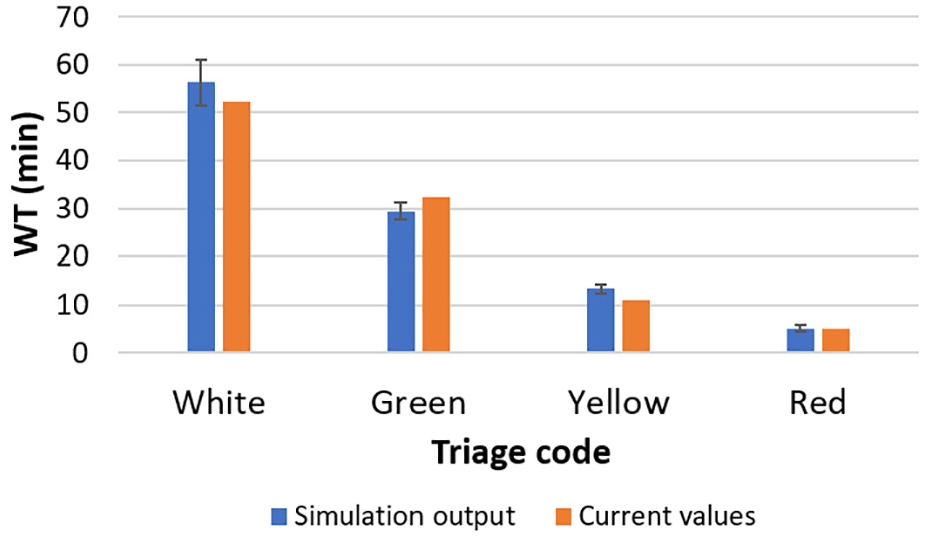
Current values (in orange) and simulation output(in blue) of WT (in minutes) with the confidence interval.
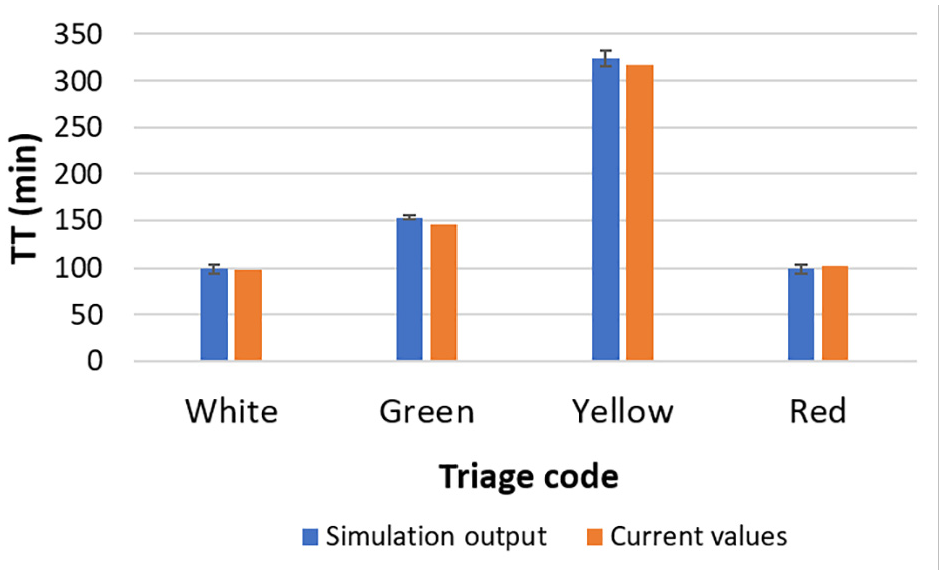
Current values (in orange) and simulation output(in blue) of TT (in minutes) with the confidence interval.
These plots evidence that the simulation output is a good approximation of the real system values since for each color tag, the current values are either within the corresponding confidence interval or close to it.
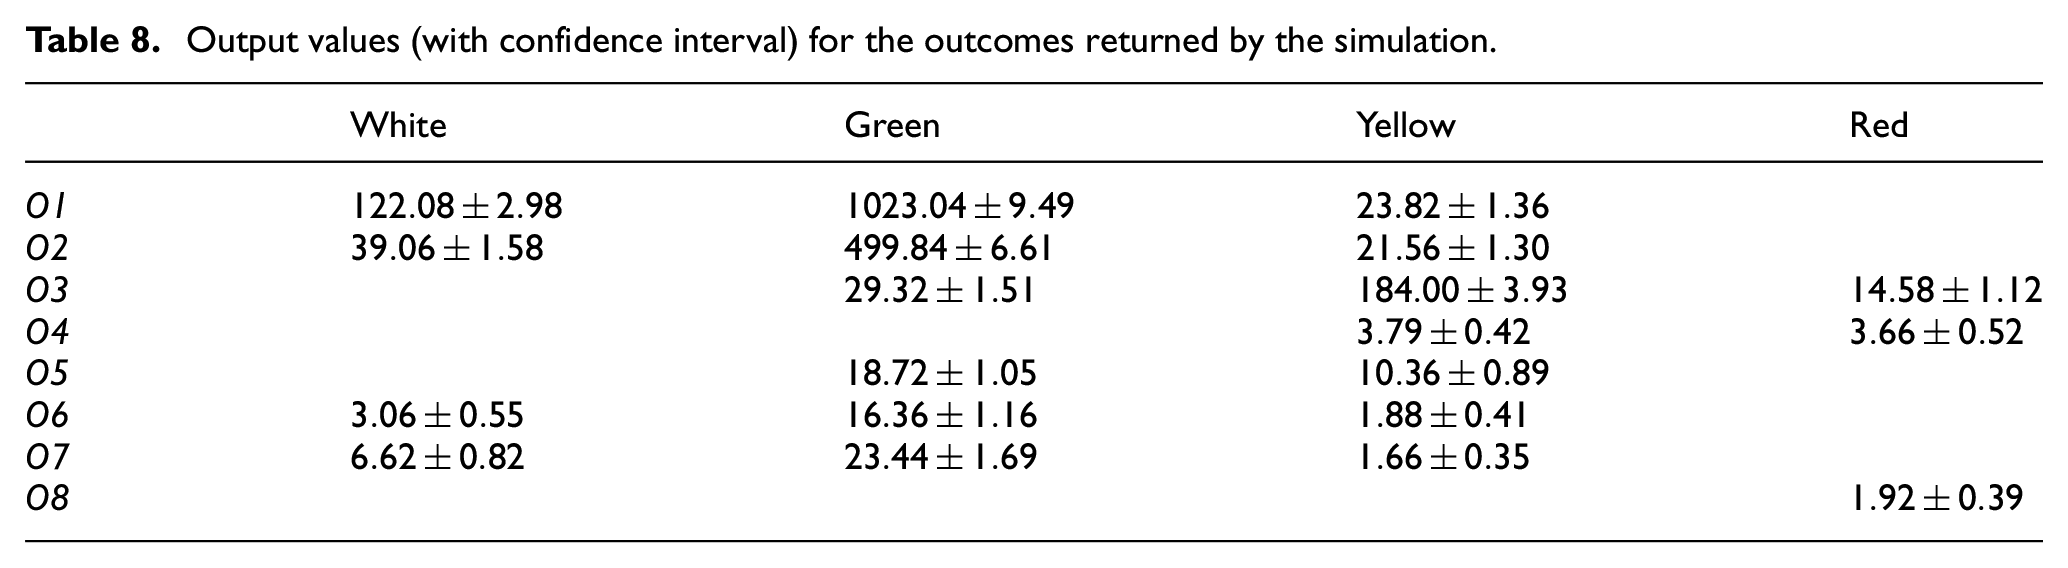
As regards the entity counters, we compare the current values of the outcomes as reported in Table 6 with the corresponding outputs of the simulation model reported in Table 8 (for the sake of brevity, we do not report the corresponding plots). A comparison between the two tables clearly evidences that the simulation model shows a good accuracy in representing such average values. In fact, the model output values corresponding to each outcome and to each color tag are an accurate approximation of the current values, taking into account the confidence interval.
Output values (with confidence interval) for the outcomes returned by the simulation.
The previous paragraphs evidence that our simulation model provides an accurate representation of the actual system. As last step needed to validate the model, we showed the obtained results to ED personnel, acquiring important feedback and assessments.
6. Design of experiments and results
In this section, we report experimental results obtained by our DES model. Our aim is to determine performance measures of the ED, to evaluate the impact on the ED of patient peak arrivals due to a critical event. To this aim, we consider hypothetical scenarios where patient arrival rate is artificially changed. In particular, we preliminarily consider an increase of a prefixed percentage of the arrival rate due to the growth in demand. Then, we analyze a mildly loaded situation, namely a gradual increase of patient arrivals over a period of few days of the week. Finally, we turn to the main focus of this work, namely extremely loaded situations, possibly due to some critical conditions, for instance, a natural disaster.
In our implementation, we use an ARENA built-in tool 8 to generate entity arrivals according to a nonstationary Poisson process with a varying rate, so that we can easily modify the arrival rates corresponding to different scenarios.
It is important to highlight that in our experimentation, we adopt the standard assumption that the service rate of ED personnel is unmodified during the patient peak arrivals. However, recent studies showed that ED physicians and nurses could increase their service rate or adopt some particular strategies in case of increased workload. Some examples are multitasking techniques, 60 “early task initiation” 61 (where an upstream stage initiates tasks that are usually handled by a downstream stage), and other techniques consisting in adaptive response mechanisms to cope with critical situations emerging when treatments’ requests exceed the normal capacity. Since the service rates are parameters of our model, they could be easily modified. However, we do not consider here an analysis involving service rate increase or the adoption of other adaptive techniques, since we have no information about these possible changes for the ED subject of our study.
In our experimentation, we assess how the ED response changes in each considered scenario. In particular, we consider the KPIs of interest defined in Section 5, i.e., the waiting time WT and the total time TT. Moreover, we monitor the resource utilization focusing on the usage of Area B and Area C. In the literature on ED management under disaster conditions,
48
utilization of ED resources and, in particular, utilization of treatment areas and medical staff are considered among the main indicators for evaluating the impact of a hypothetical critical event and for determining the appropriate resource and staff levels to cope with a disaster scenario. Note that, for an ED under normal conditions and for any general queuing system, the use of such an indicator could be questionable, since there are two conflicting viewpoints: from one side, service managers aim at maximizing the resource utilization (for economical reasons); on the other side, service customers are penalized by such behavior that may cause deterioration of the service quality and possibly long queues. More specifically, in our experimentation, we monitor the resource usage as
6.1. Increase of a prefixed percentage of the arrival rate
We consider an increase of
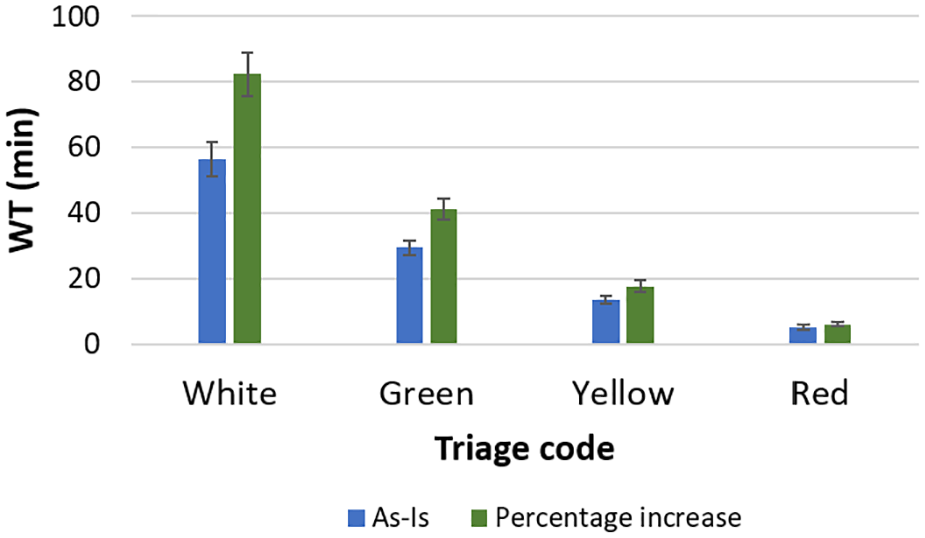
WT (in minutes): comparison between the current “as-is” status (in blue) and a prefixed percentage increase of the arrival rate (in green).
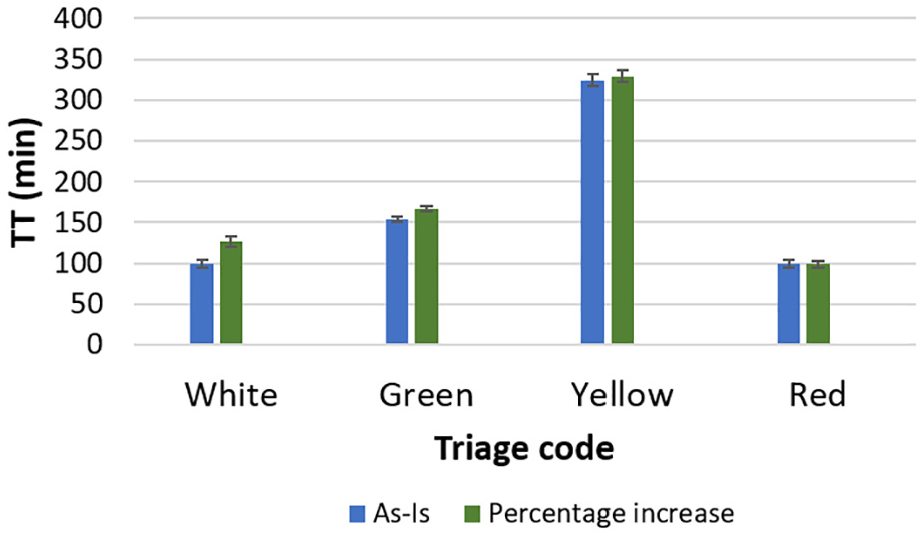
TT (in minutes): comparison between the current “as-is” status (in blue) and a prefixed percentage increase of the arrival rate (in green).
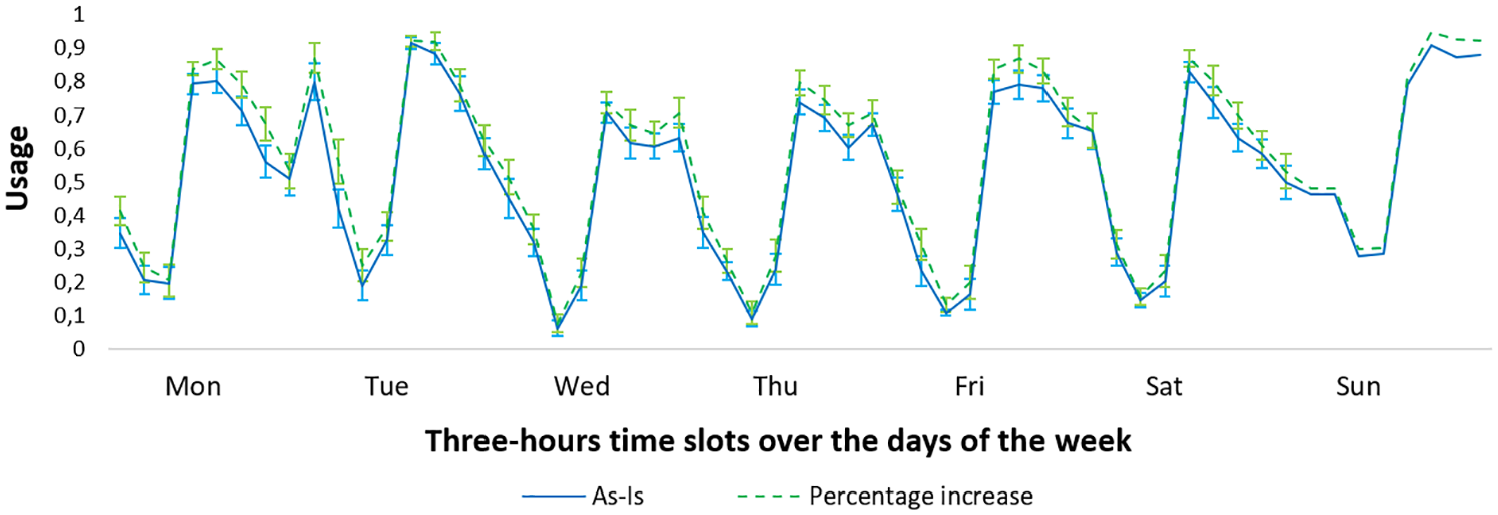
Usage of Area B.
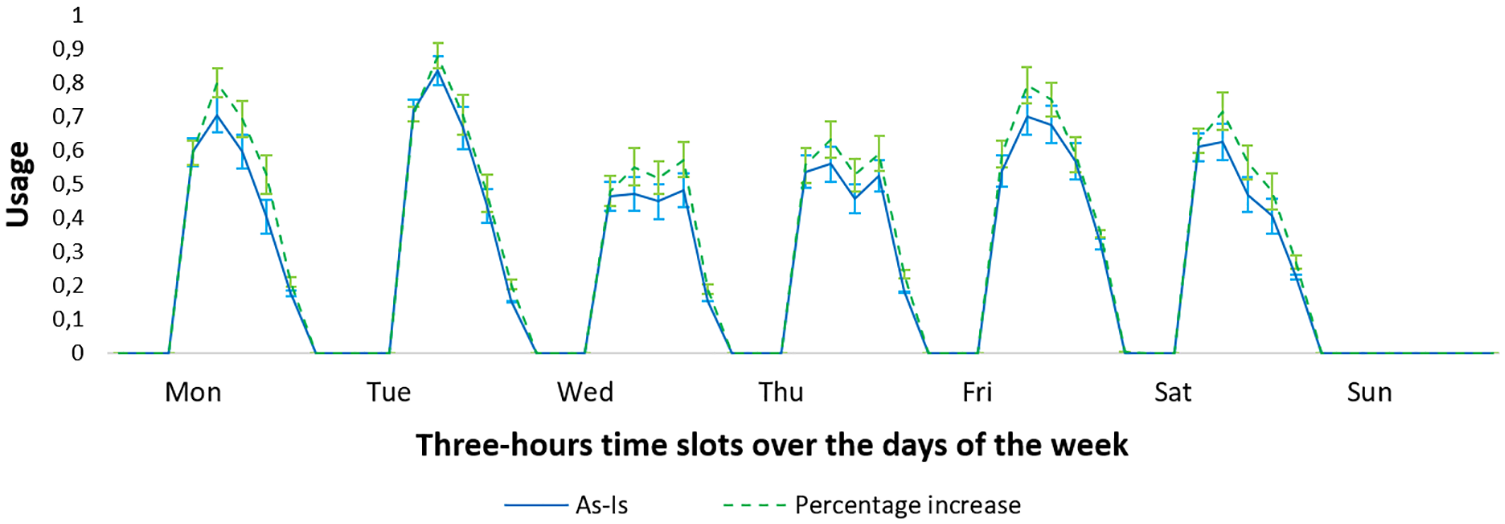
Usage of Area C.
6.2. A mildly and an extremely loaded scenario
Now we consider unexpected conditions due to a spike in the patient arrival rate related to a sudden and critical event (for instance, in the extreme case, an earthquake). We focus on two possible artificial scenarios, namely both a mildly and an extremely loaded scenario corresponding to two different unpredictable occurrences. It is important to note that in this case, a terminating simulation must be used since we are interested in monitoring the actual effect of arrival spikes on the ED as an unsteady system. The aim is to avoid that too many occurrences concerning standard days (without spikes) are included in the statistical analysis. This would occur if the KPIs were computed by averaging over a long run, e.g., 35 days. Therefore, we chose 2 weeks as replication length and a warm up period of 7 days to avoid bias due to initial conditions (empty system). In this manner, the statistical analysis is focused on the week containing the peak arrivals and concentrated on the related transient state. For each experiment, we run 50 independent replications.
As regards the mildly loaded situation, we adopt a gradual increase/decrease in the arrival rate over the first 3 days of the week. More precisely, similarly to Ahalt et al., 56 we increase the arrival rate from 5% to 25%, depending on time slots, according to the scheme in Table 9. As concerns the extremely loaded scenario, we try to reproduce a major emergency. To this aim, we consider a 300% increase in the arrival rate centered over the 24 h of Monday.
Percentage increases in the arrival rate for Monday, Tuesday, and Wednesday on different time slots.
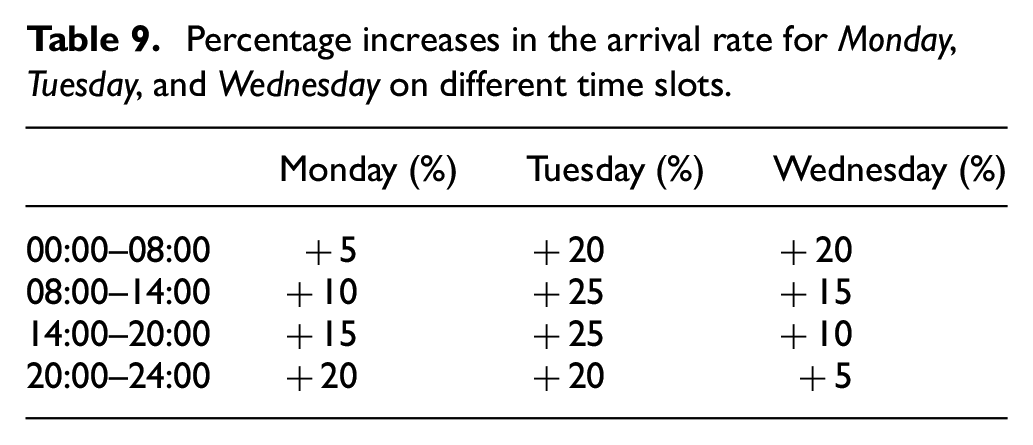
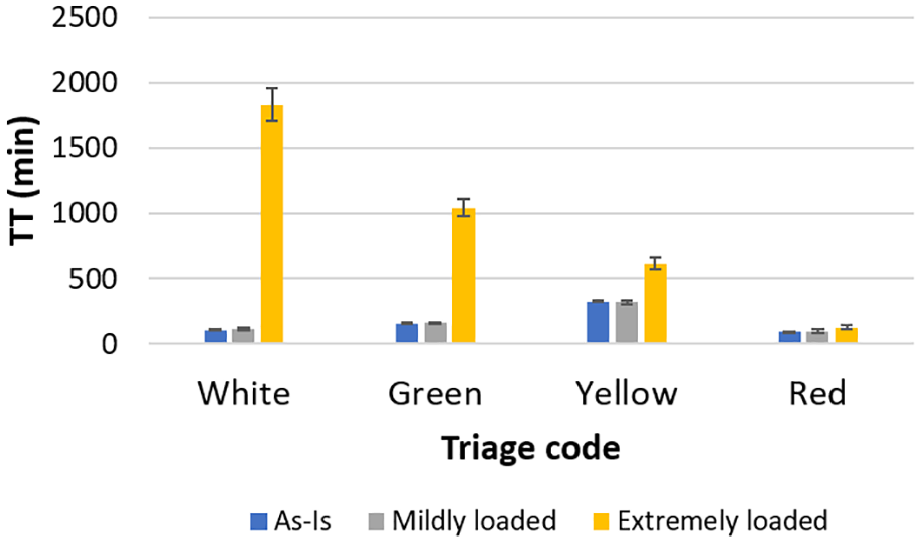
Figure 10 reports the increased hourly arrival rate for both scenarios along with the unmodified arrival rate. In Figures 11 and 12, we report the comparison between the current “as-is” status and the two scenarios in terms of WT. Similarly, in Figure 13, the same comparison is reported in terms of TT. As expected, in the extremely loaded scenario, we observe a huge increase in both WT and TT of low-complexity patients (white and green tagged): the WT would exceed 1 day for white tagged patients and 10 h for the green tagged ones and this is not acceptable. As regards the mildly loaded scenario, a moderate increase is highlighted, showing that both WT and TT are actually still feasible. A different outcome is pointed out for higher complexity patients. As regards the red tagged ones, their current percentage with respect to the other color tagged patients is unchanged (scenarios with changes in this percentage are reported afterwards). In this case, even a huge increase in the overall number of arrivals does not lead to exceed one red tagged patient arrival per hour. Therefore, both WT and TT do not grow significantly, also due to the high priority assigned to these patients. A similar result is observed for the yellow tagged patients. Moreover, note that the WT for red tagged patients is still approximately zero, in accordance with their high urgency level.
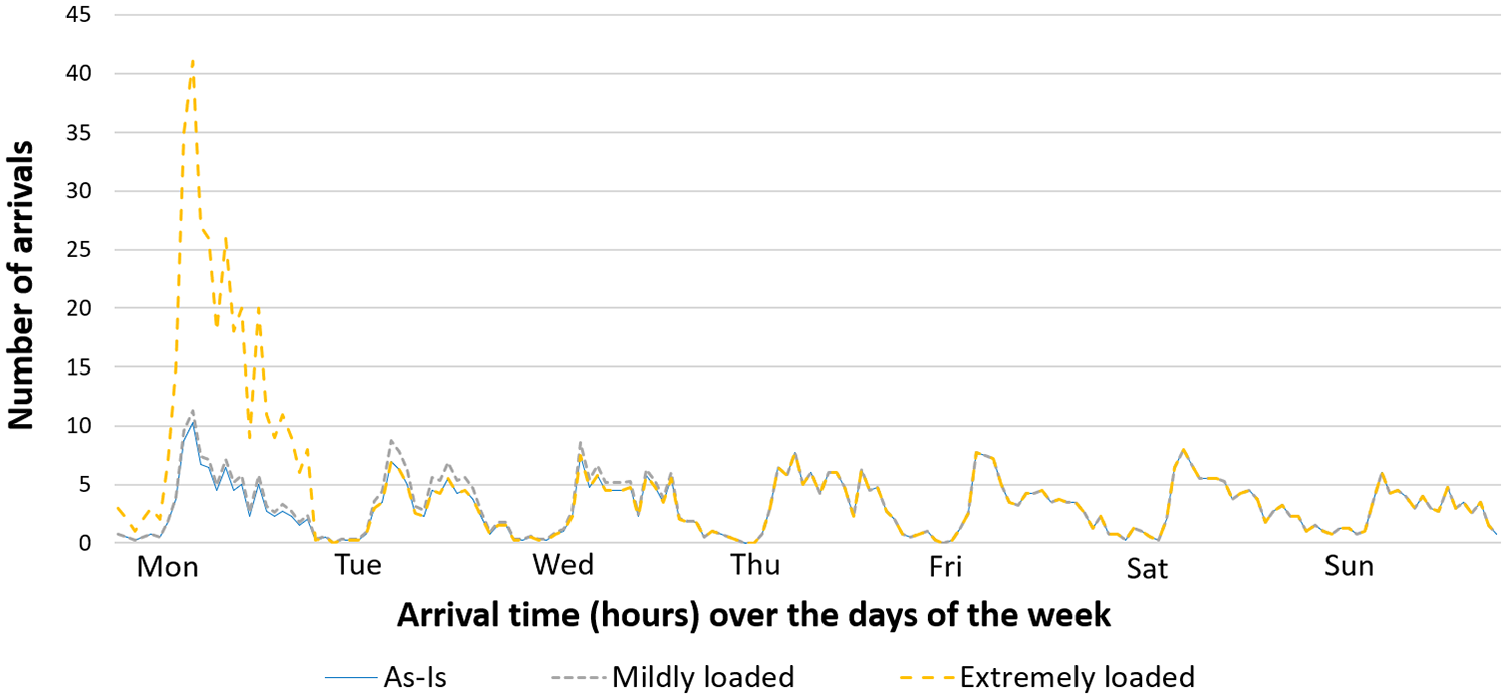
Increased patient arrival rate (mildly loaded in gray, extremely loaded in yellow) and the unmodified arrival rate (in blue).
WT (in minutes): comparison between the current “as-is” status (in blue) and the mildly (in gray) and extremely(in yellow) loaded scenarios.
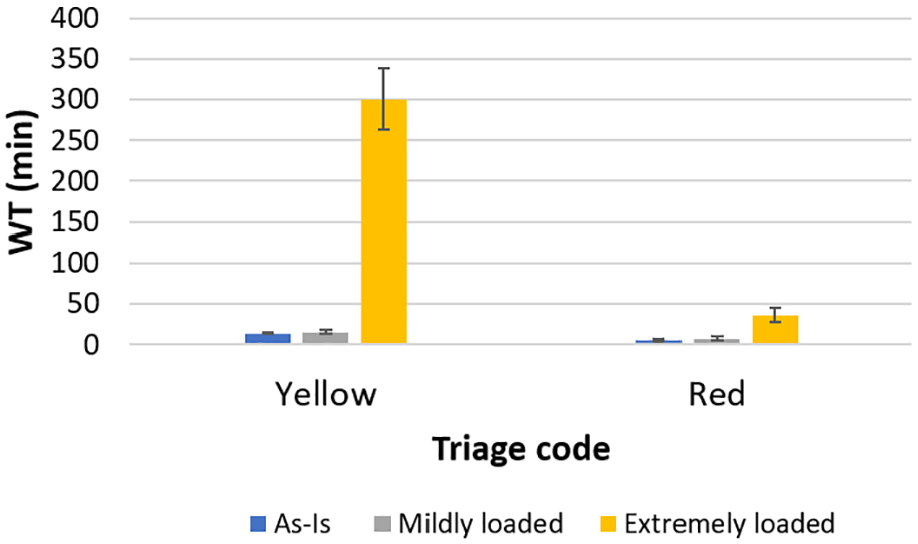
WT (in minutes): detail for yellow and red tagged patients of the comparison reported in Figure 11.
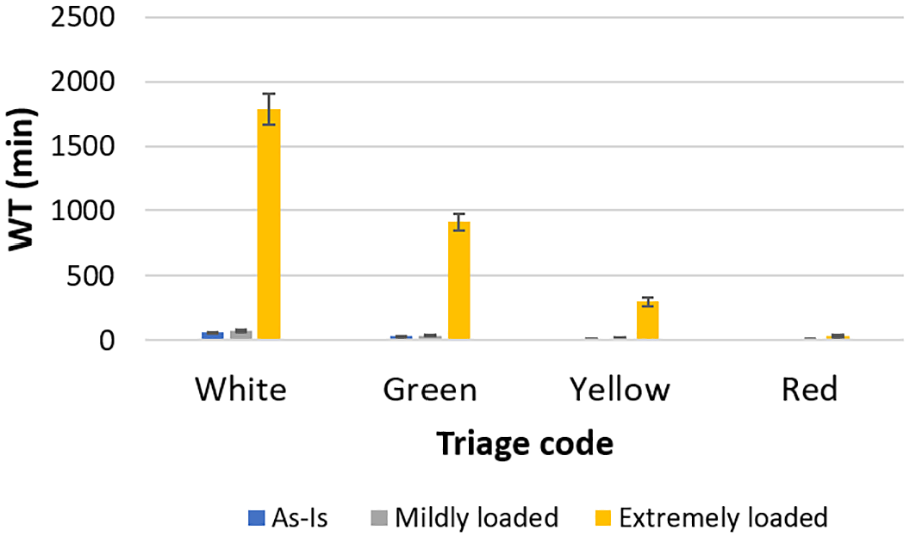
TT (in minutes): comparison between the current “as-is” status (in blue) and the mildly (in gray) and extremely(in yellow) loaded scenarios.
Figures 14 and 15 report the comparison between the current “as-is” status and the two artificial scenarios in terms of Area B and Area C usage. For the sake of clarity of the plots, in the figures, we report usage based on 3-h time slots (Note that in these figures and those reported in the sequel, in a few cases, the confidence interval bars cannot be well represented, since their length is very small). From both these figures, it can be observed how, in the two scenarios, the peak in the patient arrivals causes a sudden increase in the usage of both the resources (Area B and Area C). In the case of extremely loaded scenario, the peak causes resource saturation even immediately before and after the peak center. Note how this phenomenon can be observed only by monitoring the instantaneous resource usage rather than the average utilization.
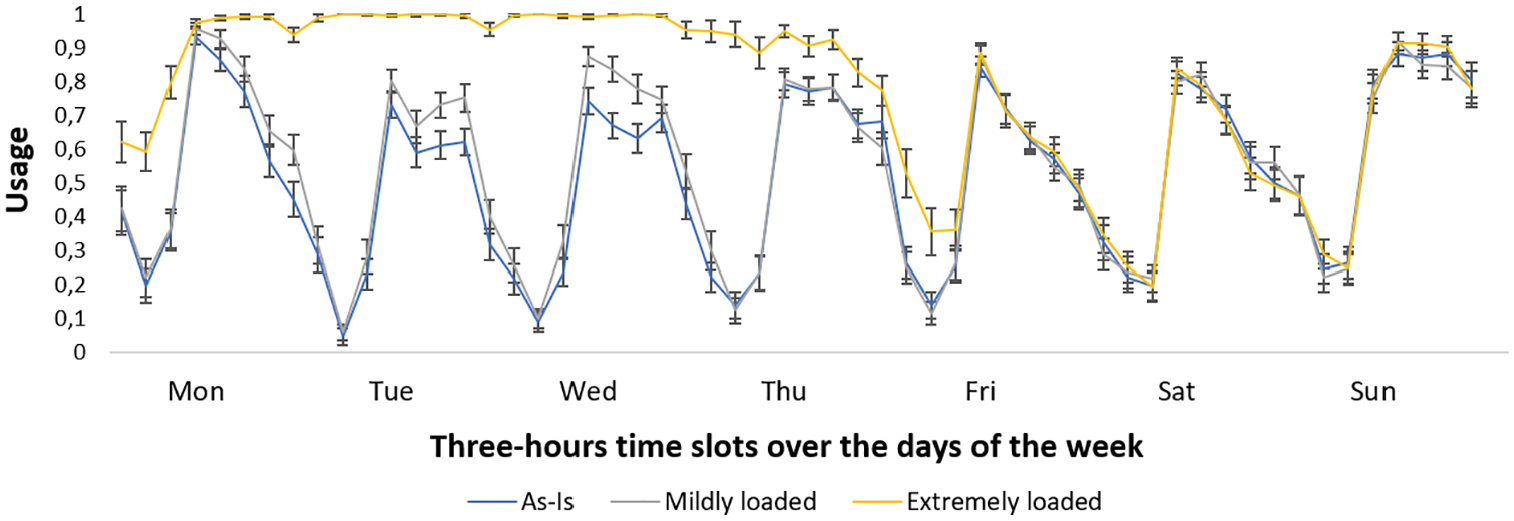
Usage of Area B: the current “as-is” status (in blue), the mildly loaded (in gray) and the extremely loaded (in yellow) scenarios.
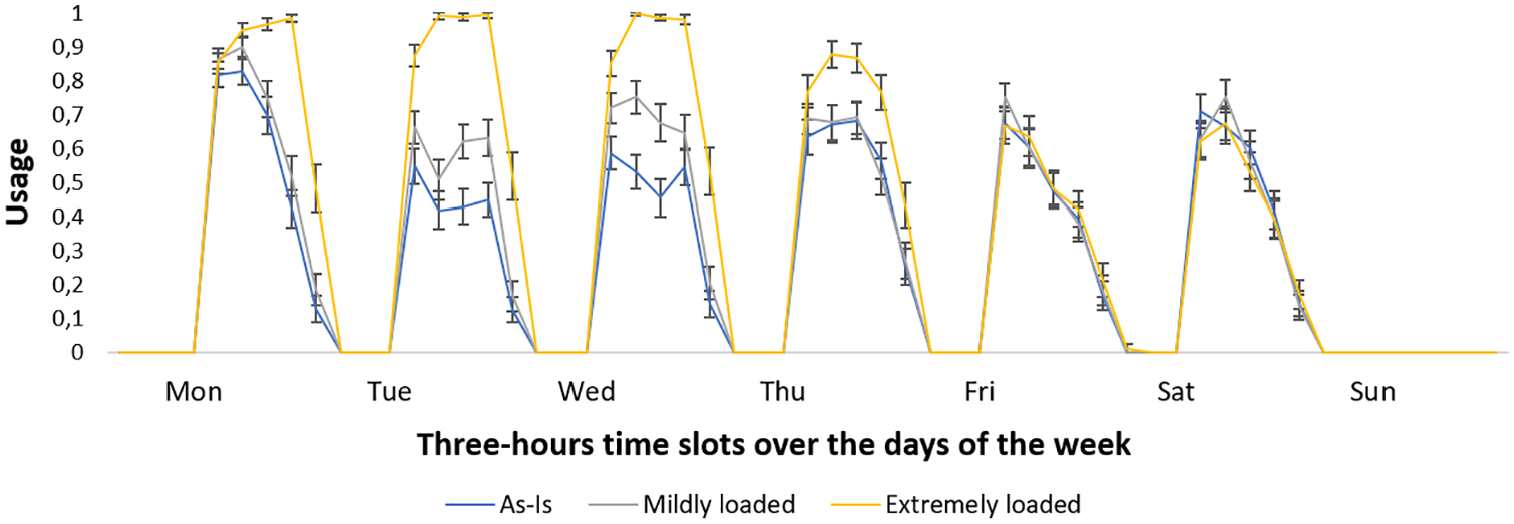
Usage of Area C: the current “as-is” status (in blue), the mildly loaded (in gray) and the extremely loaded (in yellow) scenarios.
Now we analyze more in detail the extremely loaded scenario. Indeed, due to the unpredictability of the phenomenon of peak arrivals caused by critical events, it is difficult to create artificial scenarios that actually reproduce what could happen in the real system. Therefore, we now analyze some variants of the
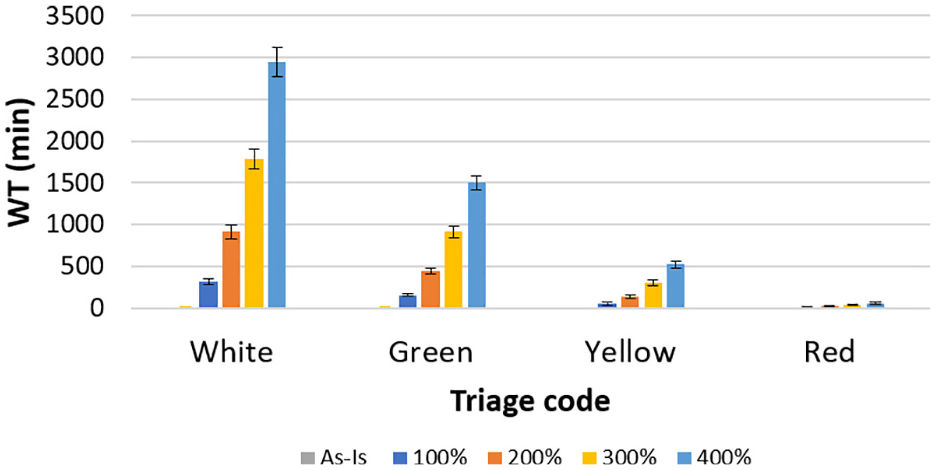
WT (in minutes): comparison between the current “as-is” status (in gray) and the extremely loaded scenario with increases in the arrival rate of
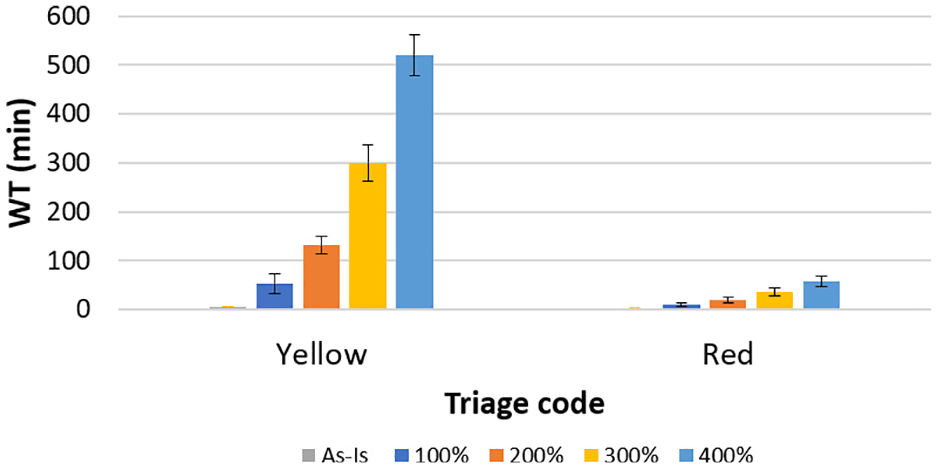
WT (in minutes): detail for yellow and red tagged patients of the comparison reported in Figure 16.
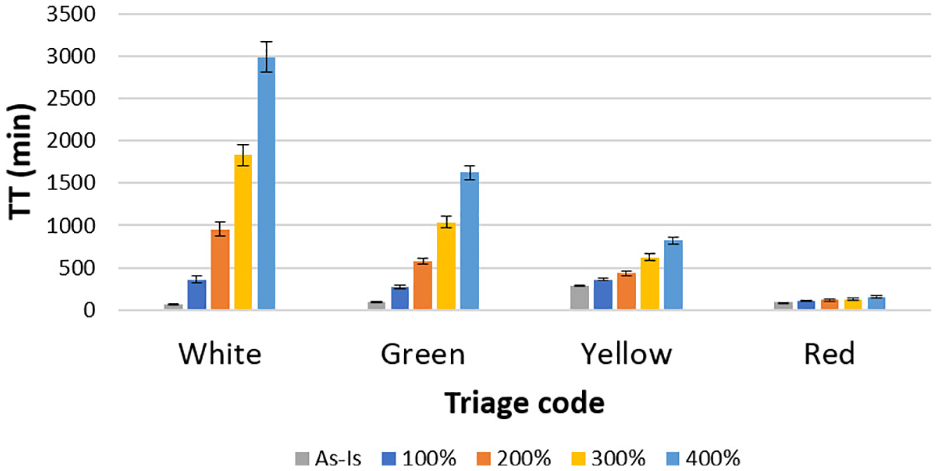
TT (in minutes): comparison between the current “as-is” status (in gray) and the extremely loaded scenario with increases in the arrival rate of
The same comparison between the current “as-is” status and the increases of
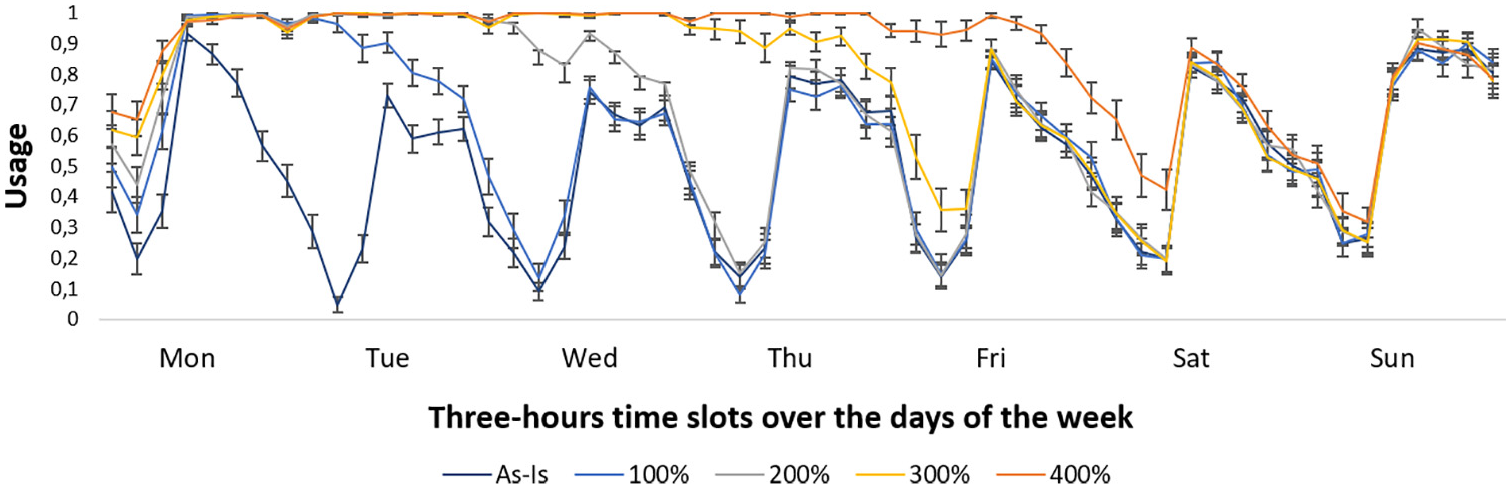
Usage of Area B: the current “as-is” status and the extremely loaded scenarios.
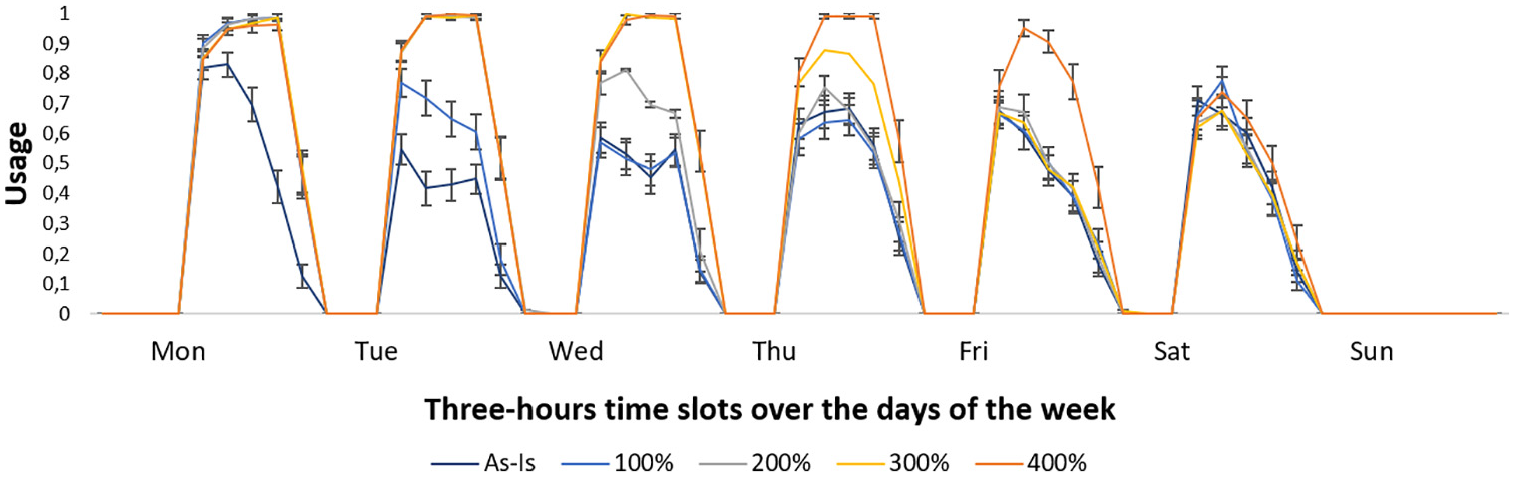
Usage of Area C: the current “as-is” status and the extremely loaded scenarios.
All the scenarios up to now analyzed are based on increases in the patient arrival rate, keeping unchanged the percentage distribution of different color tagged patients. Actually, during a critical event, it is also likely to assume that the percentage of high priority patients grows during the arrival rate peak. During the latest earthquake (24 August 2016) that hit Central Italian regions (where the ED considered in this work is located), up to 14 patients with trauma due to crushing (i.e., red tagged patients) requested assistance in the hour corresponding to the peak in the arrivals. As already mentioned in Section 3, in these cases, i.e., in case of the so called “maxi-emergency,” Italian EDs adopt the “Internal Emergency Plan for Massive Inflow of Injured” (we use the Italian acronym PEIMAF), according to the current regulation. This implies the availability of additional resources and the adoption of different operating rules aimed at providing an adequate and timely assistance to all the patients who require it. Of course, although such a plan cannot be tested during the normal ED activity, an accurate assessment of its effectiveness must be performed in advance in view of its potential activation. A natural way for performing such a testing is to adopt a DES model. Therefore, we used our DES model also to provide the decision makers with useful insights concerning the design of the PEIMAF.
In the sequel, we report some analyses aiming at reproducing a critical situation corresponding to the extremely loaded scenario with an increase in the arrival rate and, in addition, an increase in the red tagged patient arrivals. In particular, we assume both an increase of
The percentage of color tags assigned at the triage station is modified during the whole peak day, by assuming that
The number of physicians and nurses on duty is doubled during the peak day, starting from the peak hour (10:00 a.m.) and then the shifts return to the normal scheme;
Green and white tagged patients are not admitted to the ED, starting from the peak hour (10:00 a.m.), but they are sent to outpatient facilities;
Also Area B and Area C can be used for the treatment of red tagged patients.
In this manner, by
Figures 21 and 22 report the WT and the TT for the “as-is” status and the extremely loaded scenario with
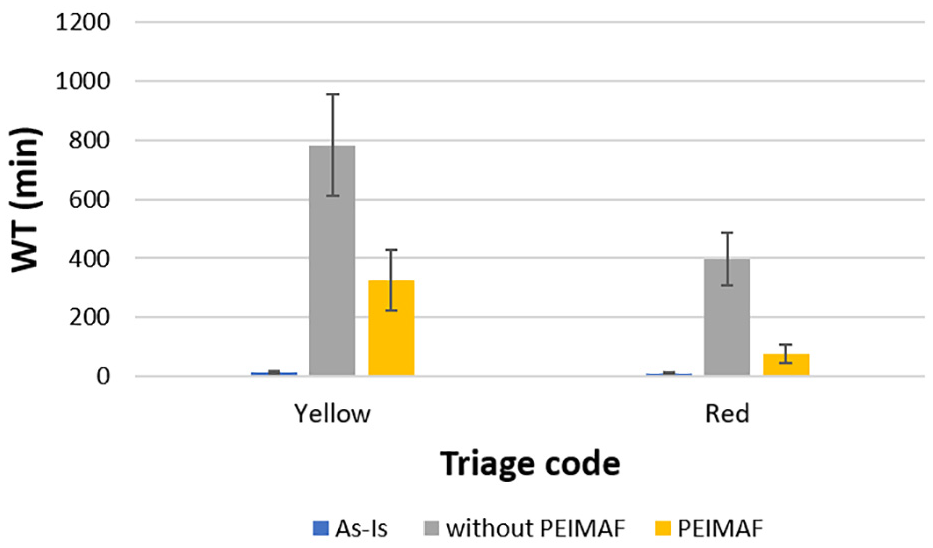
WT (in minutes): comparison between the current “as-is” status (in blue) and the extremely loaded scenario with the modified percentage of red tags assigned at the triage as in
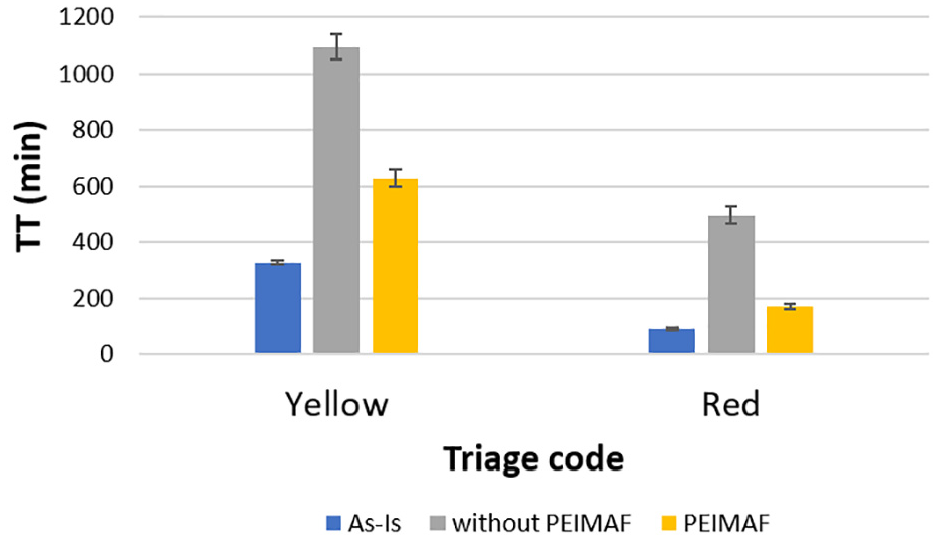
TT (in minutes): comparison between the current “as-is” status (in blue) and the extremely loaded scenario with the modified percentage of red tags assigned at the triage as in
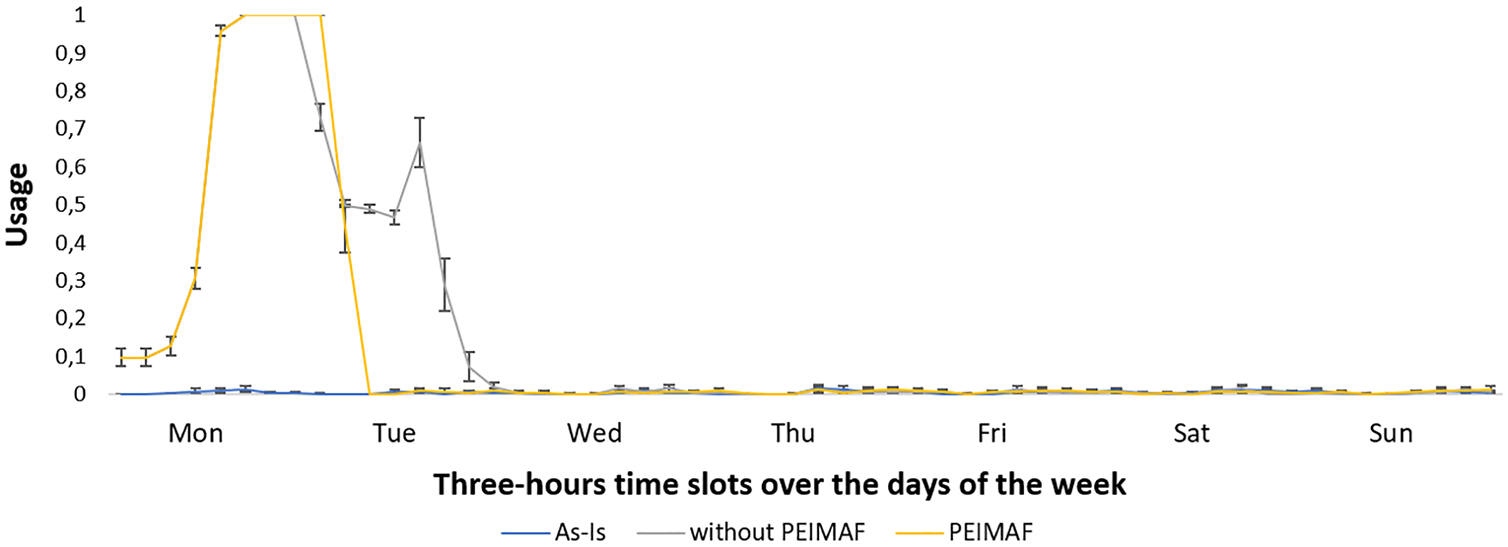
Usage of Area A: the current “as-is” status and the extremely loaded scenario with and without the maxi-emergency plan.
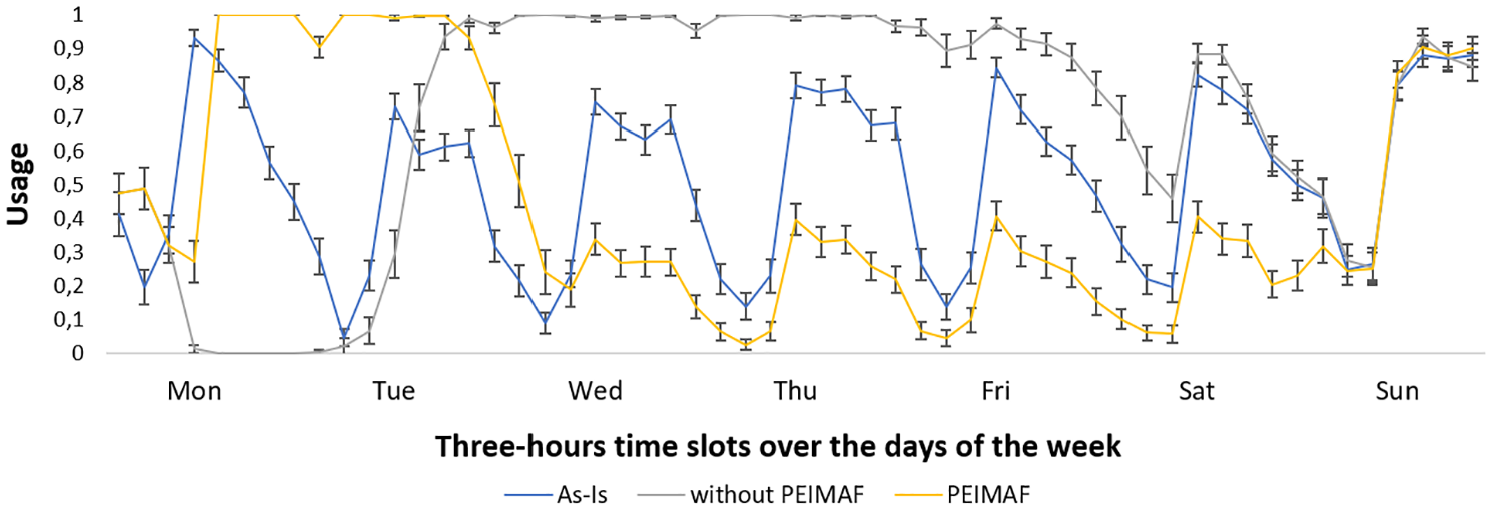
Usage of Area B: the current “as-is” status and the extremely loaded scenario with and without the maxi-emergency plan.
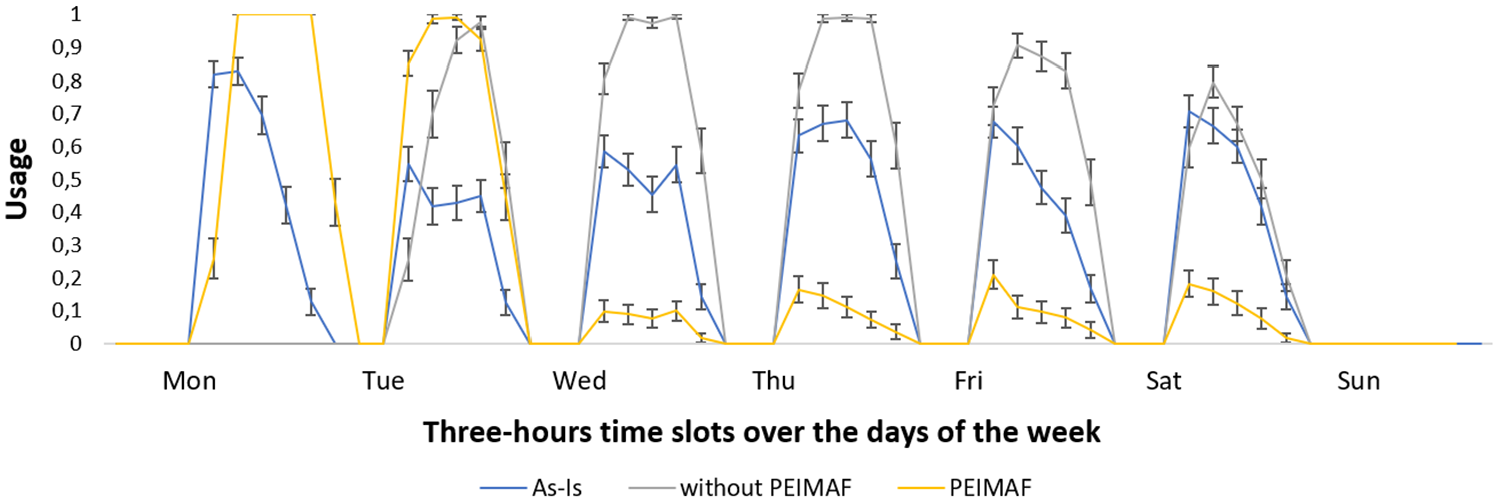
Usage of Area C: the current “as-is” status and the extremely loaded scenario with and without the maxi-emergency plan.
7. Conclusion
In this paper, we propose a DES model for studying the ED of a medium-size hospital in a region of Center Italy recently hit by a severe earthquake. The aim is to assess how fundamental KPIs change in response to different increase patterns of the patient arrival rate. In particular, we focus on critical events, like a natural disaster, which could lead to extremely loaded situations. To evaluate the performance of the ED under study, we consider time-related measurements as well as resource usage. Several scenarios have been considered, including the ones artificially created, trying to reproduce real mass casualty occurrences. The experimental results showed that, when the increase of the arrival rate is low or moderate, the ED performance does not significantly deteriorate. Instead, in case of extreme events with high patient peak arrivals, the adoption of an exceptional emergency plan is necessary to ensure effective and timely assistance.
The model proposed in this paper refers to a specific case study, but thanks to the flexibility of its implementation, it can be easily adapted to reproduce the patient flow of other EDs. We believe that the model we proposed has a twofold merit: it represents an effective decision support system; indeed, it enables decision makers to assess the performance of the ED under study and to better allocate ED resources. Moreover, the model can be used to perform scenario analyses to help managers to define in advance maxi-emergency plans which, of course, cannot be tested during the normal activity of the ED.
On the other hand, this study clearly presents some practical limitations. First, the patient arrivals in the different scenarios are generated by using the same probability distribution with changed mean. This is an assumption commonly adopted, due to a lack of data on specific arrival patterns during critical events. Furthermore, it was not possible to assess how the quality of care and the patient satisfaction change by adopting different ED settings. Even the number of LWBS patients cannot be considered to this aim when PEIMAF is adopted. Indeed, in this latter case, green and yellow tagged patients are not admitted to the ED, but sent to outpatient facilities. Of course, the remaining red tagged patients and usually also the yellow tagged ones do not leave without being treated. However, we believe that this is not a major limitation for the scope of this study.
As future work, when further suited information is available, we could easily include it in our model, allowing us to overcome the existing limitations. Moreover, we can also consider further components, like fast track or see and treat pathways, as well as changes of physician and nurse service rate.
Footnotes
Acknowledgements
The authors wish to express their gratitude to Dr. Stefania Mancinelli and to Dr. Marco Pierandrei from “Direzione Medica Ospedale di Fabriano” who enabled them to carry out this study. Moreover they thank Dr. Massimo Maurici and Ing. Luca Paulon from “Dipartimento di Biomedicina e Prevenzione” and “Laboratorio di Simulazione e Ottimizzazione dei servizi del SSN” of the Università di Roma “Tor Vergata,” for useful discussions on an early stage of this work. The authors wish to thank the anonymous reviewers for their constructive comments and suggestions which led to improve the paper.
Funding
This research received no specific grant from any funding agency in the public, commercial, or not-for-profit sectors.