
Abstract
Aircraft deicing/anti-icing fluids (ADFs) are applied to remove and prevent icing on aircraft during taxi and takeoff. The Dallas-Fort Worth (DFW) International Airport uses deicing pads for deicing activities that collect and contain the spent deicing fluids for proper treatment or disposal. Local waterways receive ADF as “drip and shear” during the aircraft taxi on the runway and then takeoff. The glycol-based ADF serves as a nutrient for bacteria that grow exponentially, deplete dissolved oxygen (DO) from receiving waterways, and subsequently kill aquatic life. In this paper, we present a data-driven discrete-event simulation modeling process developed in collaboration with DFW Airport to assess aircraft assignment strategies to deicing pad locations by monitoring impact on DO. Our process consists of the following phases: (1) Data Collection, (2) Probability Distribution Modeling, and (3) State Transition Modeling. Both Phases (2) and (3) utilized data mining approaches, including treed regression and variable selection via false discovery rate. Detailed implementation of these phases is described for the DFW Airport case study, and the DFW Airport deicing activities simulation tool framework is presented. The actual data and simulation results were compared in terms of the DO levels in airport receiving waterways to verify the model validity after implementing the proposed model for DFW. Thus, the proposed model can be implemented by airports to control and minimize the adverse environmental effects resulting from deicing activities by optimizing the aircraft assignment to the pad locations.
1. Introduction
In 2005, Dallas-Fort Worth (DFW) International Airport initiated a collaborative project with the University of Texas at Arlington (UTA) to conduct a deeper study on the connection between airport deicing activities and water quality in the airport’s receiving waters. Icing on aircraft has been documented as one of the serious safety hazards of air travel.1–3 A standard acceptable deicing procedure involves spraying aircraft deicing/anti-icing fluids (ADFs) to remove any ice on the exterior part of an aircraft and to prevent ice formation during aircraft ground maneuver and flight. DFW Airport installed deicing pad locations to capture and transport the runoff ADF to locations where the airport can manage their disposal. The sprayed ADF, however, can still “drip” off the aircraft during taxiing or “shear” off the aircraft during takeoff. This “drip and shear” ADF can then find its way to waterways. Similar to vehicle antifreeze, glycol is the major ingredient of ADF that serves as a nutrient for bacteria. As a result, bacteria grow exponentially in local waterways after deicing activities and affect water quality by decreasing dissolved oxygen (DO) levels. Consequently, aquatic life will be threatened and perish without sufficient DO. Therefore, deicing activities have an adverse impact on local waterways.4–6
Water quality measurements in DFW Airport receiving waters showed a decrease in DO levels after deicing events, indicating the persistent presence of ADF in the environment. The presence of ADF increased the bacterial population of waterways in the vicinity of DFW Airport, leading to the death of fish in Trigg Lake (an irrigation reservoir located on south of the runway). 7 Thus, DFW Airport installed aerators in Trigg Lake to maintain an acceptable DO level (>5 mg/L) to sustain aquatic life. 8
Although the runway and the amount of applied ADF are clearly critical to the dispersion of ADF over airport property, the airport controls neither of these. The only decision under the airport control is the assignment of an aircraft to a deicing pad location. Owing to the critical impact of aircraft deicing activities on water quality and aquatic life, this paper presents a data-driven discrete-event simulation modeling process to assess the impacts of aircraft-pad assignment decisions on DO levels of local waterways. In other words, the main motivation for presenting this novel simulation model is to help airports to have better control over the pad assignment for deicing/anti-icing activities while minimizing the potential undesirable impacts of these activities on the environment and water quality. To the best of our knowledge and based on the literature, this is the first study that both simulates pad assignment of airport deicing and anti-icing activities and predicts DO levels in affected waterways by simultaneously considering water quality variables, weather variables, different aircraft types, runway data, and glycol usage variables.
The use of simulation models for airport activities and the environmental effects of airport deicing activities have been considered in the literature. Terminal activities, such as check-in, customs, shopping, boarding, and baggage reclaim, have been widely studied by a developed library of simulation building blocks, 9 and various aspects of airport operations have been studied via simulation, including SimAir, 10 maintenance scheduling of an aircraft, 11 and passenger flow in the airport terminal. 12 Simulation of aircraft pilot flight controls has been conducted using the nonlinear system identification technique. 13 Related to ADF-based airport deicing, agent-based simulation 14 has been used to study multiple stakeholders with independent interests, and Monte Carlo simulation 15 has been utilized to estimate the total system time of the deicing process. In our study, the simulation is specifically from the perspective of the airport, and the key element is to allow the airport to control the aircraft-pad location assignments. While our discrete-event simulation does include the service time to deice an aircraft, an agent-based simulation is only appropriate when agent behaviors can be modeled via assumed probabilistic rules. DFW Airport wanted to customize their aircraft-pad assignments under the current conditions of the system (i.e., state of the system), so our discrete-event simulation model employs a state transition model that enables the airport to directly control this assignment. An alternative to applying ADFs is the electro-thermal deicing process, 16 which does not contribute glycol to airport waterways. Other deicing-related literature includes managing delays or disruptions due to deicing activities, 17 the structural impact of ADF on the aircraft and the airport environment, 18 and various analyses of the impact of airport operations, like deicing on the natural waters.19–21 Authors of the current work (Kim, Rosenberger, and Chen) have studied DFW Airport’s deicing activities in prior research, including data mining–based analyses to assess the effects of deicing activity on the environment 7 and to assess the efficacy of ADF collection at deicing pad locations, 22 and a data-driven dynamic programming model of deicing activities to minimize the adverse environmental impact of deicing activities at DFW Airport. 23 While our current state transition models are based on the work of Fan et al., 23 their framework did not address different size aircraft (Narrow Body, Wide Body, Regional Jets), anti-icing activities, complete weather data, and runway data. Similar to Fan et al., 23 our work uses a regression tree for grouping glycol usage, the probability distribution for determining runway used by aircraft after deicing, and state transition models to predict DO level.
The major contribution of this research is introduction of a data-driven discrete-event simulation modeling process to assess the aircraft-to-pad assignment strategies prior to the actual assignment. Our process consists of the following phases: (1) Data Collection, (2) Probability Distribution Modeling, and (3) State Transition Modeling. Data mining approaches were employed to empirically derive probability distributions in Phase (2) and to empirically estimate state transitions in Phase (3). This process was implemented for DFW Airport, and a simulation tool was provided to assist the airport in deicing pad assignment decisions, so as to mitigate the environmental impact on the local waterways. The airport selected the 2009–2010 deicing season due to the representation of mild to severe cold weather events, and the developed airport deicing simulation tool is intended to study future deicing pad location assignments under assumed weather conditions from the 2009 to 2010 season. Section 2 presents an overview of our data-driven simulation modeling process. Implementation details for the DFW case study are given in Section 3. The simulation tool framework and model validation for DFW Airport are discussed in Section 4. Finally, concluding remarks are provided in Section 5.
2. Data-driven simulation modeling process for airport deicing activities
To address the environmental issues resulting from the use of ADF, many airports, like DFW, have deicing pad locations to control airport deicing activities. Figure 1 represents the stages of this study. All phases are explained in this section, and their implementation is discussed in Section 3 in more detail. The first phase of our simulation modeling process required the collection of data for an entire deicing season, consisting of water quality data, deicing activities, and meteorological data. The last item can typically be obtained from the airport’s weather station and should include hourly data on air temperature, wind direction, wind speed, precipitation amount, and dew point. Water quality data should include DO and other potential factors that affect DO, such as water temperature. The timescale for these measurements is desired to be hourly, to match the timescale of meteorological data, but a faster sampling rate can be aggregated to an approximate hourly rate.
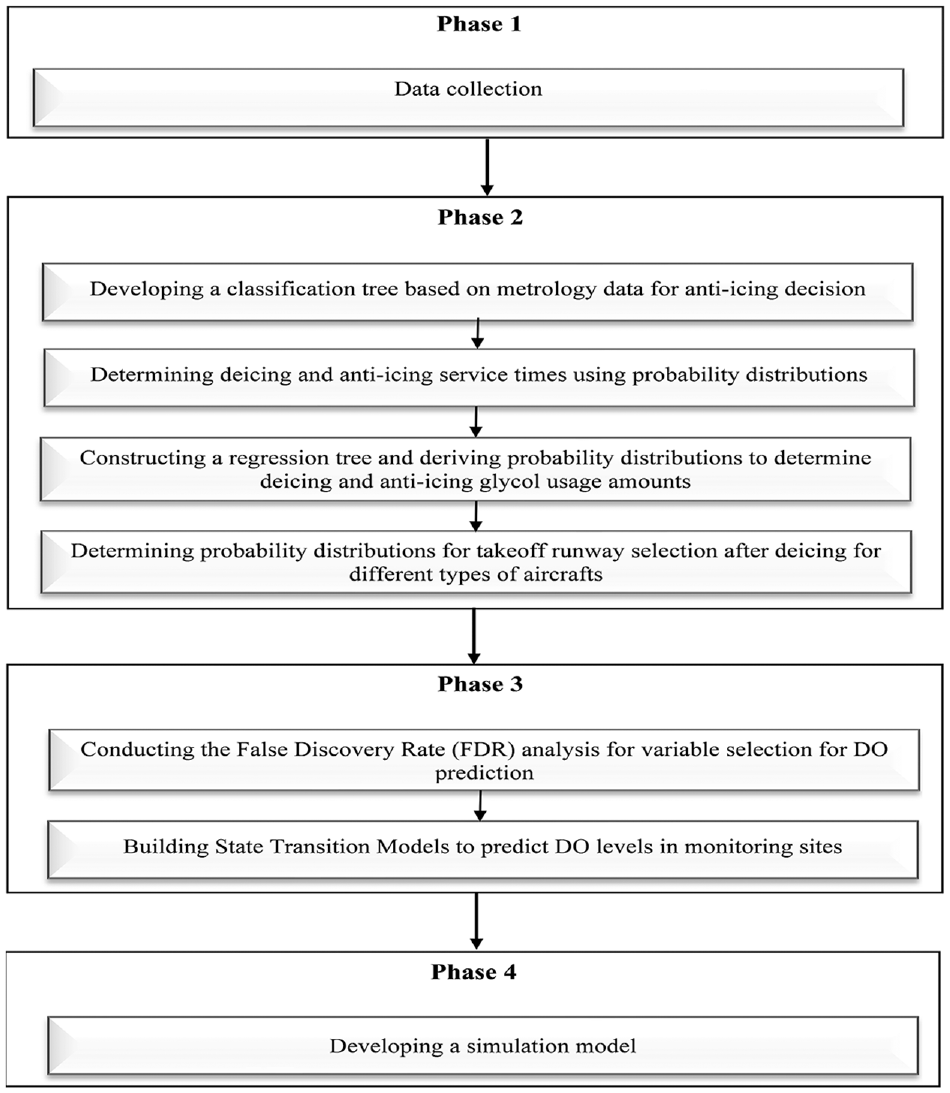
Stages of this study.
The recording of each deicing activity should include the date of deicing; the pad location; the type of aircraft deiced, such as Regional Jets; the start and end timestamps for ADF application and the glycol amounts of the applied ADF, separated into deicing and anti-icing categories; and the runway assignment for the deiced aircraft. The pad location captures deicing fluids that drip from the aircraft during the application of ADF, but when the aircraft moves off the pad and taxis to the runway, deicing fluids will continue to drip off the aircraft. Consequently, the deicing pad–runway combination identifies a pathway through which deicing fluids can seep into receiving waters. The runway specifies the pathway over the airport and surrounding areas through which anti-icing fluids that shear off an aircraft can reach waterways. Additional information that could potentially be useful but was not consistently available for the DFW Airport case study includes airport destination for the deiced aircraft, take-off timestamp, and taxiway route from pad location to runway.
The second phase of our process utilized the collected data to generate empirical probability distributions for uncertain simulated elements. In particular, decisions that are not within the control of the airport are modeled as uncertain (from the perspective of the airport). The pilot is responsible for the safety of the aircraft, so the application of ADF is the pilot’s decision and is not within the airport’s control. There are three types of uncertain elements related directly to the pilot’s ADF decisions. First, after deicing has been completed, the pilot can choose to have anti-icing fluids applied, depending on weather conditions. Deicing removes existing ice from the aircraft, and anti-icing prevents the occurrence of icing during takeoff. Second, the pilot decides when sufficient ADF has been applied, which determines the amount of glycol usage. Third, the pilot controls the service time to conduct deicing/anti-icing. Empirical distributions for glycol usage and service time are separately modeled for deicing versus anti-icing an aircraft. Finally, the Federal Aviation Administration controls the runway assignment.
The service times were modeled by fitting standard probability distributions, where typical distributions appropriate for time, such as Weibull and Lognormal, were found to be an adequate fit. The pilot’s decision to anti-ice and the glycol usage amounts had probability distributions that depended on meteorology. For the binary outcome to conduct or not conduct anti-icing, a classification tree was employed to generate the probability distribution. For the glycol usage amounts, first, a regression tree was employed to identify homogeneous groups based on meteorology, pad location, and aircraft type. Next, empirical distributions were fit to the data within each group, either by fitting a standard probability distribution or by using a histogram.
The third phase is the most intensive of our data-driven process. State transition models are needed to evolve the state of the water quality in airport waters over time, under various meteorological conditions and subject to airport deicing activities. In general, state transition modeling must model the time-lagged relationships that evolve the state of the system. In the case of deicing activities, there is an unknown time lag between the act of deicing/anti-icing at the deicing pad location and the depletion of DO in airport receiving waters. This time lag is studied in Section 3.3 as part of the state transition modeling process. The authors have established methods for data-driven state transition modeling24–28 and have published state transition modeling for the airport deicing process. 23 The state transition modeling approach in the current work combines variable selection via false discovery rate (FDR) 29 with treed regression.30,31 For airport deicing, the focus is on transitioning the state of DO over time. In order to appropriately explore the impact of airport deicing activities on DO, several time-lagged variables were required, generating hundreds of potential variables to include in state transition modeling. In 2009–2010, DFW Airport experienced eight deicing events, seven of which occurred over multiple days. Hypothesis testing using FDR is appropriate for variable selection in “small data” situations, 32 so this was applied to eliminate variables that were unimportant. Following the FDR procedure, treed regression was employed to build the state transition models utilized directly within the simulation to evolve the state of DO.
3. DFW Airport implementation
3.1. DFW Airport data collection
For the 2009–2010 DFW Airport deicing season, deicing events were recorded on the following dates: 12/1–12/4, 12/24–12/26, 12/28–12/31, 1/13–1/15, 1/27–1/31, 2/1, 2/10–2/15, and 2/22–2/24. The following data from the 2009 to 2010 deicing season were employed in this study. More details of the applied data can be found in Fan et al. 7 and Kim et al. 33
Data set 1: Water quality data at three sites (IN, OF19, OUT)—DO level in each monitoring site (mg/L) and water temperature at each monitoring site (°C).
Data set 2: DFW Airport deicing/anti-icing and runway activities—Ethylene and propylene glycol usage, deicing pad usage, and runway assignment.
Data set 3: Airport meteorology—Hourly data on air temperature in °F, precipitation in inches, dew point in °F, and two wind components, including east–west (E-W) and north–south (N-S) winds.
The data employed for waste quality analysis were collected directly by DFW Airport following each deicing event. For every airplane deiced in the 2009–2010 season, DFW Airport recorded the pad location (as depicted in Figure 2, West side: Taxiway C, Taxiway HY, Taxiway WK, SW Hold Pad; East side: NE Hold Pad, Taxiway Z, Taxiway EKS, SE Hold Pad), aircraft type (WB = Wide Body, NB = Narrow Body, and RJ = Regional Jets), ADF usage with percentages of ethylene and propylene glycol, deicing/anti-icing service times, runways (Southbound: 13R, 18R, 18L, 17R, 17C, and 17L; Northbound: 31L, 36L, 36R, 35L, 35C, and 35R), and flight information. These data were then merged with meteorological data and DFW Airport water quality data on an hourly timescale to create the DFW Airport deicing activities database.
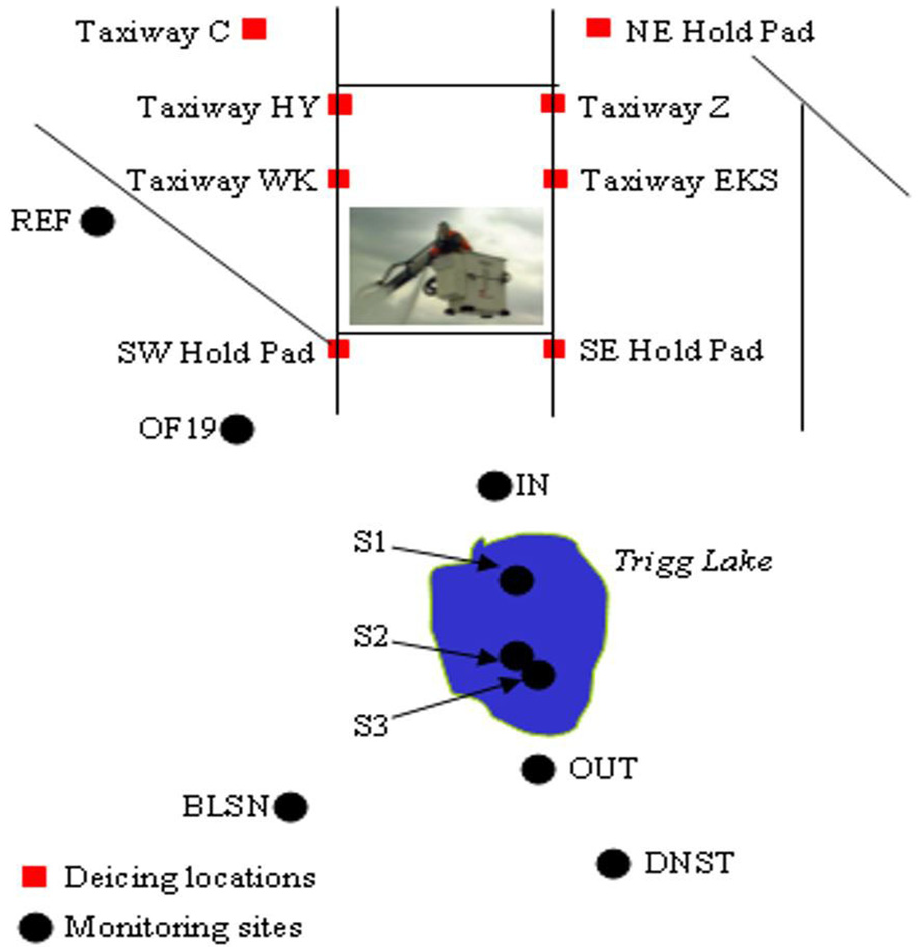
Schematic diagram of monitoring sites and deicing pad locations at DFW Airport. 7
Figure 2 shows a schematic diagram of the eight deicing pad locations and nine U.S. Geological Survey (USGS) water quality monitoring sites. A new pad location, called WL, was added near WK. To accommodate WL, capacities for WK and WL were combined, and it was assumed that the deicing and runway patterns of WL are similar to those of WK.
3.2. DFW Airport probability distribution modeling
Tree analyses were conducted using the Classification and Regression Tree (CART) software developed by Salford Systems 34 to group the observations prior to fitting probability distributions. Separate probability distributions were used to represent the observations in each group. Not all deiced airplanes experienced anti-icing, so the probability of anti-icing a deiced airplane was estimated using a classification tree based on meteorology. Figure 3 shows the classification tree for the anti-icing decision rule, where Class = 1 means no anti-icing while Class = 2 implies anti-icing. Four terminal nodes represent four homogeneous groups. Table 1 shows the probability distributions for four homogeneous groups identified by the classification tree. For example, if the scenario includes precipitation (≤0.005 inch) in the last 24 h, N-S wind component (≤10.066 mph), and a dew point (≤27.5°F), then it will be classified as Group 1 with no anti-icing and anti-icing probabilities of 0.837 and 0.163, respectively.
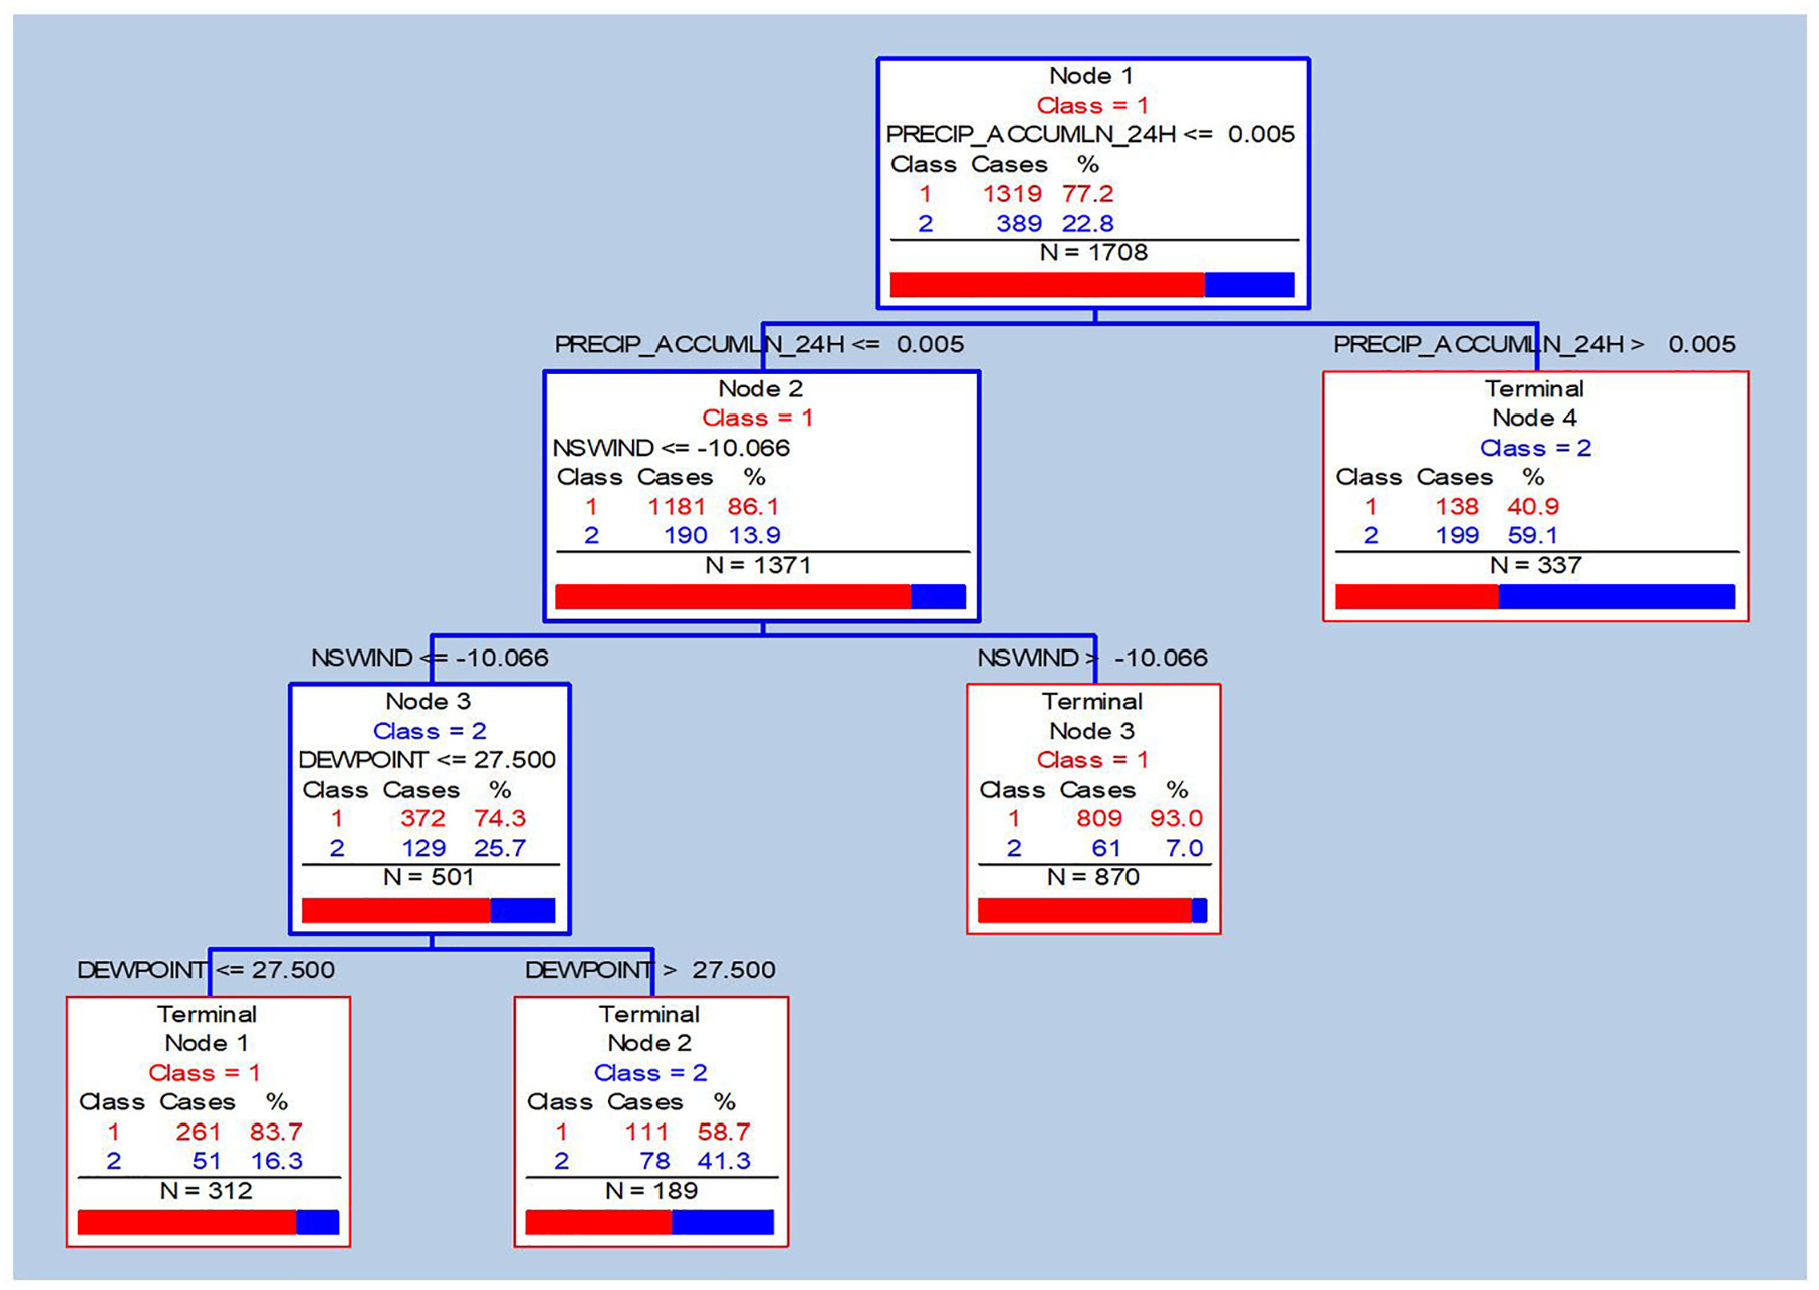
Classification tree for the anti-icing decision rule.
Probability distributions for anti-icing an airplane based on meteorology.
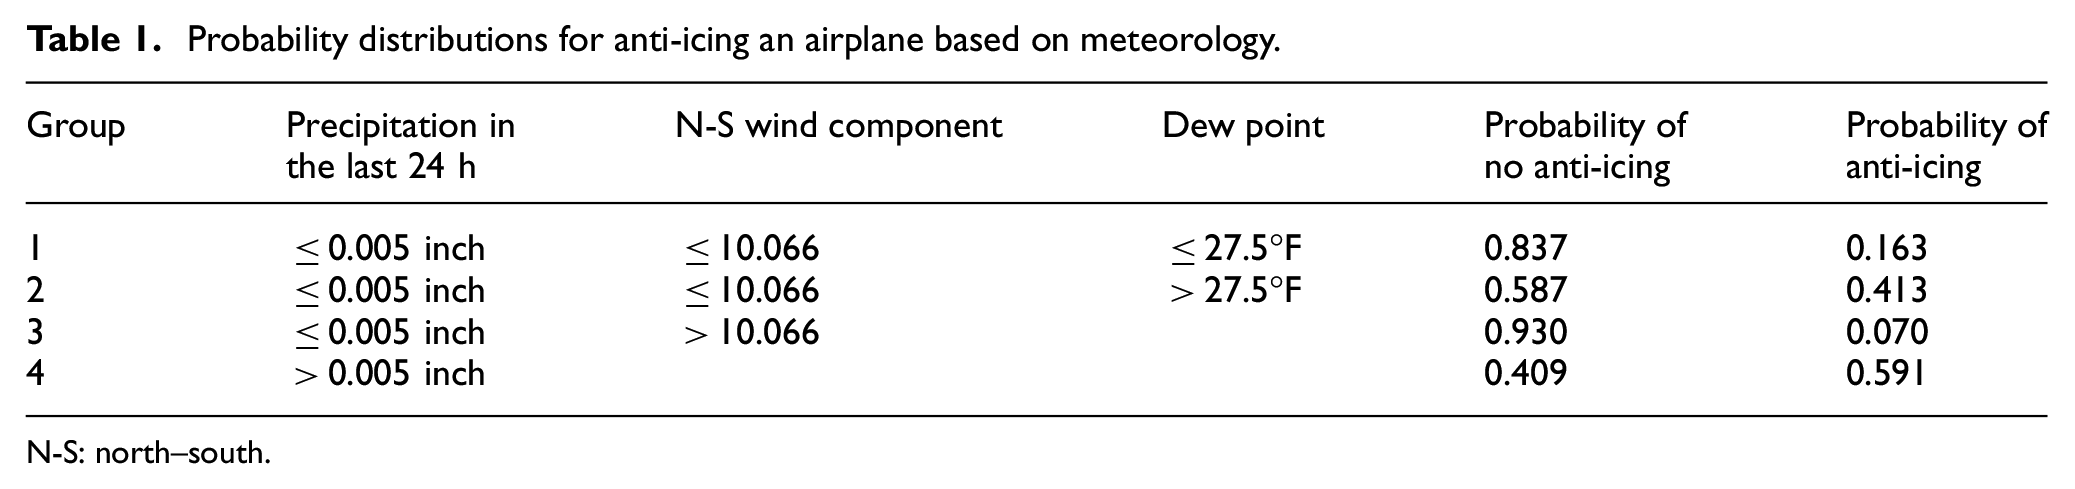
N-S: north–south.
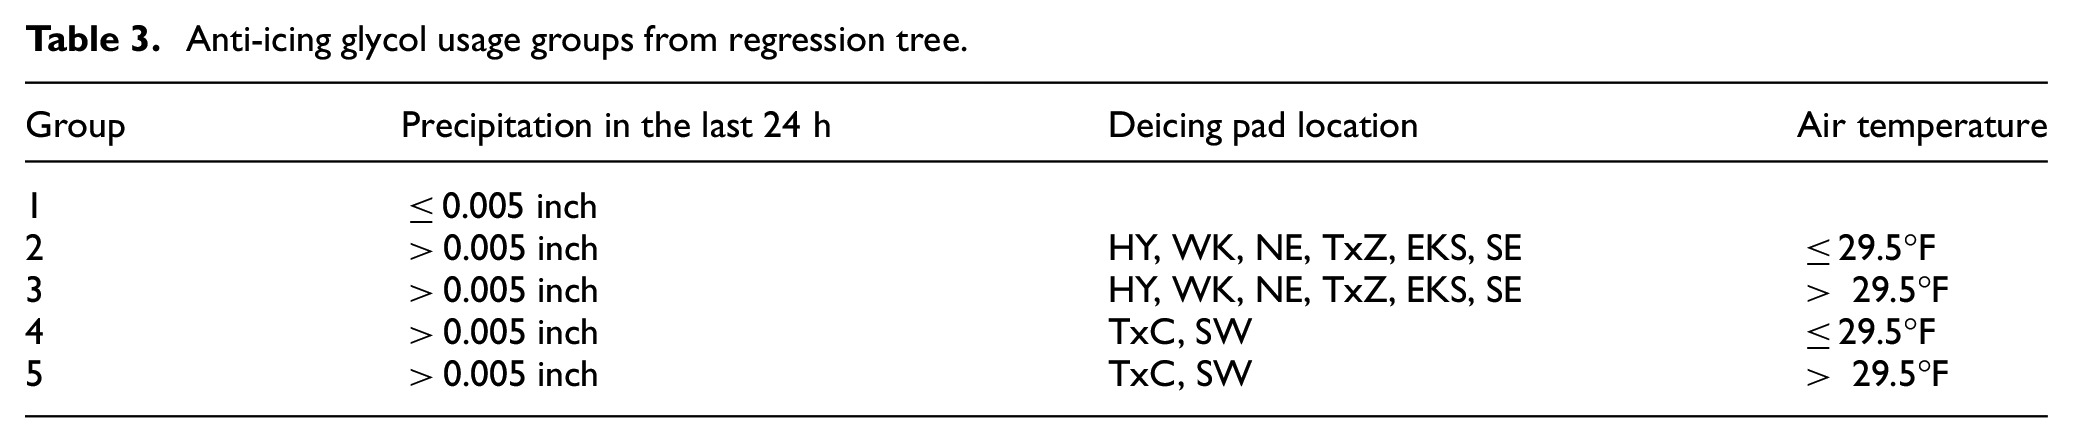
ADF usage and service times were separately recorded in the database for deicing and anti-icing tasks implemented on each airplane. Then, the chi-square goodness-of-fit test was applied to select the best fitting distributions for deicing and anti-icing service times. As can be seen in Figures 4 and 5, deicing service times could be best fit using a lognormal distribution with parameters µ = 2.26 and σ = 0.65, while anti-icing service times can be best fit using a Weibull distribution with scale parameter λ = 11.59 and shape parameter k = 1.41. For both tasks, ADF glycol usage amounts were grouped applying a regression tree based on meteorology, pad location, and aircraft type (Figures 6 and 7). Tables 2 and 3 display the glycol usage groups for deicing and anti-icing, respectively. A standard probability distribution or a histogram was then constructed for each group, to derive an empirical distribution of glycol usage (e.g., Figure 8).
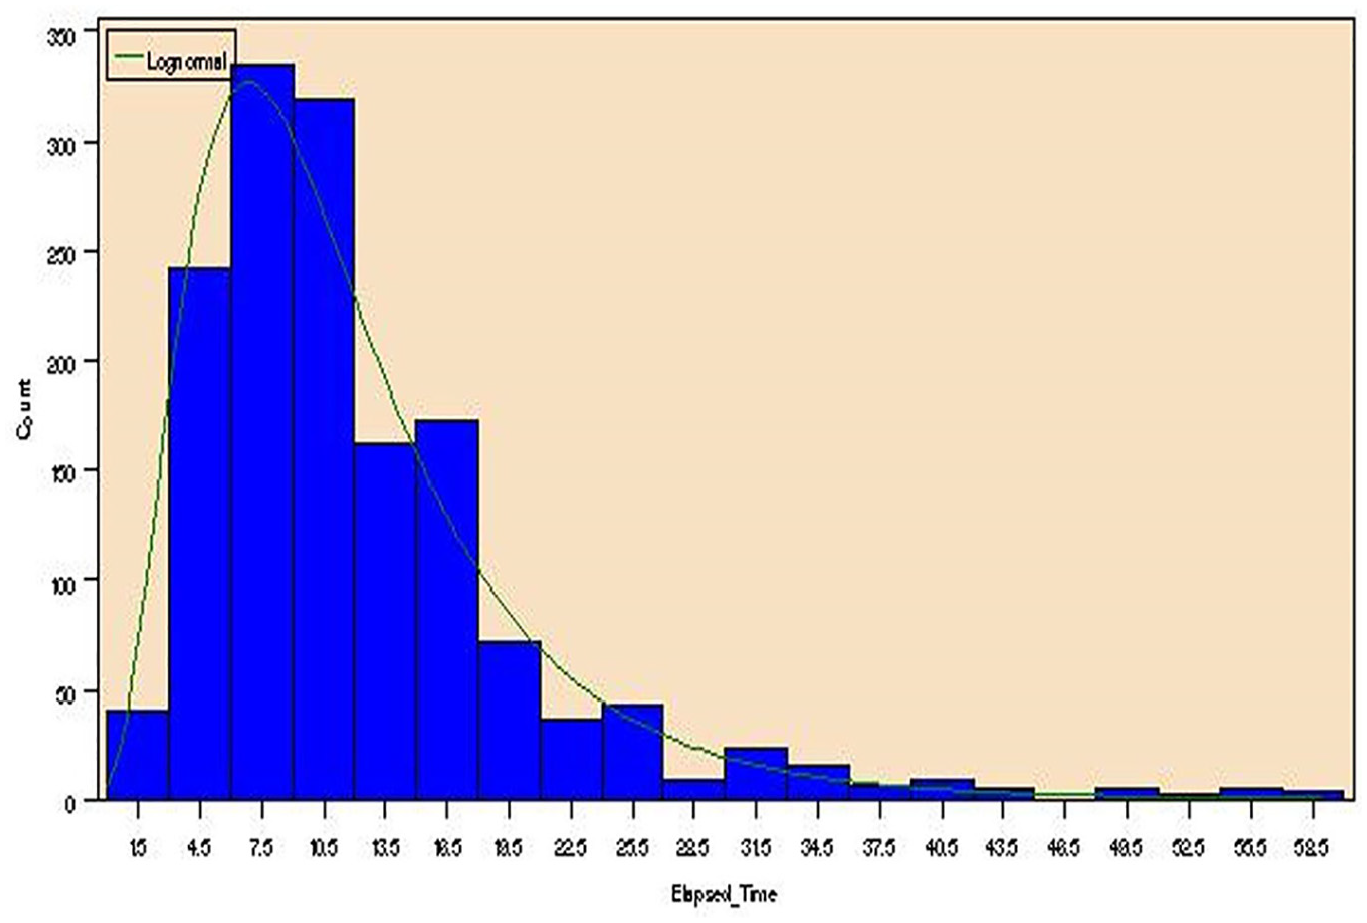
Lognormal probability distribution for the time to conduct deicing.
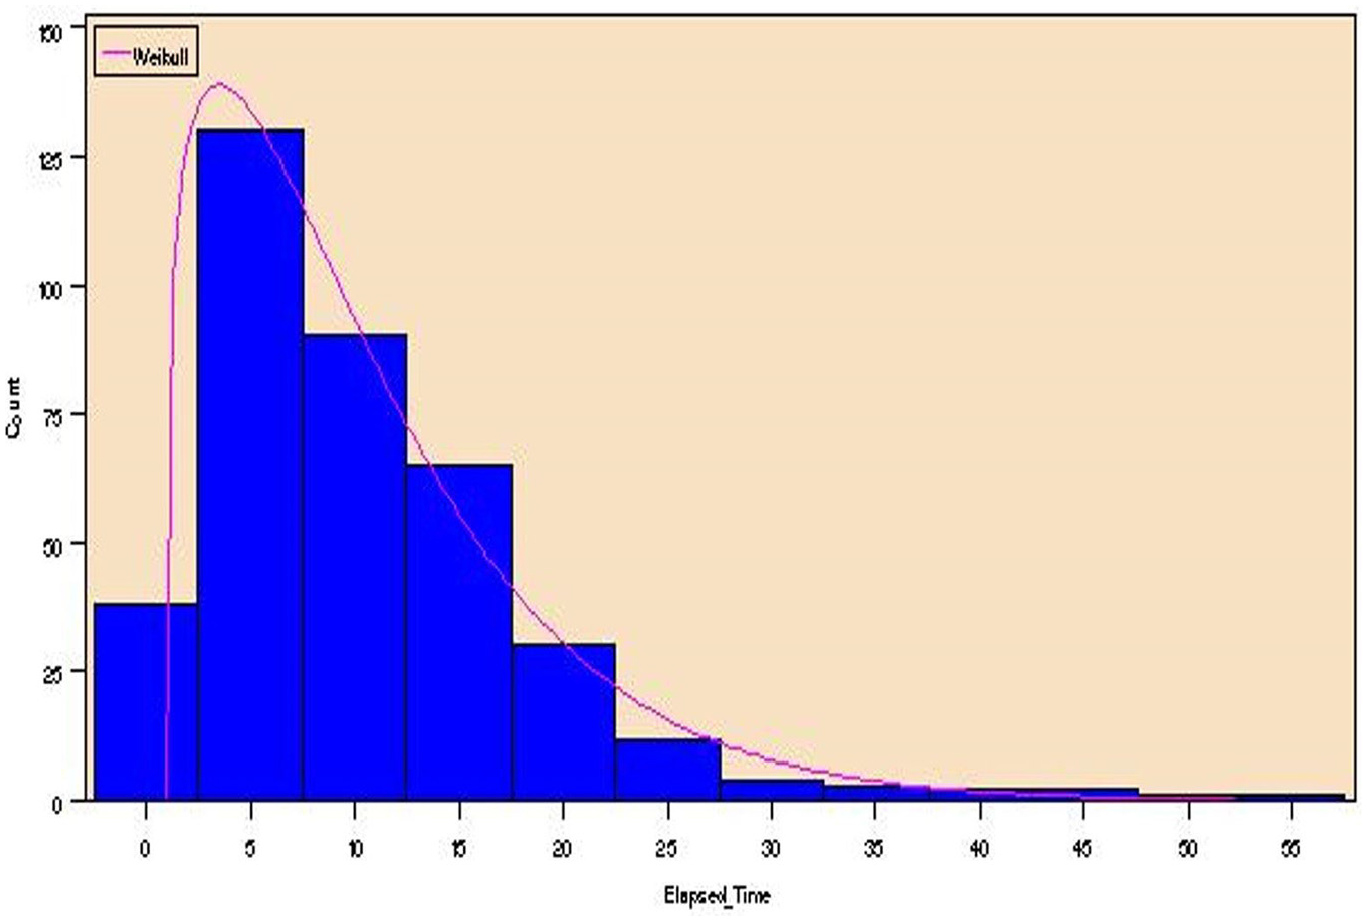
Weibull probability distribution for the time to conduct anti-icing.
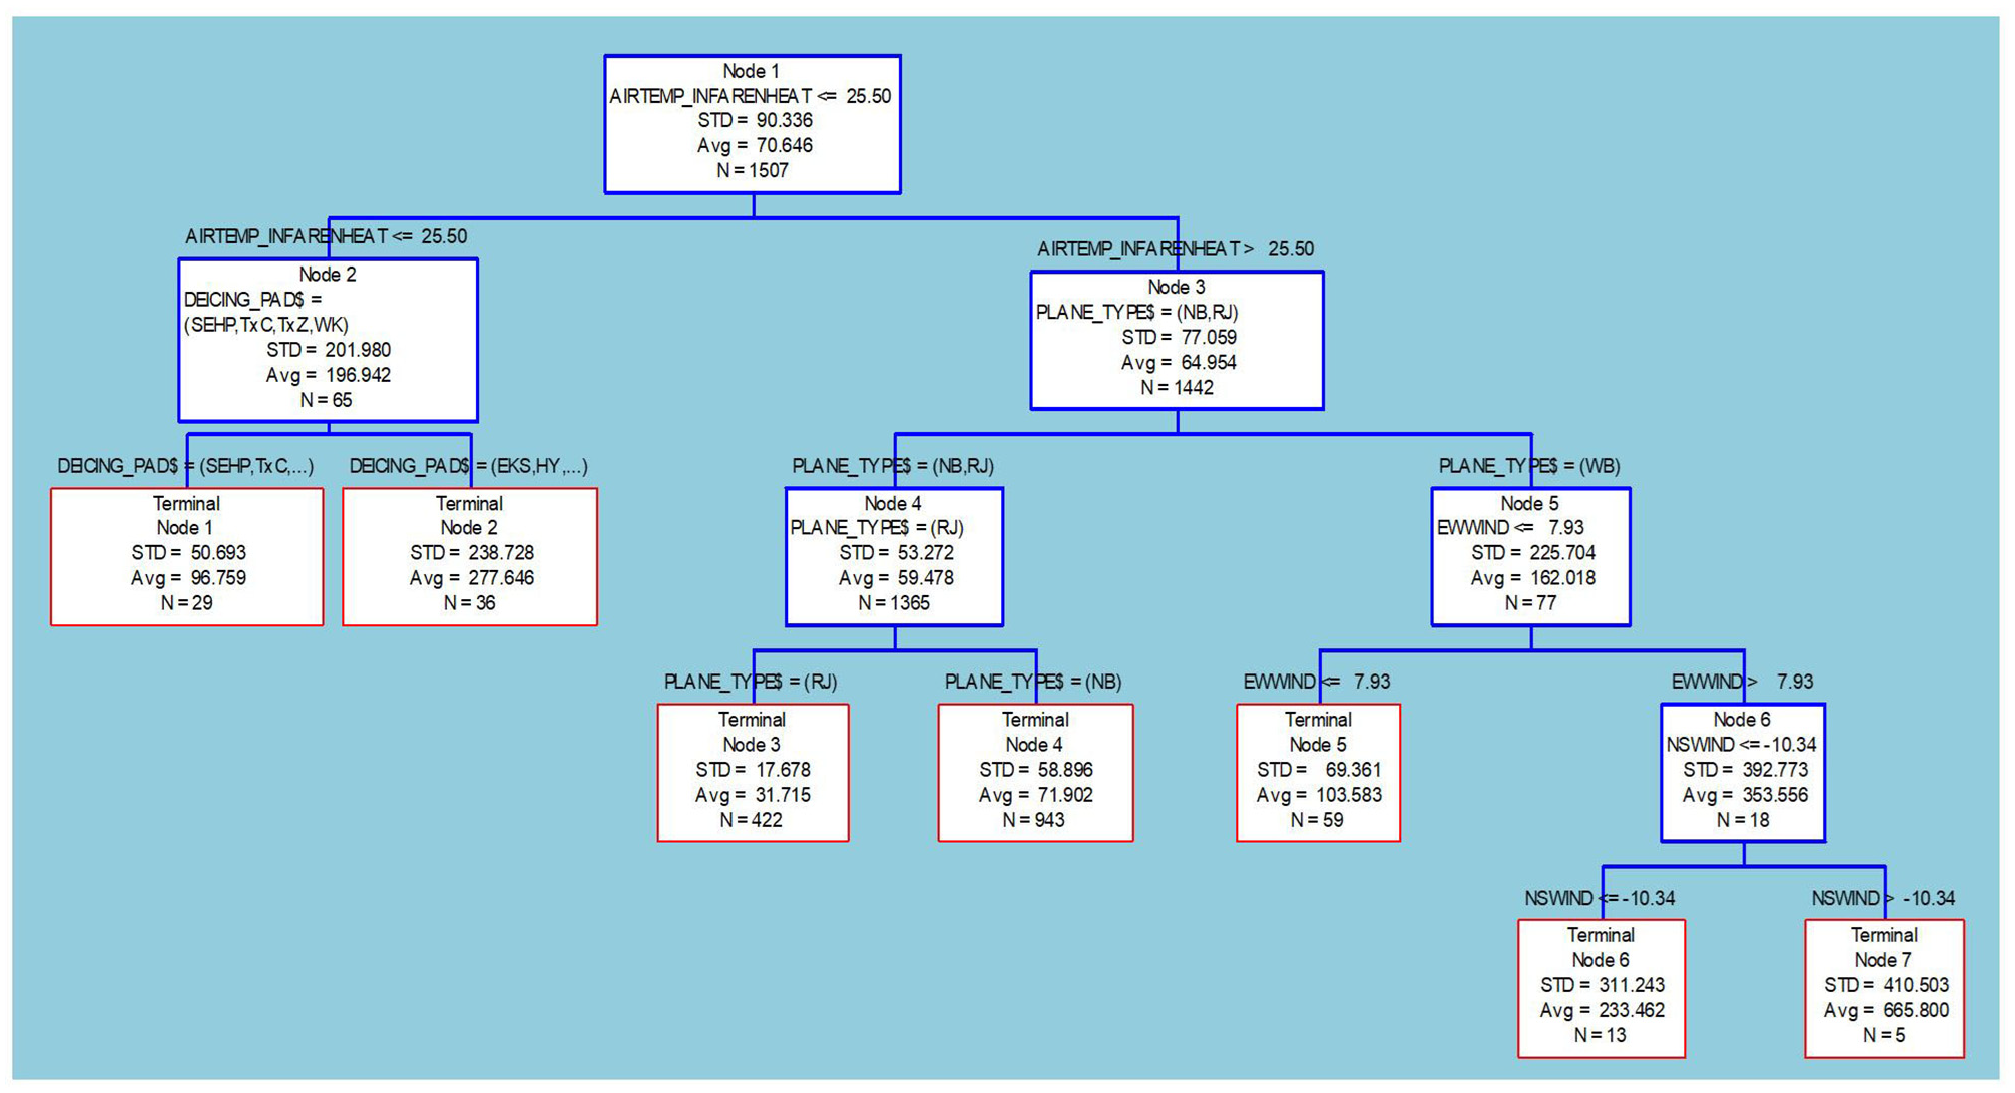
Regression tree that groups deicing glycol usage by meteorology, pad location, and aircraft size.
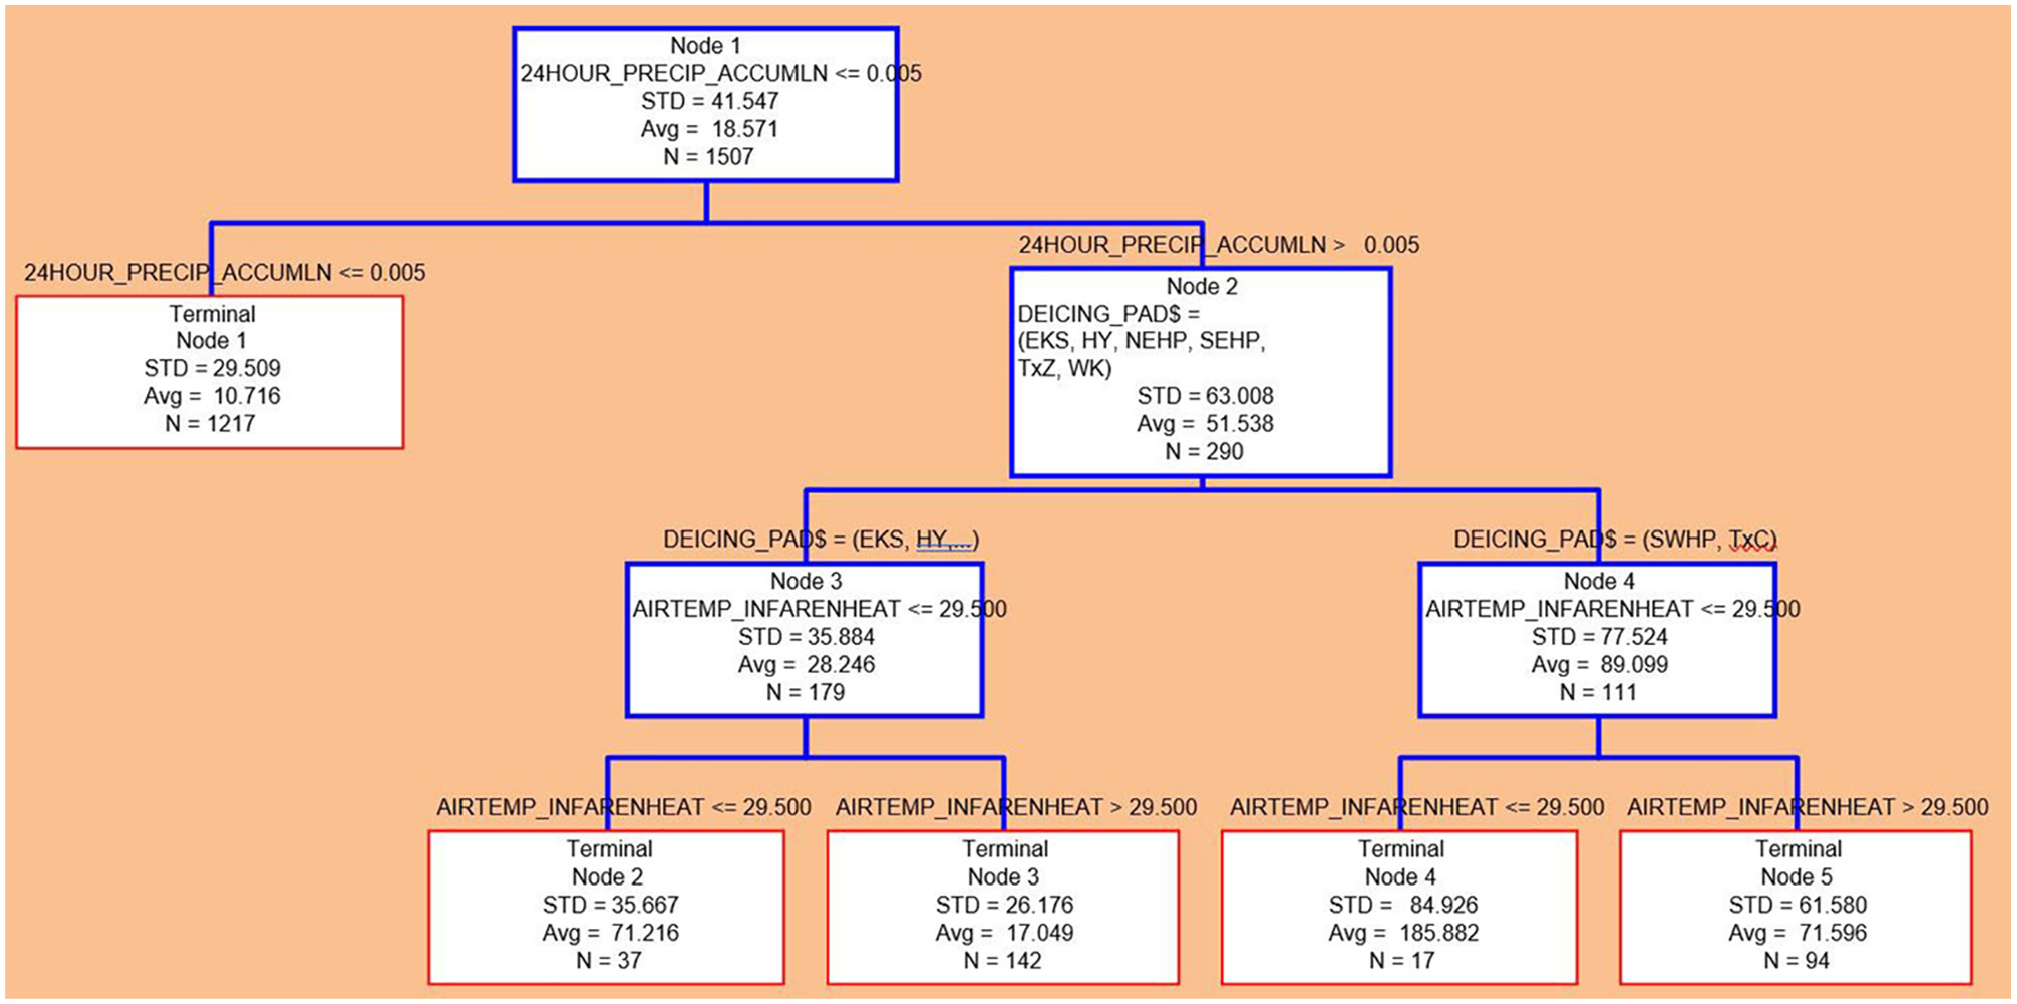
Regression tree that groups anti-icing glycol usage by meteorology, pad location, and aircraft size.
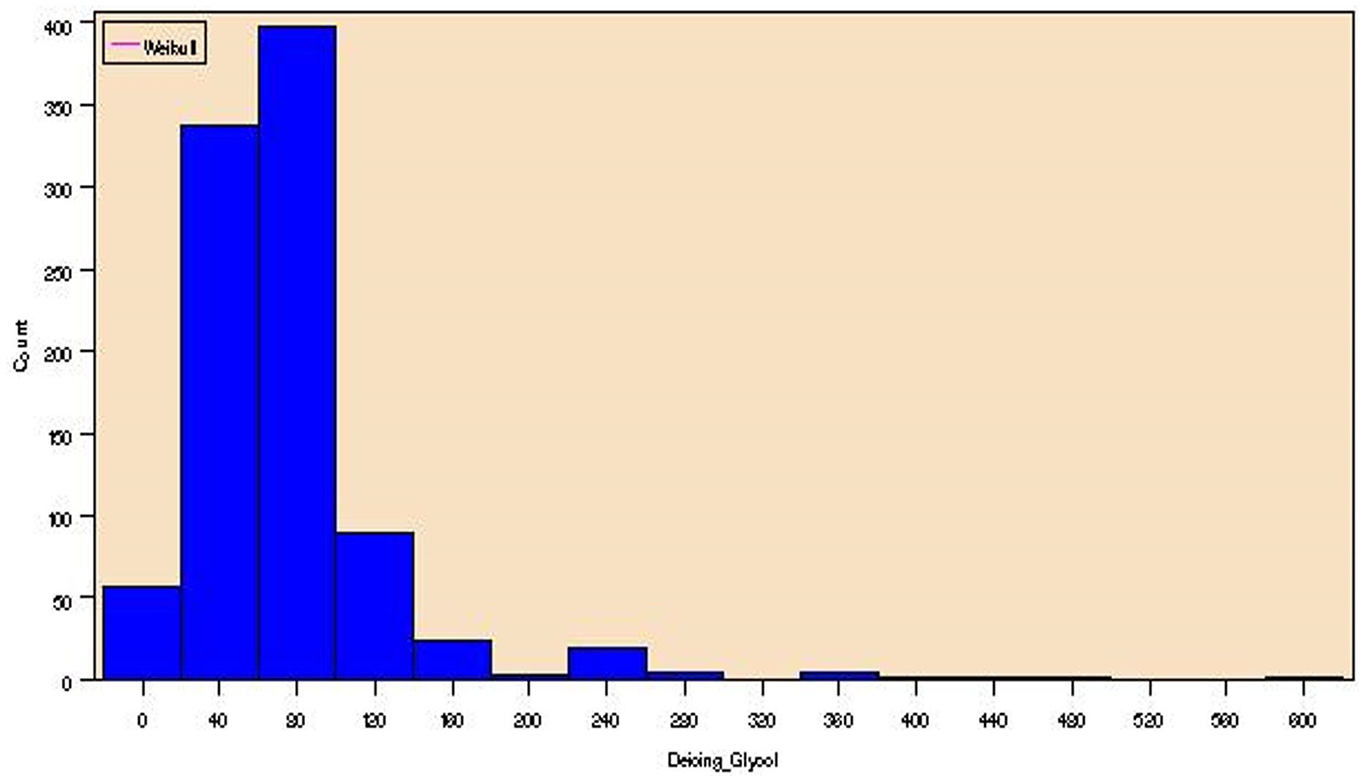
Deicing glycol usage probability distribution for Group 4 in Table 2.
Deicing glycol usage groups from regression tree.
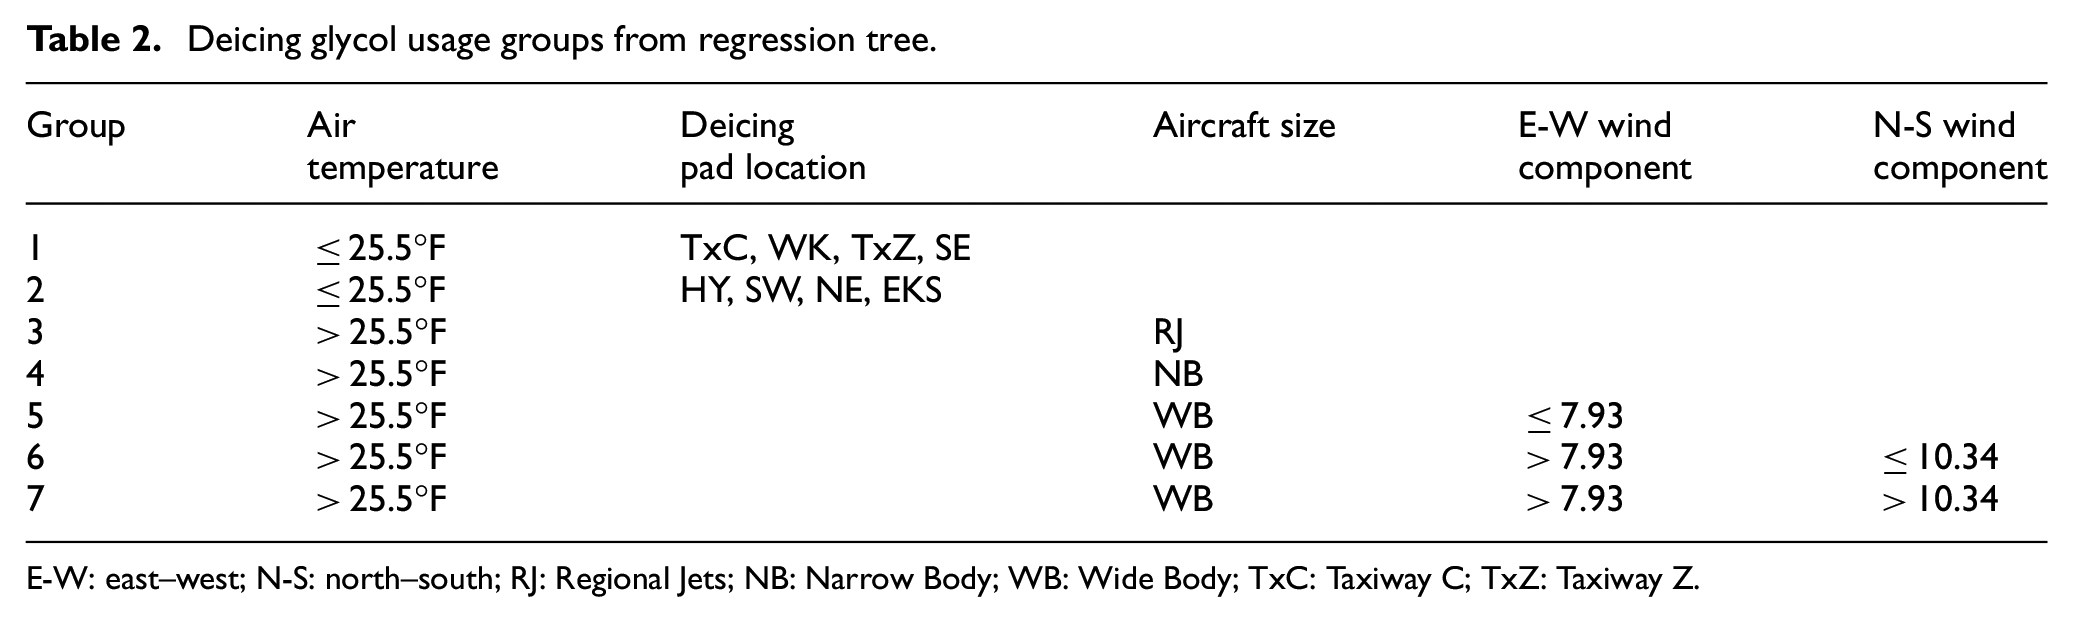
E-W: east–west; N-S: north–south; RJ: Regional Jets; NB: Narrow Body; WB: Wide Body; TxC: Taxiway C; TxZ: Taxiway Z.
Anti-icing glycol usage groups from regression tree.
Finally, the probability of using a runway by different sizes of the aircraft after deicing at a particular deicing pad location (Table 4) was estimated. Since no deicing occurred at TxZ for the current project, TxZ was not employed in this case. Also, as the airplane should take off in a direction opposite to the wind direction, and DFW is laid out in an N-S direction, we only considered north-to-south and south-to-north wind directions in runway assignment. For instance, when wind direction is from south to north, the probability of NB-type aircraft deiced at the EKS pad location taking off from southbound runways 18R, 18L, 17R, and 17C equals 0.028, 0.12, 0.74, and 0.09, respectively. Thus, this NB-type aircraft will be assigned to the 17R runway for takeoff based on the probability values.
Probabilities of aircraft using a runway after being deiced at a deicing pad location.
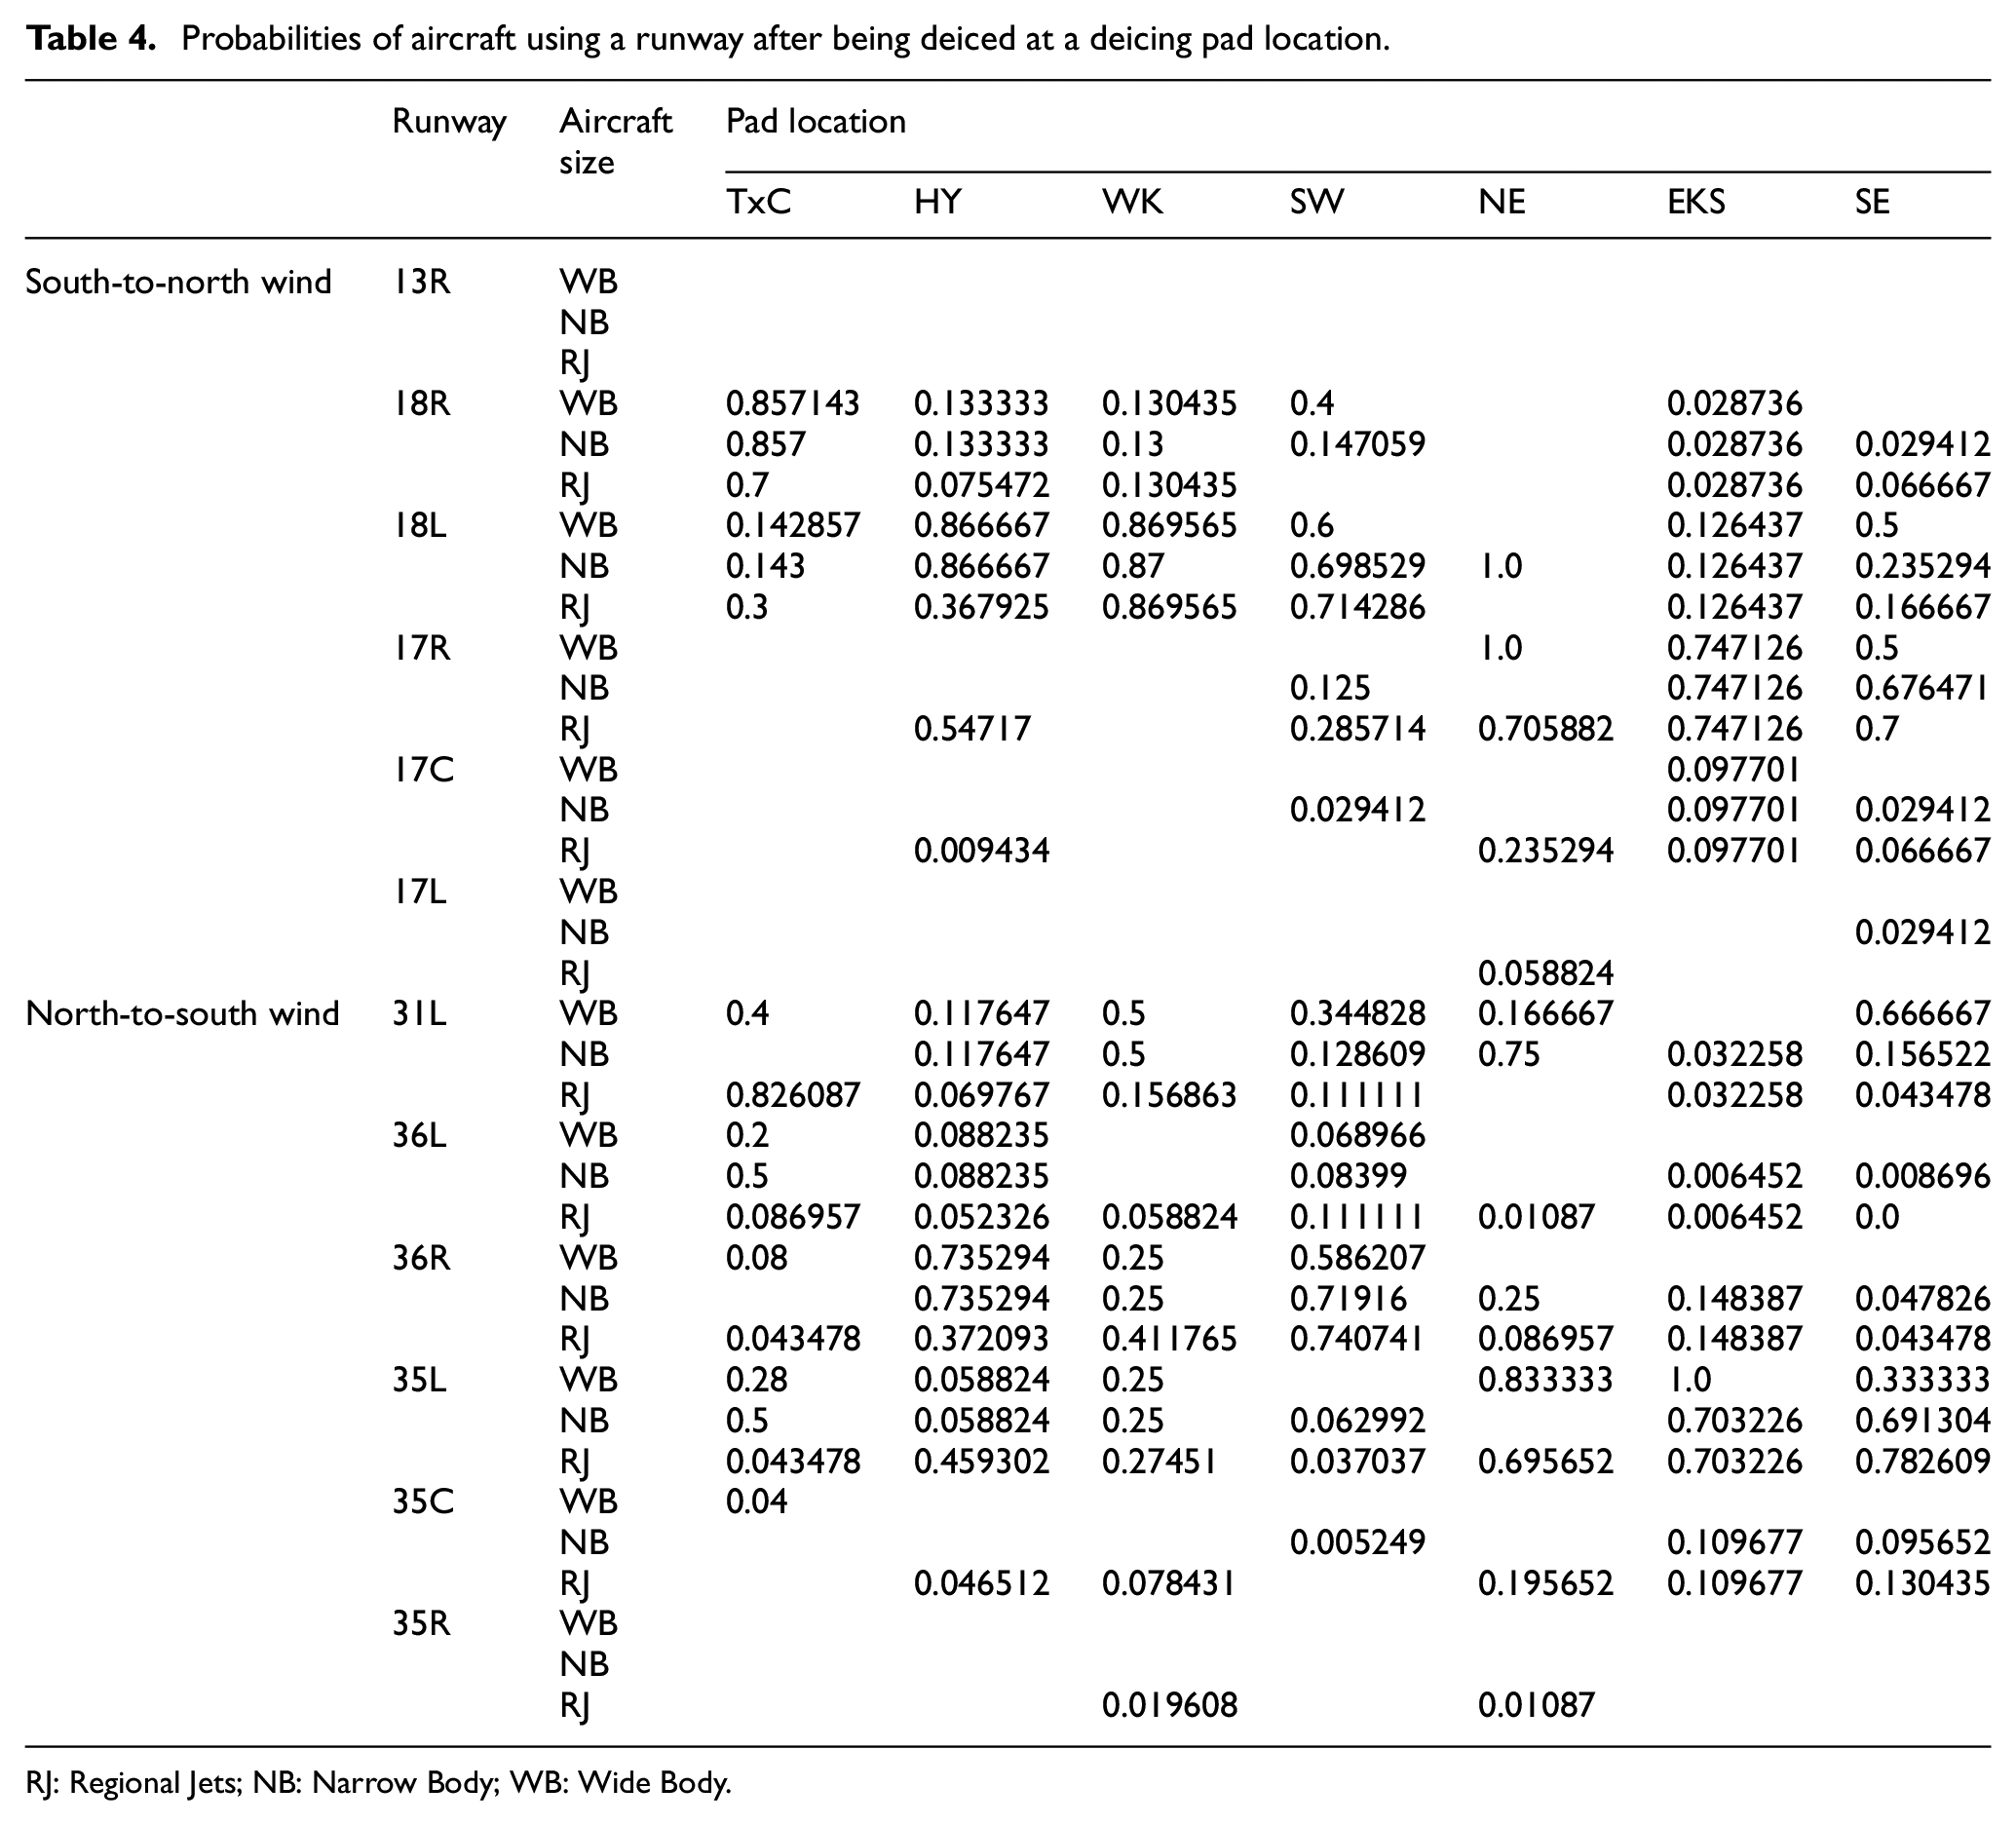
RJ: Regional Jets; NB: Narrow Body; WB: Wide Body.
3.3. DFW Airport state transition modeling
3.3.1. FDR procedure and variable selection
The state variables describe the conditions of the deicing system at the beginning of each hour. For the DFW Airport, the three data sets described in Section 3.1 were merged and resulted in seven groups of variables. The first group is Weather with five variables. The second group is Water with two variables at three monitoring sites, resulting in 2 × 3 = 6 predictor variables. The third group is Pad (Glycol), with two variables for seven pad locations, resulting in 2 × 7 = 14 variables. The fourth group is runway (RW, Glycol), involving two variables for 12 runways resulting in 12 × 2 = 24 variables. The fifth group is Pad (#Plane), including three variables at seven pad locations, resulting in 3 × 7 = 21 variables. The sixth group is RW (#Plane), with three variables for 12 runways, resulting in 3 × 12 = 36 variables. The last group is Pad-RW, consisting of five variables at 12 × 7 = 84 Runway–Pad combinations, resulting in 84 × 5 = 420 variables. The usage of by-Pad-RW combination variables in comparison with the separate by-Pad and by-RW variables did not reveal any improvement in the prediction of DO with these interaction variables based on preliminary results. Therefore, they are excluded from FDR analyses. After removing the by-Pad-RW combination variables and nonactive variables, 85 variables remained as categorized in Table 5.
Initial dataset for FDR scenario listed by groups of predictors.
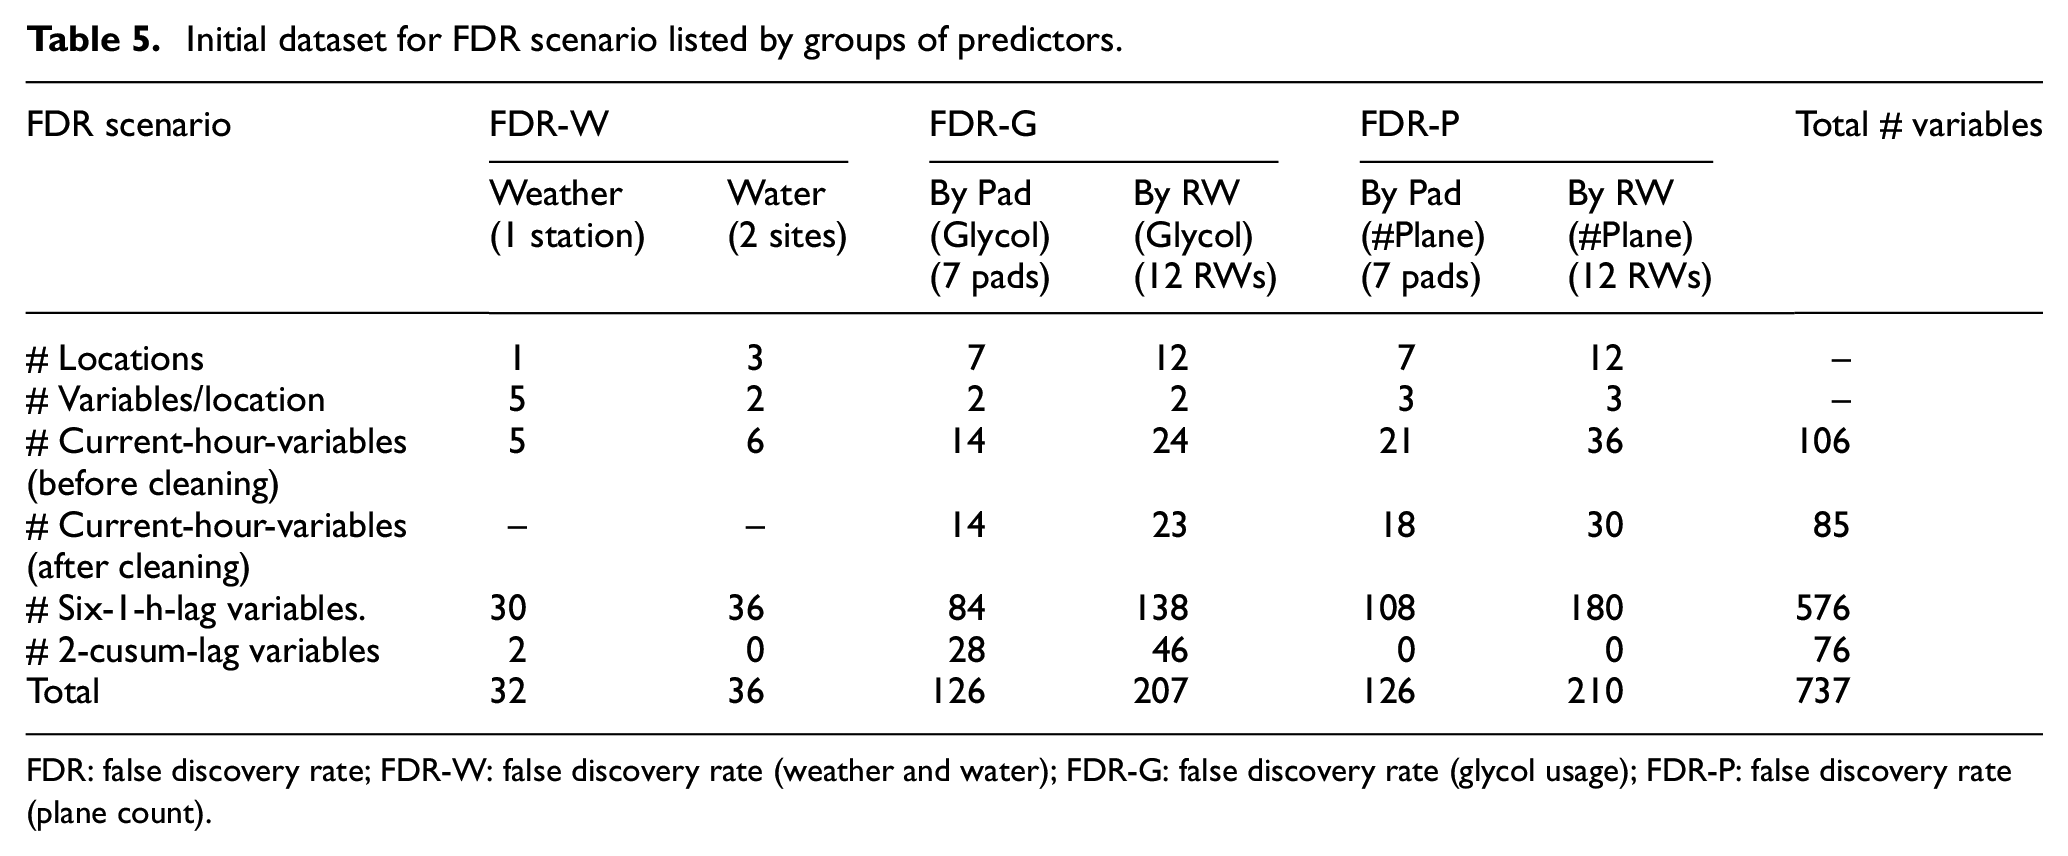
FDR: false discovery rate; FDR-W: false discovery rate (weather and water); FDR-G: false discovery rate (glycol usage); FDR-P: false discovery rate (plane count).
The description of each of the predictor variable groups in Table 5 is as follows:
Weather: Air temperature, precipitation, dew point, E-W wind, and N-S wind.
Water: DO level and water temperature at IN, OF19, and OUT sites.
By Pad (Glycol): Total deicing and anti-icing glycol associated with each pad location.
By RW (Glycol): Total deicing and anti-icing glycol associated with each runway.
By Pad (#Plane): Total number of WB, NB, and RJ planes deiced at each pad location.
By RW (#Plane): Total number of WB, NB, and RJ planes departing at each runway.
Lagged variables were then created for the modeling of temporal patterns (six 1-h-lag variables: 1-h lag of variables from 1- to 6-h lag {Lag01, Lag02, …, Lag06}, 2 cusum-lag variables: cumulative sum of hour-lag from 7- to 12-h lag and from 13- to 24-h lag {Cusum_Lag07_12, Cusum_Lag13_24}). One-hour lag variables were considered for all variables for the last 6 h (Lags 1, 2, 3, 4, 5, and 6), and 6-h cumulated lag variables were created for glycol usage and precipitation.
Regarding the large number of variables, dimension reduction via data mining is recommended. In this section, we employed an FDR-based procedure 29 to identify the important variables for predicting DO at three monitoring sites. To assess the nonstationary resolution of DO level over 24 h, we considered four 6-h periods. This time frame was chosen because plots of the DO over a time period showed that 6-h periods are sufficient to capture the nonstationary pattern. For example, the results from the FDR analysis for OF19 site are summarized in Table 6. It should be noted that OUT site did not exhibit a nonstationary pattern, and the state transition models in Section 2.4 for the DO level at OUT site were considered stationary.
Results of FDR analysis for OF19-DO.
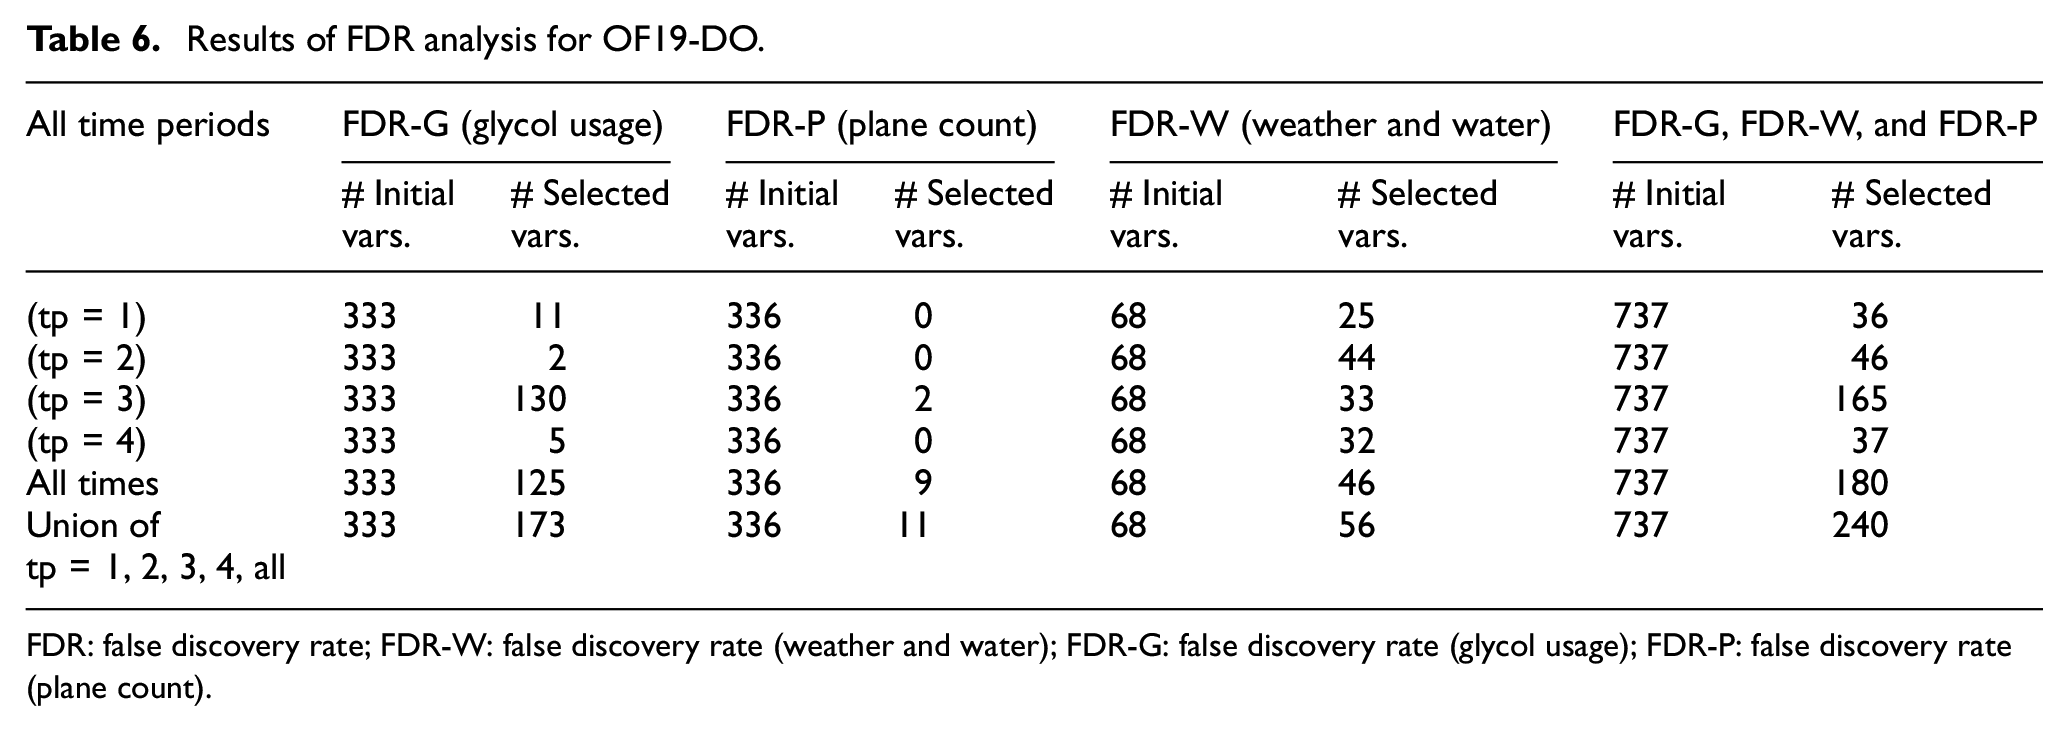
FDR: false discovery rate; FDR-W: false discovery rate (weather and water); FDR-G: false discovery rate (glycol usage); FDR-P: false discovery rate (plane count).
The results presented in Table 6 are divided into three sections: FDR-G (glycol usage), FDR-P (plane count), and FDR-W (weather and water). Six FDR results can be found in Table 6 for each section separated by time periods (tp), including 1, 2, 3, and 4; a combination of all the periods; and the union of the results across all time periods. The union of the results shows that FDR-G selects 173 variables from 333 initial variables, while FDR-P and FDR-W select 11 and 56 variables from 336 and 68 initial variables, respectively. These 240 selected variables were used as the final set of important variables in conducting the state transition model for OF19-DO.
3.3.2. Treed regression state transition functions
Since simulation timescale was hourly, the state of the deicing activities system at the beginning of each hour included meteorology, DO levels, and the numbers of airplanes with a given size class requiring deicing in the coming hour. For the simulation, meteorology data were provided from the historical record; the airplane count was determined according to the flight schedule. For DO levels, treed regression approach23,24 was applied to develop the state transition models to utilize in the simulation. The state transition models seek to predict a current hour’s DO level (at a particular monitoring site) based on past history as well as the current hour’s deicing pad allocation decision. For instance, to predict DO-IN at hour t, we need a state transition equation that is a function of water quality variables from anywhere before and up until t − 1 hours, meteorological history, and decisions from hours t and earlier.
The treed regression conducted the analysis in two phases combining the decision trees and linear regression. While the first phase uses decision tree models to incorporate the deicing activities variables (deicing and anti-icing glycol amounts and plane counts), the second phase refines the approximation from the first phase using the multiple linear regression models based on the entire variables (including water quality and meteorological variables for the terminal node data from the decision trees of the first phase). As a case in point, we present the state transition models for DO-OF19 during the time period of 12 a.m.–6 a.m. Figure 9 displays the first-phase decision tree for modeling the transition of DO-OF19 from 1 h to the next during the time period of 12 a.m.–6 a.m. For any airplane, if Lag05_EKS_Total_Deicing (hourly accumulated deicing glycol at EKS, 5 h prior) is less than 18 mg/L, then it will be classified in Group 1, otherwise it will be placed in Group 2.

Decision tree groups for DO at site OF19(12 a.m.–6 a.m.).
In the second stage, we fitted the multiple linear regression models to the different data groups determined at the first phase. After fitting the regression models, we conducted the residual analysis and calculated R-squared (R 2 ) values to check the adequacy and goodness of fit of the models. The fitted linear regression models and corresponding R 2 values (where values close to 1.0 indicate excellent fit) for DO-OF19 during the time period of 12 a.m.–6 a.m. for Groups 1 and 2 are shown in Table 7.
Estimated hourly state transition equations for DO at site OF19 during 12 a.m.–6 a.m.
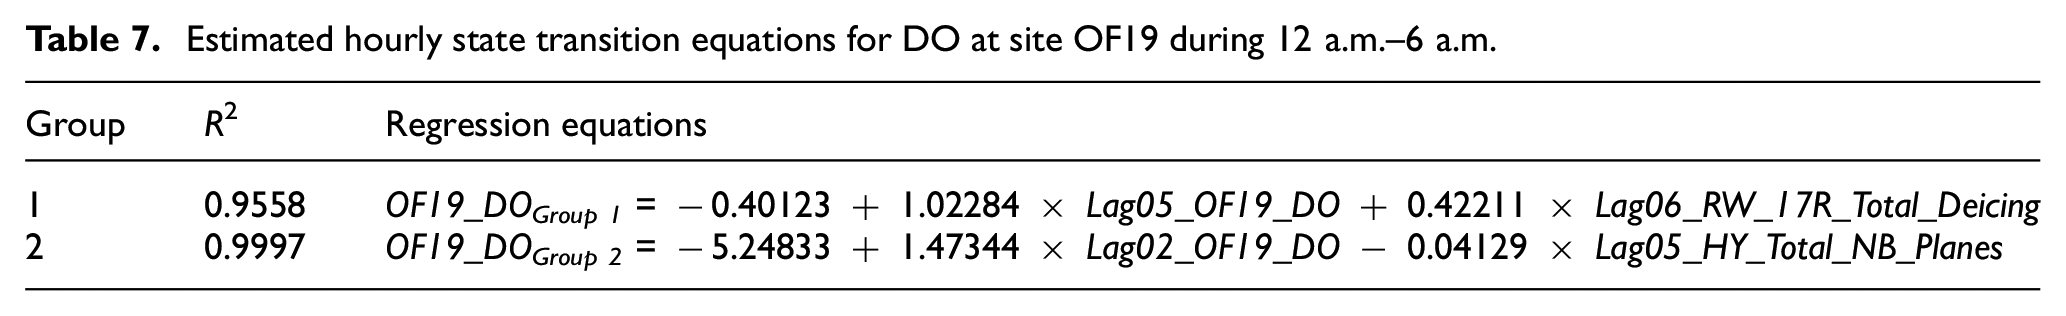
The description of the variables in state transition models is also provided in the following:
Lag05_OF19_DO: Hourly averaged DO, 5 h prior.
Lag06_RW_17R_Total_Deicing: Deicing glycol on planes using Runway 17R, 6 h prior.
Lag02_OF19_DO: Hourly averaged DO, 2 h prior.
Lag05_HY_Total_NB_Planes: Total number of RJ aircraft deiced at Taxiway HY, 5 h prior.
4. DFW Airport simulation tool framework and model validation
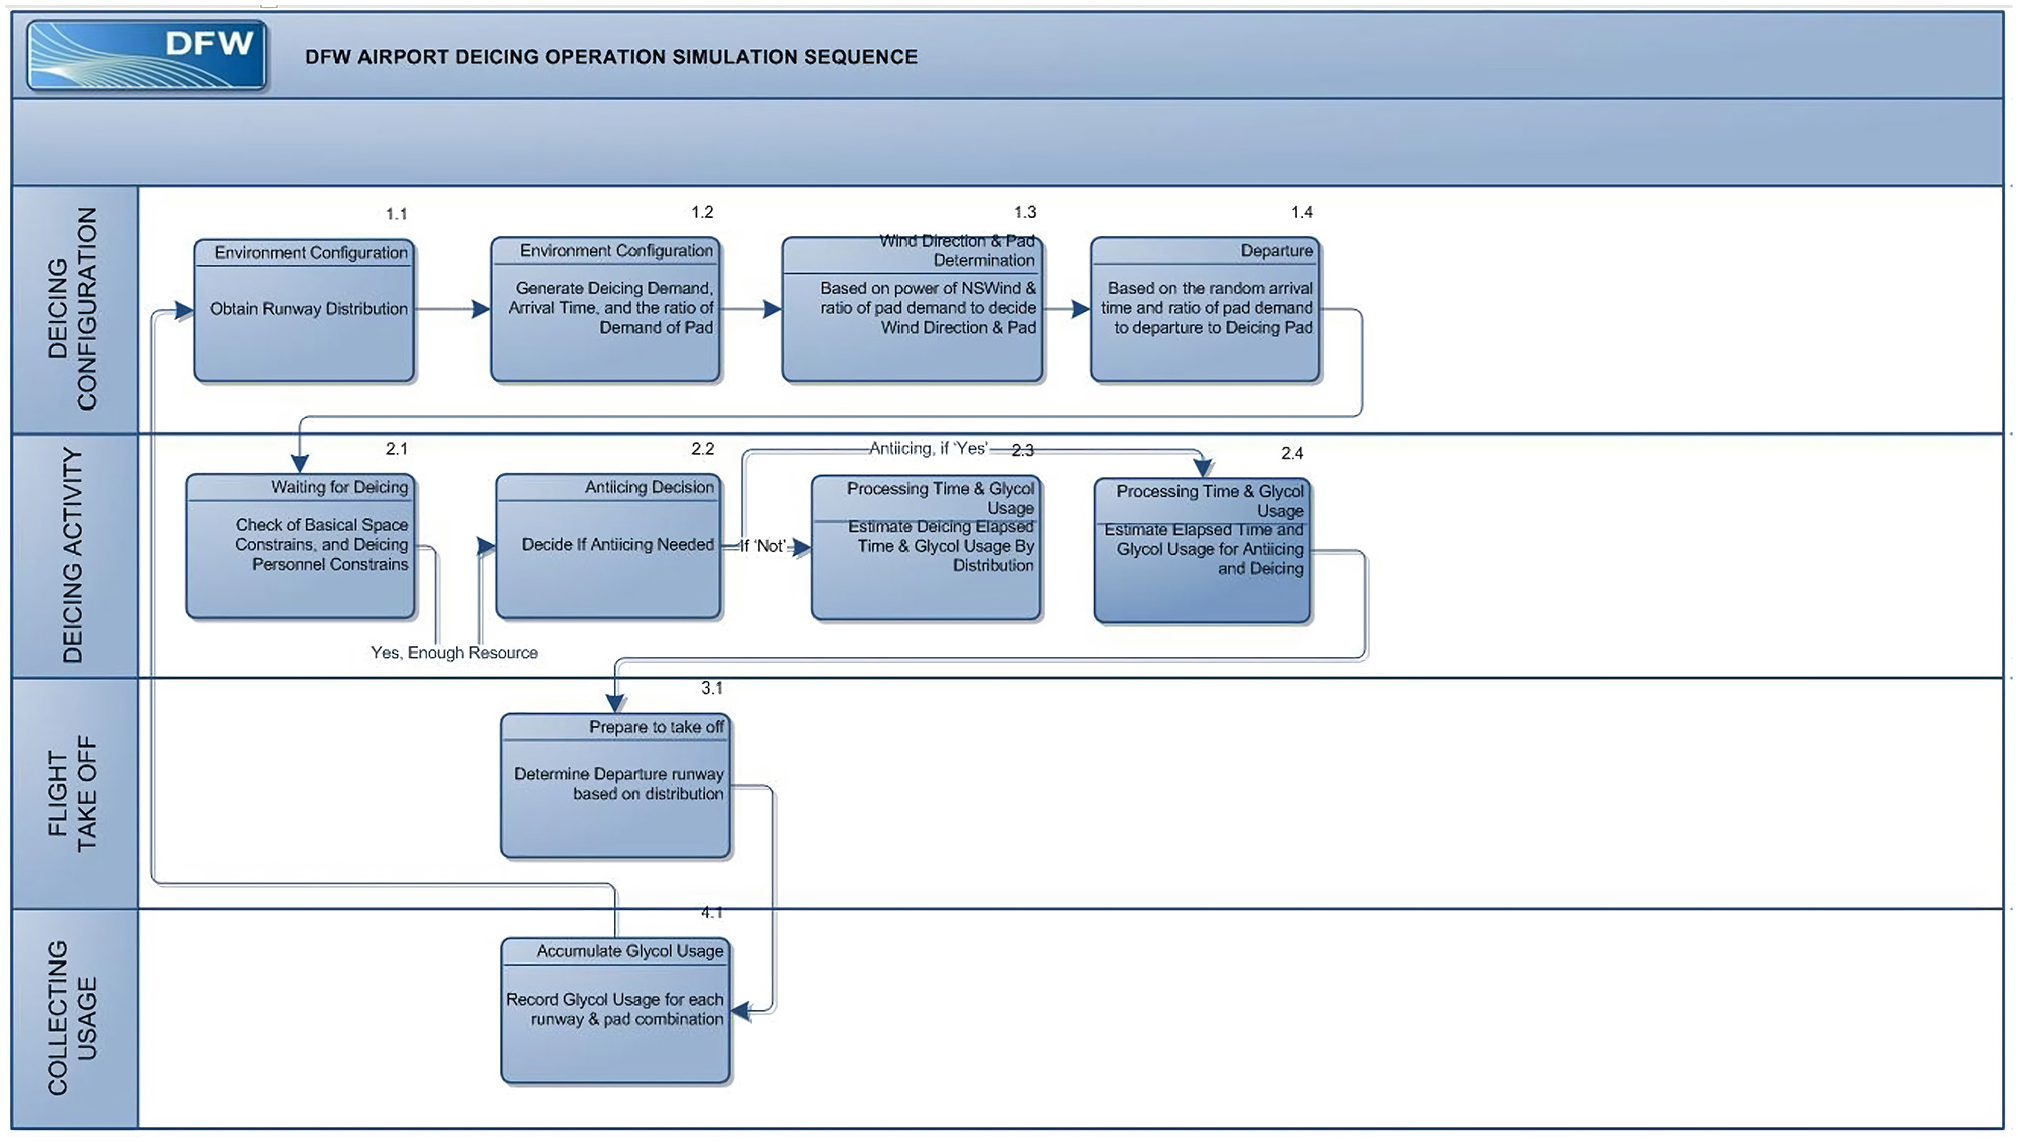
The framework of the simulation tool provided to DFW Airport is presented in this section. This DFW Airport simulation tool directly incorporates the probability distributions and state transition functions from Section 3. The simulation network can be seen in Figure 10. The proposed simulation model is developed in four main steps: deicing configuration, deicing activity, flight takeoff, and collecting usage. Each step consists of several modules and functions that are discussed in detail in Table 8. Moreover, Figure 11 illustrates the flowchart of the discrete-event simulation implementation.
Simulation network.
Model description.
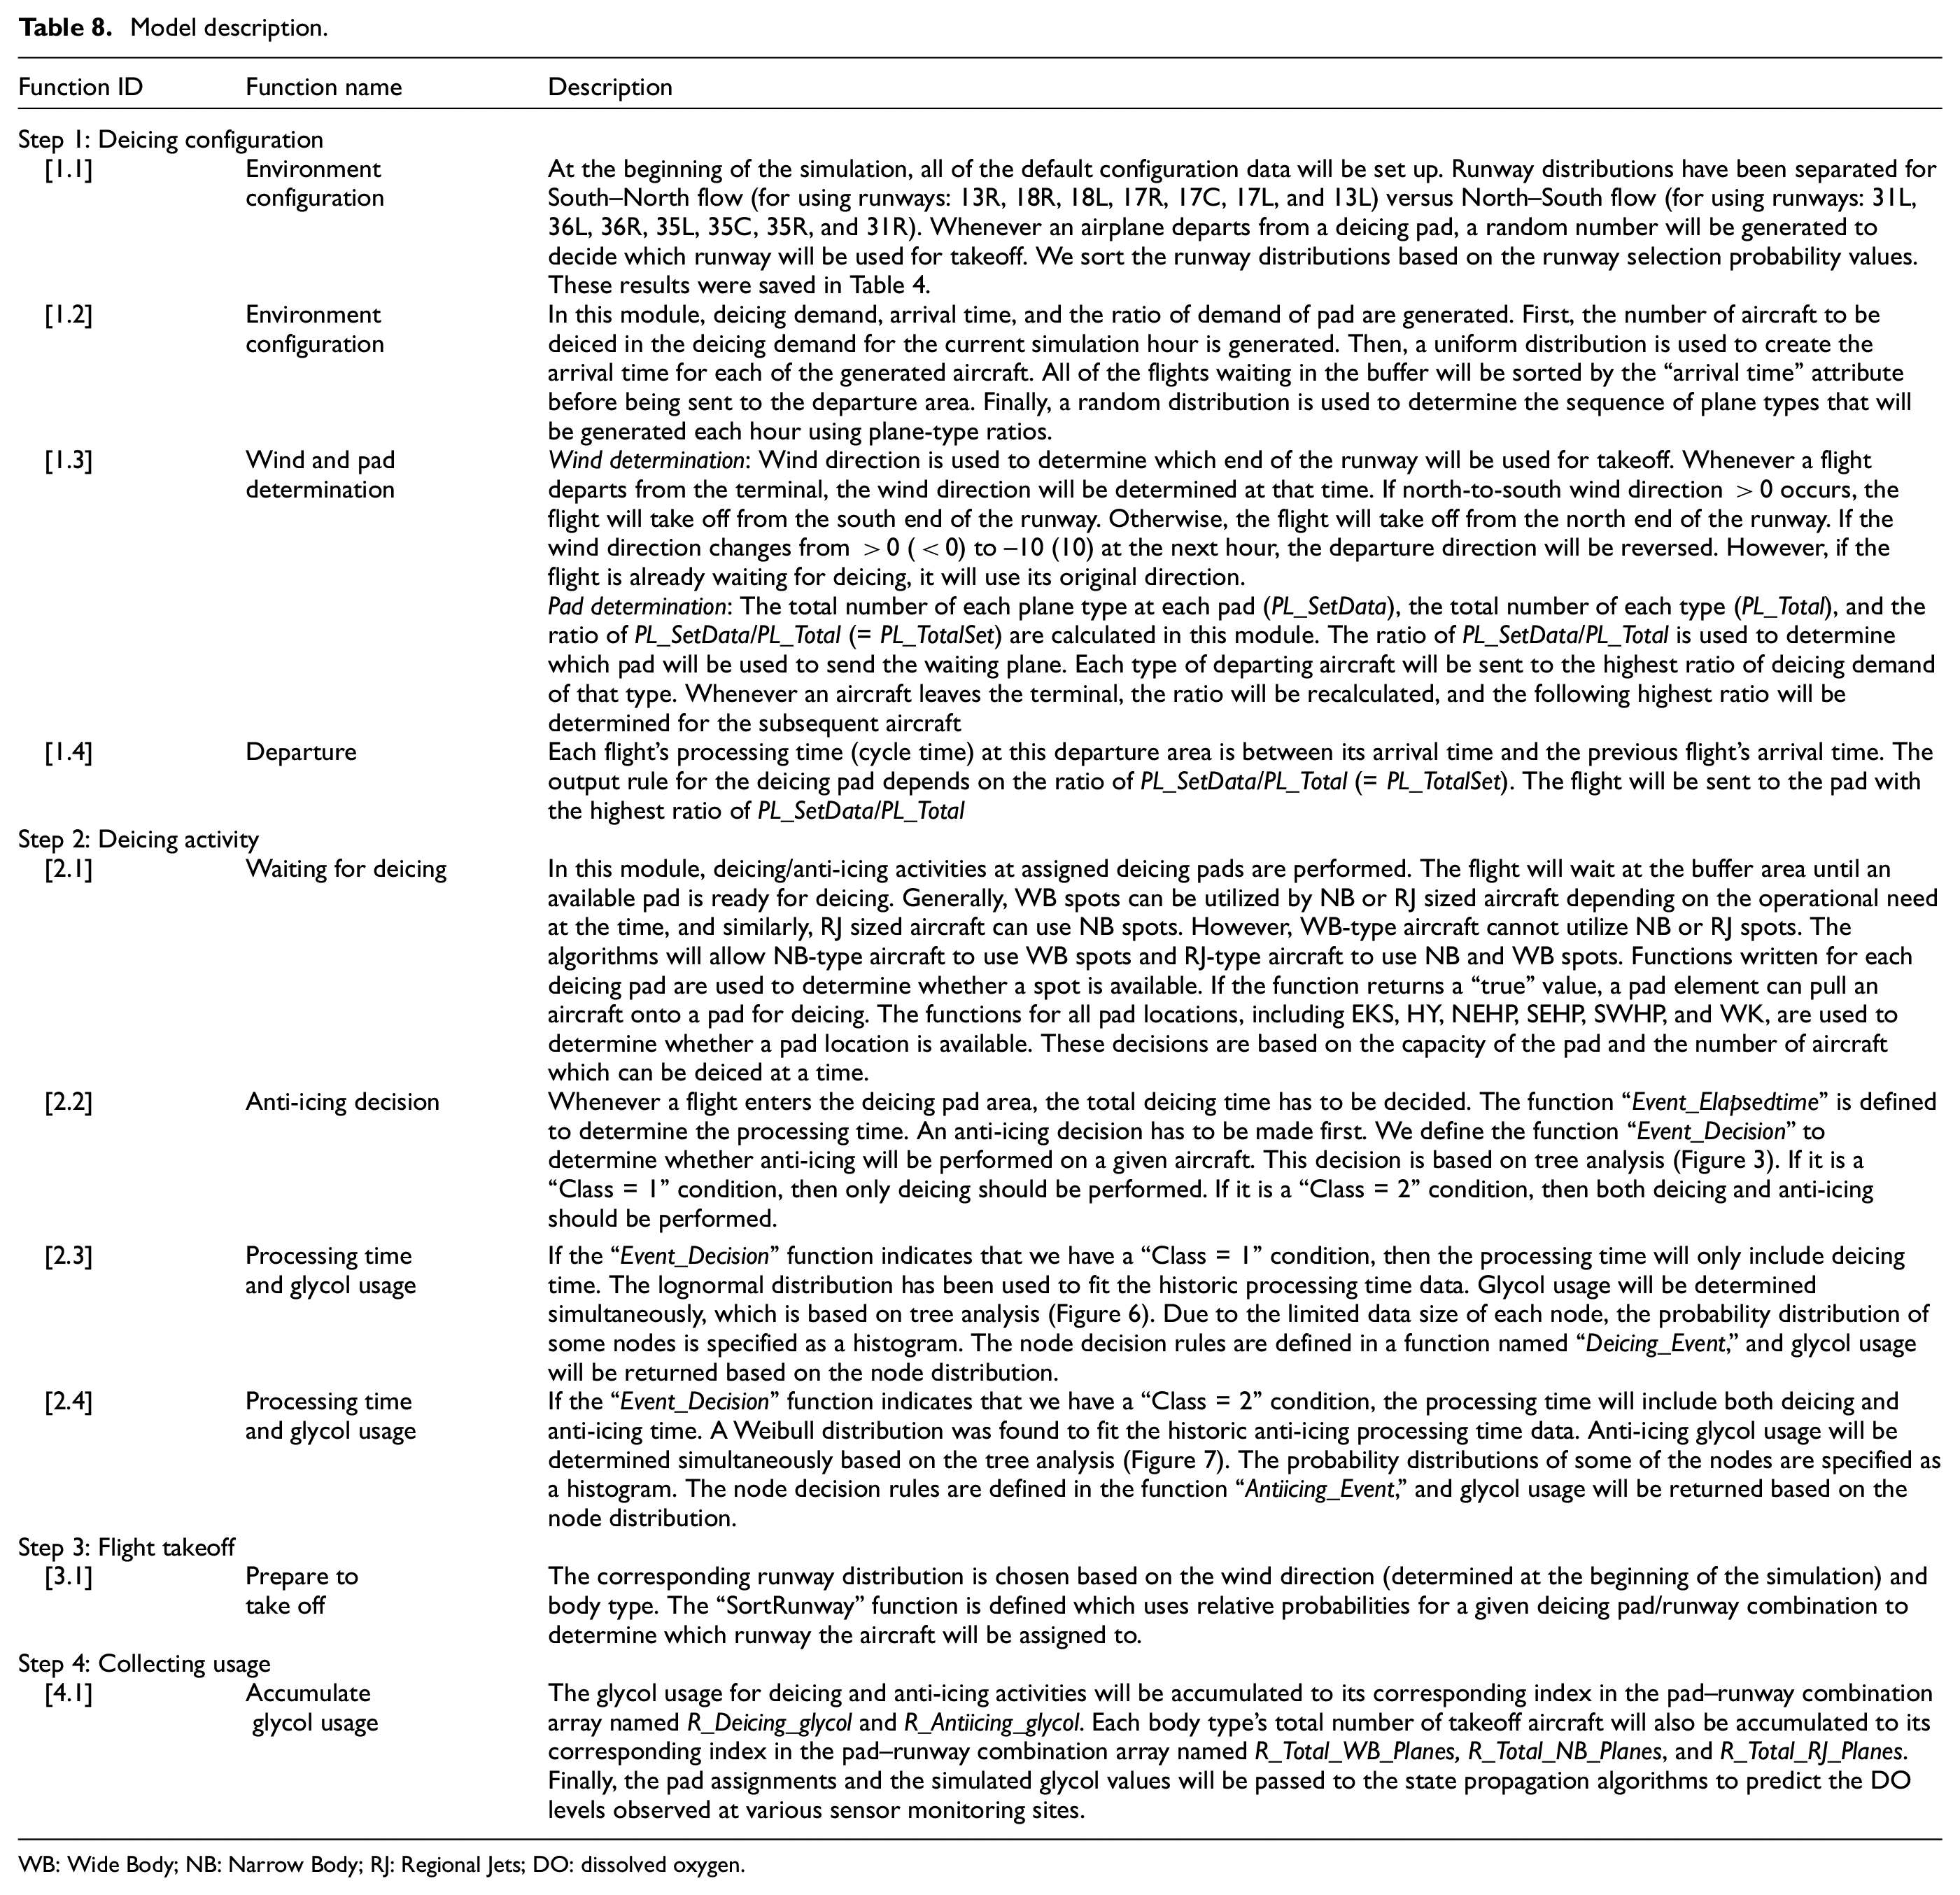
WB: Wide Body; NB: Narrow Body; RJ: Regional Jets; DO: dissolved oxygen.
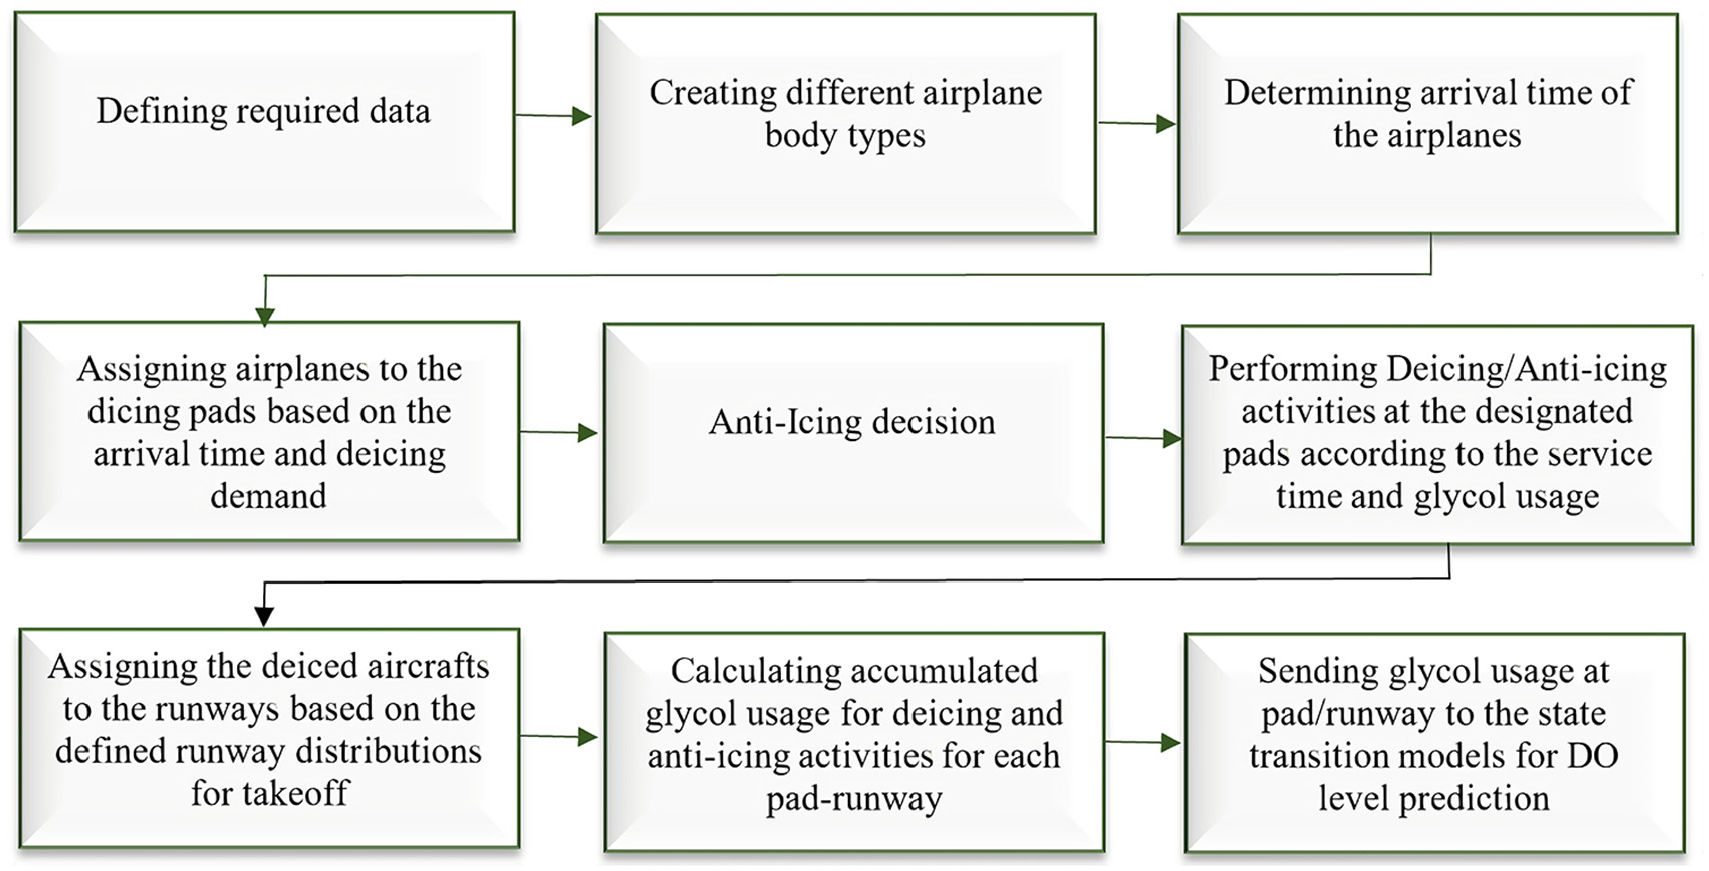
Structure of the simulation model.
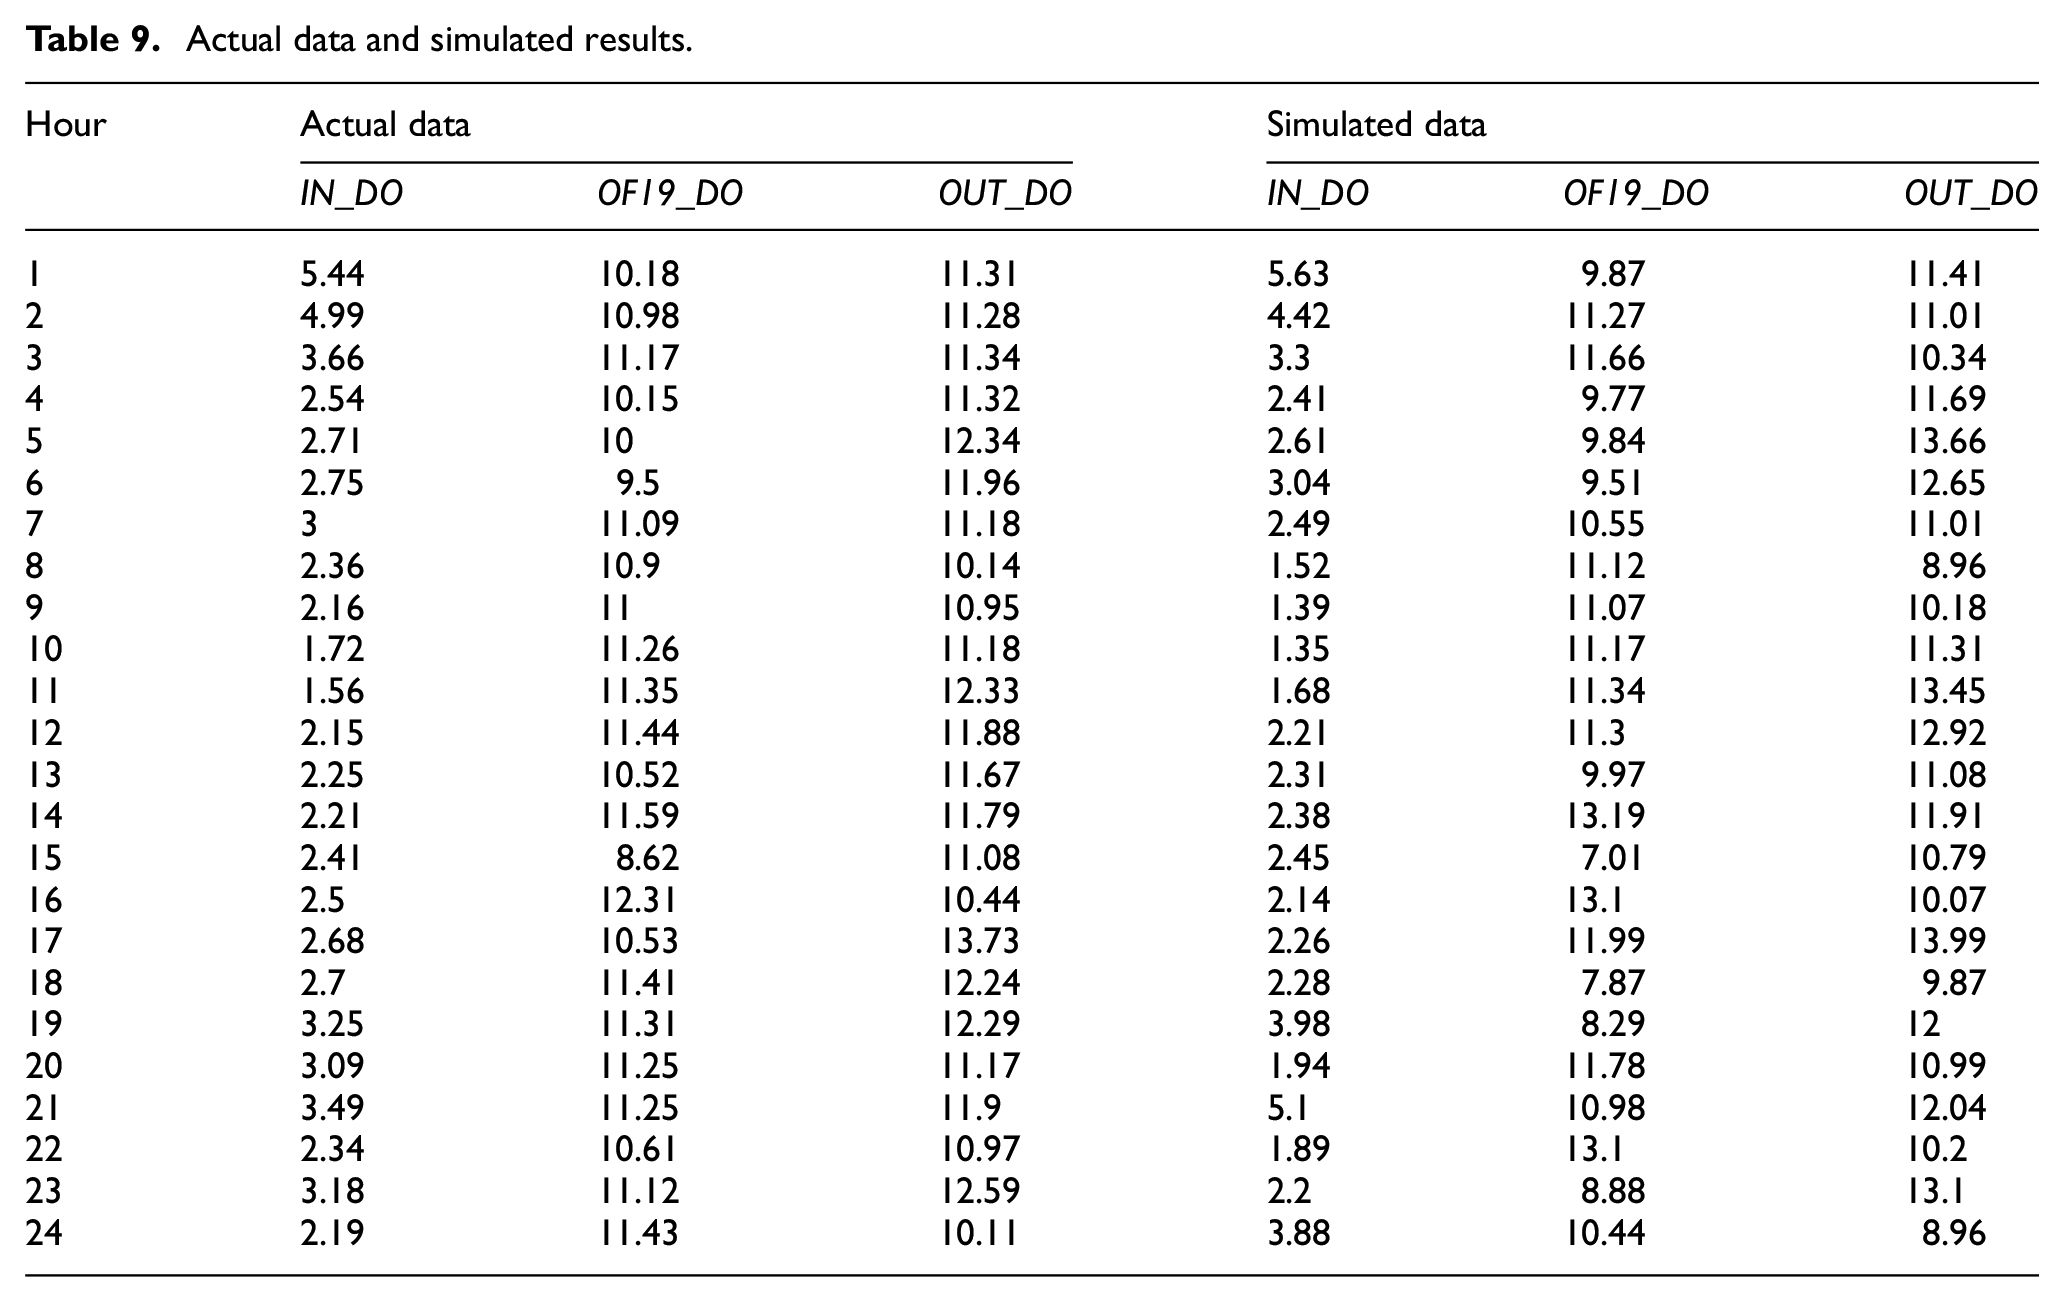
After running the simulation model, we need to verify the validity of the proposed model. To this end, we compared the simulation model results with the actual data. Therefore, to validate the model, we first collected actual and simulated DO levels at three water quality monitoring sites, including IN, OF19, and OUT. The simulated and actual DO levels at three sites over 24-h period are depicted in Table 9. Following this, we carried out a paired t test to investigate the equality of means of simulated and actual data for DO levels at different sites. The p values of tests corresponding to IN, OF19, and OUT sites were 0.474, 0.382, and 0.385, respectively. According to the p values for all three sites, which were greater than the significance level of 0.05, it was concluded that there is no significant difference between the averages of actual and simulated DO levels at the monitoring sites. Consequently, the validity of the proposed simulation model was verified. Moreover, the simulated and actual DO plots are presented in Figure 12. In the simulated plot, the values of DO in OF19 are higher because this site is located at the west of DFW Airport and is not much affected by ADF. Site IN has lower DO values as it is situated in upstream of the Trigg Lake and hence is heavily affected by ADF. The higher DO values of OUT (downstream of Trigg Lake) are indicative of the impact of aerators. This is also evidenced by actual DO plot. Due to the stochastic nature of the simulation and the fact that numerous values are generated from probability distribution (some of which are very wide-ranging), the simulated DO values will exhibit higher variability and an exact allocation of the planes to the pad locations will result in variable outputs in different runs.
Actual data and simulated results.
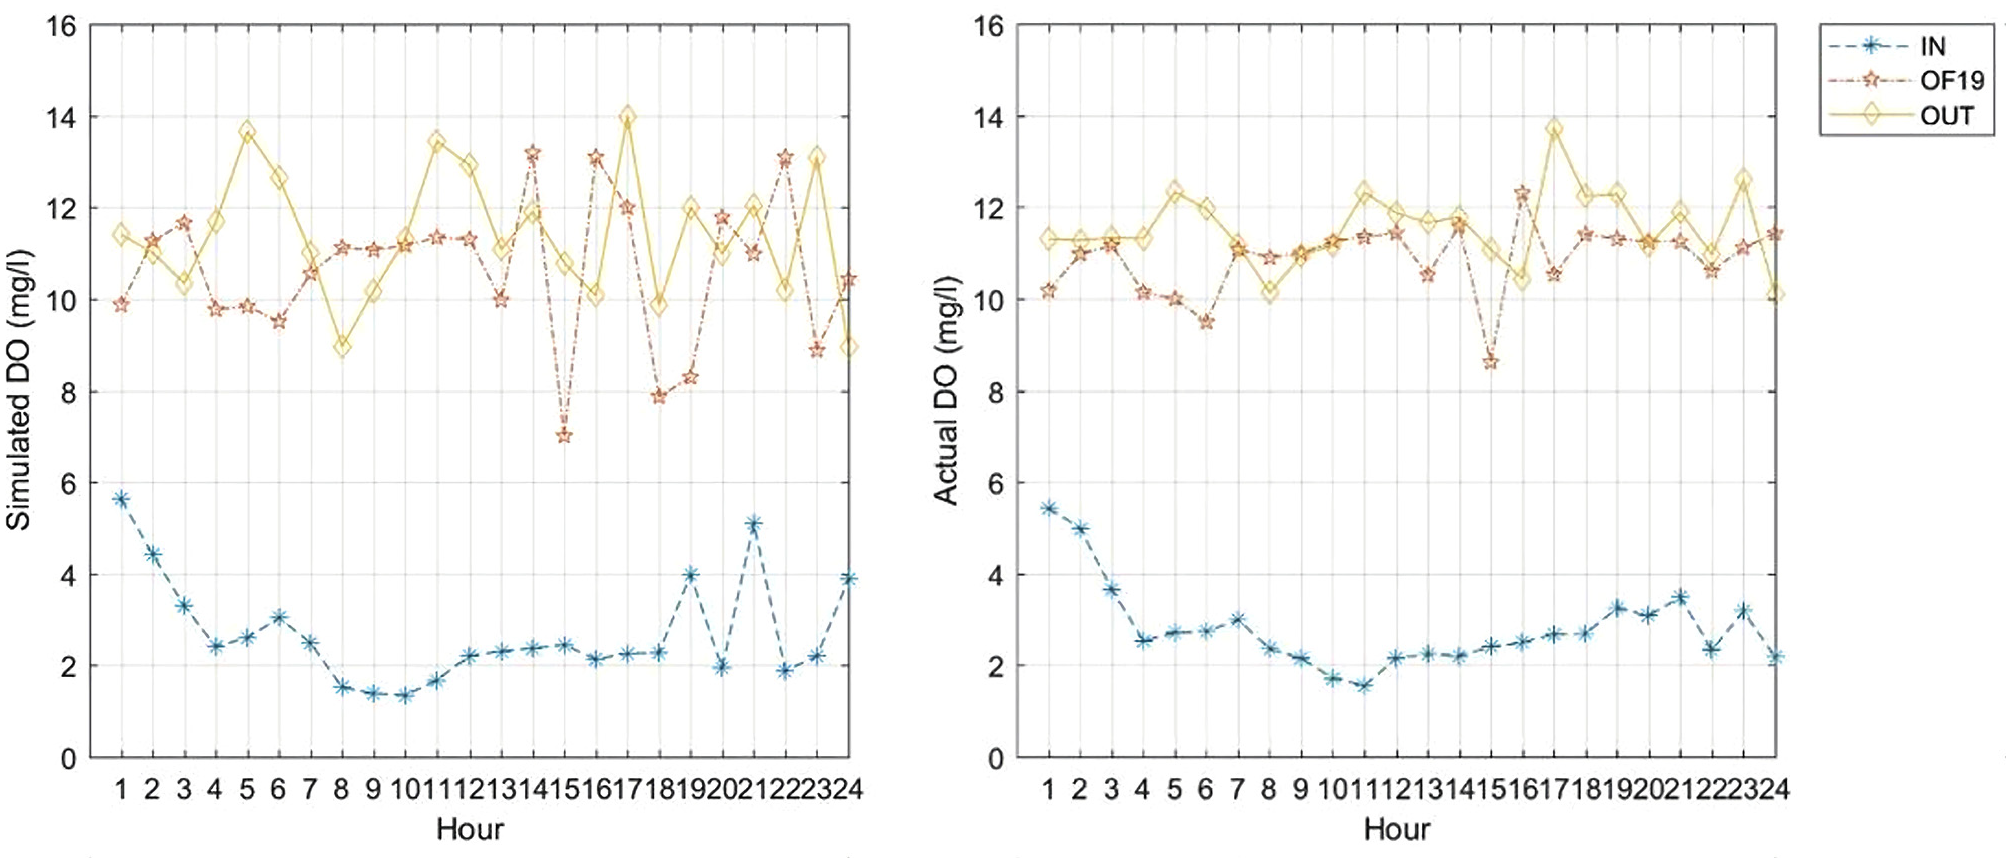
Simulated and actual DO (mg/L) plots for 31 January 2010 by the hour.
5. Conclusion
Deicing/anti-icing operations in airports will lead to the potential dispersal of glycol in waterways that in turn impacts the DO levels. Insufficient DO level in waterways is a serious risk to aquatic life, and DFW Airport uses deicing pads to handle this issue. However, a portion of the glycol-based fluid used in these activities can drip from airplanes during taxi and takeoff. In this regard, the current paper presented a data-driven discrete-event simulation model for assigning airplanes to the pad locations in airport deicing/anti-icing activities to assess and minimize the adverse environmental effects. The advantage of this tool is that it allows for the study of hypothetical deicing pad assignment decisions prior to actual assignment and without physical manipulation of the real system.
The state transition models and probability distributions were developed based on the meteorological, water quality, and deicing activities data to evolve the simulation tool to assess the effect of various deicing pad assignments on DO levels at three critical monitoring sites (OF19, IN, and OUT). The user selects a deicing event and simulates it; then he or she enters in the hourly aircraft departure counts and optionally deicing crew and supervisor levels at each of the deicing pad locations. The tool then simulates 24-h deicing activities and aircraft departure operations and simultaneously displays the predicted DO levels at critical monitoring sites. Most of this document was dedicated to present a simulation model that can be used to improve the pad assignment strategies to manage the DO levels at critical monitoring sites around the DFW Airport.
The proposed simulation model allows the user to simulate 9 historical deicing days; none of them captured the first day of a deicing event because the current simulation framework requires a complete history of the prior day, and water quality data were not provided for an entire day prior to a deicing event day. Hence, for future refinement of this work, continuous monitoring of water quality is recommended for every day of the deicing season, in conjunction with a continued implementation of the new data collection process for deicing-related activities.
Footnotes
Acknowledgements
In Memoriam of Dan Bergman, former Vice President of Environmental Affairs, Dallas-Fort Worth (DFW) Airport, TX, USA. Mr Bergman’s leadership and expertise were instrumental in the development of the simulation tool. We are also grateful to Rick Reeter, who led the data collection effort at DFW Airport.
Funding
This work was partially supported by the Dallas-Fort Worth (DFW) Airport and National Science Foundation, grant number ECCS-0801802.