






Abstract
A cellular automaton (CA) model with a finer discretization of space is proposed to simulate a non-emergency evacuation process in a room with an obstacle. During the evacuation process, a triangle “evading region” phenomenon has been observed through simulation and experiment on the upstream side of the spatial obstacle. In this paper, we use a simple method to generate an obstacle floor field corresponding to the triangle. We investigate the relationship between the pedestrian trajectories and the obstacle’s position. We also study the effect of the obstacle on evacuation time and average evacuation speed. Our study provides insights into the simulation of obstacle avoidance behavior of pedestrians in simple scenarios.
1. Introduction
With rapid economic development, significant events with crowded pedestrians are becoming increasingly common. Pedestrian safety accidents in large events have continued over the past two decades. For example, the stampede accident at the Astroworld Festival killed at least eight spectators and injured 300 others. 1 The high dense crowds usually mean high-security risks. Clogging usually happens when pedestrians need to pass through a relatively narrow exit, which is called the bottleneck. Pedestrian dynamics are complex at bottlenecks. The theory of pedestrian flow is one of the fundamental theories for the spatial layout design of walking facilities.2,3 Understanding pedestrian crowd dynamics is critical for efficient and safe crowd management. 4 Crowd control planning via simulation of people’s movement and behavior can promote safe departures from space. 5 The beginning of the study regarding the effect of obstacles on egress efficiency is Helbing’s work. In the paper of Helbing et al., 6 they prove that the escape rates of pedestrians under “panic” conditions will be enhanced if an obstacle, such as a column or a barrier, is asymmetrically placed on the “upstream” side of an exit. Since then, many simulation models have been proposed to research the influence mechanism of spatial obstacles on evacuation pedestrians.
The micro-simulation model of pedestrian flow can be classified into continuum and discrete models. The representative models of the two types are the social force (SF) model and the cellular automaton (CA) model. The SF model suggests that the motion of pedestrians can be described as if they would be subject to “social forces.” These “forces” are a measure of the internal motivations of individuals to perform certain actions (movements). 7 Yuan et al. 8 built an improved model based on the SF model to investigate the effect of emergency signs on evacuation dynamics under smoke conditions. In the CA model, long-range interactions between the pedestrians are mediated by the so-called floor field, which modifies the transition rates to neighboring cells. 9 These micro-simulation models are widely used to explore the fundamental role of the obstacle in a room evacuation. Through numerical simulation using an SF model improved by Mu et al., 10 the impact of the wedge design on the evacuation time of occupants is investigated. Kirchner et al. 11 investigate the role of conflicts in pedestrian traffic. A conflict indicates a situation in which two or more pedestrians try to enter the same space at one step. The conflicts between pedestrians are a result of the parallel update scheme and are helpful for an accurate description of pedestrian dynamics. In their study, the column subdivides the pedestrian flow and can reduce conflict, especially close to the exit. As a result, the existence of a column can reduce evacuation time. Tanimoto et al. 12 proposed an improved CA model for pedestrian dynamics considering both static floor field and collision effect derived from game theory. They vary the shape and location of an obstacle to study its effect and get a similar result as Kirchner et al.’s study. The extent to which an obstacle lowers the collision probability at the evacuation exit determines the magnitude of improvement to the flow.
Since any CA model is completely discretized, the parameters for the sizes and positions of an obstacle cannot be changed continuously. 13 Matsuoka et al. investigate the dynamics of pedestrians and clarify the effect of a disk-shaped obstacle with various sizes placed in several positions via numerical simulations for an SF model. The study finds that many optimal positions concentrate around a site shifted from the front of the exit. Yano 14 investigates the effect of the form of an obstacle on the time that a crowd takes to evacuate a room using SF model. Four shapes such as a cylindrical column, a triangular prism, a quadratic prism, and a diamond prism are studied. Furthermore, it is found that a cylindrical column works best in reducing the evacuation time. The study of Li et al. adds to previous studies on the obstacle in front of the exit. In the panic, it is hard for pedestrians unfamiliar with the evacuation environment to determine the exit location due to the barrier. They prove that ensuring a sufficiently large perception range is one of the most effective ways to decrease evacuation time. 15 Chen et al. proposed an improved SF model to study the effect of obstacles on evacuation time in a multi-exit room. Simulation results show that evacuation efficiency sensitively depends on the arrangement of obstacles. 16 The symmetrically placed obstacles are used to change the position of the arch formation in a crowd. Li et al. 17 prove that the proper spacing between symmetrically placed obstacles can alleviate congestion and increase evacuation efficiency.
In parallel with the development of numerical models, several controlled laboratory experiments to study the effect of the obstacle on the egress dynamics at bottlenecks have been conducted. Shi et al. 4 conducted a series of experiments to examine the effect of different geometrical layouts at the exit toward the pedestrian flow. The experimental setups involve pedestrian flow through 14 different geometrical configurations, including exit locations and obstacles near the exit under normal and slow-running conditions. It was found that the corner exit performed better than the middle exit under the same obstacle condition. In the study of Jia et al., 18 controlled experiments were conducted under various obstacle layouts in terms of obstacle size and distance to exit. The experiment results indicate that the obstacle can be used to adjust the pedestrian lane-formation status, thus controlling the egress efficiency. Jiang et al. 19 say that the obstacle settings should reduce the tangential momentum to obtain a high escape speed. The optimized configuration with pillars at the two sides of the exit supported the concept of reducing the tangential momentum to increase the escape speed. Their argument is supported by the experiment conducted in a gym. Due to ethical and safety reasons, the experiments with human participants are weakly competitive, and pushing each other is usually not allowed. However, in the drills conducted by Garcimartín et al., 20 pushing each other is allowed. Their experimental results demonstrate that the believed reduction of evacuation time caused by an obstacle should be revisited under highly competitive conditions. In the paper of Wang et al., 21 the SF model was calibrated with controlled human experiments with different competitiveness.
To study the behavior of panic pedestrians under emergency evacuation, experiments with non-human organisms, such as ants, sheep, and mice, have been conducted under panic conditions.22,23 Shiwakoti and Sarvi 24 conducted experiments with colony fragments of around 200 Argentine ants and induced rapid evacuation by injecting 10 μL of citronella oil (insect repellent) into the chamber. Zuriguel et al. collect their data at a farm where sheep herds are kept. They show, with live beings, the existence of a non-monotonous behavior of the flow rate versus obstacle position. 25 In the experiments of Kim et al., electric foot shock was used to induce panic in mice located in a designated waiting section. Then the escape velocity, escape time, and trajectory length were analyzed in a designated measurement section to compare the escape tendencies. 26 Their experimental results reveal that there exists an optimal location for the obstacle relative to the exit. However, animals and humans differ in many aspects, such as body constitution and shape, navigation capabilities, and intelligence. 27 As a result, animal experiments make it impossible to predict the behavior of pedestrians during an emergency evacuation successfully.
The effect of obstacles near an exit on the pedestrian dynamics at bottleneck has been of considerable interest to the research community working on evacuation and pedestrians’ crowd safety. 28 As mentioned above, various studies on obstacles have been done through experiments and simulation. On the one hand, the influence of obstacles on evacuation efficiency is related to obstacle shape, obstacle size, and position, which means the experimental results in different scenarios could be different. On the other hand, some persuasive conclusions about optimal obstacle shape and layout have been derived through computer simulation and experiments. 29 A spatial obstacle is often set in the walking facility to help increase the egress efficiency. It is hypothesized that the obstacle absorbs physical pressures from the dense pedestrian crowd and increases the outflow of pedestrians. Decreasing pressure is thought to favor the conflict solution of pedestrians coinciding at the exit and competing for the same space, so that clogging can be minimized. 20
The obstacle is often set in the walking facility to guide the pedestrian flow through the bottleneck effectively. The microscopic evading behavior of pedestrians when they confront obstacles is worth studying. In the study of Georgoudas et al., 30 each obstacle defines a field around it according to its shape and position. The field affects a pedestrian that reaches it by guiding her or him to move along the axis of the obstacle toward the direction of increasing field values. Many experimental observations show that pedestrians will avoid obstacles during evacuation. 31 The experiments with obstacles near the exit are primarily restricted to non-panic situations, including normal conditions and orderly evacuation drills. 24 All of these experiments have shown the evading behavior of pedestrians. However, in the study of Feliciani et al., 32 they did a series of experiments in which professional soldiers were employed to reach extreme levels of crowdedness. There are differences in trajectories with soldiers at different levels of competitiveness. Moreover, trajectories at the high level of competitiveness did not show an evident phenomenon of a triangle “evading region.” Therefore, the model proposed in this paper applies only to non-emergency situations. For example, train stations with crowded people need to evacuate arriving passengers quickly, irrespective of the potential occurrence of an emergency. In this paper, we propose a CA model with finer discretization to study the effect of evading behavior of pedestrians on evacuation under non-panic situations. To explore the influence of obstacles, a new floor field, the obstacle floor field, is introduced to the proposed model to simulate the evacuation of pedestrian flow considering obstacles. The obstacle floor field describes the repulsion effect of obstacles on pedestrian movement. Furthermore, we use an easy way to calculate it. The proposed model may be helpful for pedestrian evacuation under normal circumstances, e.g., the audience’s entrance and departure from the festivals.
The composition of this paper is organized as follows. Section 2 introduces the improved CA model. Section 3 analyzes the simulation results. Finally, conclusions are given in section 4.
2. Model
This section is structured into three parts. The section 2.1 introduces the method of space discretization we used. The section 2.2 defines obstacles’ effect on pedestrian behavior. Then, the section 2.3 describes the details of the CA model with finer discretization. The floor field cellular automaton (FFCA) is used in this paper. Besides, the dynamic and static floor field definitions refer to the two-dimensional (2D) CA model proposed by Burstedde et al. 9
2.1. Space discretization
In the most classical CA model used to simulate the evacuation process, the simulation scenario is always described by a 2D grid. Each cell can be empty or occupied by a pedestrian or obstacle. 33 As the empirically observed maximum density is about 6.25 ped/m2, 34 a pedestrian is usually assumed to occupy a 0.4 × 0.4 m2 in the discrete simulation model. Therefore, the cell size of the traditional CA model is 0.4 × 0.4 m2, which means that a pedestrian can only occupy one cell. Although the traditional CA model is exceedingly suited for large-scale computer simulations, the approximation of the CA model to reality still has a potential improvement.
In the traditional CA model, some researchers have introduced the idea of finer space discretization, so that a pedestrian can occupy more than one cell.35,36 In our model, a pedestrian occupies 5 × 5 cells. As shown in Figure 1, a yellow grid denotes the center of one pedestrian, and the blue circle denotes the area that a pedestrian covers, which is forbidden to be occupied by other pedestrians. The area occupied by a pedestrian remains approximately 0.4 × 0.4 m2, corresponding to the typical space occupied by a pedestrian in a dense crowd. The cell size is thus 0.08 × 0.08 m2.
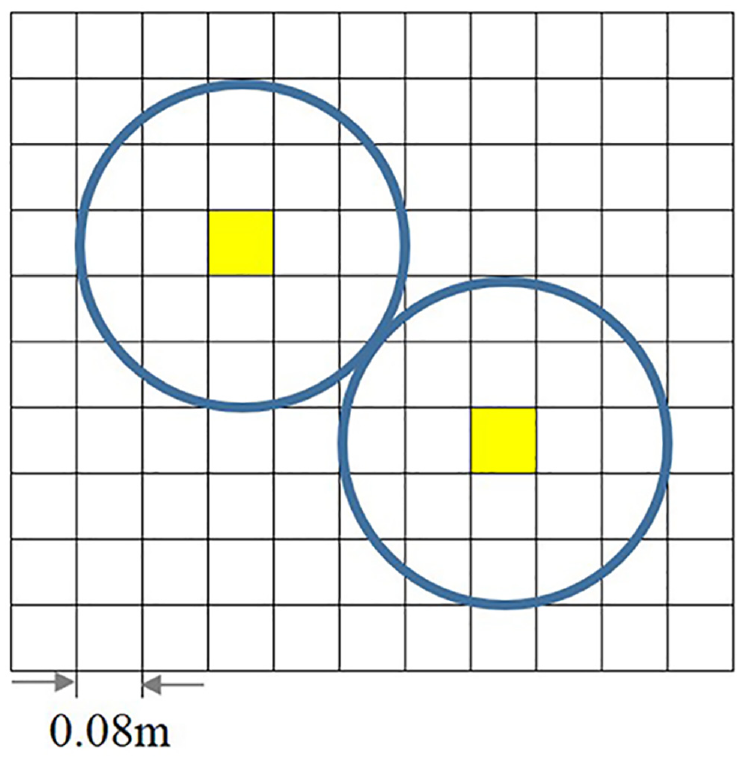
Size of one pedestrian.
A specific simulation scenario shown in Figure 2 is used in the proposed model. This particular exit layout is common in a building, as there is usually a long narrow passage connecting two different areas. In this scenario, some pedestrians in the waiting area evacuate from a room of 10 × 10 m2. There is an exit with a width of 1.2 m in the middle of the south wall. The space in the room is discretized into 125 × 125 cells. A corridor connected to the exit measures 4 × 1.2 m2. The area in the corridor is discretized into 50 × 15 cells. Each pedestrian will pass from the room into the corridor through the green grids and finally leave the scenario by the orange grids.
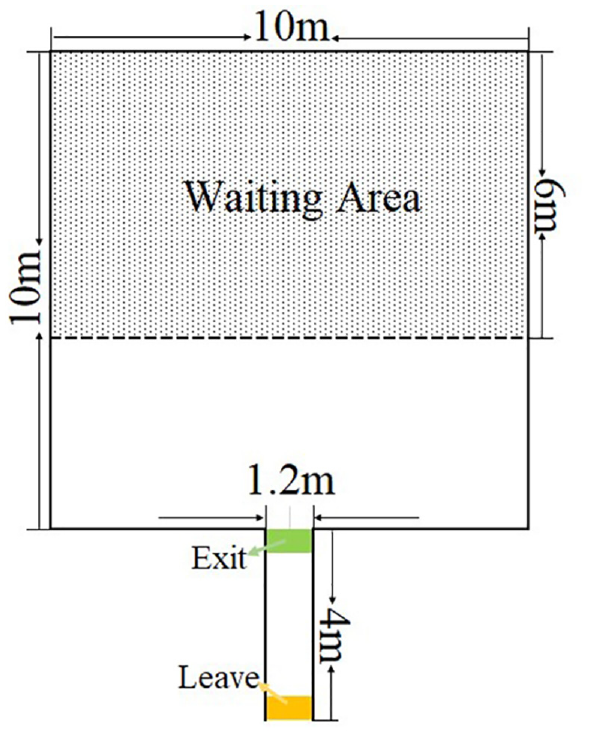
The simulation scenario of the CA model.
2.2. Obstacles’ effect
In our model, a pillar-like obstacle is placed in front of the exit to study the influence of obstacle size and distance from the exit on the evacuation process. As shown in Figure 3, the red circle denotes the obstacle,
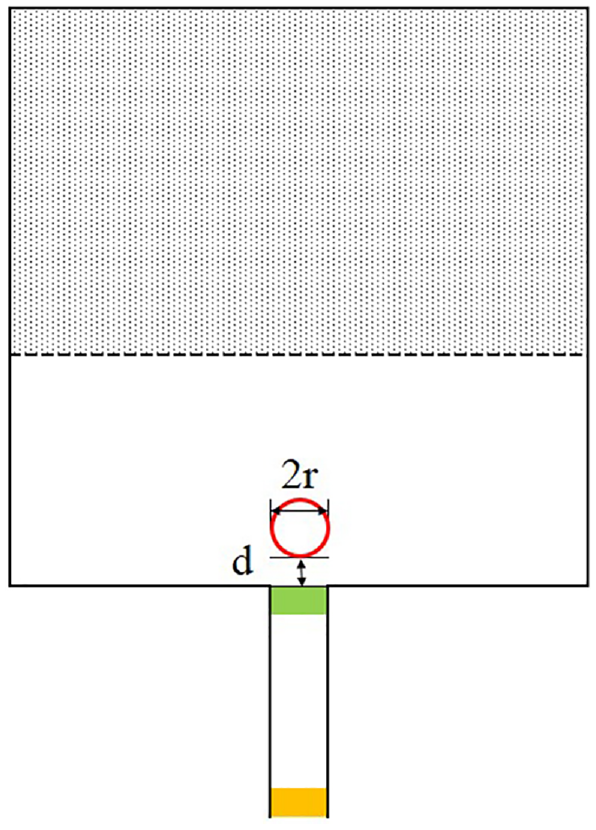
The diagram of the obstacle.
The existence of obstacles changes the trajectories of pedestrians. Obstacle avoidance behavior is a significant part of pedestrian evacuation. 37 Pedestrians can see the obstacle within a certain distance before reaching it. Therefore, they will change their direction of movement to avoid obstacles. Many empirical studies have been conducted to examine the obstacle effect on pedestrians. By comparing the controlled experiments with non-human organisms (mice) 26 and with human subjects, 4 we find that obstacle avoidance behavior is a unique and inherent human behavior. We want to use a simple way to simulate the evading behavior of pedestrians. Therefore, an obstacle field is introduced into the CA model to address this problem in this paper. The details of the obstacle field are discussed in section 2.3.
2.3. FFCA model
The FFCA is a typical discrete evacuation model.
38
The model assumes that pedestrians know the location of the exit, and the transition probability determines each pedestrian’s target cell at the next time step. In the classical FFCA model, the probability is calculated by two parts: static floor field reflecting the distance between each cell and the exit and dynamic floor field describing a virtual path left by pedestrians.
39
Based on the classical model, we add two extra parts: the obstacle floor field representing the obstacle effect on the pedestrian trajectories and repulsion
here
As mentioned above, the cell in this paper is 0.08 × 0.08 m2. Each pedestrian thus occupies more than one cell. For the sake of simplicity, we define that the central cell determines the movement of each pedestrian. At each time step, pedestrians move one cell or two cells in different directions or remain unmoved. As shown in Figure 4, the neighborhood of the proposed model is more like an extended Moore neighborhood, and pedestrians can move two cells at each time step.
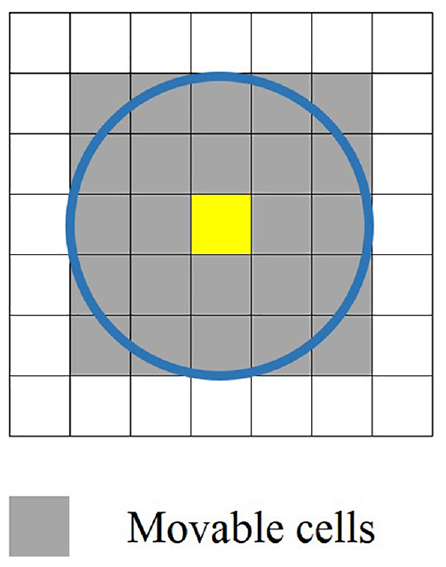
Neighborhood of the proposed model.
2.3.1. Static floor field of FFCA
The static floor field
1. Cells of the corridor:
2. Cells of the room:
where
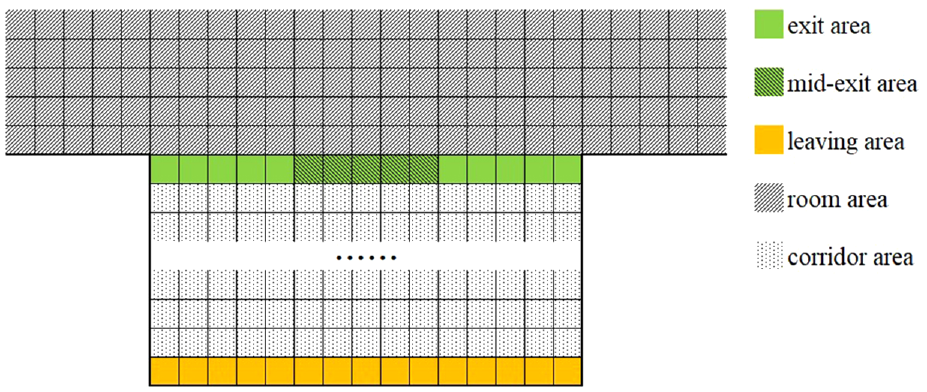
Region position diagram.
It should be noted that the distance between the cell in the room area and the exit is defined as the shortest distance between the cell in the room and the middle five cells in the exit area. This is because selecting the middle five cells instead of the middle one cell can help avoid the overly intensive pedestrians in the middle of the exit. In addition, in the study of Rupprecht et al., 40 three paths will be formed when the exit is 1.2 m. When the middle exit area is five cells, three paths can be formed in simulations. The static floor field of the simulation scenario is shown in Figure 6.
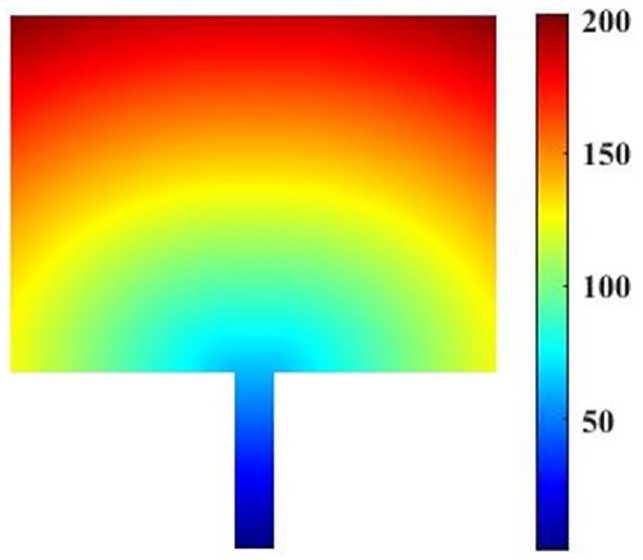
Static floor field of the simulation scenario.
2.3.2. Dynamic floor field of FFCA
The dynamic floor field
Step 1: Before each simulation, the dynamic floor field is initialized to zero.
Step 2: Equation for generation and diffusion at each timestep. Supposing that
where
Step 3: The equation for decay at each time step:
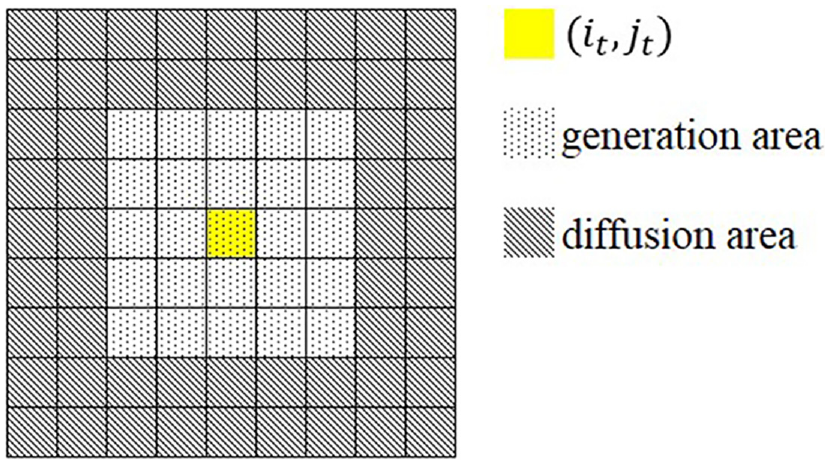
Diagram of range for generation area and diffusion area of each pedestrian.
2.3.3. Obstacle floor field of FFCA
A series of experimental studies on the influence of the obstacle during egress give examples of obtained trajectories. After analyzing the obtained trajectories of different experiments, we find that pedestrians are divided into two streams at a certain distance in front of the obstacle. 18 In this paper, an obstacle floor field is proposed to describe the effect of the obstacle on pedestrian trajectories.
The obstacle floor field
The algorithm for calculating the obstacle floor field is shown in Table 1. First, we calculate the value (see Figure 8(b)), then we set its position based on the obstacle (see Figure 8(a)). As shown in Figure 8(a),
The algorithm for calculating the obstacle floorfield (taking
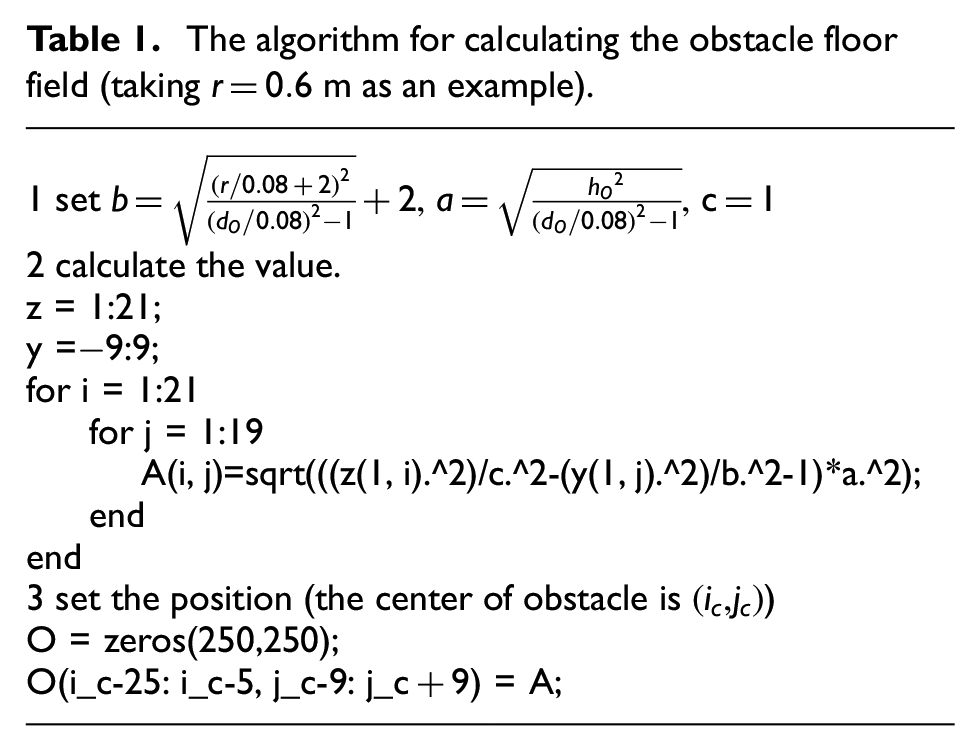
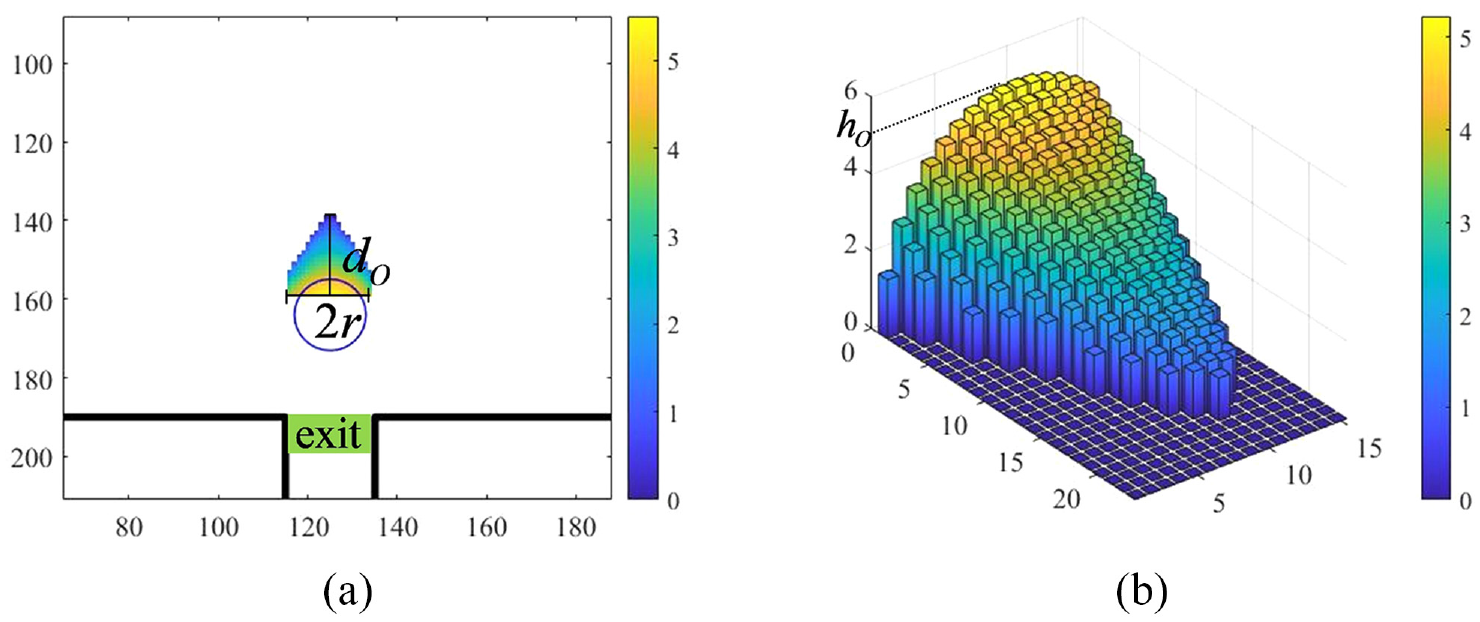
Diagram of the obstacle floor field. (a) 2D image of the obstacle floor field. (b) 3D image of the obstacle floor field.
An example is shown in Figure 8. In this example,
2.3.4. Repulsion between pedestrians
Repulsion
where
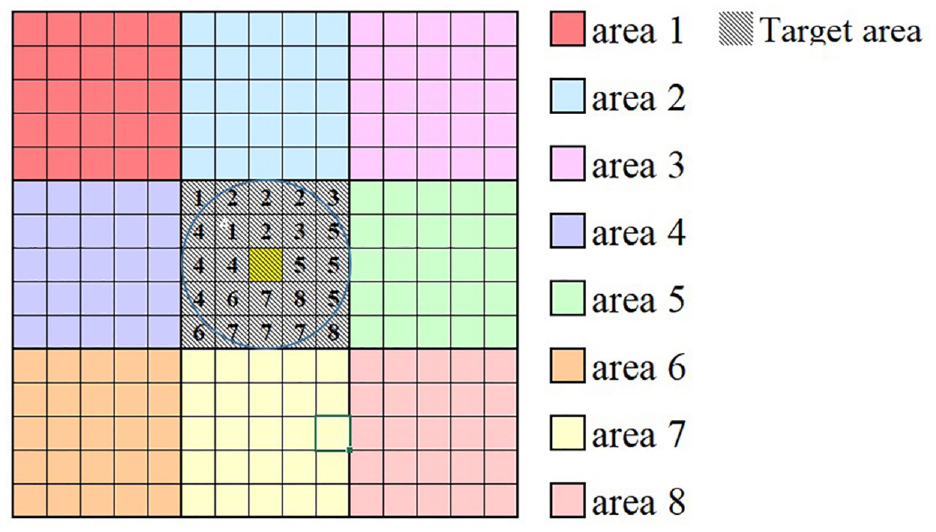
Diagram of the corresponding area to the target cell.
2.4. Update rules
Pedestrians are updated in a shuffled update scheme; 41
Calculate the
Calculate the
Record the
Record the
Calculate
Here, we want to make an illustration of the
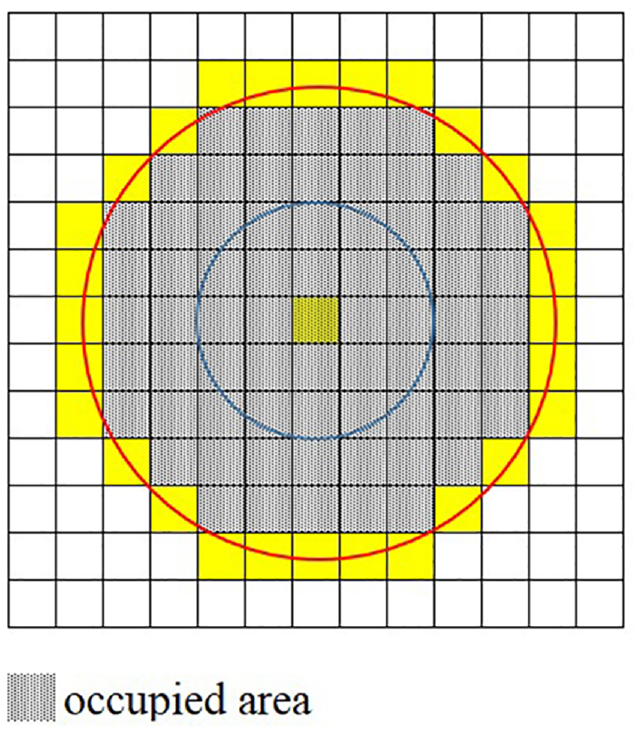
Diagram of the occupied area of one pedestrian.
3. Simulation results
The simulation mainly analyzes the influence of obstacle layout and pedestrian evading behavior on pedestrian evacuation trajectories and time. We just set up simple evacuation scenarios, as shown in Figure 2. The waiting area has a capacity of 375 pedestrians (see Figure 11, blue circles represent the pedestrian positions). The number of pedestrians
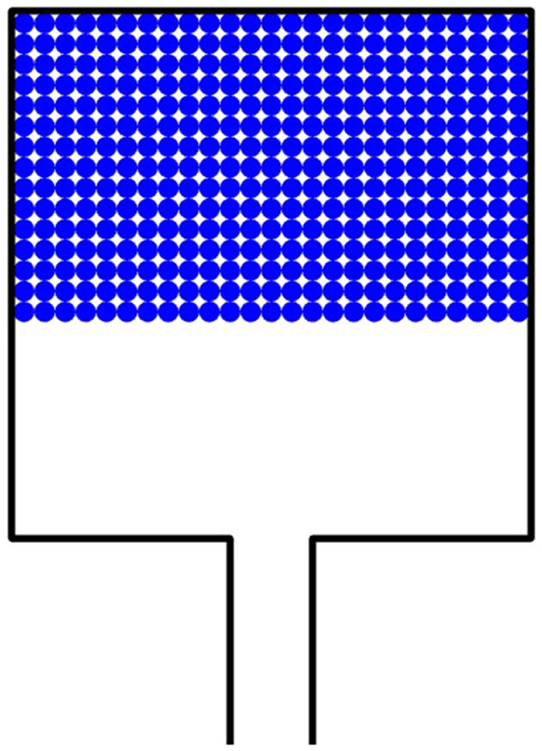
The distribution of pedestrians.
Figure 12 shows the snapshots of pedestrian evacuation in the scenario without obstacles at time
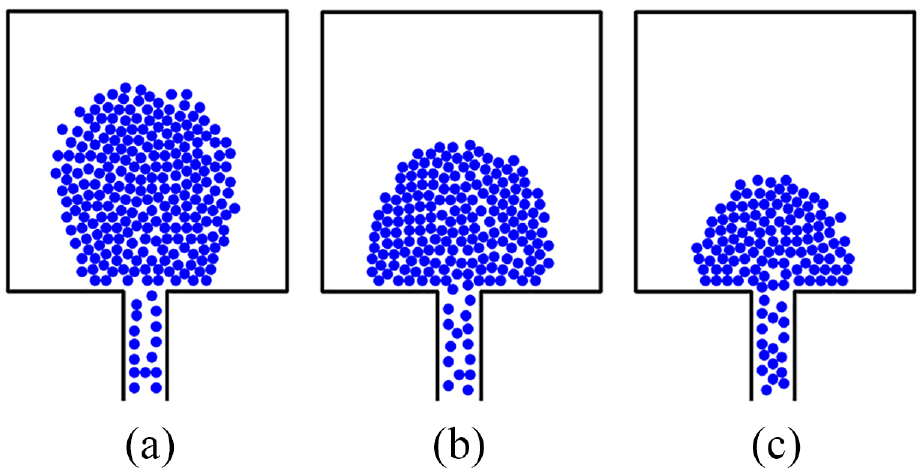
Snapshots of pedestrian evacuation at different time steps. (a) T = 50. (b) T = 150. (c) T = 250.
3.1. Variables for describing the pedestrian dynamics at the exit
3.1.1. Total evacuation time
Usually, the total evacuation time
3.1.2. Pedestrians’ average moving speed
Supposing that the
where
3.1.3. Outflow of the pedestrians
We use the number of pedestrians remaining in the room
3.1.4. Pedestrians’ evacuation path
The pedestrians prefer to walk straight up to the exit without obstacles. When there are obstacles near the exit, pedestrians will change their direction and avoid the obstacles. As a result, there is a difference in pedestrian trajectories between the two scenarios. Each pedestrian trajectory obtained from the simulations is recorded to analyze the effect of obstacles on pedestrian route choices. We also calculate the distribution of pedestrian trajectories.
3.2. Results analysis
We plot the
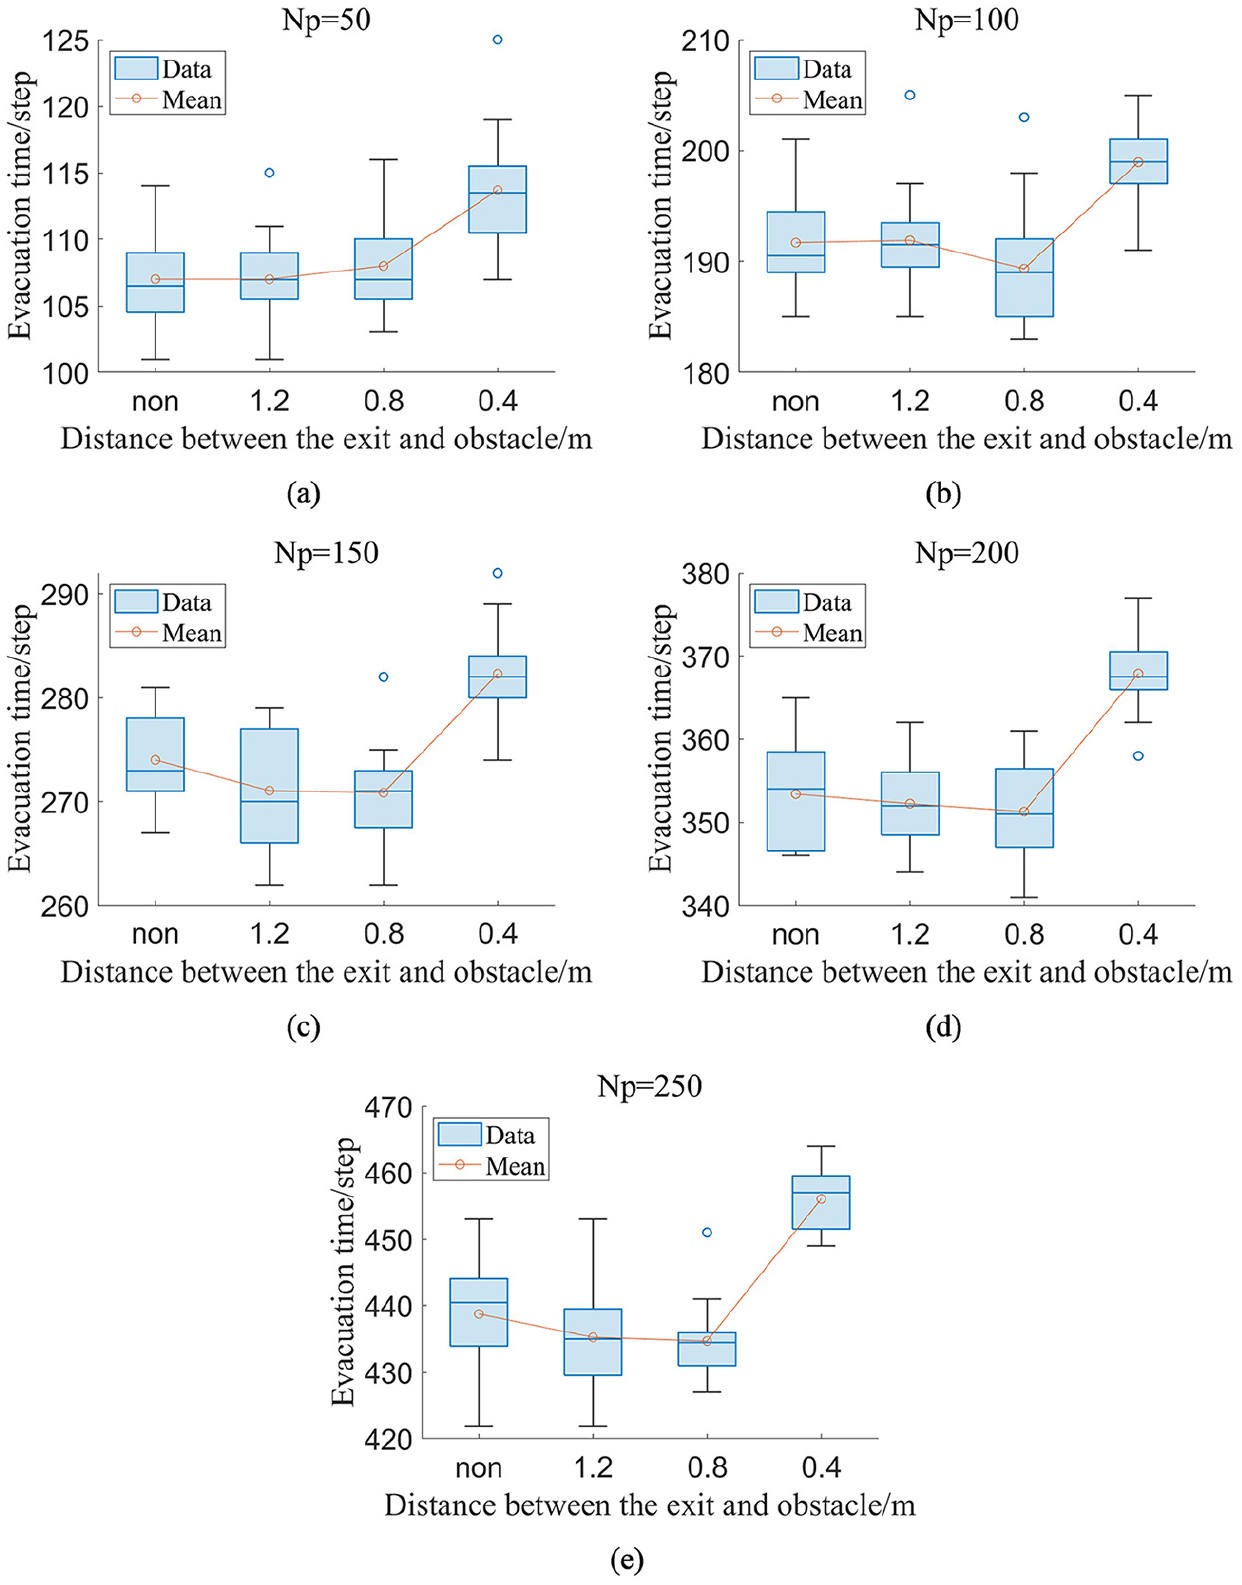
The total evacuation time under different scenarios. (a) 50 pedestrians. (b) 100 pedestrians. (c) 150 pedestrians.(d) 200pedestrians. (e) 250 pedestrians.
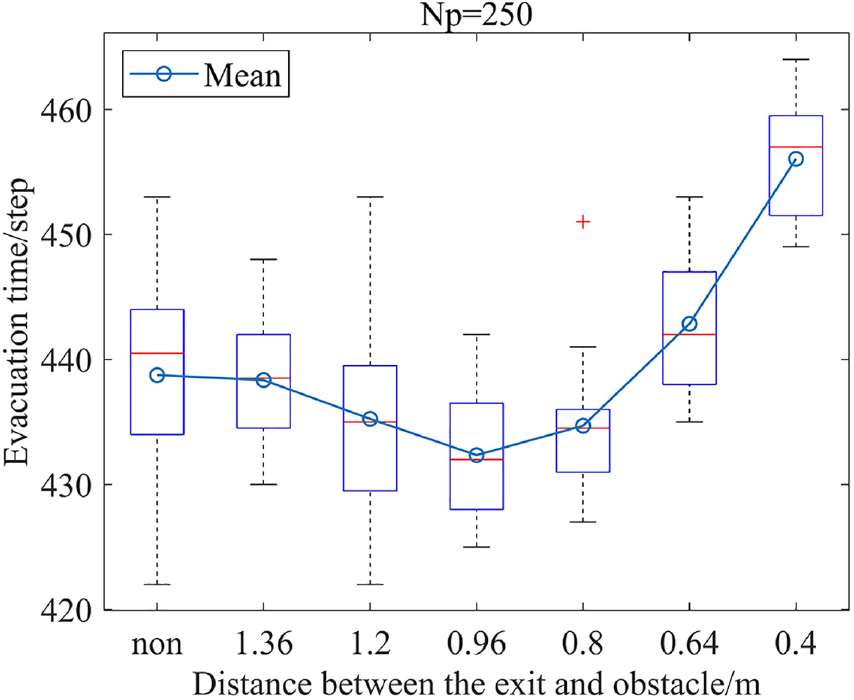
The total evacuation time of 250 pedestrians under different scenarios.
We also analyze the average evacuation speed under different scenarios (see Figure 15). The average evacuation speed decreases with the number of pedestrians increasing. When there is an obstacle, the average evacuation speed is faster. To further investigate the evacuation speed of pedestrians, we plot each cell’s average speed in simulations with 250 pedestrians (see Figure 16).
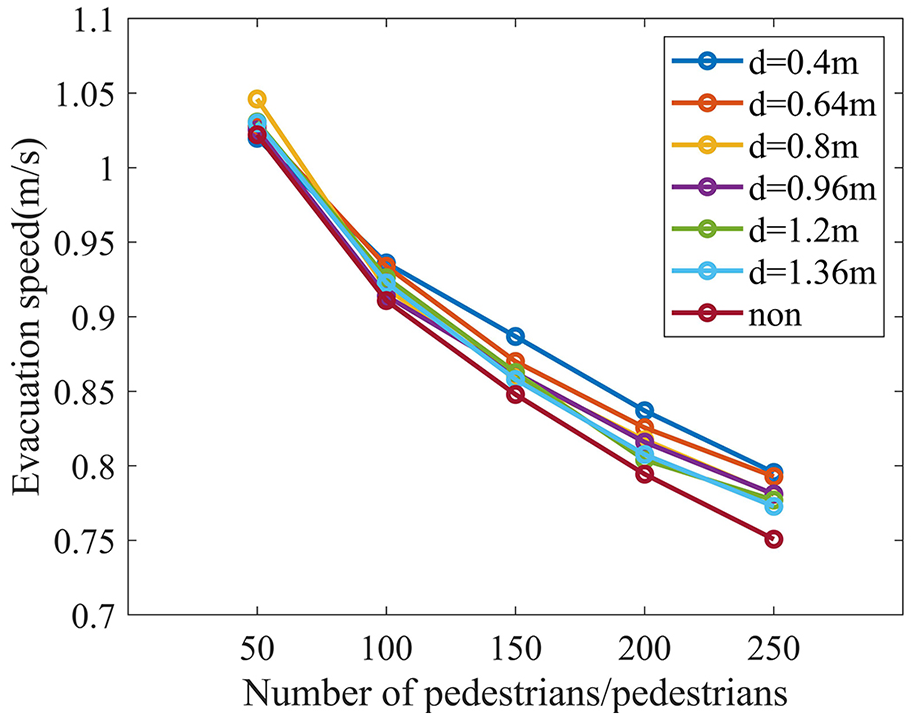
The average evacuation speed under different scenarios.
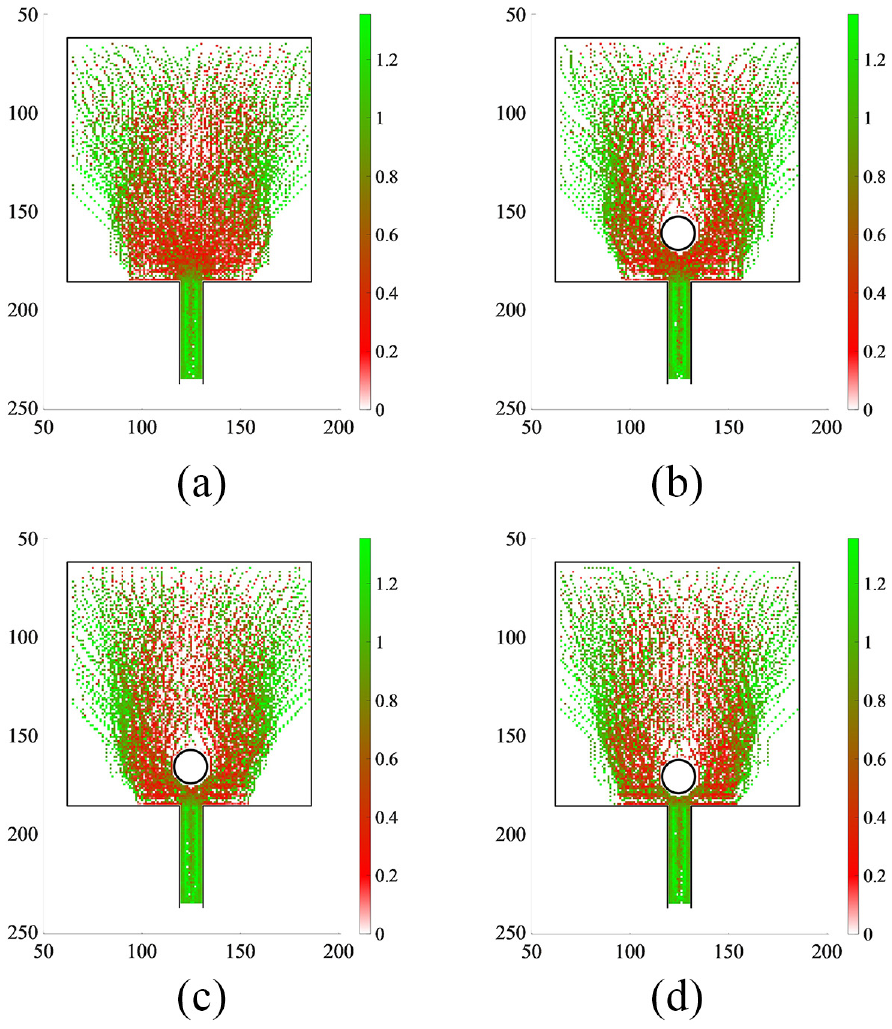
Heatmap of the average speed in each cell. (a) None. (b) 1.2 m. (c) 0.8 m. (d) 0.4 m.
As shown in Figure 16, the obstacle improves the evacuation speed of pedestrians near the exit. Moreover, the effect of the obstacle on improving the speed of pedestrians passing through the exit increases with the decrease in the distance between the obstacle and the exit. The obstacle diminishes the number of pedestrians entering the area in front of the exit. As a result, pedestrians can pass through the exit quickly. It is also evident that some pedestrians are moving along the crowd’s periphery and reaching the wall with the exit at a relatively faster speed.
Finally, the cumulative number of pedestrians passing each cell is analyzed to investigate the effect of an obstacle placed in front of the exit on pedestrian route choice.
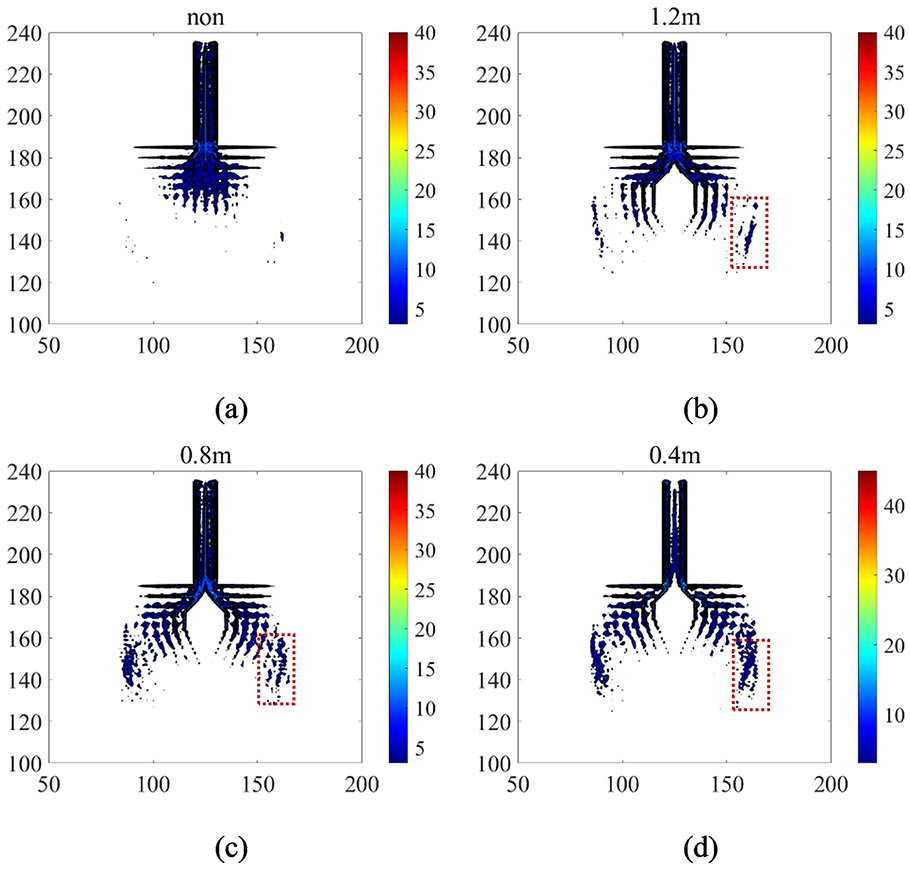
The cumulative number of pedestrians passing each cell. (a) None. (b) 1.2m. (c) 0.8m. (d) 0.4m.
4. Conclusion
This paper investigates the obstacle’s effect on pedestrian trajectories during non-emergency evacuation. We use a hyperboloid of two sheets to quickly calculate the obstacle floor field and simulate the pedestrians’ obstacle-avoiding behavior. Data (such as speed, flow, and evacuation time) obtained from the pedestrian evacuation simulations are used to analyze the influence of an obstacle. The results show that an obstacle in front of the exit reduces the evacuation time and improves pedestrians’ average evacuation speed and outflow in low-level competition. The obstacle can change the distribution of the pedestrian trajectories and improve the speed at which pedestrians pass through the exit.
It should be noted that the obstacle is only sometimes efficient in terms of decreasing the evacuation time and increasing the outflow. Its performance depends on the distance between the obstacle and the exit. Therefore, it is vital for evacuation to correctly deal with the relationship between the width of the exit and the obstacle’s distance to the exit. For example, the width of the exit is 1.2 m in this paper. The obstacle and the walls will form new bottlenecks when the distance between them is 0.4 m. Although pedestrians can pass through the exit at a relatively high speed, the central area of the exit needs to be more used. As a result, the obstacle increases the evacuation time instead. In addition, the phenomenon of “pedestrians moving along the periphery of the crowd can move faster than the pedestrians moving in the crowd” can be observed during the pedestrian evacuation simulations. There are limitations in this thesis, so further exploration and perfection are needed. Further calibration and verification of the obstacle floor field by the experimental data are needed to develop a model that can truly replay the pedestrian actions during the non-emergency evacuation. The simulation models intended to simulate pedestrian flow at bottlenecks help determine the place of the obstacle and explain how it could enhance crowd safety.
Footnotes
Funding
This work is supported by the National Natural Science Foundation of China (Grant Nos. 72171006 and 71771005).
