
Abstract
The seismic and fumarollic activity of La Soufrière de Gaudeloupe increased in 1992. Continuing unrest led the Observatoire volocanologique et sismologique of Guadeloupe (OVSG-IPGP) to recommend in July 1999 to the authorities that the volcano alert be set to “Vigilance” (yellow). The OVSG-IPGP has been particularly vigilant and reinforced its monitoring following another significant increase of unrest in 2017 that culminated in magnitude 4.1 felt earthquake and a probable failed phreatic eruption. Volcanic activity remains difficult to forecast precisely, so the only way to stay safe, in case of an impending eruption, is to move away from the threatened area. This can be a major problem for the authorities and the population. In the French overseas departments, despite the presence of several volcanoes, there is limited experience in managing volcanic emergencies, especially in areas with a high population density and strategic assets, such as the Basse-Terre region of Guadeloupe. Therefore, it is crucial to devise and assess an emergency management strategy to identify potential problems and dangers that may arise during a mass evacuation. Crisis exercises can be planned to prepare the authorities and the population, but they are rarely carried out due to the human and resource costs involved. A series of evacuation scenarios are evaluated through simulations. The scenarios model staged and simultaneous evacuations with different speeds of individual response times. The aim of this research is to evaluate the two main evacuation strategies defined in the current volcano emergency response plan for La Soufrière of Guadeloupe, revised in 2018 by the authorities. This paper describes a calibrated agent-based model of mass evacuation and its exploration focusing on the potential staged evacuations of the southern Basse-Terre area. The overall objectives of this research are to: (1) test the evacuation strategy of the current emergency plan, and (2) provide relevant information to stakeholders. The results of these simulations suggest that there is no significant difference between the two evacuation strategies. It is estimated that 95% of the population will be evacuated within 20 h with a simultaneous or a staged evacuation. Whatever the scenario, the simulation results show high levels of road congestion. However, the staged evacuation will significantly reduce the number of vehicles on the network during the peak time of the evacuation and therefore reduce dangerous situations and the potential for adding crises within a volcanic crisis.
Keywords
1. Introduction
From the usual eruptions of Etna (Italy) and Kilauea (United States) to major and deadly eruptions such as those of Mount Semeru (Indonesia), volcanic eruptions have always left their mark on our societies. Today, more than 29 million people live within 10 km of one of the 1508 active volcanoes. 1 Recent eruptions illustrate the difficulties and potential dangers of mass evacuations of unprepared populations. In the aftermath of the Nyiragongo 2021 eruption in the Democratic Republic of Congo, 32 people died and many more lost their homes and livelihoods. 2 Most of the victims were indirectly related to the volcanic hazard (road accidents, failure to follow safety instructions, deviant behavior). Unfortunately, a spontaneous unprepared mass evacuation can have serious consequences for the population and exacerbate the crisis with indirect accidents. 3 More than 1900 fatalities have been recorded in the last 20 years 4 and millions of people have been displaced. 5 Global urbanization in hazard-prone areas is increasing the size of the population exposed to volcanic risk. 6 In the face of the most hazardous phenomena, escaping the areas most threatened is the only possible protection. The success of a mass evacuation is multifactorial and often depends on general volcanic awareness, legislative framework, scientific knowledge, the warning system, the preparedness of the authorities and the population, and the interaction between the actors. Evacuation is a highly complex process that must be planned in advance of the onset of an emergency to identify the potential problems or dangers such as traffic congestion, a broken road section on an evacuation route, or excessive exposure of the population compared to containment. 7 It is also paramount for all stakeholders involved to practice the protocols and chain of action that must be implemented and evaluated the efficiency of emergency response strategies.
La Soufrière of Guadeloupe is a stratovolcano that has experienced many eruptions of various types in the past. 8 Given the increase of the activity of the hydrothermal system, the OVSG-IPGP (Volcanological and Seismological Observatory of Guadeloupe - Institut de Physique du Globe de Paris) has been particularly vigilant since 2017. 9 Given the difficulty of forecasting precisely volcanic activity, depending on the nature of the hazard, the only individual protection is to evacuate threatened areas in the event of an alert, which can be a major problem on a population scale. In the French overseas departments, despite the presence of several volcanoes, there is limited experience in managing volcanic emergencies, especially in areas in the West Indies, such as the Basse-Terre region of Guadeloupe, with a high population density and strategic assets. 10 However, a mass evacuation is a complex process, involving many different actors who have to make decisions with limited information and high uncertainty, on short time scales. And the success of an evacuation will depend on the overall strategy of the authorities and the public perception of the volcanic risk. It is therefore important to plan the emergency management and to identify the potential problems or dangers of a mass evacuation.
In France, given the governance structure, planning is a top-down process involving local government services, the volcano observatory, the emergency services and the population, with each actor having its own preventive measures and/or emergency response, coordinated by the authorities in a general volcanic crisis response plan. All protection measures are supervised by the operational directors and thus at the Department or region scale by The Prefect, the representative of the French State, and at the town scale by the Mayor. Each eruption has its own “hazard footprint” and the protective measures depend on the hazard dynamics and intensity.11,12 Local government has the primary responsibility for protecting its citizens. Its first task is to save human lives in crisis and post-crisis situations caused by disasters. The local mayor ensures that the evacuation is well-organized by means of the local evacuation plan, known in French as the Plan Communal de Sauvegarde (PCS). The plan describes, at the scale of the town, the various measures to be taken in the event of a future eruption (location of bus stops, number of buses, etc.) and the actions of local actors such as the municipal police. An emergency plan may be devised jointly by multiple municipalities, it is the Plan Intercommunal Communal de Sauvegarde (PICS). However, when events go beyond the local boundaries of the communes or when the mayor has failed to take the necessary measures, the Prefect takes the lead in terms of security. He coordinates the entire evacuation process on the territory by activating the ORSEC (Organization de la Réponse de Sécurité Civile) emergency plan. This is a general emergency plan for disasters when local resources are insufficient. Within his municipality and according to the ORSEC plan, the mayor manages safety and the PCS’ actions. The current Guadeloupe’s Global Emergency Preparedness Plans (EPPs) has just been published by the authorities in January 2019 (Préfecture de la Région Guadeloupe). The plan provides generic information about the volcanic hazards, details four scenarios of volcanic activity and the alert levels. Volcanic hazards are characterized by a high degree of uncertainty regarding the type, intensity, and timing of eruptions. Emergency management must therefore take this into account. 12 For this reason, the current plan defines several spatial and temporal dynamics of a potential eruptive crisis of La Soufrière rather than specific scenarios of volcanic phenomena. A future version of the plan will provide more detailed eruption scenarios as was done recently in the new version of the Montagne Pelée volcanic emergency response plan issued in 2022 by the authorities in Martinique. With regard to these eruption scenarios, two main evacuation strategies are proposed, staged or simultaneous full evacuation,13,14 depending on the eruptive crisis and the recommendations made by the volcano observatory (OVSG-IPGP). But the strategic decision to evacuate is the responsibility of the public authority, the Prefect.
In the event of a simultaneous evacuation, all persons in the areas at risk are asked to evacuate immediately. 14 It is, therefore, expected that as soon as the alert is activated, either by siren, cell broadcast, or radio, everyone will leave the area as quickly as possible. The second strategy divides the affected area into zones and priorizes the evacuation of the inhabitants in a time sequence for the different zones.15,16 Both strategies are presented and evaluated in the actual volcanic eruption Emergency Preparedness Plans (EPPs).
In this EPP, based on census statistics and theoretical road traffic flow, it is estimated that a simultaneous mass evacuation of four municipalities (Basse-Terre, Saint-Claude, Gourbeyre et Baillif, see Figure 1, top left) would take more than 13 h with a peak of 10,400 vehicles on the road network. The second strategy is very rudimentary, especially as regards the division of the areas to be evacuated. 10 The sequence consists of four stages: preparation and successive evacuation of the four municipalities in the danger zone. The phased strategy is a potential solution to reduce traffic congestion and overall evacuation time. 15 Whatever the strategy, the pre-evacuation time, 17 i.e., the time interval between receiving the alert and starting to move, depends on the individual response. Some people convinced of the reality of the danger will take the road very quickly. Others, on the contrary, may take several minutes or even hours before deciding to leave, for a variety of reasons: they are not aware of the danger, they want to protect their belongings or gather their family before leaving, and so on. Finally, others may refuse to leave, putting themselves at risk. In addition, people’s decision to evacuate may be influenced by the warning system but also triggered by the first visible signs of an eruption. Volcanic risk perception is the result of a combination of several influencing factors such as knowledge, experience, perceived benefits/impacts, etc.18–21 The human decision-making process is complex to model.20,22 However, behavioral science has identified human responses to specific events. 23 Today’s computers are powerful enough to model 24 and assess the impact of some complex behaviors on traffic. This research is part of the global project ESCAPE (Exploring by Simulation Cities Awareness on Population Evacuation). 25 ESCAPE provides a suite of tools for modeling mass evacuations using multi-agent modeling. It is a generic (multi-risk) simulation and evaluation tool for mass evacuation. It is possible to implement complex behaviors such as reluctant people or shadow evacuation. 26 There are a number of ESCAPE case studies (industrial risk, flooding), including ESCAPE-VOLCANO. This paper aims to capture individual response times for different evacuation strategies and evaluate how they affect evacuation duration and congestion.
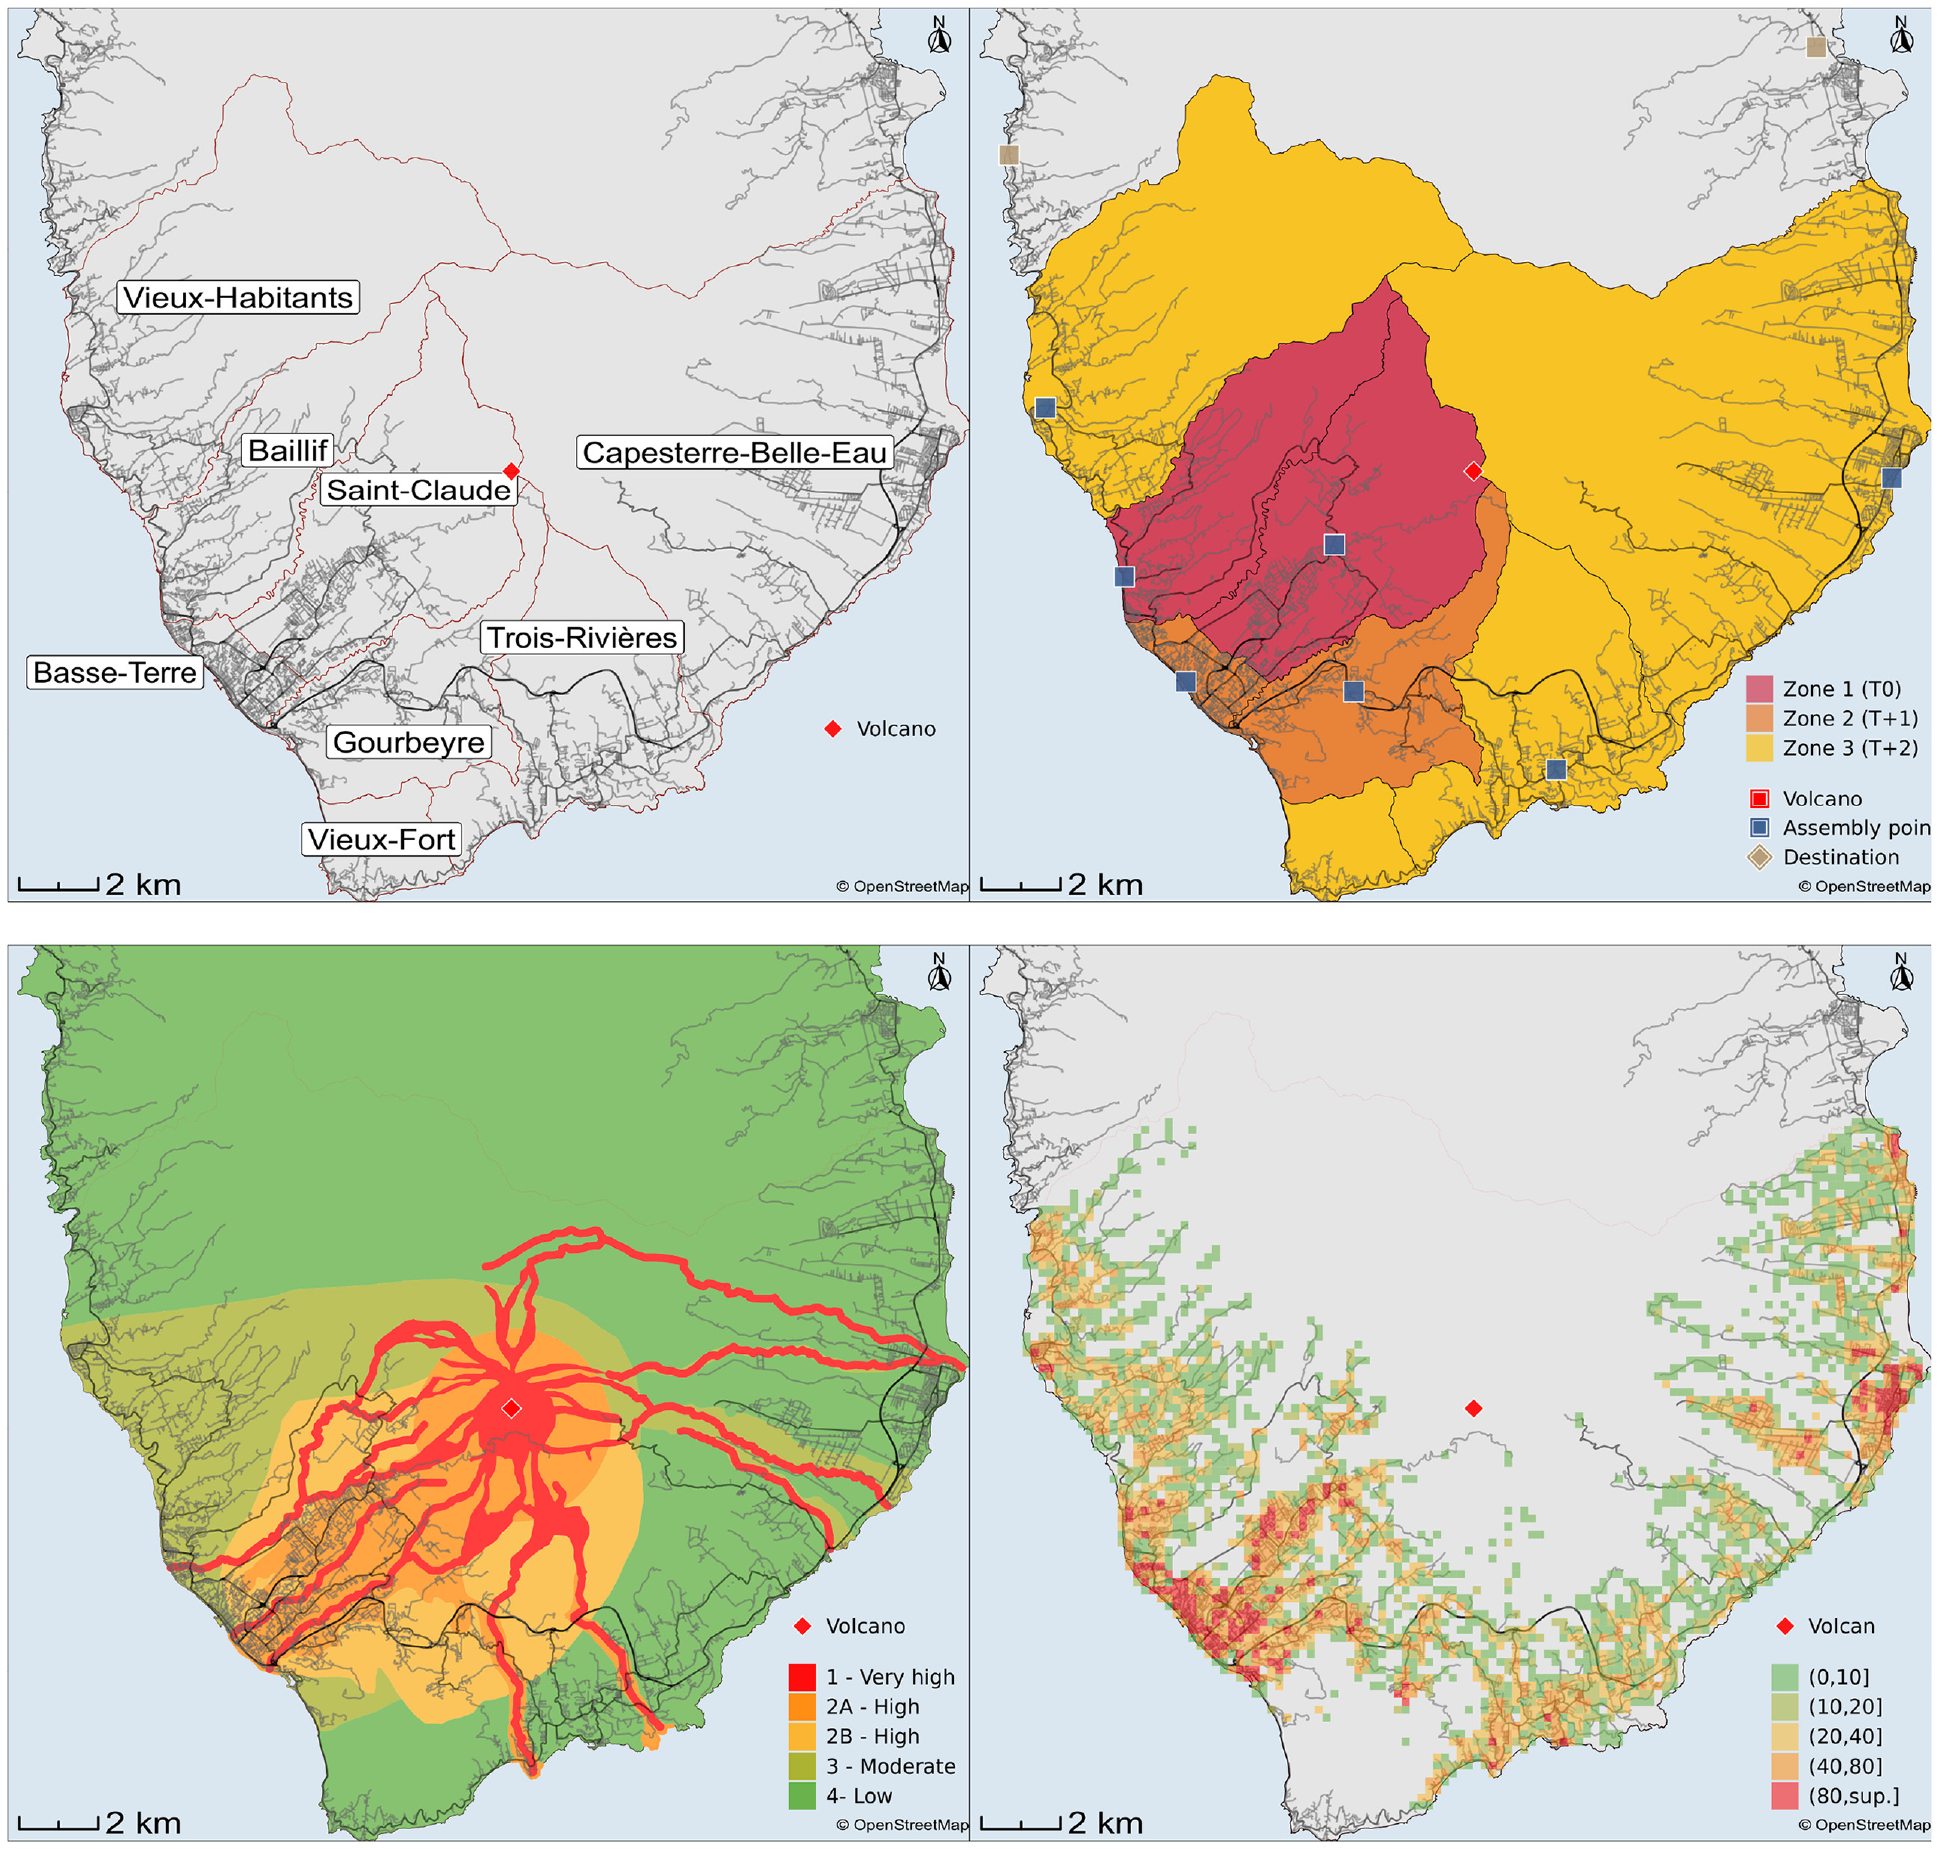
Administrative map (top left), staged evacuation map (top right), the hazard zones of La Soufrière of Guadeloupe 8 (bottom left), and a population grid map (bottom right).
Crisis exercises can be planned to prepare authorities and the population, 27 but they are rarely played due to human and resources costs. 25 In this context, agent-based models (ABMs) are particularly well-suited to simulate and model the complexity of mass evacuations (realism of agent behavior and environment, interaction between agents, observation of system dynamics at different scales, etc.).28,29 The aim of the work is to evaluate the effectiveness of the staged and simultaneous evacuation of the population of the southern Basse-Terre area during a volcanic crisis of La Soufrière of Guadeloupe. The second objective is to identify the most effective phased evacuation strategy. This study also aims to assess the impact of different response times on the evacuation process. Based on GAMA software 30 and ESCAPE extension, 25 a series of evacuation scenarios will be tested, combining staged or simultaneous evacuation, with or without the rapid deployment of local responses. This will take the form of a how-to and what-if scenario. An advantage of experimental evacuation through simulation is the ability to test multiple strategies and evaluate their success against expectations and compare performance. This paper describes a calibrated ABM of mass evacuation and its exploration by OpenMOLE 31 focusing on two evacuation strategies and the individual response time. Section 2 gives a brief overview of mass evacuation models. Section 4 presents the design and implementation of the ESCAPE-VOLCANO system. Finally, section 4 discusses the results of these simulations and also addresses issues related to future research.
2. Volcanic evacuation modeling
ABMs and IBM (individual-based modeling) are among the methods used to model and simulate natural disaster emergencies. 13 They are powerful modeling techniques for simulating complex systems such as mass evacuation. 28 ABM can simulate the actions and interactions of autonomous agents in a common environment to understand the behavior of a system and observe or recreate the emergence of complex phenomena. 32 This computational modeling approach has been applied to various hazards such as volcanic eruptions,22,33 tsunamis,21,34 earthquakes,35,36 or hurricanes37,38 and at different scales of analysis, from regional scale to building scale. The models often focus on a single issue such as risk management, evacuation simulation, or hazard event simulation.39,40 These models are often incomplete in their development, imperfect in their execution, or complex in the analysis of the output, but can still be useful in modeling human behavior and decision-making during disaster events.32,41,42
Kennedy 43 identifies two modeling approaches to simulate human behaviors in ABM: cognitive (Belief-Desire-Intention paradigm, system dynamics) and mathematicalmethods (probabilistic or statistical methods). The method usually depends on the study objectives, the available data, and the level of abstraction. 44 Few evacuation models have been developed to study volcanic evacuation.14,33,44,45 Two of the four ABMs previously mentioned above developed a hybrid system, where the ABMs are combined with a system dynamic to model individual behavior.22,33 Based on the risk homeostasis theory approach, 46 the dynamic system proposed by Favereau et al. 33 evaluates the risk acceptance for each agent from their own personal risk perception 20 during the simulation process. This is a hybrid system where the outputs of the dynamic system are the inputs of the ABM. Jumadi et al.22,45 also developed a hybrid system to define whether agents would evacuate or stay. This hybrid system renders the analysis and development more complex. The method used to simulate the decision-making process in our system is different from the ABMs mentioned above (probabilistic methods based on field surveys).
An important goal of risk management is to make evacuations more effective. There are many types of levers available to increase the efficiency of evacuation: public warnings, traffic control, evacuation routes, evacuation strategy, among others. Many metrics can be used to measure “evacuation effectiveness,” 14 such as, for example, evacuation time, number of people evacuated, number of injuries or deaths. From the well-documented eruption of Merapi volcano that occurred in 2010, 47 Jumadi et al. 48 tried to capture the social vulnerability of each agent during the crisis and also evaluated different evacuation strategies in order to improve the effectiveness of evacuation. 13 The authors showed that staged evacuation can reduce the number of vehicles on the network during the peak evacuation period. Simultaneous evacuation can reduce the exposure time at the hazard. Bonadonna et al. 14 working on the island of Vulcano (Italy) found that simultaneous evacuations are more efficient than staged evacuations. Another study 15 determined that simultaneous evacuations are more effective in areas with little traffic congestion. The researchers also showed that staged evacuations are most effective in high-density areas and complex road networks.
3. Materials and methods
3.1. Study area
La Soufrière of Guadeloupe is part of the Grande Découverte volcanic complex and is located in the south of Basse-Terre on the island of Guadeloupe. It is an active explosive volcano that has experienced magmatic and phreatic eruptions. The last major magmatic eruption was in 1530 CE. 49 And the last phreatic eruption of this volcano was in 1976, which resulted in the evacuation of 73,000 people for a period of 3–6 months, generating a scientific controversy that greatly complicated crisis management.50–52 The activity of La Soufrière of Guadeloupe has been slowly increasing since 1992. This led the authorities to raise the alert level to “yellow” in 1999 and certain areas on the summit are now inaccessible to the general public due to the presence of toxic gases.8,9 The reconstruction of the eruptive history of La Soufrière of Guadeloupe volcano and the other volcanic complexes of the island by the OVSG-IPGP scientists, through both geological and historical research, is a first step in risk assessment and the production of a volcanic hazard map (see Figure 1, bottom right).53,54 It is very likely that a future eruption of La Soufrière of Guadeloupe will start with a phreatic eruption not directly involving magma. The eruption can then evolve toward several types of magmatic scenarios (growth of a lava dome including with pyroclastic density currents from lateral explosion and gravitational collapse of the dome, explosive eruptions with an open vent and eruption column that can produce significant tephra fallout as well as pyroclastic flows from column collapse. Partial edifice collapses with associated laterally directed explosions and debris avalanches and debris flows (lahars) can occur in all eruptions scenario types. Depending on their volume and dynamics, some of the pyroclastic density currents and/or debris avalanche could reach the sea possibly triggering tsunamis. Other hazards include felt seismicity, deformation, ground gas emissions, gas plume with potential for environmental contamination, and electrical phenomena in eruption plumes).8,55–57
Today, La Soufrière of Guadeloupe poses a potential threat to the surrounding communities. Explosive activity is but often particularly violent. 12 Whatever the eruption scenario, it would pose significant risks to the population, infrastructure, and network. Of all the volcanic islands in the West Indies, the island of Guadeloupe has the highest human exposure. 10 A total of 88,300 people live within 15 km of La Soufrière of Guadeloupe, where the population density is sometimes very high, particularly for the commune of Basse-Terre (1706 inhabitants/km2). Despite a demographic decline, the southern region of Basse-Terre remains the administrative capital of the island, where employment and institutions are concentrated. About 65,745 inhabitants live in municipalities directly exposed to volcanic risk, including 15,116 vulnerable people (children under 15 and older adults over 65). From a demographic and economic point of view, the southern region of Basse-Terre is, therefore, highly exposed to volcanic activity. Based on the hazard zones of La Soufrière of Guadeloupe 8 and the IGN’s database BD TOPO (French National Institute of Geographic and Forest Information), a simple geo-statistical process shows us that almost half (54%) of residential buildings are moderately or highly vulnerable to volcanic hazards. Similarly, 46% of exposed roads are moderately and highly vulnerable.
4. Model description
The next section describes ESCAPE-VOLCANO using the overview, design concepts, and detail (ODD) protocol.58,59 This is a standard protocol that gives an overview of the model, all its components, and the objectives of the ABM.
4.1. Overview
The aim of the work is to test the official evacuation plans and individual behavior during the crisis in order to simulate evacuation scenarios in the southern part of Basse-Terre island. The research questions are to verify (1) the effectiveness of these plans in relation to the objectives set (i.e., evacuation of the entire area in a given time), (2) their respective contributions in relation to the strategy set (i.e., staged plan versus synchronous plan), and (3) the effects of individual behaviors that deviate from what is expected of the population during crisis management (i.e., early departures). The model is based on three main classes of agents representing the environment, households/individuals and public transport interacting in a realistic environment. In this model, stakeholders are not implemented as agents, but their actions are injected as events during the simulation. For example, the alert is programmed to be triggered at different times and zones as defined in the volcano plan. Our proposed ABM includes the following entities:
Environment: Represents the Basse-Terre territory in Guadeloupe composed of threatened and safe areas. The environment represents the geography of the area. It is composed of physical objects such as the buildings to which the households are attached and the people who make up these households. There is no method associated with the buildings objects. On the contrary, the environment also consists of the transport graph, to which methods specific to this class are associated. For example, calculating the shortest path from one vertex to another is a method of this class object. The model uses OSM (open street map) data, a collaborative project, for all geographical elements (roads, buildings).60,61
Household: Based on the 2017 population census (INSEE, http://www.insee.fr/), the synthetic population was generated using the Iterative Proportional Update, 62 an improved version of the Iterative Proportional Fitting, the most widely used method for generating synthetic population.63–66 We have a population of 28,049 households and a total of 58,478 people. The decision to evacuate or not is a household decision process whose calibration is based on field surveys conducted in 2019 and 2020, involving a total of 340 respondents in seven exposed communes (Basse-Terre, Saint-Claude, Baillif, Vieux-Habitants, Vieux-Fort, Gourbeyre, Trois-Rivières). The objective was to assess the reflex behavior23,67 when faced with a volcanic eruption (or a threat of eruption) of La Soufrière of Guadeloupe or a preventive staged evacuation. The survey was also used to assess the social acceptance of the risk. The management of volcanic risk, planned by public authorities, implies the acceptance of this authority by the population. The lack of trust usually leads to a lower level of acceptance. 68 In Guadeloupe, trust between the parties, the population, and the authorities, is low. This means that people do not trust the authorities and do not follow their instructions in times of crisis. Therefore, it is necessary to strengthen the mutual trust between the population and the authorities. The main results obtained show that, on average, 8% of the population of the municipalities at risk would stay at home in the event of evacuation, whatever the situation (see Table 1). However, this would not limit the flow of vehicles on the road. Indeed, our survey also shows that 53% of households would take all their vehicles with them, resulting in 30% of the additional vehicles on the road, as households may have one or more cars (but also none). In the absence of a vehicle, people walked to the nearest bus stop and then took a bus to leave the danger zone via the windward or leeward coast. There were two evacuation exit points, one on the leeward coast and one on the windward coast (see Figure 1, top right). They are located in the north of Basse-Terre, far from the volcano where the probability of being affected by hazards is low. Households with vehicles drive their own cars with only one evacuating vehicle per household. We chose to define only one vehicle per household in order to compare our results with the estimates of the current plan. In fact, the estimated evacuation times are based only on the motorisation rate of the households without any details. Our choice to model the response time, i.e., the time taken by the population to prepare for evacuation, 17 using the Rayleigh distribution. It is a continuous distribution with the probability density function for non-negative-valued random variables where the scale parameter of the distribution defines the temporal evolution of households’ departures from their homes. The Rayleigh distribution has been widely used since the 1990s for various natural hazards (tsunamis, earthquakes, hurricanes).21,41,69–71,72 Rayleigh distribution, Uniform distribution, Poisson distribution, sigmoid curve, and Weibull distribution have all been used to characterize the preparation time. 73 Our choice of the Rayleigh distribution was based on its simplicity (only one parameter), empirical validation, 74 and suitability to our scenarios. When it is time to evacuate, the agent reaches the nearest bus stop or drives out of the danger zone. The household with a vehicle has the choice of evacuating along the windward (East) or leeward (West) coast. For example, and based on the results of the field surveys, the inhabitants of Saint-Claude have a 76% chance of evacuating via the windward coast (see Table 1). Once the household chooses a destination, an A* algorithm 75 is run to find the shortest path between its location and the safe area or to the nearest bus stop. The agents’ driving behavior is then modeled using GAMA’s advanced driving skill. 76 ESCAPE-VOLCANO can simulate the spatio-temporal dynamics of the volcanic hazard (e.g., ashfall or pyroclastic flow) and its interaction with the environment and other synthetic agents. If a road is blocked, the synthetic agent can recalculate its escape route and adapt its speed to the environment, i.e., volcanic ash reduces the visibility and the skid resistance. 77 The work evaluates the effectiveness of preventive evacuation strategies. The system does not simulate volcanic hazards. Figure 2 illustrates the multi-step evacuation process. First, the system determines whether households (and all the agents forming the household) should evacuate or not. Then a random selection is made among the synthetic households. Next, the household determines its own response time with a continuous probability distribution (Rayleigh distribution). Finally, the household with a vehicle chooses its evacuation routes. Complex reflexive behaviors 23 such as early departure or finding one’s family can currently be included in ESCAPE. In the absence of empirical data, this type of behavior does not exist in this scenario.
Public transport: Before the event, the territorial actors must also prepare their plans, which include the location of pick-up points, buses, evacuation roads, and the choice of the evacuation strategy. We have chosen to implement all these resources and strategies without specific agents, except for the bus transport system. The current volcano emergency Plan (ORSEC Plan) considers two preventive evacuation strategies, simultaneous and staged. The first strategy is defined by a massive departure of the inhabitants of the full exposed area in a short period of time. It is expected that the inhabitants of an exposed area will evacuate simultaneously after having been informed. 14 The second strategy defines an orderly sequence of different areas to be evacuated within the overall evacuation area. The hypothesis being that such a strategy could reduce traffic congestion and the overall evacuation time. 16 The current plan envisages a preventive and staged evacuation in less than 24 h. The first hours of the evacuation will be spent preparing the evacuation of the population (stopping activities, traffic control signs, identification of vulnerable people, etc.). For the phased evacuation strategy, the administrative boundary of the municipality is used as the unit of zones and the sequence starts with the evacuation of the most vulnerable municipality within the full area to be evacuated based on the volcanic hazard map of Guadeloupe8,78 (see Figure 1, bottom left). Municipalities evacuate one by one every hour. All these resources or actions are therefore data that intervene during the simulation in the form of injections (for example, an alarm per zone to trigger an evacuation) or in the form of information that allows the agents to make a choice (for example, the location of a bus stop). Insofar as the capacity to take care of non-autonomous people on one hand and the impact of the presence of many buses on a very constrained road network on the other hand are fundamental questions to evaluate the efficiency of the evacuation on the island, we chose to model by agents the buses. The national register of public transport vehicles gives us detailed information on the number of buses available and the number of seats in the bus. A pool of buses was mobilized by each municipality when an evacuation order was issued. By default, buses in our simulations have a capacity of 25 passengers. As the buses arrive at the pick-up point, evacuees begin to board until full capacity is reached, at which point they are evacuated away from danger. They remain at the pick-up point for a maximum of 15 min. As long as people are exposed, the buses continue to return to the designated pick-up point, otherwise they remain outside the danger area (see Figure 3).
Scenario and simulation parameters.
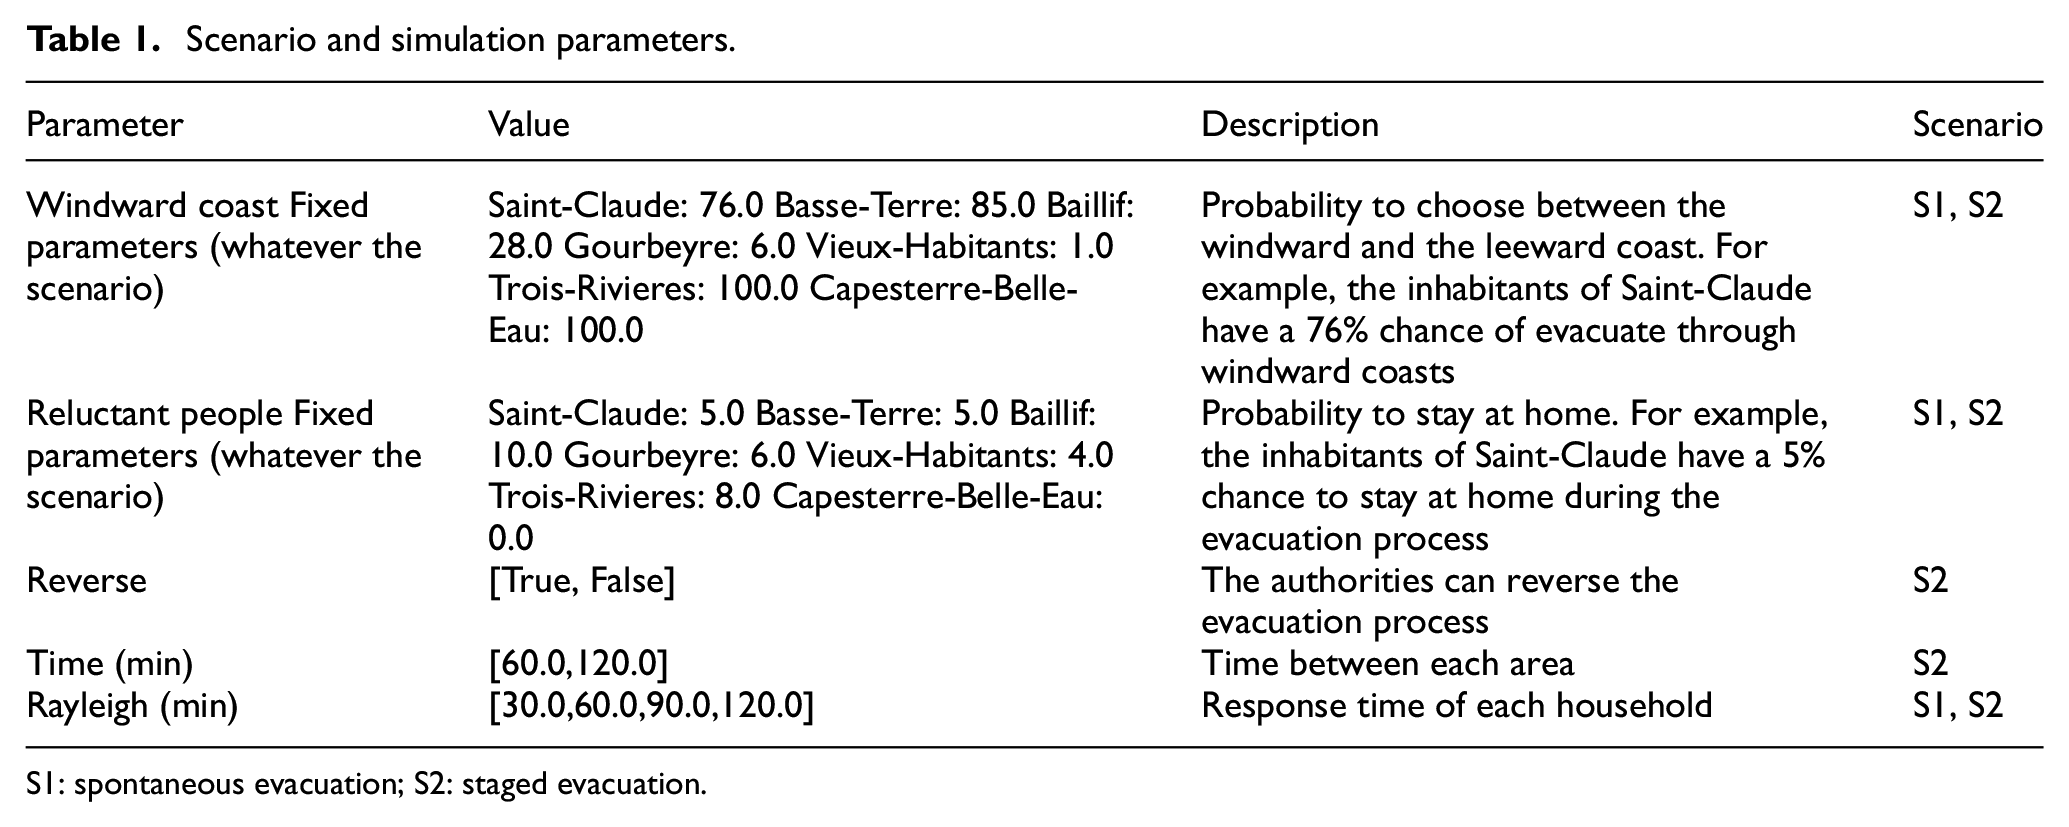
S1: spontaneous evacuation; S2: staged evacuation.
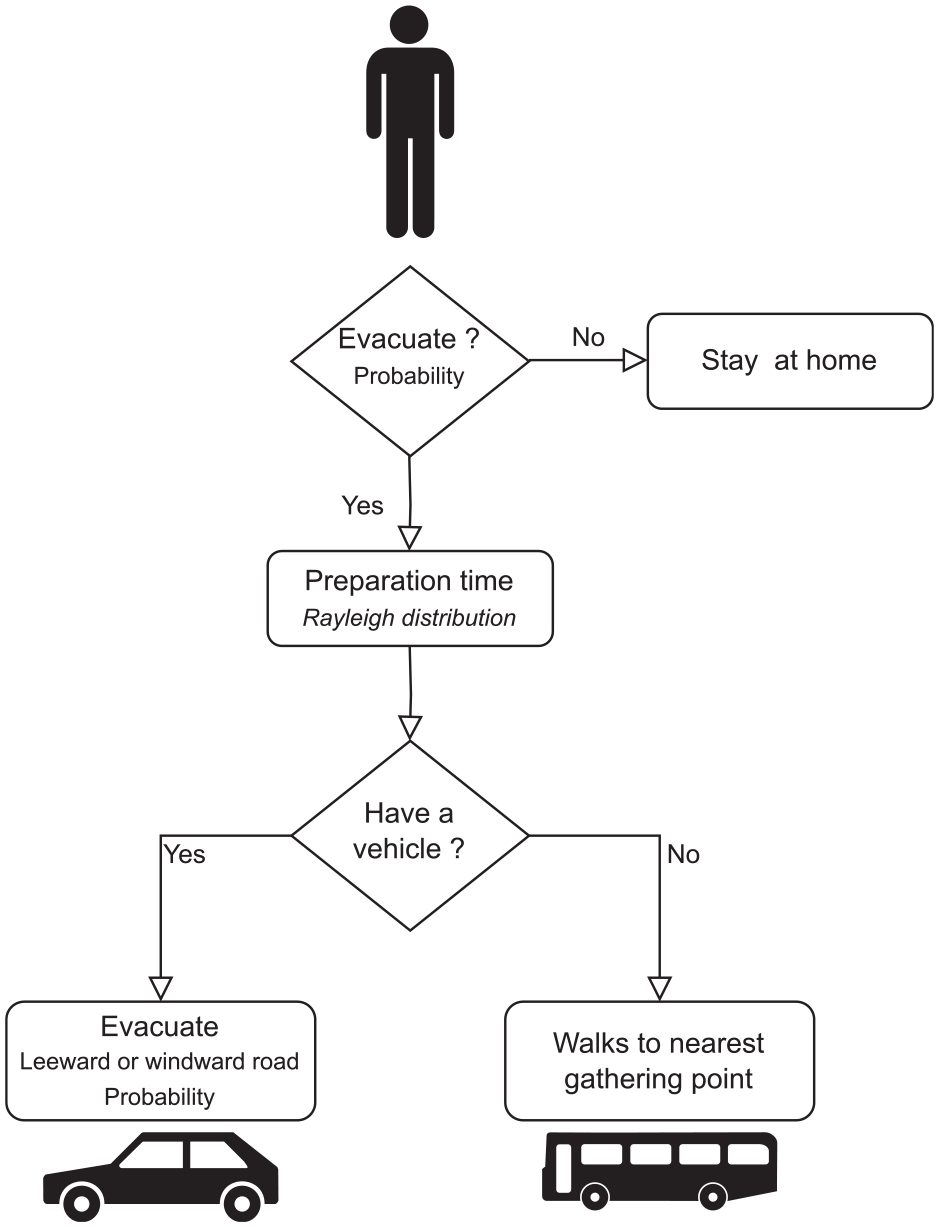
The decision-making process of the synthetic “household.”
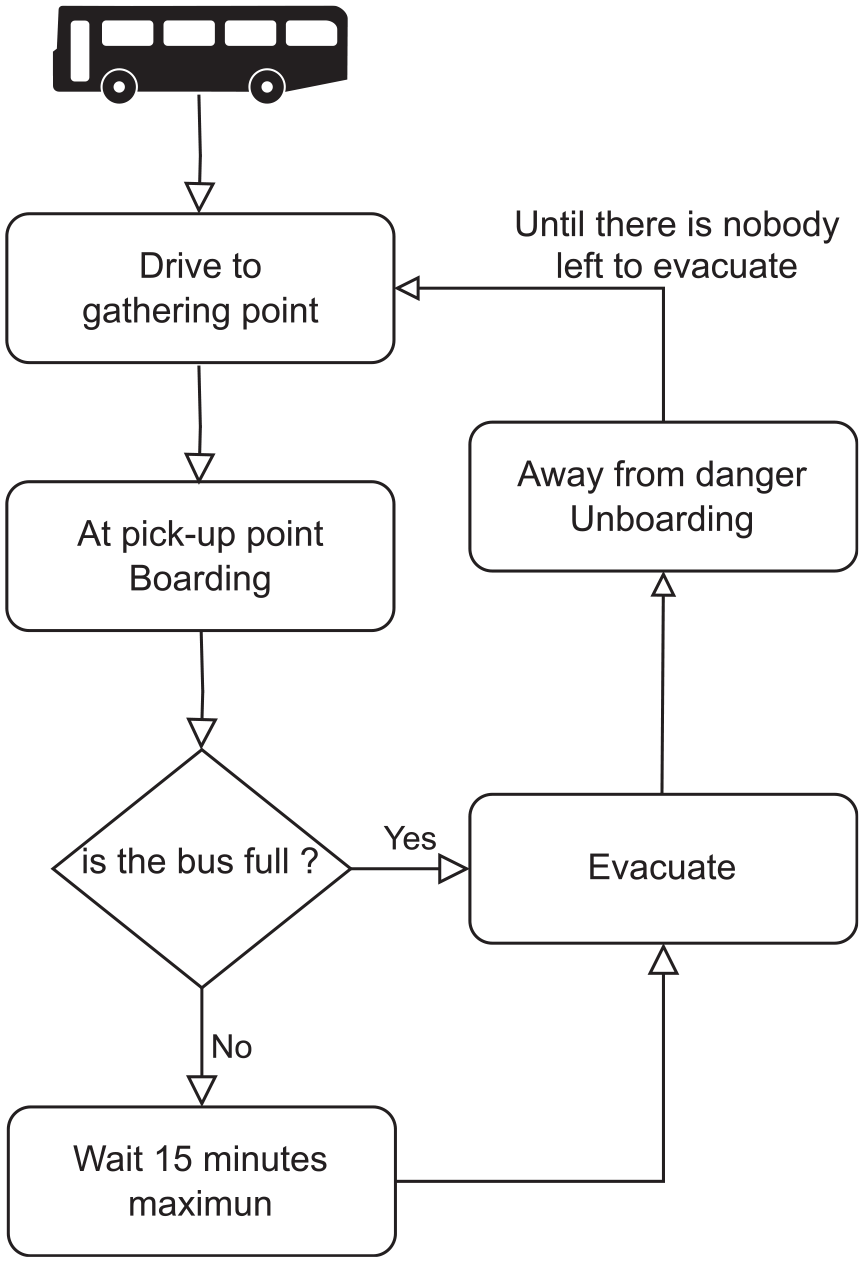
State charts of buses.
4.2. Design concept
In the current system, congestion results from the interaction between moving agents and the capacity limits of the road. Moving agents can perceive other moving agents and adapt their speed to the speed of other moving agents and to the road infrastructure. 76 The model is stochastic in several aspects. The decision to evacuate, the choice of escape route, and the reaction time are randomly generated. The first two are generated using simple probabilities calibrated by the survey results. The last source of stochasticity is due to the Rayleigh distribution. As mentioned above, ESCAPE is a generic tool and the system can produce several outputs (evacuation time, traffic records, occupancy rate of bus stops, etc.). A simulation produces between 1 and 2 GB of data, depending on the duration of the simulation and the data recording intervals. The decision to export a large volume of data was taken in order to study the robustness or sensitivity of the model to the variability of many indicators. For example, the system records vehicle position every second.
4.3. Details
The environment is characterized by: (1) roads, (2) buildings, and (3) evacuation points. Unfortunately, in the southern region of Basse-Terre, there are gaps in traffic registration. Similar to most islands in the West Indies, Guadeloupe has a limited road network and there are only two main routes to Grande-Terre via the “windward” coastal road (East) or the “leeward” coastal road (West). The previous projects79,80 and the recent field surveys give us some useful information to calibrate the road network. These surveys allowed us to obtain information on evacuation routes and estimate the potential traffic load on the road network. It has also been observed that the maximum speed limit is very different from the real one. The maximum speed limits on roads or hiking trails are based on more than 1000 km of routes that we measured by GPS track records. A synthetic population was generated from the national census survey 2017 (INSEE, the National Institute of Statistics and Economic Studies) and then spatialized on housing polygons (BD TOPO / IGN). The process involves two steps. First, we generate the population using the IPF algorithm,62,63 and then the population is spatially distributed. To do this, we need to calculate the capacity of each residential building based on its characteristics (number of floors, area) and the global population in the study area. 81 Finally, a residential building was randomly assigned to each artificial household. Currently, there are no data on people and their daily mobility behavior. However, a survey was carried out last year by the government institutions and will soon be available (Préfecture de la Région Guadeloupe). Most of the local EPPs in the area did not mention collection points. From scratch and based on graph theory, we then proposed a method to locate bus stops on the territory (two points per municipality). The criteria used are: (1) population density and (2) betweenness centrality of the nodes of the road network. The only constraint is to respect a minimum distance between two pick-up points in the same municipality. Two scenarios have been implemented in the system, spontaneous versus staged evacuation. For the first, only the scale parameter of the Rayleigh distribution is evaluated. For the second scenario, the experimental design is set up with three varying parameters, the time between each zone, the scale parameter of the Rayleigh distribution, and the order of the sequence (see Table 1). The latter corresponds to the ability of the French authorities to reverse the evacuation process. The classical evacuation process starts with the evacuation of the most vulnerable people (see Figure 1, bottom left). This order can be reversed in the system. The less vulnerable people will evacuate first to avoid traffic jams and other incidents. The other two parameters, reluctant people and main routes, are always fixed.
4.4. Stochasticity, calibration, and validation
To explore the stochasticity of this simulation, we evaluate the randomness of two indicators using the average value.82,83 The objective is to find a sufficient number of replications to capture all stochasticity of the system. The first indicator is the number of people who are safe 5 h after the start of the evacuation. The second indicator is the time needed to evacuate 80% of the population. We make 100 repetitions of a combination of parameters [Rayleigh::60.0, Time::120.0, Reverse::False]. Figure 4 shows the average value as a function of the number of replicates. We can see that after 30 repetitions the average value has not changed significantly. The simulation results therefore represent an average of 30 replications. The model was run 30 times for each combination of parameters, for a total of 600 runs.
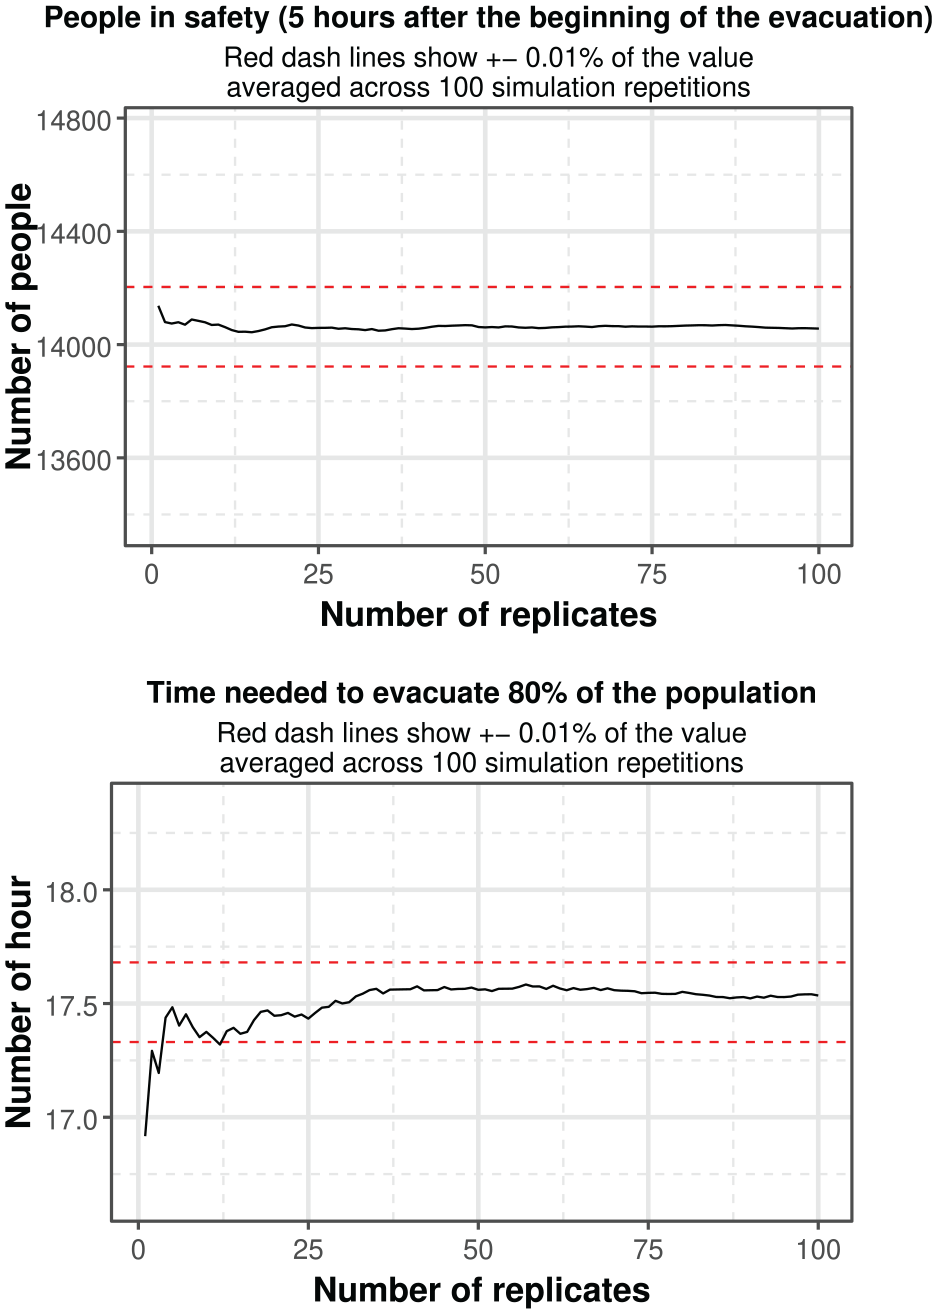
Stochasticity—two indicators after various number of replicates, the number of people having reached the safe zone 5 h after the beginning of the evacuation and the time needed to evacuate 80% of the population.
The validation of the multi-agent simulation is difficult, 84 for various reasons (missing data, epistemic uncertainties, etc.). But it is essential to calibrate and validate models. Without this, it would be impossible to provide realistic model output. The model was calibrated by means of a field survey (moving speed, reluctant people, escape routes). Given the lack of statistical validation, the model was submitted to experts to assess its consistency with the modeling question. Between 2019 and 2022, several interviews were conducted with local authorities (risk managers, COMGEND (Direction régionale de Commandement de la Gendarmerie), SDIS (Service Départemental d'Incendie et de Secours) and scientific experts to collect information on various crisis management plans and prevention measures in order to elaborate the system. A workshop to present the study’s results and raise stakeholders’ awareness was held by the municipality of Basse-Terre in 2021. The presentation of the preliminary results led to a lively discussion on the organization of crisis management (pick-up points, buses, shelters) and validated certain results (e.g., traffic hotspots were confirmed by local risk managers). Real and simulated vehicle travel times were also compared to validate travel times.
5. Results and discussions
The model was applied to use the actual Volcano Emergency Plan of La Soufrière of Guadeloupe. The simulations were carried out for the first day of preventive and mass evacuation, spontaneous or staged, of the inhabitants of the southern Basse-Terre area. This means that, in this scenario, we do not simulate a volcanic eruption and therefore the possibility of an impact on the network (network cut by lahars, layer of ash that can slow down vehicles in traffic, etc.). The simulation starts early in the morning (08:55:00) and it is assumed that residents would evacuate their homes. Furthermore, our model assumes that residents are well aware of the evacuation routes.
In order to evaluate the assumptions of the Volcano Emergency Plan, through various outputs of the system, we seek to obtain the number of people/vehicles evacuating during the simulation, the peak time of the evacuation (maximum number of evacuees on the road), the total evacuation duration, and the traffic indicator. The time step was set to 1 s. The simulated time, corresponding to a complete day, i.e., 24 h (86,400 steps). With OpenMOLE 31 and CRIANN’s (Center Régional Informatique et d'Applications Numériques de Normandie) high-performance computing resources, large-scale parallelization is possible, allowing large design experiments to be explored. In terms of computing time, a simulation takes about 6 h.
The published “volcanic eruption” EPP (ORSEC) for Soufrière of Guadeloupe assumes a traffic volume of 400 vehicles per hour for the entire road network. Based on this value, it is estimated that it would take about 24 h to evacuate all the vehicles (one vehicle per household and a household motorisation rate of 67%). Compared to the official estimate, Figure 5 shows that it would take 20 h to evacuate all the vehicles, a difference of 4 h compared to the actual estimates based on an average flow of vehicles. Taking into account the different modes of travel (by bus, by private car, and on foot) reveals gaps in the evacuation time. In fact, the evacuation of households without vehicles, such as pedestrians, takes more than 20 h. The evacuation rate is slightly below 95% of the population 20 h after the beginning of the evacuation. A total of 21–22 h (21.6 h on average) are needed to evacuate all the inhabitants of the southern region of Basse-Terre. The graph shows the subtle differences between the various parameters of the Rayleigh function. With a response time of 30 min, it takes 5 h to evacuate 40% of the cars. On the contrary, with a response time of 120 min, it takes almost 6.5 h. Beyond 7 h, the curves come closer together. This can be explained by the location of the safety exit point 1, the configuration of the study area and the traffic jams. Compared to the total evacuation times, the staged evacuation times are very similar (see Table 2). The main reason for this similarity is the potential saturation of the road network due to the successive entry of vehicles into the traffic. A possible explanation for this observation is that the more or less important individual delays (according to the Rayleigh distribution) counterbalance the potential gains related to the delays per zone imposed by a phased evacuation.
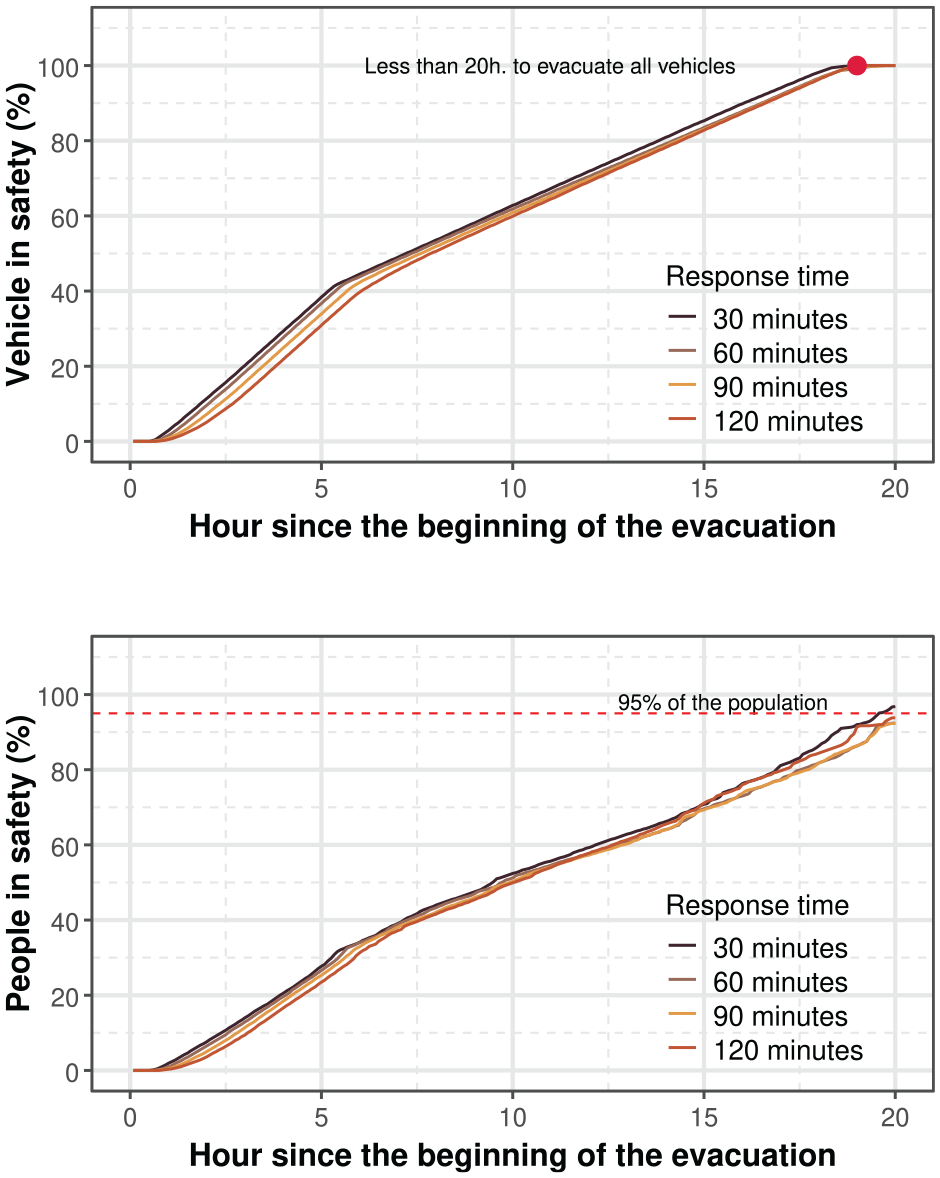
Spontaneous—the temporal accumulation of the vehicle (top) and people (bottom) in safety.The response corresponds to individual response time (parameter sigma of the function Rayleigh).
Comparison between spontaneous or concerted evacuation (mean on 30 runs).
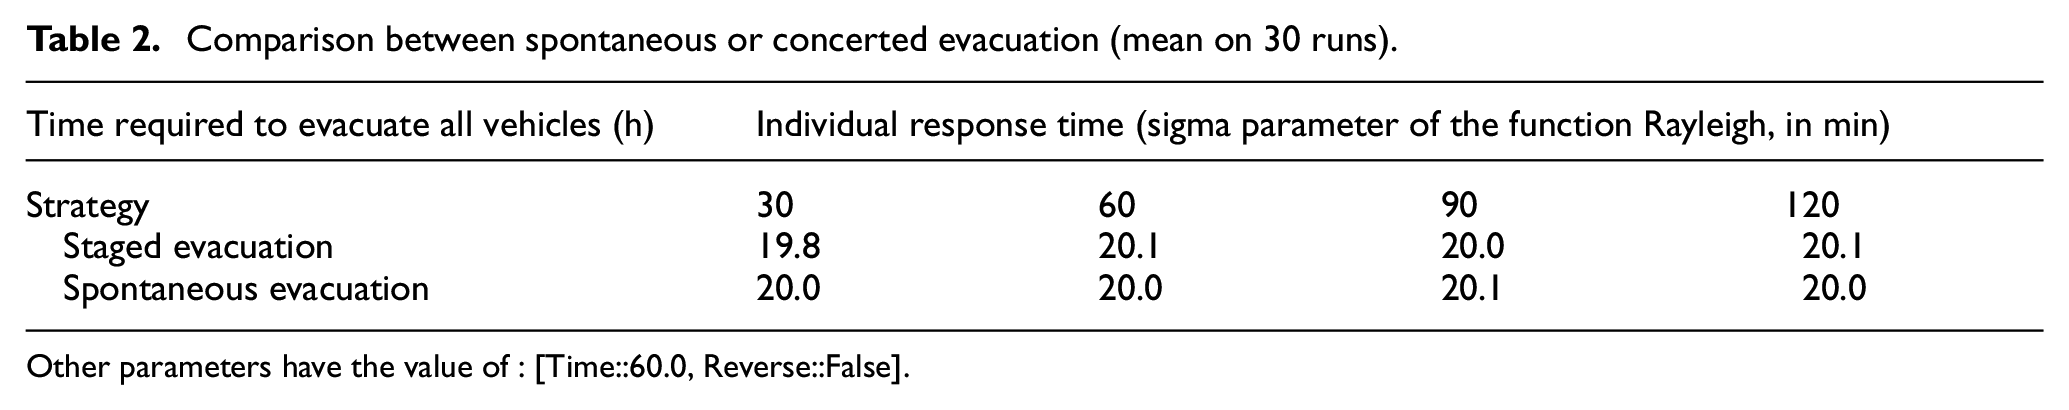
Other parameters have the value of : [Time::60.0, Reverse::False].
The evolution of the number of cars on the road confirms this intuition (see Figure 6). With a delay of 1 h between each evacuation zone, and with a short average individual response time (30 min), the network fills up linearly with vehicles without any “respite” phase and therefore without any real possibility to absorb possible difficulties, such as accidents or vehicle breakdowns for example (see Figure 6, top). We will return to this last point later. With 2 h delay between each zone and the same short response time for individual decisions (see Figure 6, bottom), we observe a more rhythmic traffic dynamics, but increasing the individual response time cancels this effect. The comparison between these two strategies (one hour versus two between departure zones) shows that the second one is better in the case of a preventive evacuation because whatever the hypothesis on the individual response in terms of preparation time, there are fewer vehicles present on the network, which reduces the risk of accidents, and that after about 10 h of evacuation, the two evacuation scenarios converge.
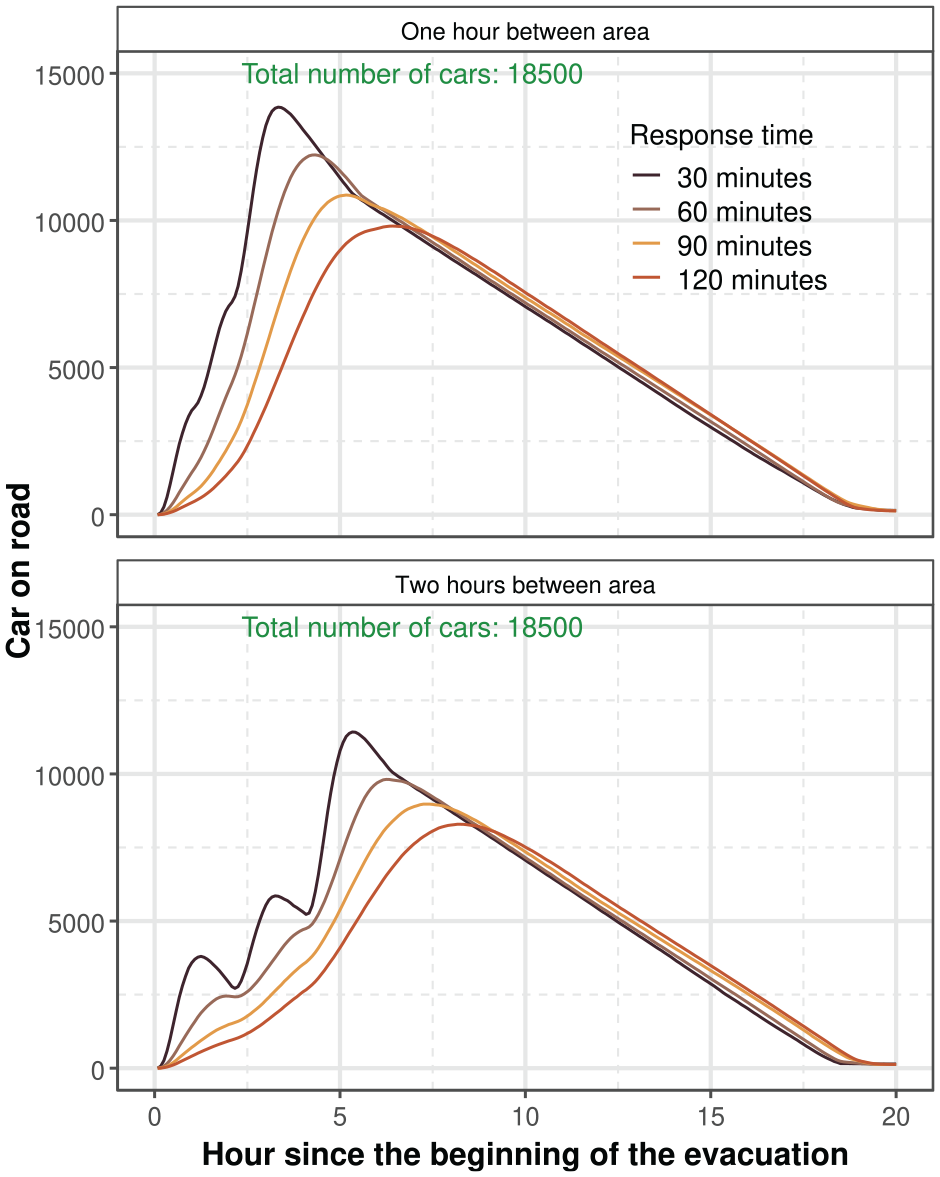
Staged—number of cars evacuating on the road.The response corresponds to individual response time (parameter sigma of the function Rayleigh).
Despite the reduction in the evacuation time (see Figure 7, bottom), the global clearance times are quite similar (see Figure 6). The average global evacuation, all “staged evacuation” simulations taken together, is 20.17 h with a standard deviation of 0.8. However, it is clear that the strategies produce different distributions of road car load with time during the evacuation with a shift and reduction in the peak duration of the evacuation. Figure 7 shows the evacuation time of households with vehicles. For both strategies, classic and reverse evacuation, this figure shows a reduction in evacuation time when the delays between areas are 2 h. For the “classic” strategy (1 h), the differences between eight scenarios are large. The median is divided by two between a worst-case and a best-case scenario. At first sight, the “reverse” evacuation strategy appears to be an effective way of avoiding critical situations and reducing traffic congestion. However, in this experimental design, the reverse strategy is not recommended to optimize evacuation. The results show similar evacuation times, except when the time interval is 2 h, the evacuation time increases slightly.
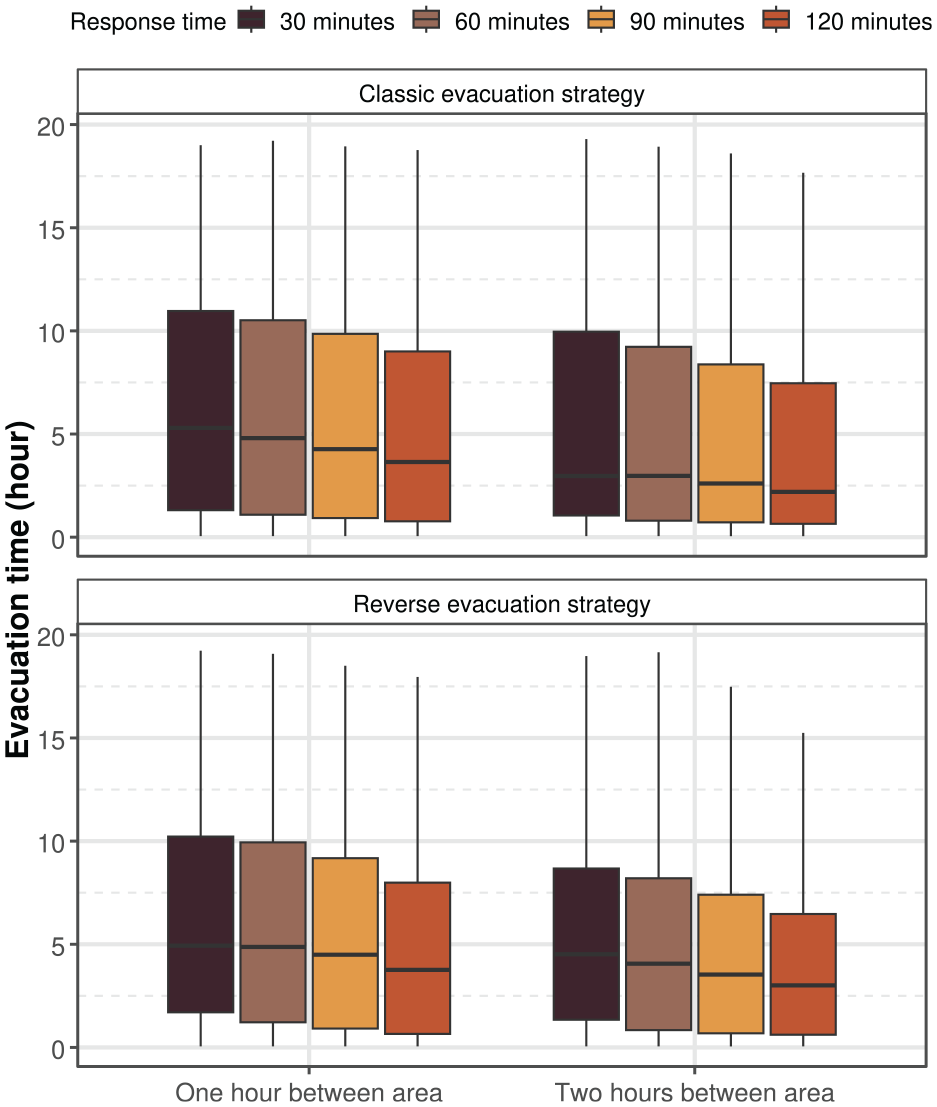
Staged—evacuation time of household with vehicle.The response corresponds to individual response time (parameter sigma of the function Rayleigh).
Figure 8 shows that the simultaneous strategy (see Figure 8, top) creates more traffic congestion than the staged evacuation strategy. In particular, the center of Saint-Claude and Basse-Terre towns became completely congested due to the spontaneous mass evacuation of several tens of thousands of people and the configuration of the road network. These maps show the average time spent by vehicles in each cell with a spatial resolution of 1 km. This means that a household evacuating from the north of the town of Saint-Claude could be stuck in traffic for more than 2 h. As noted above, staged evacuation smoothes the curves of the number of vehicles on the road and can therefore reduce traffic congestion (see Figure 8) as well as better accomodate unplanned complications and emergencies. The most efficient case [Time::120.0, Reverse::False, Rayleigh::120.0] eliminates the traffic hotspots with the same global clearance time (see Figure 8, bottom). Only one hotspot remains in the scenario in the center of the town of Capesterre-Belle-Eau, in a low-risk area (see Figure 1).
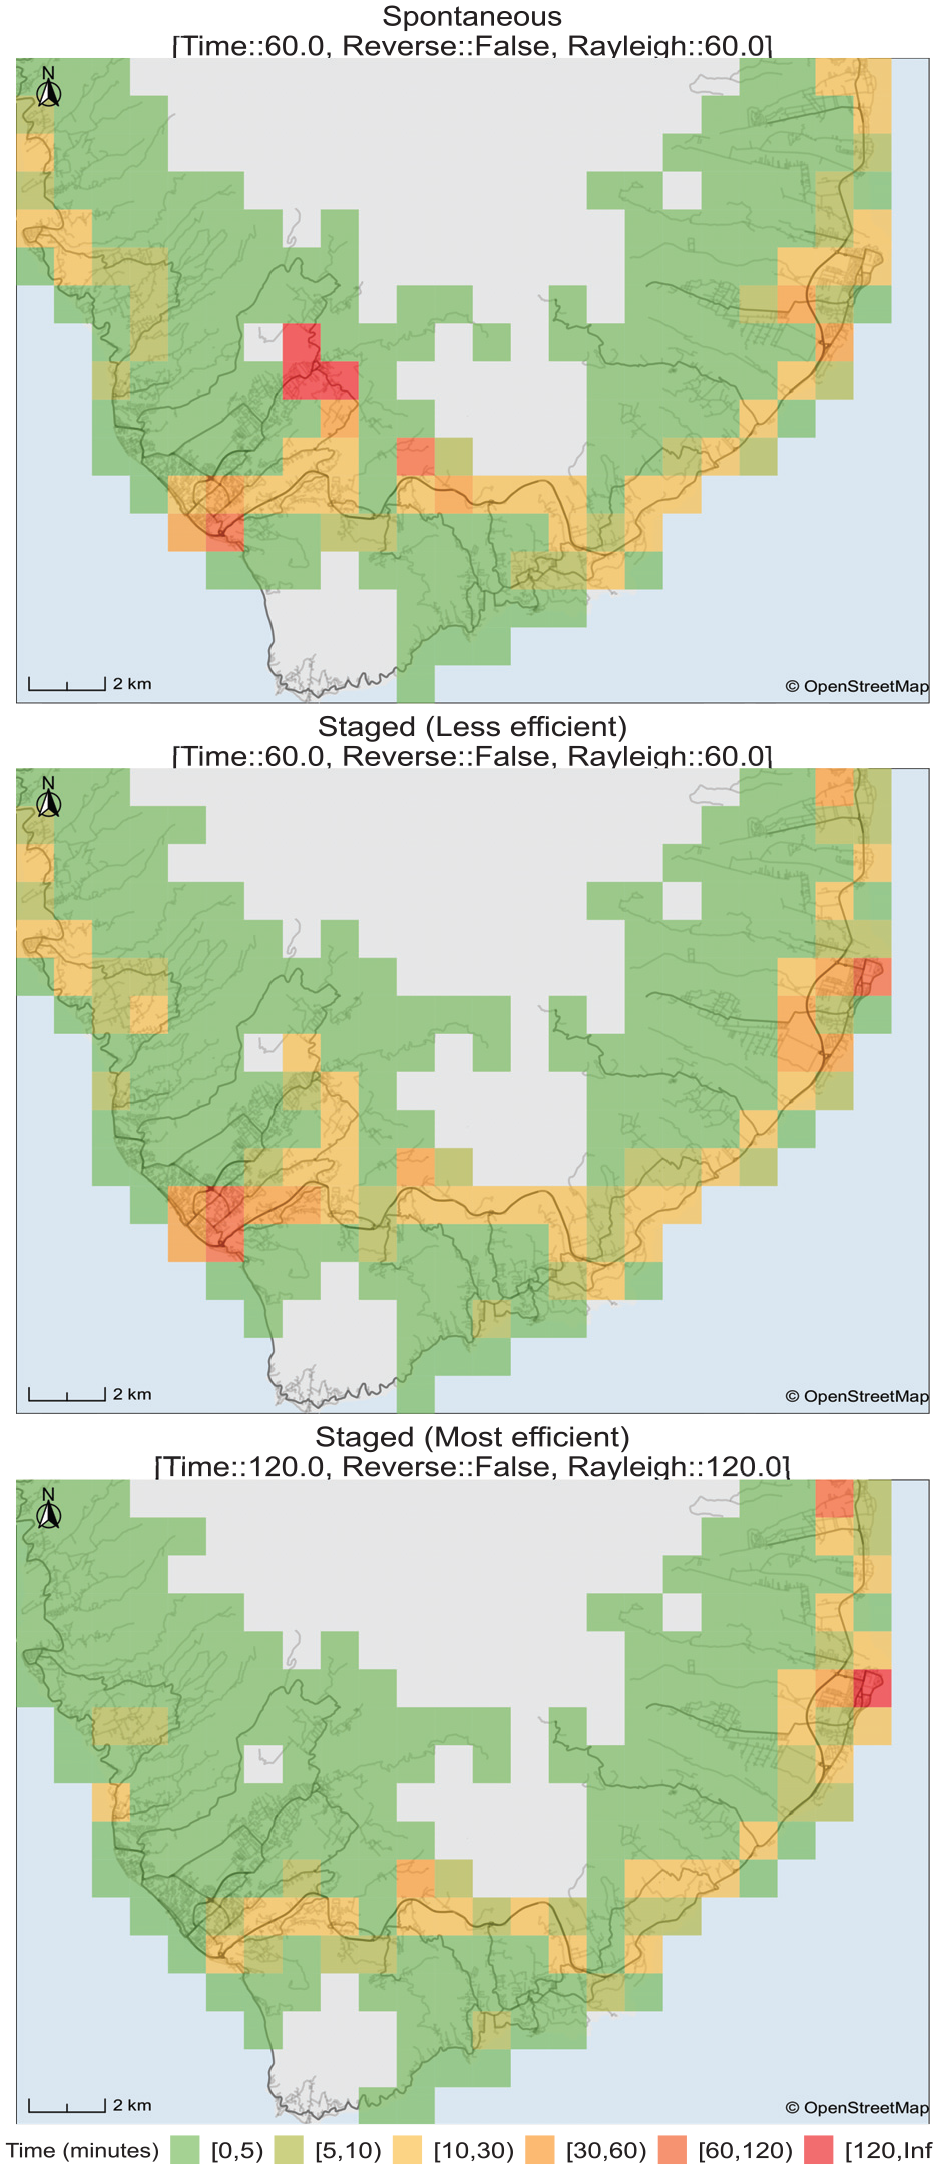
Staged—traffic jam hotspots for three combinations of parameters, spontaneous and staged (less and most efficient case).The cell value represents the average time spent by vehicle in each zone.
6. Conclusion
Any future eruption of La Soufrière of Guadeloupe could pose a major risk to the population. This is reinforced by the fact that civil society in Guadeloupe is characterized by a collective behavior of denial of volcanic risk, favored by the long eruptive quiescience of La Soufrière of Guadeloupe,10,80 in this, surprisingly so, despite the elevated, prolongued, and increasing multiparameter volcanic unrest since 1999, which lead to the yellow vigilance alert level as of 1999 and ultimately required the Prefect to implement access restrictions to the summit area as of October 2018. In this multi-risk context, denial of the volcanic risk significantly undermines and limits prevention and emergency response planning by the authorities. Despite the uncertainties and the simplification of the system, ESCAPE is intended to be a decision support system in order to provide recommendations, initiate discussions, and test practical strategies with risk managers with the ambition to improve timely and efficient decision-making and operational response thereby enhancing mitigation measures and risk-reduction strategies.
In this paper, we proposed a method to investigate the dynamics and efficiency of evacuation strategies and to test the current ORSEC emergency response plan for a potential eruption of La Soufrière of Guadeloupe. ESCAPE-VOLCANO integrates the results of several field surveys to model human behavior and calibrate the road network in order to respond to the above objectives. The model considers different preventive evacuation strategies and produces different outputs to assess the consequences of these strategies on road traffic during the evacuation process. The results show that there is no evacuation strategy (i.e., staged or simultaneous) that can be considered as the most effective strategy to get people out of the area affected by a hazard. No strategy can optimize or significantly improve the evacuation process compared to the others. On average, it takes 20 h to evacuate a population of about 58,478 people exposed to mapped hazards zones. 8 This lack of difference is mainly explained by the specific characteristics of the island communities affected by the volcano and the road networks, which are essentially coastal and with low connectivity. 10 This leads to a rapid saturation of the road network and the national highways, whatever the strategies. The phased evacuation strategy (especially for certain combinations of parameters) reduces road congestion during peak hours, confirming the results of previous studies.13,15 It is important to remember that the system does not take into account traffic incidents, undesirable behaviors, such as selfish behaviors (no carpooling) and mistrust toward government, or “domino effects,” which can have serious impacts on traffic flow. In summary, the results indicate that, depending on the individual response time, the staged or simultaneous strategy could lead to higher traffic density. The departure time of “autonomous” households needs to be controlled to ensure traffic safety. And the simulations recommend increasing the time interval between each zone or basing the evacuation of each zone on a real-time evaluation of the traffic.
According to the reports, the last evacuation in 1976 took place in a calm atmosphere without any major incidents. The “selfish” behaviors, such as incivility (non-respect for the Highway Code, for example), were rare. What will be the evacuation like today with the evolution over the last 40–50 years in the behavioral characteristics of the population in Guadeloupe society? This is a difficult question to answer. Society has changed a great deal in half of a century. One thing is certain: it would be difficult to evacuate the entire population. Indeed, about 50% of households will take all their personal vehicles and leave as soon as possible without following the staged evacuation. Despite some limitations (uncertainties, simplification), the current model provides interesting results that can be used to support local decision-makers in risk management planning.
Whatever the strategy, it will be increasingly difficult to control road traffic. The operations director must be supported by the police or the civil defense to maintain the traffic flow at expected difficult points (e.g., town of Saint-Claude and Basse-Terre), to control evacuation procedure, and to avoid counter evacuation flow traffic from people coming into the evacuation zone to fetch their elderly family members and relatives that have no cars and might be reluctant to use the buses. Future studies along this line of research will investigate the evolving effects of volcanic hazards (ashfall and pyroclastic flow) in space and time in the evacuation zone and examine the potential consequences of undesirable behaviors such as fleeing with multiple vehicles per household. Given the current elevated unrest at La Soufrière of Guadeloupe and the recent major efforts by Civil Protection authorities to perform volcano emergency exercises in Guadeloupe since 2019 (e.g., Journées Japonaises - https://www.guadeloupe.gouv.fr/Actions-de-l-Etat/Securite/Risques-naturels-et-technologiques/Les-risques-telluriques-en-Guadeloupe/Les-journees-japonaises-qu-est-ce-que-c-est) the simulation approach developed in ESCAPE VOLCANO have shown their high potential as an innovative and insightful quantitative tool to improve decision-making and crisis response by stakeholders.
Footnotes
Funding
This work is funded by a 80–Prime project (CNRS grant) and by the ANR ESCAPE project, grant ANR-16-CE39-0011-01 of the French Agence Nationale de la Recherche. This work was performed using computing resources of CRIANN (Normandy, France). We thank Audrey-Michaud Dubuy and Guillaume Carazzo and the PREST INTERREG Project (PI: IPGP) for providing tephra fallout simulation results as part of their modeling of a series of eruptive scenarios for potential eruption of La Soufrière of Guadeloupe and Montagne Pelée.
78
Volcanological data used in the chracterization of the hazards were acquired thanks to recurrent funding from the IPGP and the Service national d’observation en volcanologie (SNOV) of CNRS-INSU, the EUROVOLC EU project and the ANR CASAVA ANR-RISK-09-002 project (2010–2014; ![]() ).
).