
Abstract
This paper proposes a traffic modeling and a simulation methodology to assist the dimensioning of the capacity of advanced wireless systems. Knowingly, such systems accommodate a diversity of services with corresponding different bandwidth and traffic characteristics, which leads to intricate dimensioning solutions. In our methodology, we treat each type of traffic using its proper model and bundle them in a simulation tool. A fundamental contribution of this work is the proposal of a simulation tool that incorporates general traffic models to yield the performance of the various traffic flows requiring different bandwidths when sharing the same pool of resources in a loss system consisting of a link with a limited capacity. Given the generality and complexity of the model, analytical solutions are not available, and simulation has proven to be a beneficial tool for analyzing and dimensioning the system, with surprising results.
1. Introduction
The performance analysis and dimensioning of advanced wireless communications systems are complex and challenging subjects. These systems encompass diverse services requiring different traffic resources and grades of services. Such complexity does not lend to analytical solutions, and simulation is a valuable tool. Simulation constitutes a helpful, flexible and handy tool in such a case, allowing the designer to have a clear view of the aspects to tackle for the appropriate dimensioning and operation of the system.
This work aims to contribute to the capacity analysis and dimensioning of advanced wireless communication systems, considering typical performance aspects of dense heterogeneous networks. Due to the known complexity and consequent lack of current analytical methods, we chose to select and simulate a set of representative study cases allowing for a more discernible view of aspects not yet focused on the problem.
The terminology used here aligns with the concepts of mobile cellular networks.1,2 Furthermore, although the work has been oriented to the latest standards of the Mobile Communication Systems of the Fifth Generation (5G), using their technical characteristics and limits, it also applies to any cellular mobile system structured to form one or more heterogeneous networks, like the Fourth Generation Systems (or 4G Systems), or even with the so far established principles of the Sixth Generation (6G) Systems.
Section 2 formulates the problem and establishes the objectives of the study. Section 3 provides a review of the relevant literature. The traffic modeling approach and the simulation framework are described in Sections 4 and 5, respectively. Section 6 presents remarks on model validation, whereas Section 7 reports some of the main results. Section 8 discusses the application of these results to practical system dimensioning, and Section 9 concludes the paper.
2. Problem description and goals
Dimensioning and assessing the performance of wireless networks involves dealing with parameters and metrics such as carried traffic, blocked traffic, throughput, blocking probability, and bandwidth, to mention a few.
Regarding traffic bottlenecks in a wireless network, several capacity aspects must be considered, including radio coverage, local transport (fronthaul and backhaul), core processing, gateways to applications, among others. The problem of dimensioning a wireless network consists of predicting and managing the capacity required in the wireless access segment (radio access network [RAN]) and the network core, and it is a well-studied problem. However, due to its geographic spread, the RAN is the most expensive part, where dimensioning is most valuable and challenging. In particular, the best solution and sizing of the backhaul have been one of the most investigated targets. Thus, several questions remain to be researched, for instance:
What is the influence of the type or nature of traffic, the bandwidth of the services, and the holding time of connections?
What traffic composition and throughput can a cell or a wireless system bear?
What are the traffic limits beyond which the grade of service no longer presents improvements?
How do we evaluate network bottlenecks, like the backhaul’s threshold?
From what bandwidth can a service block a picocell, if at all?
We approach these questions in the following sections.
3. Related work
The literature on modeling multi-rate or multi-service traffic systems is copious, especially after 1980, when the market and modern technologies made it possible to offer integrated transport of services previously available on independent dedicated networks.
It became necessary to allow for different services with different traffic characteristics on the same transmission link, considering various criteria to reject or delay new attempts in case of congestion. This trend was noticeable for services offered over the telephone line (Integrated Services Digital Networks [ISDN]) and services provided via data networks (Digital Subscribers Line [DSL] or local area networks [LAN]). Quality of service (QoS) mechanisms emerged to guarantee service for prioritized traffic flows, and several algorithms for calculating or measuring performance-related parameters, such as blocking probabilities, became available, adapted to the environment in which they were applied, for example, a PCM link, a radio link or an Ethernet bus.
Kaufman, 3 Iversen4,5 and Labourdette and Hart 6 achieved remarkable results with classical analytical approaches. Kaufman extended the concept of Erlang loss systems, introducing distinct types of users with different arrival rates and bandwidth requests. Iversen 5 presented an algorithm for a model with multiple service request processes, insensitive to holding times distributions. In fact, Iversen model encompassed both homogeneous or inhomogeneous Poisson traffic, and with different arrival rates, thus expanding Kaufman’s results to systems where the arrival processes do not follow the Poisson distribution.
Labourdette and Hart 6 demonstrated two theorems on asymptotic behavior, as well as the validity of the product form to describe the number of states of occupied circuits when the capacity and intensity of traffic increases in an unlimited way and proposed an approach that reduces the numerical complexity for different classes of service using the Erlang formula and the root of a polynomial.
The latest approaches include modeling aspects, as well as load balancing and optimization algorithms, as described in the following works.
Marin et al. 7 address the performance analysis and develop a new queuing model, showing that, under the considered Admission Control policy, the queuing model is reduced to a product form expression for the joint probability distribution of diverse types of services. Saad et al. 8 put forward a load-balancing self-optimization algorithm that optimizes the handover control parameter by switching loads in the overloaded cells to adjacent cells with fewer loads. Gures et al. 9 proposed an algorithm that prioritizes mmWave cells to satisfy load level and signal reception conditions in target cell selection.
These references are part of the state of art of the subject matter and clearly show a concern about traffic and parameters optimization. A lot of issues and procedures are suggested, but they do not clearly state how service bandwidth can effectively impact system capacity assuming that cell capacity is defined by the number of carriers used and their bandwidth, radio access technology, and the core network link capacity (backhaul links).
In this work, we conduct extensive work using simulation as a line of investigation and considering the general applicable probabilistic models to describe the addressed systems. Within that scope, simulation always refers to systemic or system-level simulation. The simulation experiments in this work aimed to investigate the carried traffic flow of one or more cells, considering the capacity limitations of the available backhaul.
4. Data analysis and traffic profiles
4. 1. Basic data
The radio capacity is well defined for 5G Systems by the International Telecommunication Union Radiocommunication Sector (ITU-R).1,2 As is well known, 5G Systems are designed to support diverse services with different bandwidths and demands according to the radio coverage.
The expected demand is better expressed by the traffic offered, which is an independent variable useful to traffic flow control.
Typically, offered traffic is distributed in the following applications, among others:
Messaging (emails and text messages), downloads, video streaming, voice calls and audio streaming.
Browsing, social media and navigation.
Games.
Although a wireless network cell also manages terminated and handover traffic, this has not been considered in our analysis. On the other hand, the final effect, if considered, would be an increase in the occupation of resources, therefore, not affecting the overall conclusions and recommendations drawn in the present work.
Monthly data consumption depends on the type of each of these applications and their use frequency. For example, streaming high-definition video (HDV) consumes more GB/month than plain text messages. However, the number of minutes spent per day on this activity and the use frequency do influence monthly data consumption. Although variable in time, and per user or region, it is possible to evaluate the amount of data consumption monthly per user, based on application requirements, as shown in Table 1.10,11
Typical data consumption per application.
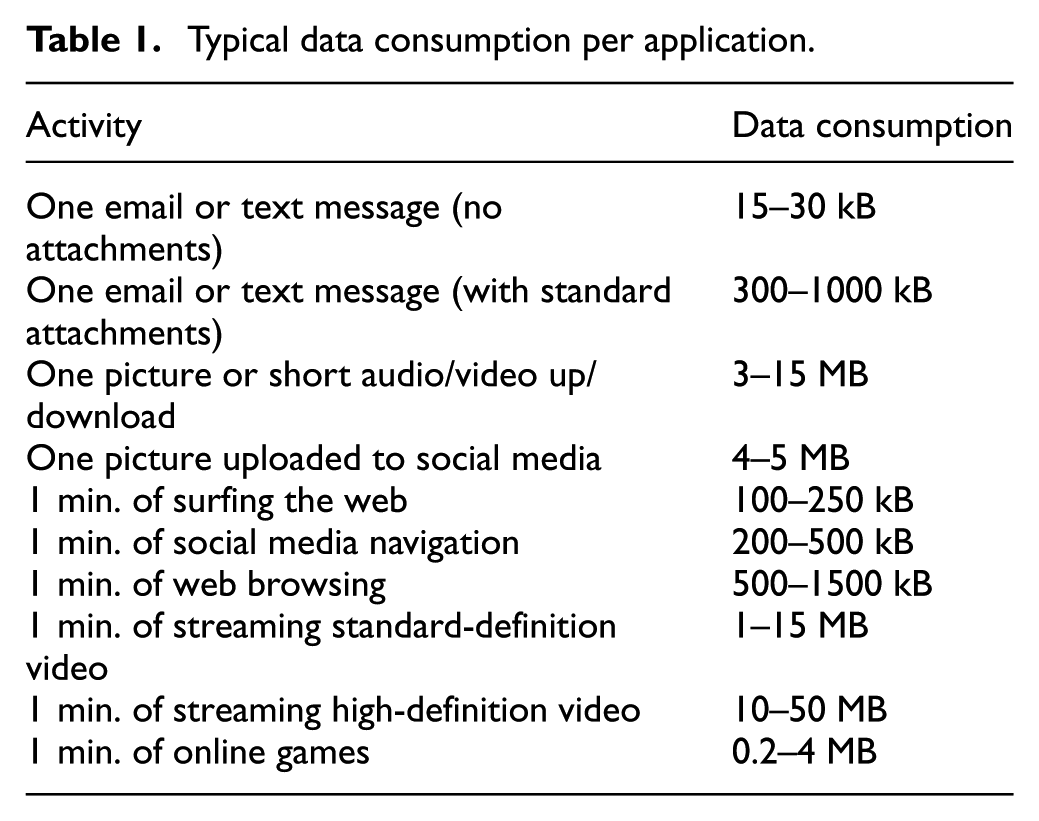
This kind of data and tools can be found on the web, supplied by telecommunications services providers or communications authorities showing similar figures and typical monthly frequency of usage. Such data is also dependent on devices and operating systems. For example, smartphones have distinct characteristics from tablets and notebooks, likewise Android from Mac, or Windows.
4.2. User profile and traffic
Table 2 exemplifies two different Smartphone user profiles: a heavy user and a light user. Any other feasible profiles could be defined, but we consider only those two for this work. Traffic generated from Tablets and Notebooks is regarded as a minor part of total data traffic.10,11 For this reason, they were not considered in this study.
Different user profiles.
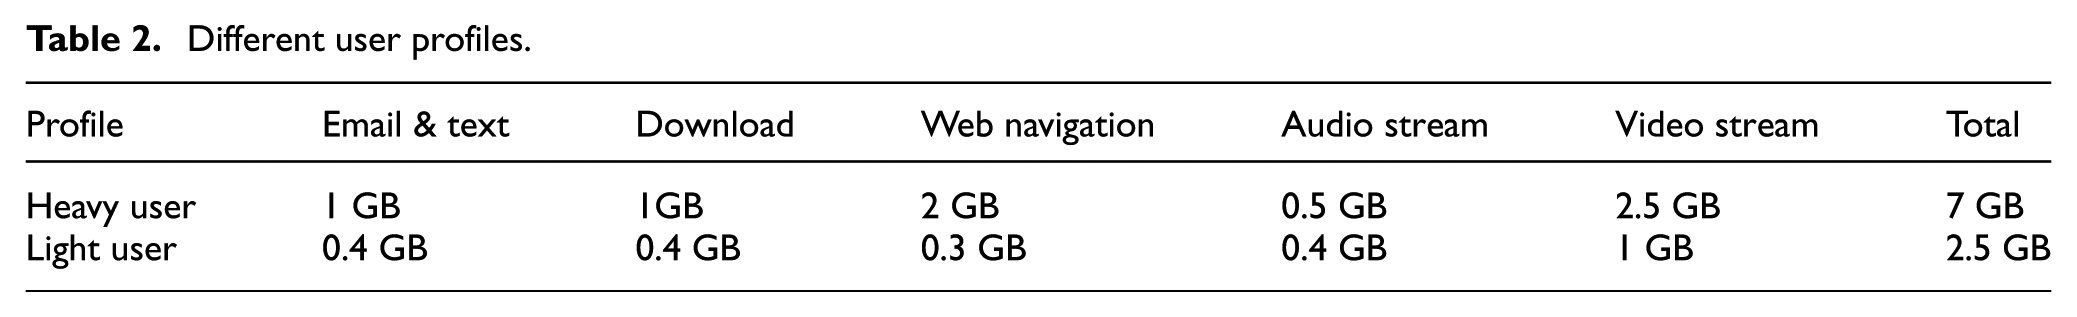
A basic assumption is that applications like those in Table 1 are available and will be used (on average) according to profiles like those in Table 2. Each application can be considered a service of a different type, and users’ request of services happens at random. Streaming services are very time-sensitive but less sensitive to packet loss, and elastic services are less time-sensitive but more sensitive to packet loss. Downloads, conversation, audio, and video streaming are examples of streaming services, whereas email, file transfer, text messages, navigation, and web browsing are examples of elastic services.
Elastic and streaming traffic represent two fundamental, contrasting types of data transmission in network engineering, each with distinct requirements for buffer capacity (the temporary storage area in network devices used to handle data surges).
Streaming applications often require smaller, well-managed buffers (or priority queuing) to ensure that their packets do not get stuck behind large, bursty elastic packets.
Elastic traffic, on the contrary, requires larger buffers to maintain high Transmission Control Protocol (TCP) throughput, allowing the user to keep its transmission pace even during temporary bursts.
5. Simulation model
As previously reported (Sections 2 and 4), the complexity and focus of the problem demanded a new simulation tool. Although other tools assist with capacity planning, coverage analysis, and throughput optimization, they did not provide the necessary means to check different traffic patterns, their effect on resources or grade of service, nor did they answer the question raised in Section 2.
5.1. General simulation model
The simulation model was conceived as an open and extensible architecture, allowing for the incorporation of additional and diverse components. This design enables the progressive enhancement of its functionalities and supports increasing levels of structural and operational complexity.
Input parameters definition can be managed on a per model (program) basis, including the total number of services, needed bandwidth and holding time per service, probability distributions of arrival and service processes, initial traffic per service and a traffic increasing criterion. In addition, up to five types of services were studied. Control parameters are managed on a per run basis and include simulation time, number of replications and statistics.
Two types of small cells were addressed: microcells and picocells. 5G Systems can be used as macrocells as well, but due to 4G depth of deployment, small cells are the most likely scenario. Microcell have an average radius of 0.15–1.5 km while picocells range from 15 to 150 m. According to a previous assessment, 12 it is assumed that, on average, microcells require a backhaul of 160 channels, and picocells of 20–23 channels if a channel represents a 64 kbit/s bearer circuit.
Streaming services are treated as queues under a loss discipline, while elastic services are managed as ordinary waiting lines.
5.2. Selected probability distribution models
Some probability distributions were selected for their properties and characteristics considering their adherence when modeling data services provided by the Internet, as depicted in the following list:
Poisson distribution. Its probability density function (pdf) is as follows:
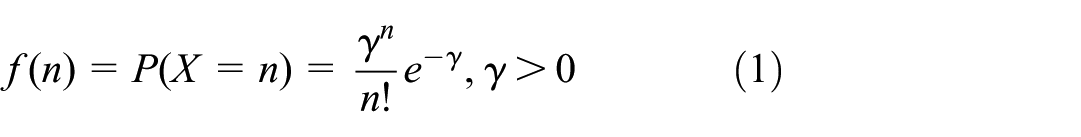
It is well known for its flexibility to cope with requests for service coming from many users. Countless times, those properties were successfully compared to empirical data, in different context or historical moments and for a diversity of technologies and services.
Exponential distribution. Its pdf is as follows:

and corresponds to the Poisson process interarrival times.
It is also considered the distribution of service duration that best fits the perfect unpredictability of service times of communication channels, which are strongly dependent on the will of the customers. In addition, noteworthy is its generalization, namely, the Erlang distribution, whose pdf is as follows:
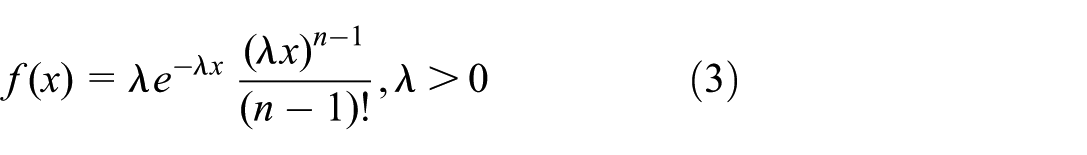
It describes the waiting time distribution for
Gamma distribution. It generalizes several probability distributions. The general form of the Gamma pdf with shape parameter k and scale parameter θ is defined as follows:
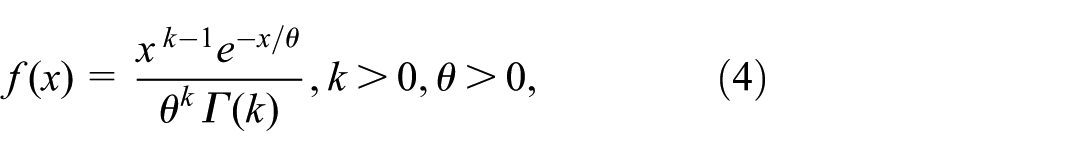
and
is the Gamma function.
For
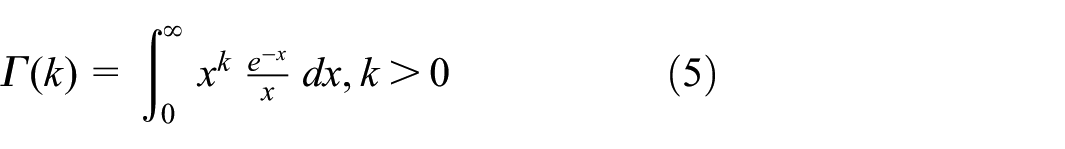
Weibull distribution. Its pdf is defined as follows:
with scale parameter α and shape parameter β.
Due to the complexity of Internet traffic including different sessions and packets in its end-to-end path, packet interarrival times as well as channel occupancy can be modeled by the Weibull distribution. 14
A recent survey from Larsson 15 shows that the Weibull distribution provides the best fit for empirical data concerning channel occupancy.
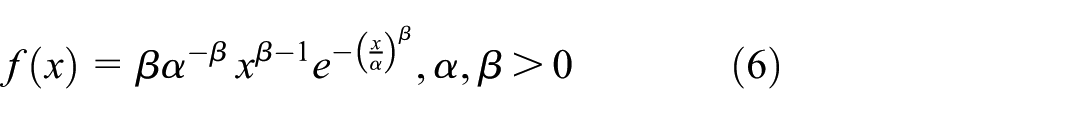
Pareto distribution. It is an asymmetric, heavy-tailed distribution used to model the distribution of income and other financial variables, and more recently, to represent the behavior of TCP traffic. 16
For the basic Pareto distribution with shape parameter
In short, Figure 1 depicts the proposed simulation model.
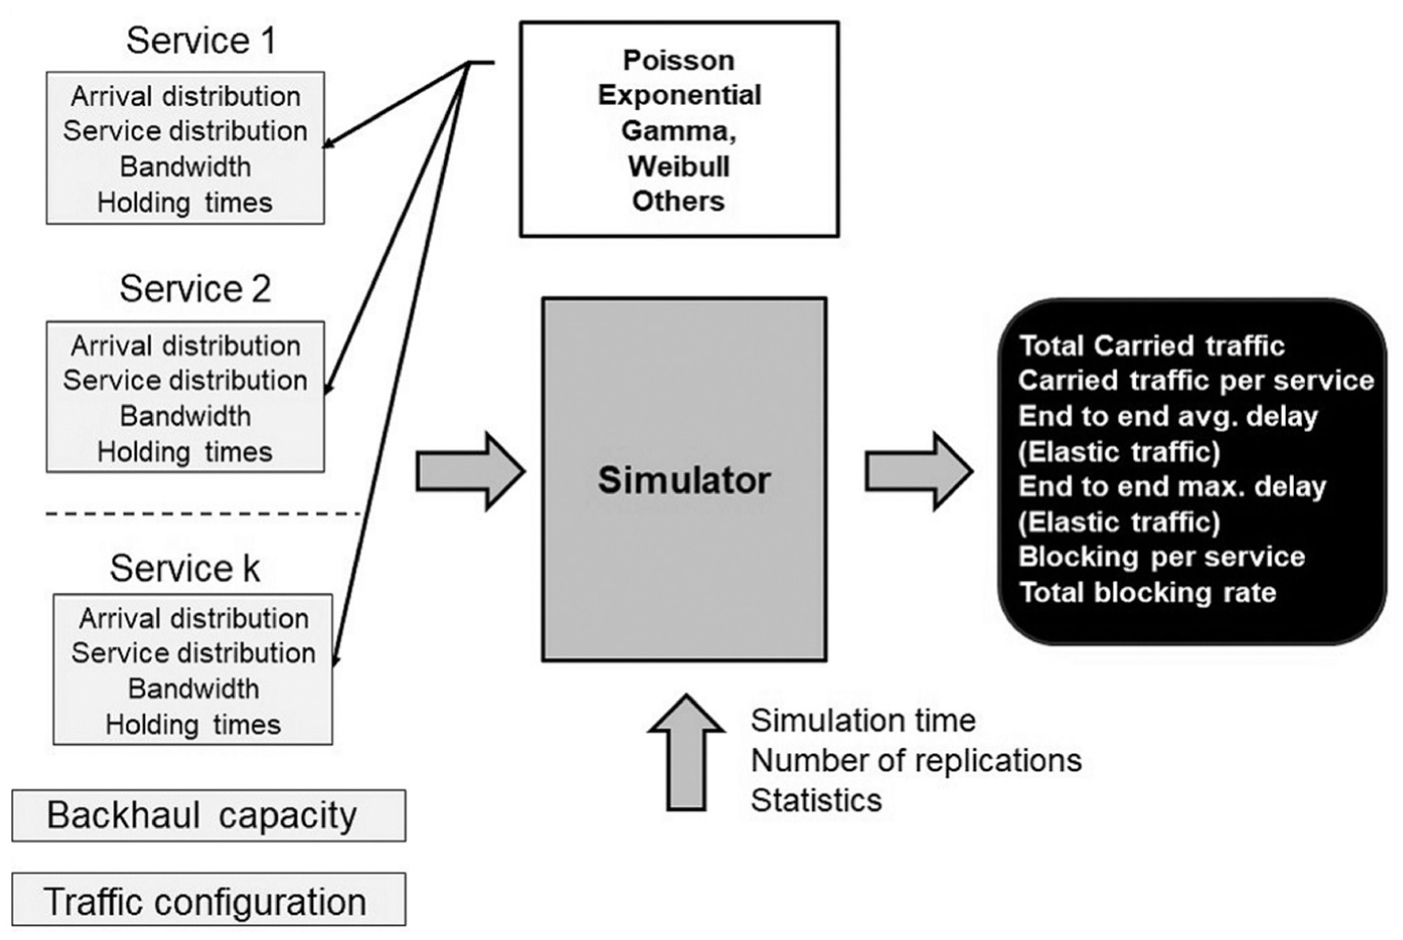
Simulation model.
The simulation was implemented in ARENA®, for each study case, using ARENA® built-in statistical tools. Specifically, ARENA® supports both counters for numerical and percentage-based statistics, as well as tallies for event-duration statistics. For each output, the results of individual replications are reported alongside with the corresponding average, standard deviation, minimum and maximum values. This information allows to compute the estimation errors and confidence intervals for all reported metrics.
All experiments were run with six replications in a horizon time of 100 h and using a 95% confidence level.
5.3. Detailed simulation model
The general assumptions adopted are:4,5
Service requests from users (or the customer arrival process) follow a discrete pdf among those mentioned before.
Customers can address k streaming service types. For each type
Customers can address elastic services, with
The number of total shared resources is c bandwidth units (c channels, for short).
Figure 2 depicts the adopted in-depth simulation model.
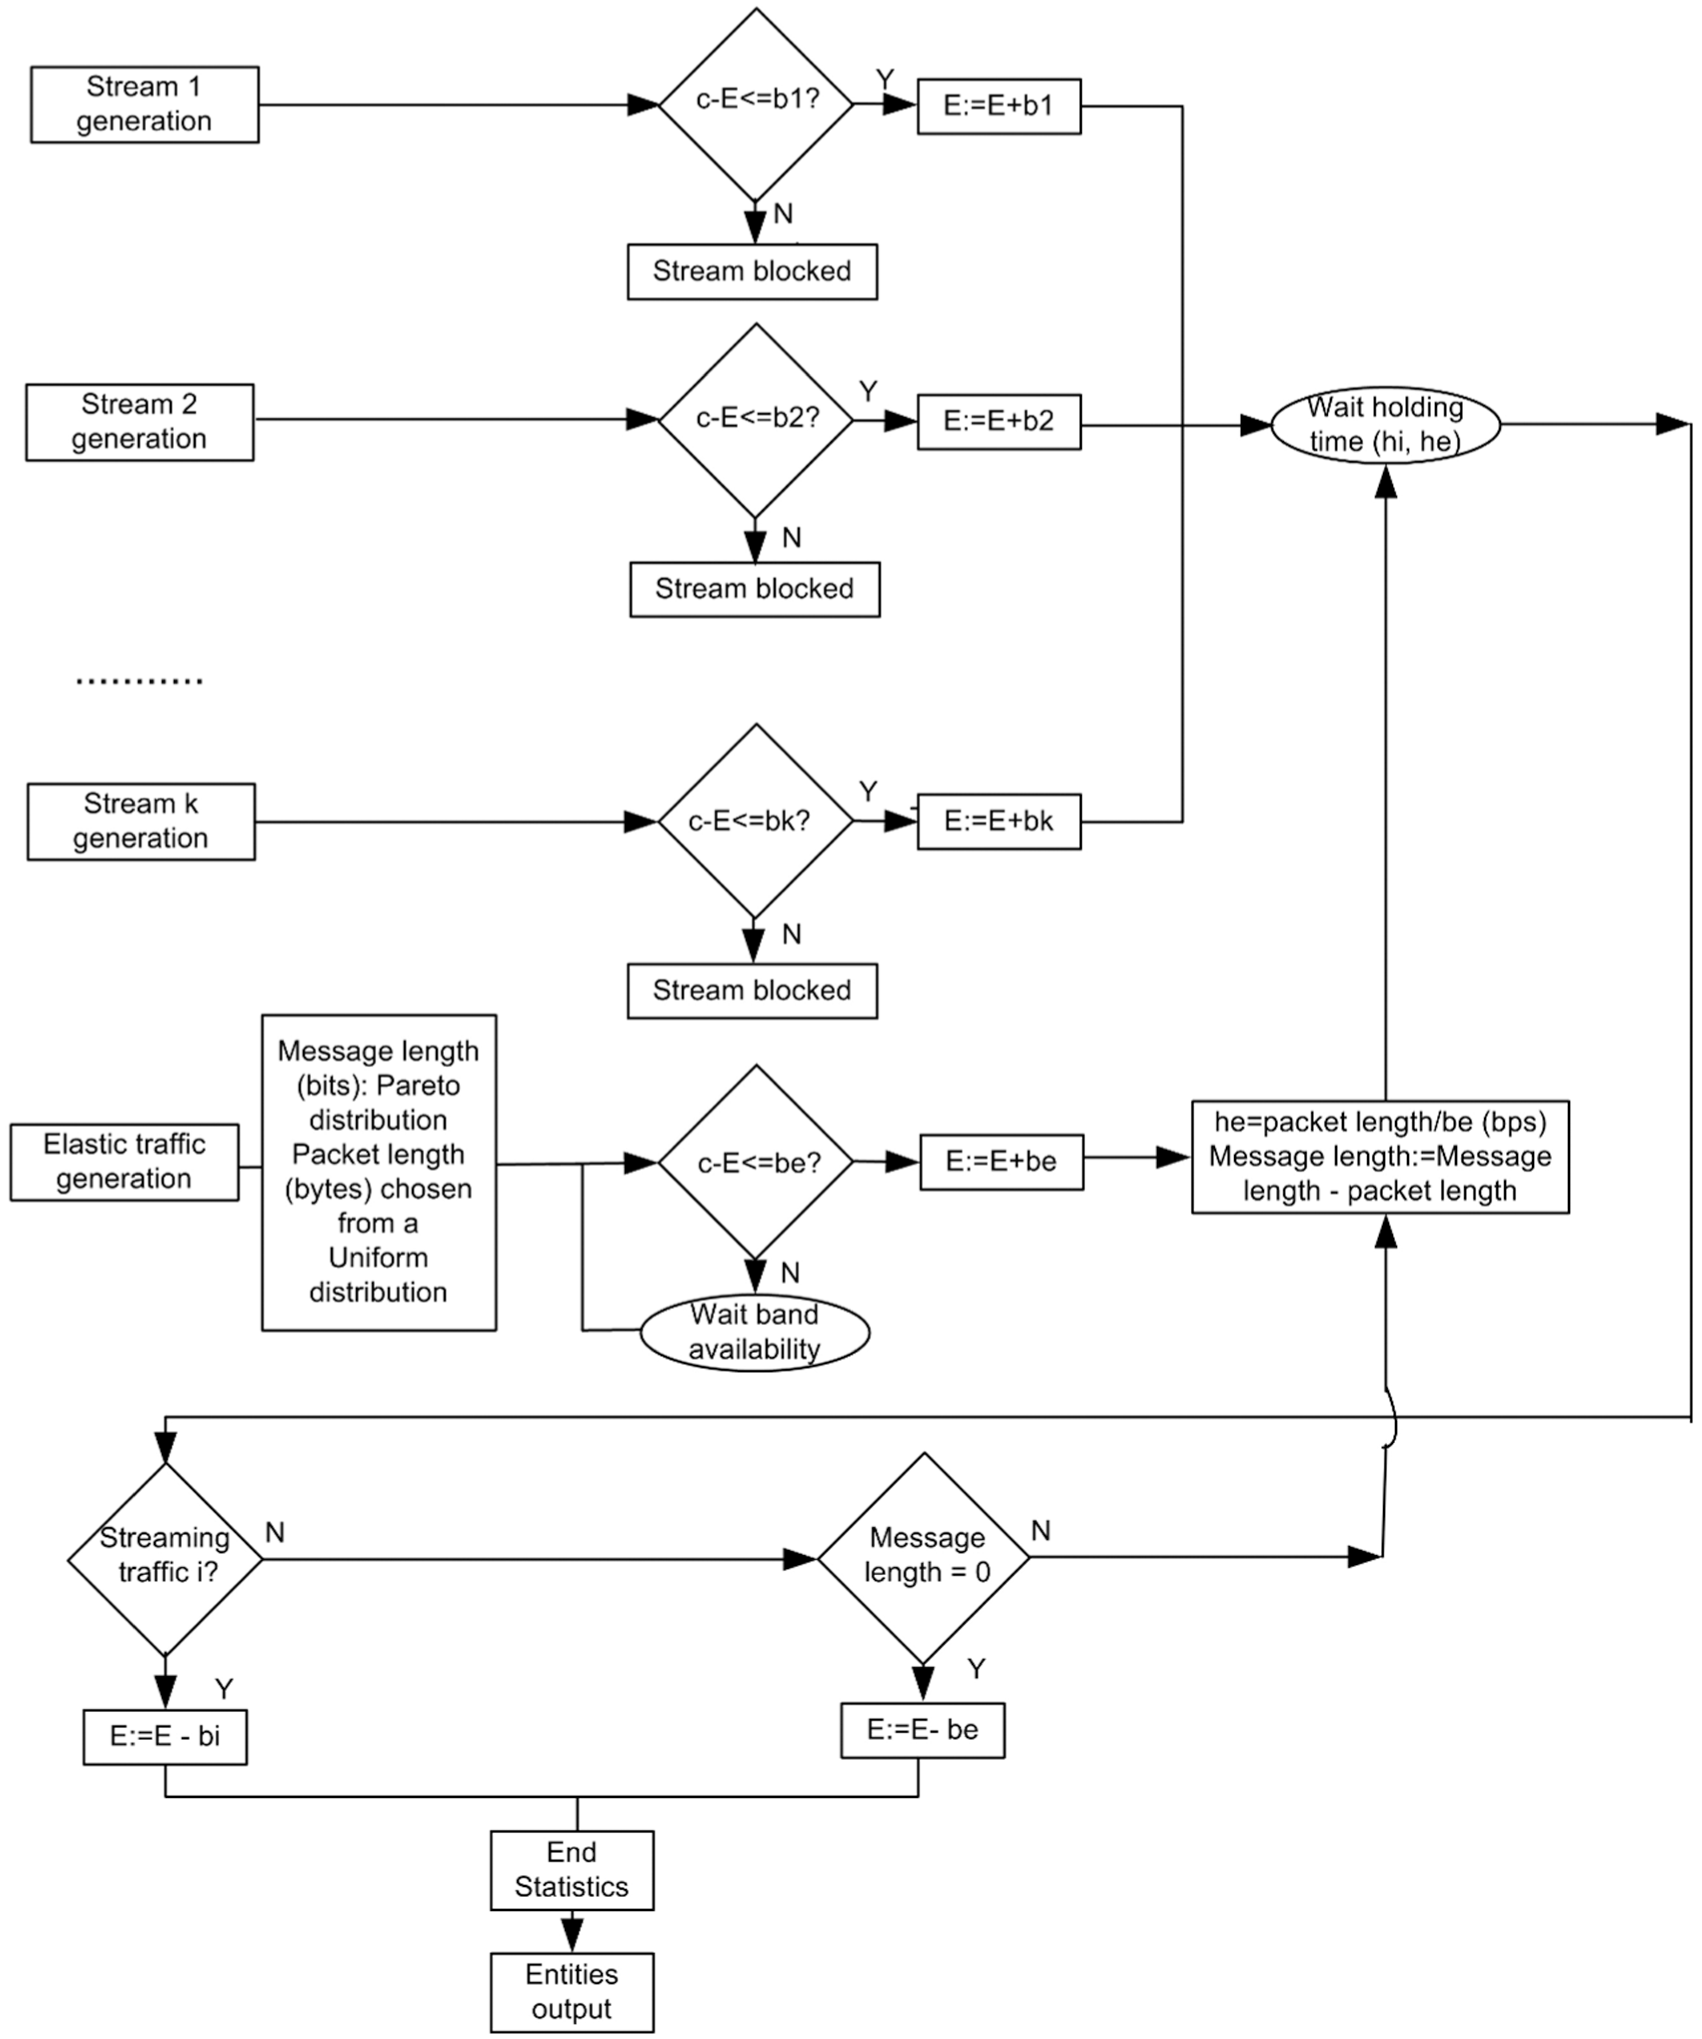
Elastic and streaming traffic modeling.
In Figure 2:
E is a temporary (dummy) variable that represents the current backhaul capacity and,
c is a parameter indicating the maximum capacity of the backhaul.
The system is composed of a single elastic and k independent streaming traffic generators. The number of channels designated for elastic traffic is set as a configurable system parameter. However, for the sake of conciseness, and without loss of generality, the value
Traffic arrivals are generated according to their respective stochastic arrival processes. Each arrival triggers the creation of a simulation entity and the scheduling of the corresponding events within the discrete-event simulation framework. From the instant an event is scheduled, statistical counters are updated to ensure accurate performance assessment.
For each streaming arrival event, a resource-allocation procedure is executed to verify the availability of sufficient backhaul capacity. If the required capacity is unavailable, the request is blocked, and the entity is immediately terminated. Otherwise, the stream is admitted, and the corresponding channels are seized for a holding time sampled from the specified service-time distribution. A departure event is scheduled accordingly. Upon expiration of the holding time, the entity releases the allocated resources and is removed from the system.
For elastic traffic, the arrival event generates a message entity whose size is sampled from a Pareto distribution, while individual packet sizes are drawn from a uniform distribution. Channel access is regulated through a semaphore-based synchronization mechanism, preventing message loss due to simultaneous resource contention. In the current implementation, the model processes a single elastic message at a time. When a channel becomes available, all the packets belonging to the admitted message are transmitted sequentially. Each packet seizes the channel for its transmission time, after which a completion event is scheduled. The channel remains allocated to the message until all associated packets have been successfully transmitted, at which point the resource is released, and the entity lifecycle is completed.
At the end of each simulation run, all statistical estimators are consolidated, and any remaining active entities are properly terminated to ensure consistent replication management.
6. Simulation validation
Model validation is concerned with demonstrating that model implementation reflects, with the necessary accuracy, actual applications.17,18
Validation is performed by taking a basic model with trivially verifiable points and adding the complexities of the final model in a modular way. In the first step, the simplified analytical and/or simulation models are validated by comparison with real situations or known analytical solutions. Then, new functionalities are added, step by step, and as knowledge of the problem increases, the solution is refined. A careful procedure of validation should be conducted to support results scrutinization and to assure model confidence. 17
In this paper, we use Kendall’s notation for simplicity to describe the Queue or Loss Models, where (M) denotes the Poisson/Exponential distribution, (GΓ) the Gamma probability distribution and (W) the Weibull distribution. Therefore, the basic characteristics of our models can be expressed as M/M/s, M/GΓ/s or others, where s is the number of channels.
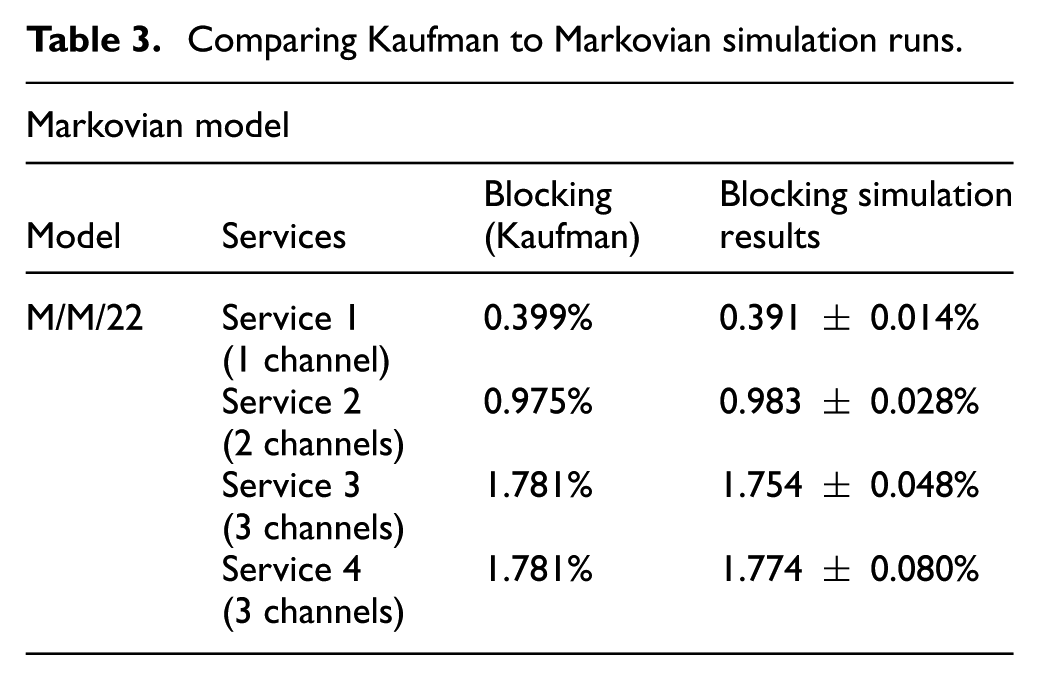
For blocking models, we started by running experiments like Markovian Processes (Poisson arrivals) and using Kaufman’s formula to check consistency between experiments results and its theoretical analysis. Next step was to run non-Markovian models. At each stage or new model, and whenever feasible, simple verification tests take place, comparing results to aimed parameters.
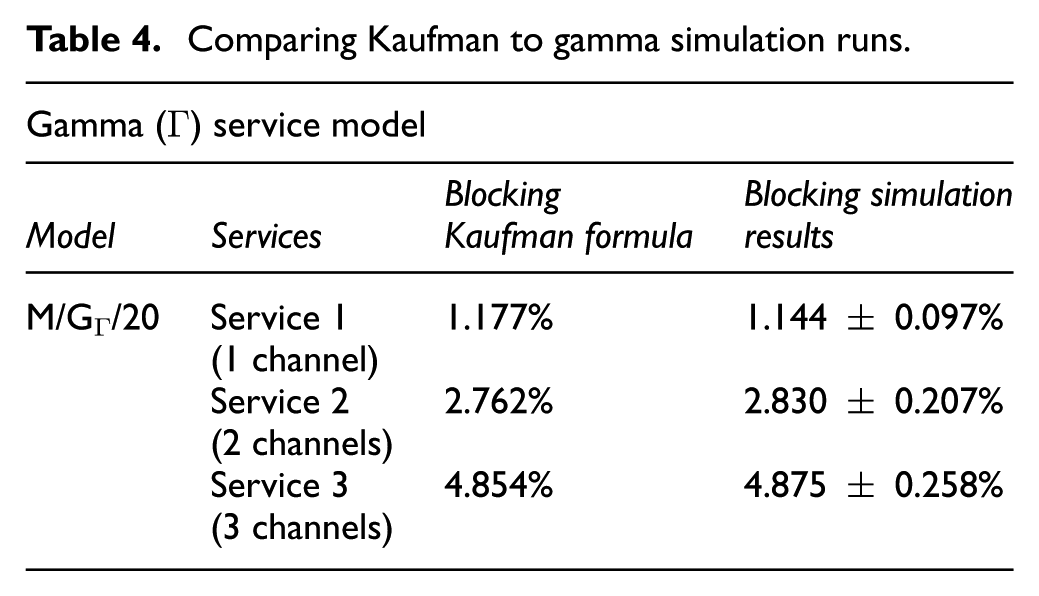
To illustrate some details about how we tackle the validation procedure, Table 3 presents a comparison for the case of Markovian models, contrasting analytical results obtained via Kaufman’s formula with data derived from discrete-event simulations of the corresponding system. A similar level of agreement was observed in Table 4, which reports results for a Markovian model with Gamma-distributed holding times (M/GΓ/20).
Comparing Kaufman to Markovian simulation runs.
Comparing Kaufman to gamma simulation runs.
Finally, Table 5 is included to further demonstrate the consistency and robustness of the obtained results through a particularly illustrative scenario. It is well established that, under a Poisson arrival process, the service-time distribution does not affect the resulting blocking probability, owing to the Poisson arrivals. Conversely, when the arrival process deviates from the Poisson assumption, the blocking behavior depends on the variability of interarrival times. Specifically, if the coefficient of variation (cv)—defined as the ratio of the standard deviation to the mean—is less than one, the observed blocking probability is lower than that obtained under Poisson arrivals. In contrast, when the coefficient of variation exceeds one, particularly in the presence of heavy-tailed distributions, higher blocking probabilities are observed relative to the Poisson case.
Comparing different coefficients of variation.
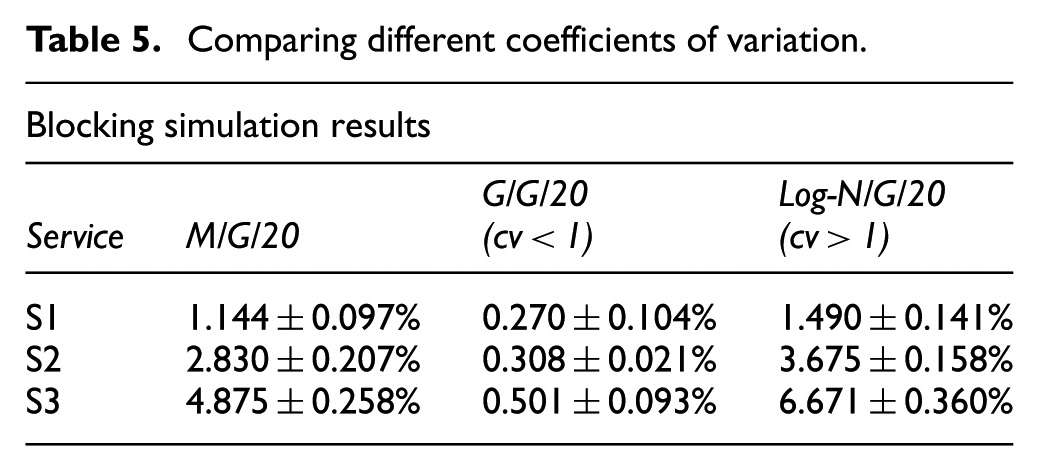
These theoretical anticipation were confirmed by the simulation results, as illustrated in Table 3. In this context, GΓ denotes the Gamma distribution, Log-N refers to the Lognormal distribution, and Si designates a service requiring i channel units of bandwidth.
7. Results
The choice of distributions for the arrival and service time processes depends on several factors, including the availability of locally collected empirical data, the scope of the simulation, the level of abstraction considered (data link, packet or session), and additional planning assumptions. Despite the references provided, this matter remains an open research issue in literature.
Given the wide range of probability distributions available in the literature, this study does not advocate the use of specific distributions for particular processes. Instead, it emphasizes that the most appropriate distribution should be selected on the basis of empirical evidence within each individual case study.
Therefore, the analysis was not restricted to the M/G/s model; rather, a broader set of modeling approaches was considered, as described so far.
Finally, regarding the limitations of the research, we point out:
The scope of the simulations is restricted to a single cell; consequently, overflow and handoff traffic were not considered in the simulated experiments.
The backhaul capacity for a wireless cell was considered fixed.
No artificial intelligence or machine learning (ML) methods were used.
7.1. Streaming traffic
Figure 3 depict the carried traffic and the blocking per service, as well as total values, using a W/GΓ/s Model and microcells traffic parameters. We notice that the blocking probabilities grow to about 92% with traffic load increase.
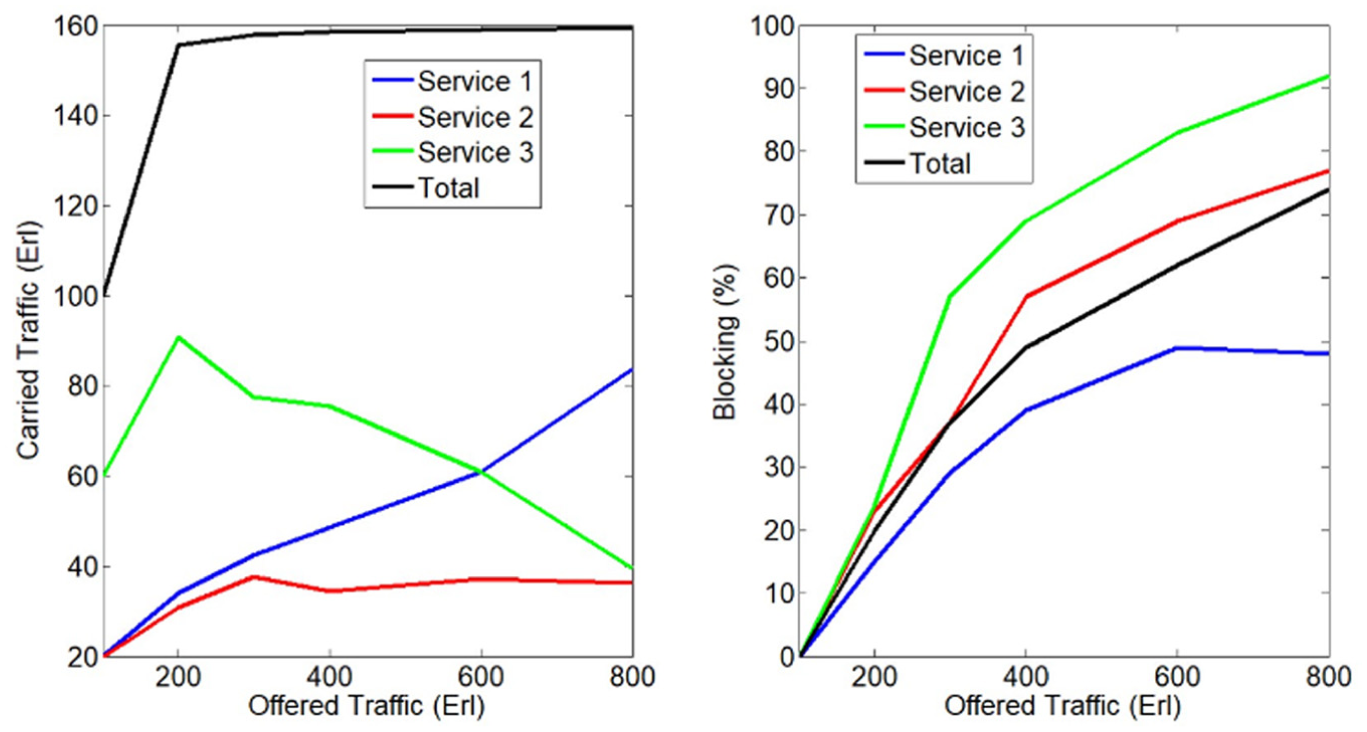
W/GΓ/160 model–traffic blocking in microcells.
A sharper increase in blocking probability is observed for services with broader bandwidth than for services with narrower ones. Service 1 (narrower bandwidth) carried traffic increases monotonically in the target interval, but service 2 and 3 (wider bandwidth) carried traffic decreases after a maximum value, regardless of increments in the offered traffic. In fact, as the offered load increases further, the traffic carried by services with broader bandwidth shows an inflection point. Similar behavior was observed with Markovian, GΓ/W, GΓ/GΓ and W/W Models.
Table 6 depicts typical simulation parameters used to obtain Figure 3.
Simulation parameters in Figure 3.
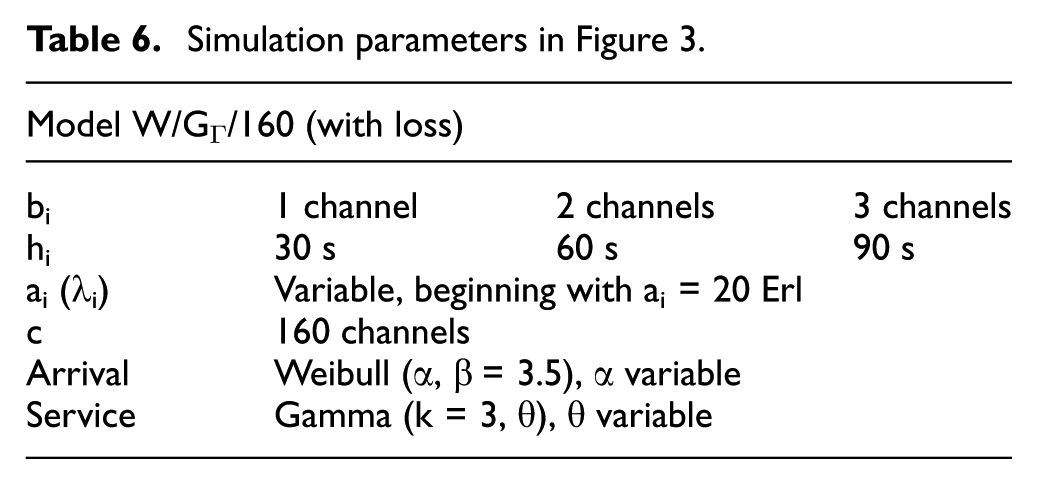
This pattern has been confirmed for extensive other cases, for different holding times, arrival and service probability distributions, service traffic assignments and service bandwidths.
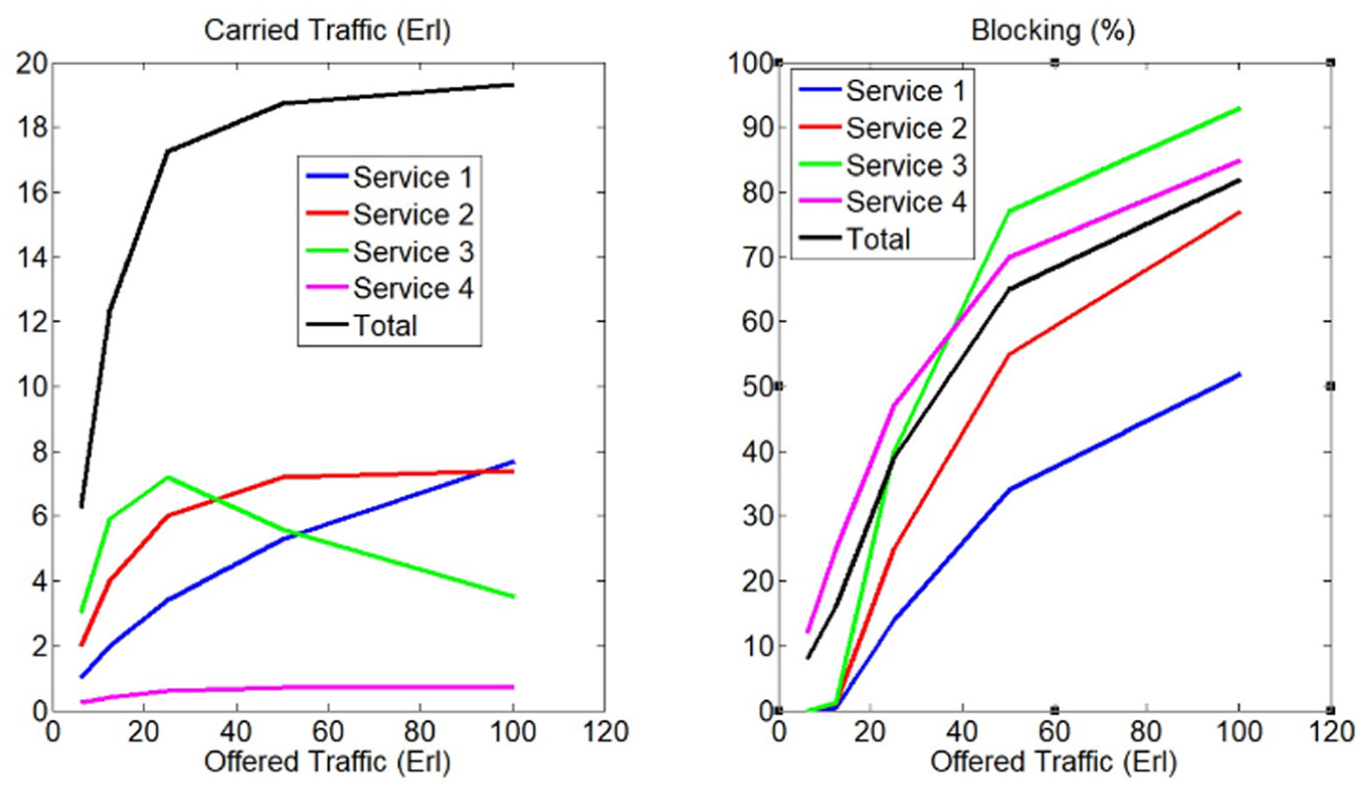
Another interesting case is depicted in Figure 4 that shows the effect of offering services, with significant bandwidth disproportion (e.g., corporate traffic or video streaming).
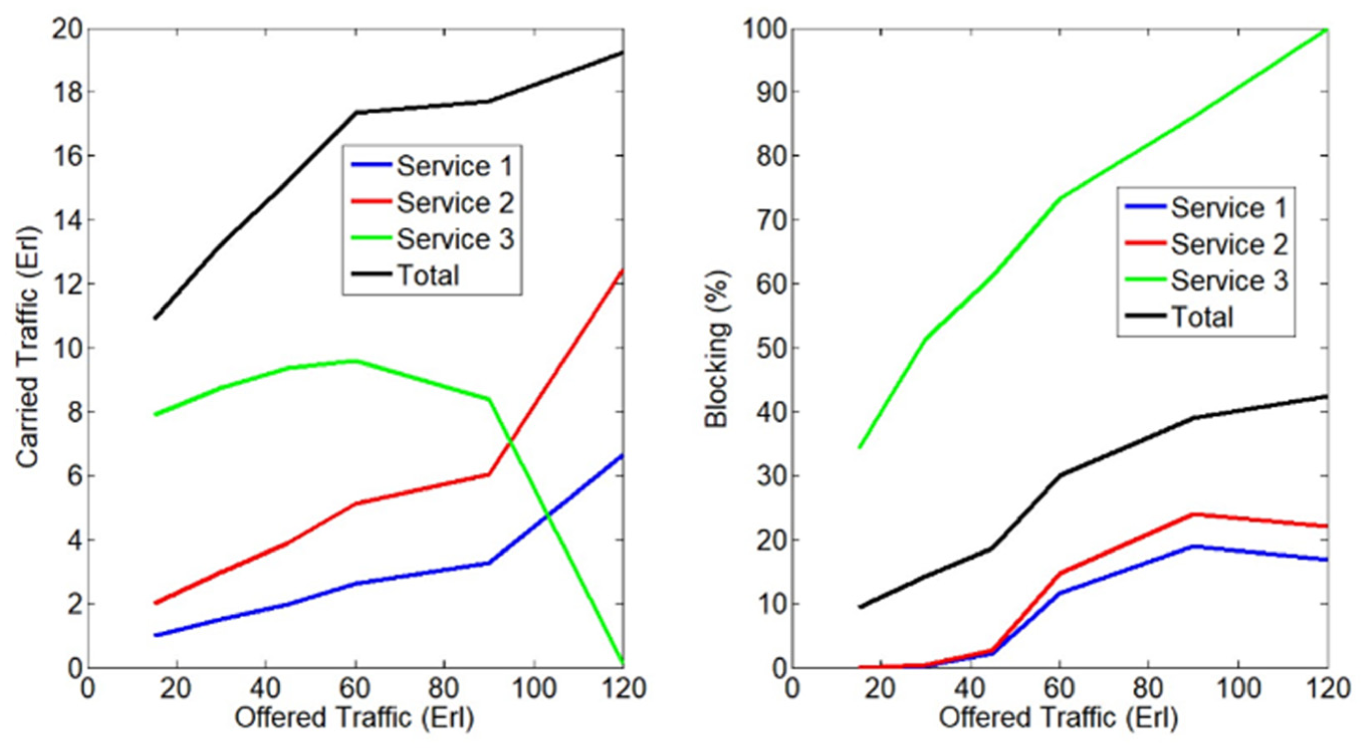
W/GΓ/22 model—effect of bandwidth disproportion.
It is noticed that backhaul’s efficiency is severely jeopardized in this case. Even at low total traffic level, for example, 17.5 Erl, Service 3 presents a high blocking rate (near 80%), later being completely blocked.
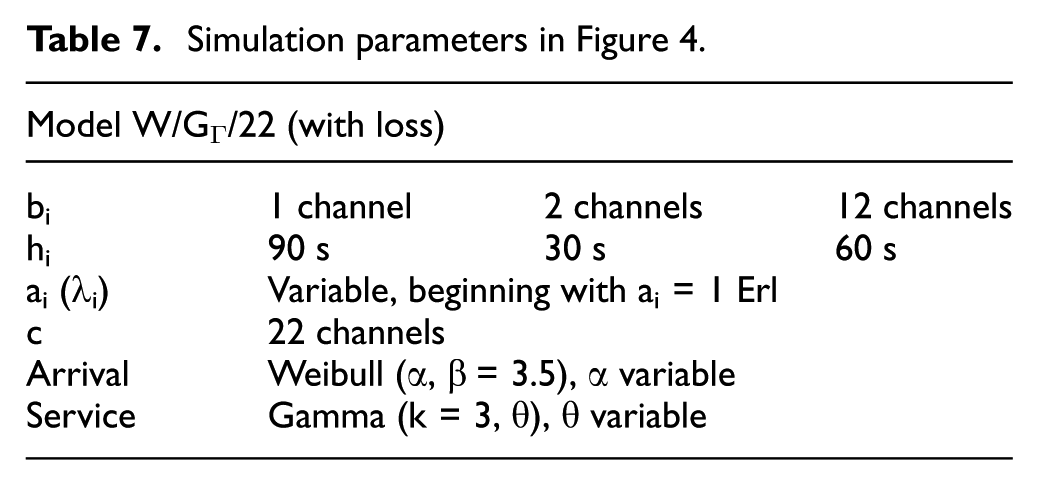
Table 7 depicts typical simulation parameters used to obtain Figure 4.
Simulation parameters in Figure 4.
7.2. Elastic traffic
Streaming traffic constitutes a great challenge for 5G, intended to reach a similar level of performance of the existing services for wireline. However, Internet data applications, despite a relevant and well-known field, include completely different forms of traffic due to its delay flexibility. For this reason, we try to combine both types of traffic to evaluate their impact over the backhaul.
An algorithm (see Figure 2) that prioritizes streaming traffic was used, only assigning a channel for elastic traffic whenever channels are available, otherwise storing elastic traffic in a buffer, as a compromise solution to render the elastic traffic have a minimum influence over the streaming traffic.
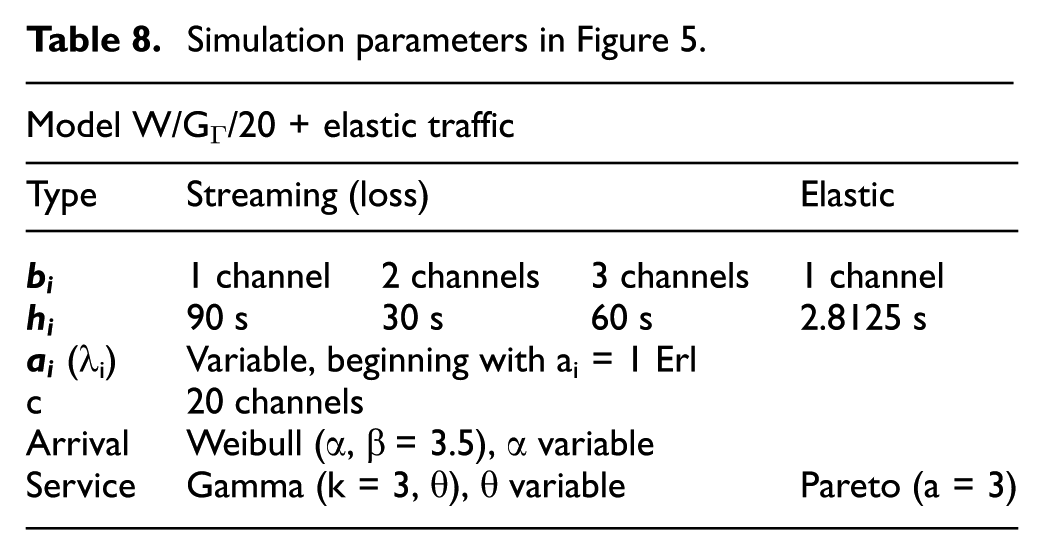
Figure 5 displays an overview of the results after simulating the W/GΓ/s picocell, adding an elastic traffic type of service, like a file transfer. Selected streaming services bandwidth are tentative or exploratory, and Table 8 depicts typical simulation parameters used to obtain Figure 5.
W/GΓ/20 model—traffic blocking in picocells when an elastic service is added.
Simulation parameters in Figure 5.
Streaming services behave as reported previously: services requiring a narrower bandwidth have better efficiency, when traffic grows evenly.
However, as traffic increases, a relative deterioration in performance is observed, since traffic is lower, and the loss is greater.
8. Dimensioning methodology and example
8.1. Overview
This section presents an illustrative application of the proposed framework to the dimensioning of a wireless network. The objective is to demonstrate how the developed approach can support practical design decisions under realistic service quality requirements. The parameters adopted herein are intended to represent a plausible scenario rather than to provide a complete and exhaustive network design. In practice, a comprehensive dimensioning process would require additional planning stages, including detailed radio planning, interference analysis, and capacity validation, which is out of scope of the present work. Furthermore, accurate characterization of user behavior and traffic patterns constitute a fundamental prerequisite for any target network design.
In advanced wireless systems, user traffic profiles typically comprise a combination of streaming and elastic services within the same session. This behavior differs substantially from traditional circuit-switched voice traffic, thereby justifying the emphasis on non-Markovian traffic models in the present study. For effective network dimensioning, a thorough empirical assessment of the local traffic profile is strongly recommended. Here, we assume that traffic profile requirements are those that have been exercised so far.
8.2. Network assumptions
The following premises are considered for the target wireless deployment:
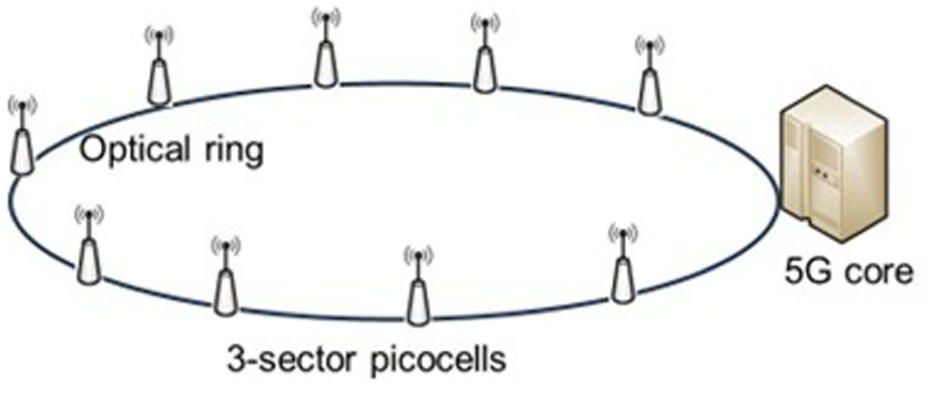
Coverage studies recommend the deployment of 53-sector radio base stations configured as picocells, interconnected through a fiber-optic ring to a 5G Core network, operating in band n78 (3.3–3.8 GHz), as illustrated in Figure 6.
The user profile corresponds to that presented in Table 2, and the traffic profile per picocell sector follows a W/GT/20 model, as depicted in Figure 5.
User-terminated traffic represents 20% of the user-originated load.
Handoff traffic accounts for 80% of the user-originated load.
Based on the specifications defined in ITU-R 19 and 3rd Generation Partnership Project (3GPP),20,21 the maximum achievable throughput per sector can be derived. Under the considered configuration, the resulting maximum sector throughput is 2.42 Gbps, as shown in the following sequence:
5G network example.
Let:
M denotes the maximum supported data rate.
The average OFDM symbol duration is therefore given by the following formula:
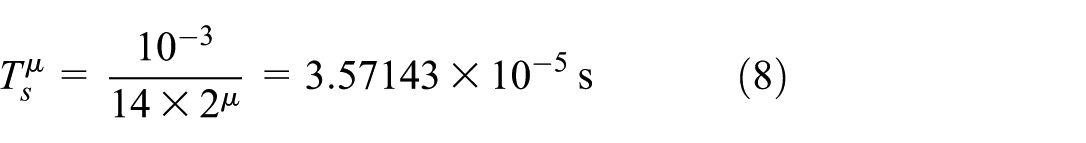
corresponding to a slot duration of 0.5 ms comprising 14 Orthogonal Frequency-Division Multiplexing (OFDM) symbols.
The maximum Physical Resource Block (PRB) allocation is
The overhead factors (OH) are assumed as 0.14 for downlink and 0.08 for uplink. 21
The maximum throughput per link direction is then expressed by the following formula:
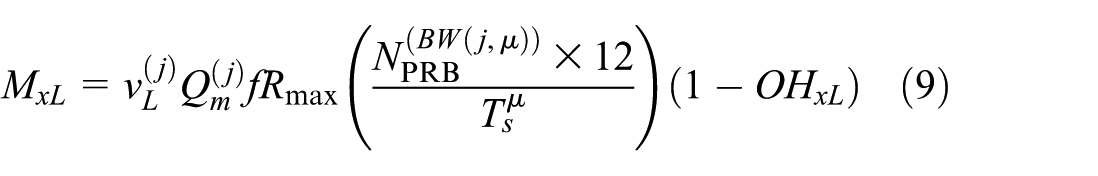
and the aggregate maximum sector throughput is as follows:

Therefore, a maximum throughput of 7.26 Gbps per radio base station can be achieved.
Considering Figure 5, we assume a maximum total carried traffic of 15 Erl per sector, chosen as a safe point before Service 3 carried traffic inflects. It indicates a total blocking of 28%, according to Figure 5. A similar reasoning for a Markovian Model (M/M/20), with the same parameters, would lead to 13 Erl per sector and a total blocking of 40%, therefore a worst-case scenario. Other cases were run, and as expected, the Markovian model always represents the worst-case scenario.
Table 9 sums up the main figures per cell, compared to a traditional Markovian Model for illustration purposes.
Cell dimensioning.
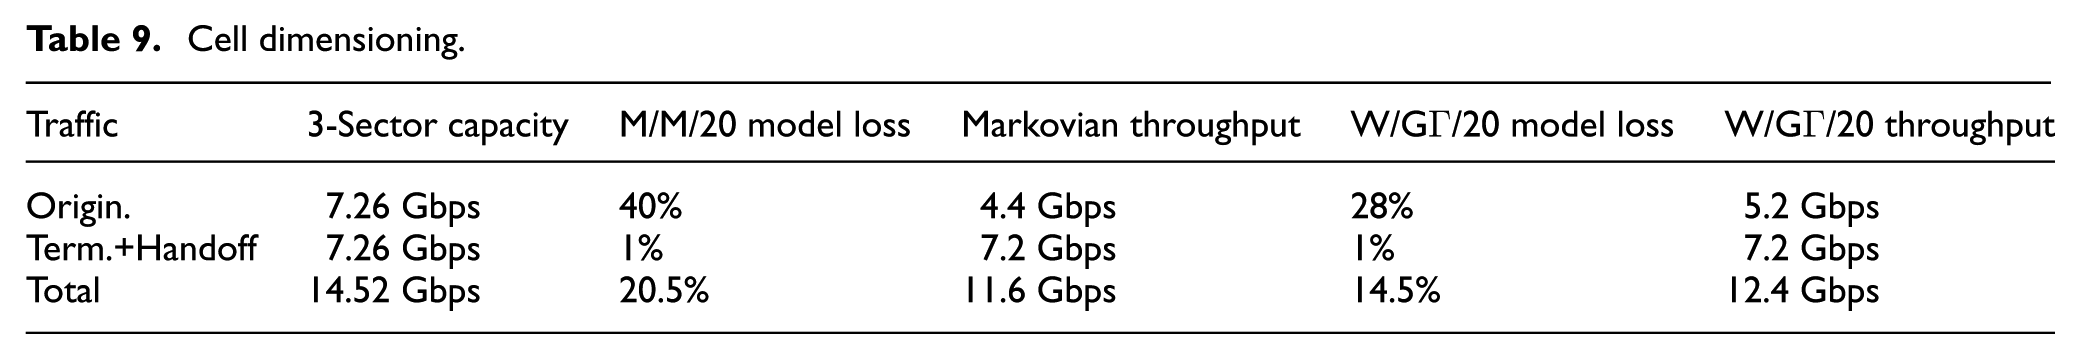
Table 9 shows that, even for a single cell, an alternative model, like the W/GΓ/20 one, suggests a more optimized dimensioning. Notice that an improvement in efficiency has been achieved by selecting the most suitable model, encouraging prior data collection and analysis.
Finally, Table 10 presents the main system design parameters, considering the 50 radio base stations.
Overall design parameters.
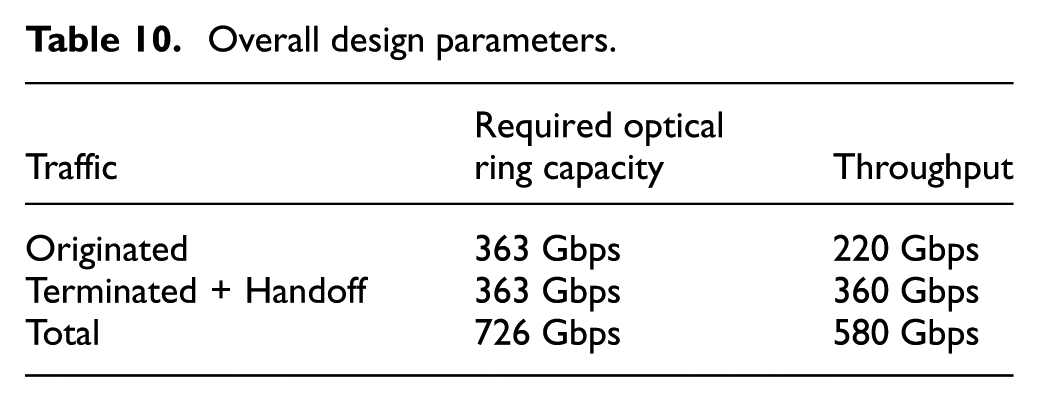
From an operational perspective, those figures, especially the designed thresholds, should be monitored and managed to attain the aimed performance.
This example illustrates how discrete-event simulation combined with realistic traffic assumptions can be integrated into a structured dimensioning methodology to support network planning decisions.
9. Conclusion
In this study, we distilled the modeling of streaming and elastic traffic with the objective of identifying traffic control limits in wireless networks. Emphasis is placed on the coexistence of streaming and elastic flows sharing the same communication medium, namely the backhaul segment.
The primary focus of the analysis is the load that the backhaul infrastructure must sustain in order to satisfy aggregate traffic demand. Nevertheless, the proposed framework is sufficiently general to assess other potential bottlenecks, such as application gateways or cloud access gateways. From the analytical and simulation results, a consistent set of conclusions was derived, enabling the resolution of the previously posed questions.
In the present work, streaming traffic is modeled with general arrival distributions, while elastic traffic is characterized by a Weibull arrival process. The intrinsic variability of TCP-driven traffic is captured by modeling message sizes according to a Pareto distribution and by randomly selecting packet sizes. Control mechanisms are incorporated for both traffic classes. For streaming services, adjustment is achieved by limiting the number of available circuits, thereby directly influencing blocking behavior. For elastic traffic, a semaphore-like admission control mechanism is implemented to restrict the number of simultaneously active flows, preventing excessive congestion. This approach can be extended to multiple coordinated control entities, allowing finer regulation of elastic traffic and mitigating excessive queuing delays.
The main findings from the simulation experiments can be summarized as follows:
Under nominal traffic conditions for streaming services, defined, for example, by blocking probabilities below 5%, services requiring larger bandwidth allocations consume a proportionally greater share of the resource pool when competing for capacity.
As traffic intensity increases and the system approaches overload, services with lower bandwidth requirements tend to dominate resource occupancy and account for the majority of admitted connections.
For elastic traffic, analogous tendencies are observed. However, in the absence of adequate TCP admission control, elastic flows may significantly constrain streaming services due to their adaptive yet persistent nature. The introduction of admission-control mechanisms enables balanced operating points, where streaming and elastic flows can be jointly regulated according to predefined performance objectives, such as blocking probability for streaming traffic and latency for elastic traffic.
The proposed model and associated simulation tool can support network dimensioning tasks, either by providing a macroscopic assessment of traffic behavior across the network or by analyzing specific bottlenecks in isolation. Continuous traffic monitoring and periodic reassessment of traffic assumptions are strongly recommended to ensure alignment between observed demand and available network resources.
As a suggestion for future studies, we intend to introduce the flexibility of providing scalable resources in the backhaul, aiming to adapt the load to the traffic profile and configuration of the RAN, since 5G networks allow this dynamicity with the software-defined networking (SDN) functionality, to increase the operational efficiency of the network. In this case, ML is known to be a universal trend across all walks of engineering and all areas and is a functionality worth including in future work of the present investigation. 22 The SDN architecture should include a centralized controller with access to real-time network information. Simulation data should be made available to ML algorithms, enabling them to dynamically adjust traffic routing and/or modify parameters that were previously estimated.
The interaction between elastic and streaming traffic requires further investigation, particularly to determine whether and to what extent competing elastic traffic may compromise the Markovian properties of service requests generated by a large population of users.
Footnotes
Funding
The authors disclosed receipt of the following financial support for the research, authorship, and/or publication of this article: This work was supported by the Coordenação de Aperfeiçoamento de Pessoal de Nível Superior-Brasil (CAPES; grant nº 001).
Declaration of conflicting interests
The authors declared no potential conflicts of interest with respect to the research, authorship, and/or publication of this article.